source characteristics of oxygenated volatile organic...
TRANSCRIPT

Source characteristics of oxygenated volatile organic compounds and
hydrogen cyanide
Changsub Shim,1 Yuhang Wang,1 Hanwant B. Singh,2 Donald R. Blake,3
and Alex B. Guenther4
Received 22 May 2006; revised 12 January 2007; accepted 2 February 2007; published 18 May 2007.
[1] Airborne trace gas measurements from Transport and Chemical Evolution overthe Pacific (TRACE-P), Pacific Exploratory Mission (PEM)-Tropics B, andIntercontinental Chemical Transport Experiment-North America (INTEX-NA)experiments are analyzed to examine the major source factors contributing to the observedvariabilities of oxygenated volatile organic compounds and cyanides. The positive matrixfactorization method is applied to coincident measurements of 11 chemicals includingCH3OH, CH3COCH3, CH3CHO, C2H2, C2H6, i-C5H12, CO, CH3Cl, and CHBr3.Measurements of HCN and CH3CN are available for TRACE-P and INTEX-NA. Weidentify major source contributions from the terrestrial biosphere, biomass burning,industry/urban regions, and oceans. Spatial and back trajectory characteristics of thesefactors are examined. On the basis of TRACE-P and PEM-Tropics B data, we find a factorthat explains 80–88% of the CH3OH variability, 20–40% of CH3COCH3, 7–35% ofCH3CHO, and 41% of HCN, most likely representing the emissions from terrestrialbiosphere. Our analysis suggested that biogenic emissions of HCN may be significant.Cyanogenesis in plants is likely a major emission process for HCN, which was not fullyaccounted for previously. Larger contributions than previous global estimations toCH3COCH3 and CH3CHO by biomass burning and industry/urban sources likely reflectsignificant secondary production from volatile organic compound oxidation. No evidencewas found for large emissions of CH3COCH3 from the ocean. The oceanic CH3CHOcontribution implies large regional variations.
Citation: Shim, C., Y. Wang, H. B. Singh, D. R. Blake, and A. B. Guenther (2007), Source characteristics of oxygenated volatile
organic compounds and hydrogen cyanide, J. Geophys. Res., 112, D10305, doi:10.1029/2006JD007543.
1. Introduction
[2] Oxygenated volatile organic compounds (OVOCs)are a critical component of tropospheric photochemistry[e.g., Singh et al., 2004]. Previous studies found significantemissions of OVOCs from the biosphere, which affect notonly trace gas composition and chemistry but also aerosolsand subsequently the radiative budget of the atmosphere[e.g., Fuentes et al., 2000; Guenther et al., 2000; Fall,2003]. There have been many efforts to estimate the globalbudgets of OVOCs [Guenther et al., 1995; Galbally andKirstine, 2002; Heikes et al., 2002; Jacob et al., 2002; Singhet al., 2004]. Despite these efforts, there are still largeuncertainties and many unknowns.[3] Hydrogen cyanide (HCN) is an often used indicator
for biomass burning [e.g., Rinsland et al., 1998]. Ocean
uptake is considered to be the main sink, leading to alifetime of a few months [Li et al., 2000]. Additionally,biogenic processes are known to produce HCN andCH3COCH3 simultaneously [Conn, 1991]. A specificmetabolic process is cyanogenesis in plants (for example,food crops, clovers, and eucalyptus leaves), which is partof plant defensive activity to fend off herbivores duringthe growing season [Fall, 2003; Gleadow and Woodrow,2000]. Global estimates of biogenic HCN production arehighly uncertain partly because this complicated bioche-mical process is not well understood over the diverseterrestrial ecosystems.[4] In order to identify and quantify major source contri-
butions to OVOCs and cyanides, we analyze aircraft mea-surements made during the Transport and Chemical Evolutionover the Pacific (TRACE-P), Pacific Exploratory Mission(PEM)-Tropics B, and Intercontinental Chemical TransportExperiment-North America (INTEX-NA) experiments[Raper et al., 2001; Singh et al., 2002; Jacob et al., 2003].We apply factor analysis using the positive matrix facto-rization (PMF) method to analyze these measurements. Weshow the characteristics of each source factor and calcu-late their contributions to OVOC and cyanide variability.
JOURNAL OF GEOPHYSICAL RESEARCH, VOL. 112, D10305, doi:10.1029/2006JD007543, 2007ClickHere
for
FullArticle
1Department of Earth and Atmospheric Sciences, Georgia Institute ofTechnology, Atlanta, Georgia, USA.
2NASA Ames Research Center, Moffett Field, California, USA.3Department of Chemistry, University of California, Irvine, California,
USA.4National Center for Atmospheric Research, Boulder, Colorado, USA.
Copyright 2007 by the American Geophysical Union.0148-0227/07/2006JD007543$09.00
D10305 1 of 12

Finally, we compare these results with the global budgetsestimated by previous studies.
2. Methodology
[5] We choose a suite of chemicals, including methanol(CH3OH), acetone (CH3COCH3), acetaldehyde (CH3CHO),ethyne (C2H2), ethane (C2H6), i-pentane (i-C5H12), carbonmonoxide (CO), methyl chloride (CH3Cl), and bromoform(CHBr3). The suite of chemicals is chosen to resolve thesources for OVOCs and cyanides; the limited tracer set isnot meant to resolve different industrial/urban emissionsources. Oxygenated organic chemicals and cyanides aremeasured by gas chromatography (GC) [Singh et al., 2004]or gas chromatography-mass spectroscopy (GC-MS) [Apelet al., 2003]. Ethyne (C2H2), ethane (C2H6), i-pentane(i-C5H12), and halocarbons are captured in canisters andanalyzed by GC-MS [Blake et al., 1996]. CO is measuredby differential absorption CO measurement (DACOM) withthree-tunable-diode-laser spectrometer [Novelli et al.,1994]. Methanol has large terrestrial biogenic emissions[Fall and Benson, 1996; Galbally and Kirstine, 2002].Major CH3COCH3 sources are from the terrestrial bio-sphere [Pouton, 1990; Jacob et al., 2002; Singh et al.,2004], the biomass burning [Jost et al., 2003], and theocean [Jacob et al., 2002]. CH3CHO has known biogenicand oceanic sources [Harry and Kimmerer, 1991; Singh etal., 2004] although the uncertainty in the budget is large.CH3COCH3 and CH3CHO also have significant photo-chemical sources [Jacob et al., 2002; Singh et al., 2004].All CH3CHO measurements used in this study were madeusing the same gas chromatographic instrument. Somecases of inconsistencies of CH3CHO measurements withconcurrent NOx and PAN measurements were previouslyfound [Singh et al., 2004], indicating the possibility that theCH3CHO measurements were seriously flawed. However,there is no clear evidence of instrument biases at this point[Northway et al., 2004]. C2H2 and CO are good tracers forcombustion [Talbot et al., 1997]. C2H6 is a good tracer forthe usage of fossil fuel [Staudt et al., 2001]. Isopentane isa unique tracer for gasoline evaporation and gasoline-powered motor vehicle emissions and hence the emissionsfrom urban regions in general [Rubin et al., 2006]. It is notincluded in the PEM-Tropics B analysis because its concen-trations in the remote tropical Pacific are generally below thedetection limit. CH3Cl is a tracer for biomass burning andbiogenic emissions [Yoshida et al., 2004 and referencestherein]. CHBr3 is a tracer for oceanic emissions [Singh etal., 2004]. In addition, HCN and CH3CN, available inTRACE-P and INTEX-NA, are included. They are generallyconsidered biomass-burning tracers [de Gouw et al., 2003; Liet al., 2003; Singh et al., 2003a].[6] To investigate the major sources contributing to the
variability of these tracers, we use the PMF method, whichhas been applied previously to identify source factors ofaerosols and trace gases [e.g., Paatero, 1997; Wang et al.,2003; Liu et al., 2005]. The factors are obtained fromexamining the covariance structure of the data sets [Paatero,1997]. In the analysis, we selected only coincident measure-ments of the chemicals. Missing data are not used in order toreduce the uncertainty in the analysis.
[7] The data matrix X of m measurements by n tracers canbe decomposed by PMF for p factors as
X ¼ GF þ E ð1Þ
or
xi j ¼Xpk¼1
gik fk j þ ei j
i ¼ 1; . . . ;m; j ¼ 1; . . . ; n; k ¼ 1; . . . ; p:
ð2Þ
where the m by p matrix G is the mass contribution (factorscore), the p by n matrix F is the gravimetric averagecontribution (factor loadings), and the m by n matrix E is theerror. We also use the explained variation (EV),
EVk j ¼Xmi¼1
gik fk j�� ��= Xm
i¼1
Xpk¼1
gik fk j�� ��þ ei j
�� �� !" #; ð3Þ
to define the relative contributions of each factor tochemical species since the mixing ratios of differentcompounds are not directly comparable. A large EV valueof a species in a factor indicates that this particular factorexplains a major fraction of the species; that is, the datapoints associated with this factor represent the air massesthat contribute largely to high concentrations of the speciesover its background level. The analysis approach is thesame as that used by Wang et al. [2003].[8] As commonly found in principal component and
factor analyses, the minimization of the error matrix doesnot lead to a unique decomposition of matrix X to matricesG and F. Matrix rotation is one way to explore theconstraints of the covariance structure. As in the work ofWang et al. [2003], the results presented here are notsensitive to rotation. For factor analysis, a key parameteris the choice of factor number. By evaluating the errormatrix E [Paatero, 1997; Paatero et al., 2002], a range offactor numbers is determined. We then inspect the PMFresults and determine the number of factors (with necessaryrotation) that leads to clear separation of tracer signals.Following this procedure, we determined six factors forTRACE-P and five factors for PEM-Tropics B and INTEX-NA, which provide most physically meaningful results.[9] In the work of Wang et al. [2003], PMF analysis was
used to identify air mass characteristics. That is the firstobjective of this work. The second objective is to investi-gate if the tracer signals in factor contributions can be usedto gauge our understanding of emissions of these tracegases. In this case, the nonnegativity in factor contributionscalculated using an alternating least squares method in PMF[Paatero, 1997] offers a major advantage over less advancedtechniques because source contributions by definition canonly be positive. In order to attempt the second objective,the inversion of sources using factor analysis makes theassumption that factor profiles represent a linear combina-tion of source contributions. The assumption is obviouslyfalse for chemicals with large secondary sources. It is alsofalse if the chemicals have short lifetimes in the tropo-
D10305 SHIM ET AL.: SOURCE CHARACTERISTICS OF OVOCS AND HCN
2 of 12
D10305

sphere. The influence of transport is difficult to quantify infactor analysis. We note here two specific problems arisingfrom transport. First, the anticorrelation driven by sourcelocation difference (for example, the often observed anti-correlation between a ozone transported from the strato-sphere and a CO emitted from the surface), which tends tomanifest in principal component analysis, does not pose aproblem in PMF analysis. Second, transport processes donot ‘‘create’’ air masses with clean tracer characteristics;mixing during transport reduces source signals instead. As aresult, the source characters cannot always be resolved byfactor analysis. In this work, we show that the tracersource characteristics can be resolved for TRACE-P andPEM-Tropics B. However, transport/mixing processesduring INTEX-NA result in mixed source characteristics.PMF cannot clearly resolve the source contributions inthat data set.[10] Despite all the assumptions, we will attempt to
compare source contributions inferred from PMF analysisof the two data sets with current source estimates. Theempirical approach is advantageous over three-dimensionalmodel studies when the source types, distributions, and
strengths for the chemicals of interests are not well understood.Furthermore, the PMF results are not affected by uncertain-ties in three-dimensional model chemistry and transport.Figure 1 shows the measurement regions during theTRACE-P, PEM-Tropics B, and INTEX-NA experiments.
3. Results
3.1. TRACE-P
[11] The TRACE-P experiment was conducted to inves-tigate the Asian outflow to the Pacific during springtime(March–April 2001) [Jacob et al., 2003]. There are386 coincident measurements of the species of interest overthe region of 15�–45�N and 114�E–124�W. Fifty percentof the selected data is distributed below 3 km. Figure 2shows the EV profiles of six factors, while Figure 3 showsthe absolute variability explained by each factor.[12] We label each factor based on its key chemical
signatures. The ‘‘terrestrial biogenic’’ factor is characterizedwith large signals in CH3OH (80%, 862 pptv) andCH3COCH3 (40%, 215 pptv). The terrestrial biosphere isthe largest known source for CH3OH [e.g., Heikes et al.,2002] and a substantial source for CH3COCH3 [e.g., Jacobet al., 2002]. HCN is thought to originate mainly frombiomass burning. However, the terrestrial biogenic factoralso explains a large fraction of the HCN variability (41%,72 pptv). Cyanogenesis is likely to be a major biogenicprocess emitting HCN and its by-product, CH3COCH3
(40%, 215 pptv), from a variety of plants [Pouton, 1990;Vetter, 2000; Fall, 2003]. The biogenic factor explains 30%of CH3CN (27 pptv). However, this fraction is not assignificant considering its large measurement uncertaintyof 35 pptv (Table 1). The biogenic CH3CHO variability(35%, 79 pptv) is much greater than its measurementuncertainty (Table 1), providing support for its biogenicproduction [Harry and Kimmerer, 1991; de Gouw et al., 1999;Schade and Goldstein., 2001; Karl et al., 2002]. We note thatthe tracer separation from combustion signatures such as COand CH3Cl and the follow-up analysis of the factor correlationwith the ratio of C2H6 and C3H8, both of which are emitted bybiomass burning, indicate that this factor is not affected bybiomass burning. Direct emissionmeasurements of HCN frommidlatitude forests in Southeast Asia are necessary to confirmour finding and to estimate the source magnitude.[13] The ‘‘biomass burning’’ factor is loaded with largest
signals of CH3CN (69%, 63 pptv) and CH3Cl (61%, 40pptv),two chemicals with large biomass-burning sources [e.g., Singhet al., 2003a; Yoshida et al., 2004]. HCN, known to have alarge biomass-burning source [e.g., Li et al., 2000], also has alarge signal (30%, 53 pptv). The signals of CH3COCH3 (19%,104 pptv) and CO (23%, 22 ppbv) are also significant in thisfactor.[14] Two key combustion tracers, C2H2 (82%, 392 pptv)
and CO (46%, 44 ppbv), appear in the ‘‘combustion’’ factor.Both gases are emitted from biomass burning and motorvehicle combustion. The similarity in the correlations ofthese two tracers results in one factor that represents amixture of two sources. The source ambiguity, however,does not affect the gases of interest in this study.[15] The industry and urban pollution contributions are
split into two factors. The first factor has significant signalsof CH3CHO (32%, 73 pptv), C2H2 (12%, 58 pptv), and
Figure 1. Location of aircraft measurements duringTRACE-P (top), PEM-Tropics B (middle), and INTEX-NA(bottom).
D10305 SHIM ET AL.: SOURCE CHARACTERISTICS OF OVOCS AND HCN
3 of 12
D10305
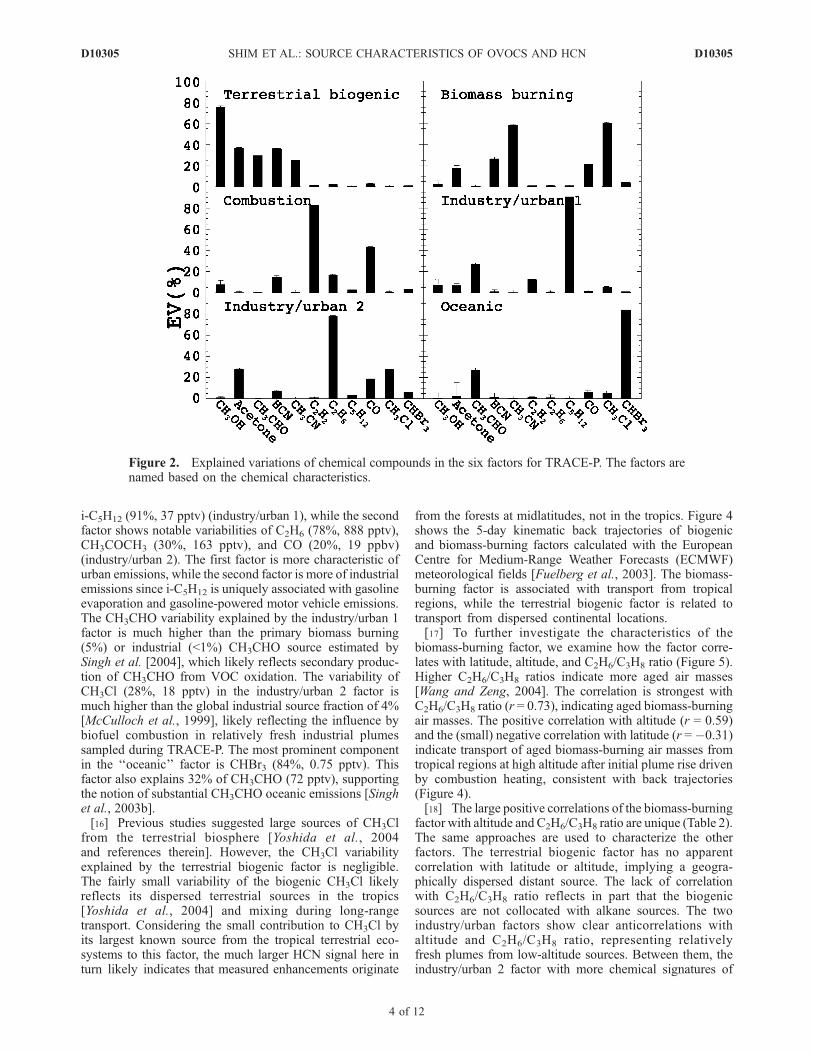
i-C5H12 (91%, 37 pptv) (industry/urban 1), while the secondfactor shows notable variabilities of C2H6 (78%, 888 pptv),CH3COCH3 (30%, 163 pptv), and CO (20%, 19 ppbv)(industry/urban 2). The first factor is more characteristic ofurban emissions, while the second factor is more of industrialemissions since i-C5H12 is uniquely associated with gasolineevaporation and gasoline-powered motor vehicle emissions.The CH3CHO variability explained by the industry/urban 1factor is much higher than the primary biomass burning(5%) or industrial (<1%) CH3CHO source estimated bySingh et al. [2004], which likely reflects secondary produc-tion of CH3CHO from VOC oxidation. The variability ofCH3Cl (28%, 18 pptv) in the industry/urban 2 factor ismuch higher than the global industrial source fraction of 4%[McCulloch et al., 1999], likely reflecting the influence bybiofuel combustion in relatively fresh industrial plumessampled during TRACE-P. The most prominent componentin the ‘‘oceanic’’ factor is CHBr3 (84%, 0.75 pptv). Thisfactor also explains 32% of CH3CHO (72 pptv), supportingthe notion of substantial CH3CHO oceanic emissions [Singhet al., 2003b].[16] Previous studies suggested large sources of CH3Cl
from the terrestrial biosphere [Yoshida et al., 2004and references therein]. However, the CH3Cl variabilityexplained by the terrestrial biogenic factor is negligible.The fairly small variability of the biogenic CH3Cl likelyreflects its dispersed terrestrial sources in the tropics[Yoshida et al., 2004] and mixing during long-rangetransport. Considering the small contribution to CH3Cl byits largest known source from the tropical terrestrial eco-systems to this factor, the much larger HCN signal here inturn likely indicates that measured enhancements originate
from the forests at midlatitudes, not in the tropics. Figure 4shows the 5-day kinematic back trajectories of biogenicand biomass-burning factors calculated with the EuropeanCentre for Medium-Range Weather Forecasts (ECMWF)meteorological fields [Fuelberg et al., 2003]. The biomass-burning factor is associated with transport from tropicalregions, while the terrestrial biogenic factor is related totransport from dispersed continental locations.[17] To further investigate the characteristics of the
biomass-burning factor, we examine how the factor corre-lates with latitude, altitude, and C2H6/C3H8 ratio (Figure 5).Higher C2H6/C3H8 ratios indicate more aged air masses[Wang and Zeng, 2004]. The correlation is strongest withC2H6/C3H8 ratio (r = 0.73), indicating aged biomass-burningair masses. The positive correlation with altitude (r = 0.59)and the (small) negative correlation with latitude (r =�0.31)indicate transport of aged biomass-burning air masses fromtropical regions at high altitude after initial plume rise drivenby combustion heating, consistent with back trajectories(Figure 4).[18] The large positive correlations of the biomass-burning
factor with altitude and C2H6/C3H8 ratio are unique (Table 2).The same approaches are used to characterize the otherfactors. The terrestrial biogenic factor has no apparentcorrelation with latitude or altitude, implying a geogra-phically dispersed distant source. The lack of correlationwith C2H6/C3H8 ratio reflects in part that the biogenicsources are not collocated with alkane sources. The twoindustry/urban factors show clear anticorrelations withaltitude and C2H6/C3H8 ratio, representing relativelyfresh plumes from low-altitude sources. Between them, theindustry/urban 2 factor with more chemical signatures of
Figure 2. Explained variations of chemical compounds in the six factors for TRACE-P. The factors arenamed based on the chemical characteristics.
D10305 SHIM ET AL.: SOURCE CHARACTERISTICS OF OVOCS AND HCN
4 of 12
D10305

industrial than urban emissions has stronger anticorrelationswith altitude and C2H6/C3H8 ratio. It also has clear latitudedependence. These characteristics are consistent with moreindustrial activities in the northeast of China and moredispersed urban distributions in the region. The oceanic
factor has anticorrelations with altitude and C2H6/C3H8 ratio,consistent with the characteristics of fresh surface emissions.The anticorrelation with C2H6/C3H8 ratio reflects in part apositive correlation of the hydrocarbon ratio with altitude.
Table 1. Relative and Average Absolute Measurement Uncertaintiesa
CH3OH CH3COCH3 CH3CHO HCN CH3CN C2H2 C2H6 C5H12 CO CH3Cl CHBr3
Relative Uncertainty (%) 10 10 10 �25 �25 1 1 1 7 2 5TRACE-Pb 110 90 30 50 35 5 15 2 7 12 0.03PEM-Tropics Bb 90 40 10 – – 3 3 – 4 12 0.03
aThe uncertainties are based on the reported accuracies and precisions of the measurements.bUnit is pptv except for CO (ppbv).
Figure 3. The variabilities in mixing ratio explained by each factor for TRACE-P. ‘‘Bio’’ denotesterrestrial biogenic; ‘‘BB’’ denotes biomass burning; ‘‘Comb’’ denotes combustion; and ‘‘Ind’’ denotesindustry/urban. The vertical bars show the uncertainties of the PMF analysis.
D10305 SHIM ET AL.: SOURCE CHARACTERISTICS OF OVOCS AND HCN
5 of 12
D10305

3.2. PEM-Tropics B
[19] The PEM-Tropics B campaign was conducted duringthe wet season over the tropical Pacific (March–April 1999)[Raper et al., 2001]. Some 581 coincident measurements ofeight chemicals over the region of 36�S–35�N and 107�W–162�E are analyzed. Sixty-three percent of the selected datais distributed above 5 km. We find no evident bias in thespatial distributions of the selected data set compared to theentire data set.[20] Five factors are resolved by PMF (section 2). Figure 6
shows the EV profiles, while Figure 7 shows the absolutechemical variability. Compared to TRACE-P (Figures 2and 3), the tracer variability during PEM-Tropics B is muchlower, leading to more ambiguity in interpretation of theanalysis results because observed variabilities were at timessmaller than measurement uncertainties (Table 1). As onecould expect, the tracer variabilities of industry/urban-relatedfactors in PEM-Tropics B are much smaller than those inTRACE-P, which reflects the sampling of photochemicallyaged air masses during PEM-Tropics B.[21] As in the previous, we label each factor based on its
key chemical signatures. The ‘‘terrestrial biogenic’’ factoris characterized by the large variability of CH3OH (88%,653 pptv). The signal of CH3COCH3 is below the measure-ment uncertainty. The ‘‘biomass-burning’’ factor has largesignals of CH3COCH3 (55%, 98 pptv), CH3CHO (64%,30 pptv), CO (52%, 11 ppbv), and CH3Cl (82%, 44 pptv).The ‘‘combustion/industry’’ factors reflect a mix of biomassburning, automobile combustion, industry, and urbansources. There are substantial signals of C2H2 (84%, 28 pptv)
and C2H6 (9%, 21 pptv) in the combustion/industry 1 factor,and there are large signals of C2H6 (76%, 188 pptv) and CO(34%, 8 ppbv) in the combustion/industry 2 factor. TheCH3Cl fraction (13%, 7 pptv) in the latter factor is belowthe measurement uncertainty. The ‘‘oceanic’’ factor explains94% of CHBr3 variability (0.55 pptv) and does not showsignificant variability in the other chemicals.[22] We analyze the correlations between factors and
latitude, altitude, and C2H6/C3H8 ratio to help identify the
Figure 4. Five-day back trajectories of data points thatrank in the top 10% by factor score for the terrestrialbiogenic (top) and biomass-burning (bottom) factors inTRACE-P. The crosses show the locations of measure-ments. The back trajectory locations are represented bydots with colors indicating heights [black (<2 km), blue(2–6 km), and red (>6 km)], and the end point is marked bya diamond.
Figure 5. Factor score correlation with latitude (upper),altitude (middle), and C2H6/C3H8 ratio (bottom) for thebiomass-burning factor in TRACE-P.
D10305 SHIM ET AL.: SOURCE CHARACTERISTICS OF OVOCS AND HCN
6 of 12
D10305

source characteristics (Table 3). As for TRACE-P, the terres-trial biogenic factor shows no clear correlations reflectinggeographically dispersed sources. The biomass-burningfactor is anticorrelated with latitude, implying a southernhemispheric origin particularly from Africa and Australia(Figure 8). As in TRACE-P, it is positively correlated withC2H6/C3H8 ratio, indicating long-range transport of agedpollutants after initial rise due to combustion heating. Thecombustion/industry 1 and combustion/industry 2 factorsshow clear positive correlations with latitude and negativecorrelations with C2H6/C3H8 ratio, implying that most long-range transport of industrial/urban/combustion emissionsoriginated from the Northern Hemisphere [Wang et al.,2001]. As in TRACE-P, the oceanic factor shows anticor-relation with altitude.
3.3. INTEX-NA
[23] The INTEX-NA experiment was conducted to inves-tigate the formation and transport of tracers and aerosolsand inflow and outflow of pollutants over North America
during the summer (July–August 2004) [Singh et al., 2002].Two characteristics separate INTEX-NA from TRACE-Pand PEM-Tropics B. First, mixing processes are much moreactive over the continent in summer than over the westernPacific in spring (TRACE-P) or the tropical Pacific (PEM-Tropics B). Second, North American urban and industrialsources are more dispersed than over East Asia, wheremajor industrial and urban emissions are densely locatednear coastal regions. As a result, we find that sourceseparation is much more ambiguous in INTEX-NA dataset than the other two. In the selected data set, 35% of thedata is measured below 2 km; 50% is measured above 5 km.We find five factors in the PMF analysis. Figure 9 showsthe EV profiles. The factors are named after the tracerthat has the largest EV. The C2H2 factor is a combustionfactor with a large CH3OH signal (>25%), representingeither a large industrial-related CH3OH source over NorthAmerica or a mixture of combustion and biogenic emissionsbecause we cannot define a clear biogenic factor. TheCH3Cl factor with large signals of biomass burning (CH3Cl,CO, HCN, and CH3CN) and biogenic tracers (CH3OH,CH3COCH3, and HCN) likely represents a mixture of thetwo. The CH3Br, C2H6, and i-C5H12 factors are dominatedby a single species. Photochemical oxidation and mixingduring INTEX-NA (summer) are considerably faster thanTRACE-P (spring). Assuming similar emissions, we wouldexpect lower concentrations in INTEX-NA than TRACE-P.Inspection of vertical profiles of trace gases we selected (notshown) indicates that it is true for most species, includingCO, C2H2, and CH3Cl which are enhanced during INTEX-
Table 2. Correlations (R) Between Factor Scores and Latitudes,
Altitudes, and C2H6/C3H8 Ratio for TRACE-P
Factors Latitude Altitude C2H6/C3H8 Ratio
Terrestrial Biogenic 0.06 0.01 0.08Biomass Burning �0.31 0.59 0.73Combustion 0.1 �0.21 �0.37Industry/Urban 1 0.04 �0.27 �0.39Industry/Urban 2 0.29 �0.53 �0.78Oceanic 0.1 �0.57 �0.55
Figure 6. Same as Figure 2 but for PEM-Tropics B.
D10305 SHIM ET AL.: SOURCE CHARACTERISTICS OF OVOCS AND HCN
7 of 12
D10305

NA due to fire emissions. However, concentrations ofCH3OH, acetone, and HCN are much higher in INTEX-NAthan TRACE-P. We postulate that these enhancements aredue at least in part to larger biogenic emissions in summer.However, the analysis method used in this study cannot beapplied to evaluate our hypothesis.
4. Comparisons to Global Estimations
[24] Despite the limitations of PMF methods (section 2),it is still instructive to compare our results with previousglobal budget estimations. Additional precautions must alsobe heeded to prevent oversimplifications. First, our resultsare drawn from only two aircraft missions (TRACE-P andPEM-Tropics B). Second, the factor contributions do notnecessarily translate into source strengths. Third, it isgenerally hard to distinguish primary sources fromsecondary chemical production in the factor analysis.However, the following assessment points to the directionsof needed research when large discrepancies are found
between previous emission estimations and our results.Table 4 summarizes the contributions of various factors toOVOCs and HCN for TRACE-P and PEM-Tropics B;previous global estimates are also listed for comparisonpurposes.[25] The factor showing 80–88% variability of CH3OH
from this study represents the terrestrial biogenic factor,and it is consistent with the estimated global biogenicfractions of 62–81% [Heikes et al., 2002; Singh et al.,2004; Jacob et al., 2005]. For CH3COCH3, the biogenic
Figure 7. Same as Figure 3 but for PEM-Tropics B. ‘‘Com/ind1’’ and ‘‘Com/ind2’’ denote combustion/industry 1 and 2, respectively.
Table 3. Correlations (R) Between Factor Scores and Latitudes,
Altitudes, and C2H6/C3H8 Ratio for PEM-Tropics B
Factors Latitude Altitude C2H6/C3H8 Ratio
Terrestrial Biogenic 0.01 �0.09 �0.14Biomass Burning �0.51 0.16 0.45Combustion/Industry 1 0.6 �0.1 �0.54Combustion/Industry 2 0.68 �0.07 �0.57Oceanic 0.13 �0.42 �0.17
D10305 SHIM ET AL.: SOURCE CHARACTERISTICS OF OVOCS AND HCN
8 of 12
D10305

fractions of this study (20–40%) are also comparable withthe global estimates (27–53%) [Jacob et al., 2002; Singhet al., 2004].[26] Biogenic HCN sources were usually ignored in
previous studies [Cicerone and Zellner, 1983; Lobert etal., 1990; Li et al., 2000; Andreae and Merlet, 2001]. Li etal. [2003] estimated the global biogenic HCN fractionsby �18% in order to balance estimated global loss ratesfrom ocean uptake. Large terrestrial biogenic HCN variabi-lity (41%) is found during TRACE-P in this study, consi-derably higher than the global biogenic fraction estimate.
The cyanogenic process in plants is known to emit bothCH3COCH3 and HCN. It appears to be a key contributor toHCN emissions [Fall, 2003] from geographically dis-persed source regions. Contribution of biomass burning toHCN (�30%) in TRACE-P is much smaller than the globalestimates (>80%). The industry/urban/ocean factor contri-butions are uncertain since they are less than the measure-ment uncertainty of HCN (�25%).[27] The CH3COCH3 variabilities explained by industry/
urban and biomass-burning factors (8–30 and 19–55%,respectively) are much higher than the estimated primary
Figure 9. Same as Figure 2 but for INTEX-NA.
Figure 8. Same as Figure 4 but 10-day back trajectories for PEM-Tropics B based on Fuelberg et al.[2001].
D10305 SHIM ET AL.: SOURCE CHARACTERISTICS OF OVOCS AND HCN
9 of 12
D10305
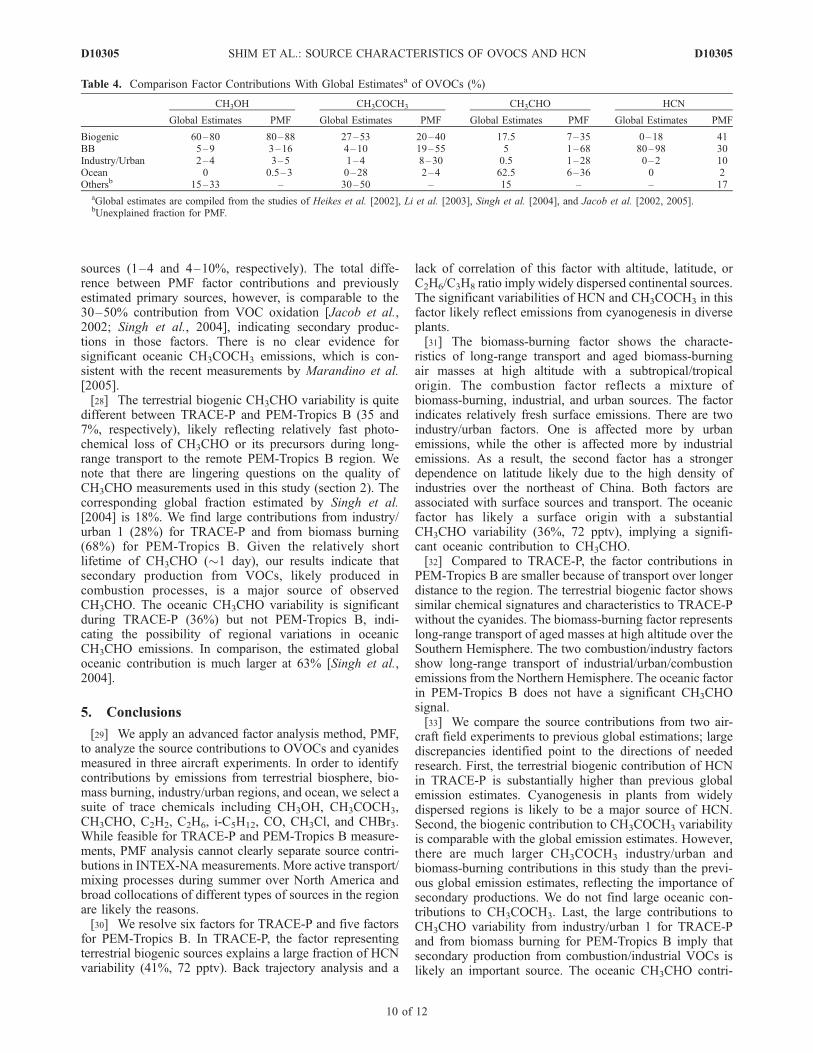
sources (1–4 and 4–10%, respectively). The total diffe-rence between PMF factor contributions and previouslyestimated primary sources, however, is comparable to the30–50% contribution from VOC oxidation [Jacob et al.,2002; Singh et al., 2004], indicating secondary produc-tions in those factors. There is no clear evidence forsignificant oceanic CH3COCH3 emissions, which is con-sistent with the recent measurements by Marandino et al.[2005].[28] The terrestrial biogenic CH3CHO variability is quite
different between TRACE-P and PEM-Tropics B (35 and7%, respectively), likely reflecting relatively fast photo-chemical loss of CH3CHO or its precursors during long-range transport to the remote PEM-Tropics B region. Wenote that there are lingering questions on the quality ofCH3CHO measurements used in this study (section 2). Thecorresponding global fraction estimated by Singh et al.[2004] is 18%. We find large contributions from industry/urban 1 (28%) for TRACE-P and from biomass burning(68%) for PEM-Tropics B. Given the relatively shortlifetime of CH3CHO (�1 day), our results indicate thatsecondary production from VOCs, likely produced incombustion processes, is a major source of observedCH3CHO. The oceanic CH3CHO variability is significantduring TRACE-P (36%) but not PEM-Tropics B, indi-cating the possibility of regional variations in oceanicCH3CHO emissions. In comparison, the estimated globaloceanic contribution is much larger at 63% [Singh et al.,2004].
5. Conclusions
[29] We apply an advanced factor analysis method, PMF,to analyze the source contributions to OVOCs and cyanidesmeasured in three aircraft experiments. In order to identifycontributions by emissions from terrestrial biosphere, bio-mass burning, industry/urban regions, and ocean, we select asuite of trace chemicals including CH3OH, CH3COCH3,CH3CHO, C2H2, C2H6, i-C5H12, CO, CH3Cl, and CHBr3.While feasible for TRACE-P and PEM-Tropics B measure-ments, PMF analysis cannot clearly separate source contri-butions in INTEX-NA measurements. More active transport/mixing processes during summer over North America andbroad collocations of different types of sources in the regionare likely the reasons.[30] We resolve six factors for TRACE-P and five factors
for PEM-Tropics B. In TRACE-P, the factor representingterrestrial biogenic sources explains a large fraction of HCNvariability (41%, 72 pptv). Back trajectory analysis and a
lack of correlation of this factor with altitude, latitude, orC2H6/C3H8 ratio imply widely dispersed continental sources.The significant variabilities of HCN and CH3COCH3 in thisfactor likely reflect emissions from cyanogenesis in diverseplants.[31] The biomass-burning factor shows the characte-
ristics of long-range transport and aged biomass-burningair masses at high altitude with a subtropical/tropicalorigin. The combustion factor reflects a mixture ofbiomass-burning, industrial, and urban sources. The factorindicates relatively fresh surface emissions. There are twoindustry/urban factors. One is affected more by urbanemissions, while the other is affected more by industrialemissions. As a result, the second factor has a strongerdependence on latitude likely due to the high density ofindustries over the northeast of China. Both factors areassociated with surface sources and transport. The oceanicfactor has likely a surface origin with a substantialCH3CHO variability (36%, 72 pptv), implying a signifi-cant oceanic contribution to CH3CHO.[32] Compared to TRACE-P, the factor contributions in
PEM-Tropics B are smaller because of transport over longerdistance to the region. The terrestrial biogenic factor showssimilar chemical signatures and characteristics to TRACE-Pwithout the cyanides. The biomass-burning factor representslong-range transport of aged masses at high altitude over theSouthern Hemisphere. The two combustion/industry factorsshow long-range transport of industrial/urban/combustionemissions from the Northern Hemisphere. The oceanic factorin PEM-Tropics B does not have a significant CH3CHOsignal.[33] We compare the source contributions from two air-
craft field experiments to previous global estimations; largediscrepancies identified point to the directions of neededresearch. First, the terrestrial biogenic contribution of HCNin TRACE-P is substantially higher than previous globalemission estimates. Cyanogenesis in plants from widelydispersed regions is likely to be a major source of HCN.Second, the biogenic contribution to CH3COCH3 variabilityis comparable with the global emission estimates. However,there are much larger CH3COCH3 industry/urban andbiomass-burning contributions in this study than the previ-ous global emission estimates, reflecting the importance ofsecondary productions. We do not find large oceanic con-tributions to CH3COCH3. Last, the large contributions toCH3CHO variability from industry/urban 1 for TRACE-Pand from biomass burning for PEM-Tropics B imply thatsecondary production from combustion/industrial VOCs islikely an important source. The oceanic CH3CHO contri-
Table 4. Comparison Factor Contributions With Global Estimatesa of OVOCs (%)
CH3OH CH3COCH3 CH3CHO HCN
Global Estimates PMF Global Estimates PMF Global Estimates PMF Global Estimates PMF
Biogenic 60–80 80–88 27–53 20–40 17.5 7–35 0–18 41BB 5–9 3–16 4–10 19–55 5 1–68 80–98 30Industry/Urban 2–4 3–5 1–4 8–30 0.5 1–28 0–2 10Ocean 0 0.5–3 0–28 2–4 62.5 6–36 0 2Othersb 15–33 – 30–50 – 15 – – 17
aGlobal estimates are compiled from the studies of Heikes et al. [2002], Li et al. [2003], Singh et al. [2004], and Jacob et al. [2002, 2005].bUnexplained fraction for PMF.
D10305 SHIM ET AL.: SOURCE CHARACTERISTICS OF OVOCS AND HCN
10 of 12
D10305

bution shows considerable regional dependence, and it islower than the previous global emission estimates. On thebasis of this analysis, three specific areas emerge for futureresearch: the global sources of CH3COCH3 and HCN fromthe cyanogenic process in plants, the VOC precursors tosustain CH3COCH3 and CH3CHO concentrations inindustry/urban and biomass-burning plumes, and the mag-nitudes and regional variability of oceanic CH3CHOemissions.
[34] Acknowledgments. The work was supported by the NationalScience Foundation Atmospheric Chemistry Program and NASA’s GlobalTropospheric Experiment Program.
ReferencesAndreae, M. O., and P. Merlet (2001), Emission of trace gases and aerosolsfrom biomass burning, Global Biogeochem. Cycles, 15, 955–966.
Apel, E. C., A. J. Hills, R. Lueb, S. Zindel, S. Eisele, and D. D. Riemer(2003), A fast GC/MS system to measure C2 to C5 carbonyls, methanoland ethanol aboard aircraft, J. Geophys. Res., 108(D20), 8794, doi:10.1029/2002JD003199.
Blake, D., N. J. Blake, T. W. Smith Jr., O. W. Wingenter, and F. S.Rowland (1996), Nonmethane hydrocarbon and halocarbon distribu-tions during Atlantic Stratocumulus Transition Experiment/MarineAerosol and Gas Exchange, June 1992, J. Geophys. Res., 101(D2),4501–4514.
Cicerone, R. J., and R. Zellner (1983), The atmospheric chemistry ofhydrogen cyanide (HCN), J. Geophys. Res., 88, 10,689–10,696.
Conn, E. E. (1991), The metabolism of a natural product—lessons learnedfrom cyanogenic glycosides, Planta Med., 57, s1– s9.
de Gouw, J. A., et al. (1999), Emissions of volatile organic compounds fromcut grass and clover are enhanced during the drying process, Geophys. Res.Lett., 26, 811–814.
de Gouw, J. A., C. Warneke, D. D. Parrish, J. S. Holloway, M. Trainer,and F. C. Fehsenfeld (2003), Emission source and ocean uptake ofacetonitrile (CH3CN) in the atmosphere, J. Geophys. Res., 108(D11),4329, doi:10.1029/2002JD002897.
Fall, R. (2003), Abundant oxygenates in the atmosphere: A biochemicalperspective, Chem. Rev., 103, 4941–4951.
Fall, R., and A. A. Benson (1996), Leaf methanol-the simplest naturalproduct from plants, Trends Plant Sci,, 1(9), 296–301.
Fuentes, J. D., et al. (2000), Biogenic hydrocarbons in the atmosphericboundary layer: A review, Bull. Am. Meteorol. Soc., 81, 1537–1575.
Fuelberg, H. E., R. E. Newell, D. J. Westberg, J. C. Maloney, J. R. Hannan,B. D. Martin, M. A. Avery, and Y. Zhu (2001), A meteorological over-view of the second Pacific exploratory in the tropics, J. Geophys. Res.,106(D23), 32,427–32,443.
Fuelberg, H. E., C. M. Kiley, J. R. Hannan, D. J. Westberg, M. A. Avery,and R. E. Newell (2003), Meteorological conditions and transport path-ways during the Transport and Chemical Evolution over the Pacific(TRACE-P) experiment, J. Geophys. Res., 108(D20), 8782, doi:10.1029/2002JD003092.
Galbally, I. E., and W. Kirstine (2002), The production of methanol byflowering plants and the global cycle of methanol, J. Atmos. Chem.,43, 195–229.
Gleadow, R. M., and I. E. Woodrow (2000), Temporal and spatial variationin cyanogenic glycosides in Eucalyptus cladocalyx, Tree Physiol., 20,591–598.
Guenther, A., et al. (1995), A global-model of natural volatile organic-compound emissions, J. Geophys. Res., 100, 8873–8892.
Guenther, A., et al. (2000), Natural emissions of non-methane volatileorganic compounds, carbon monoxide, and oxides of nitrogen fromNorth America, Atmos. Environ., 34, 2205–2230.
Harry, D. E., and T.W. Kimmerer (1991),Molecular genetics and physiologyof alcohol dehydrogenase in woody plants, For. Ecol. Manag., 43, 251–272.
Heikes, B. G., et al. (2002), Atmospheric methanol budget and oceanimplication, Global Biogeochem. Cycles, 16(4), 1133, doi:10.1029/2002GB001895.
Jacob, D. J., et al. (2002), Atmospheric budget of acetone, J. Geophys. Res.,107(D12), 4110, doi:10.1029/2001JD000694.
Jacob, D. J., et al. (2003), Transport and Chemical Evolution over thePacific (TRACE-P) aircraft mission: Design, execution, and first results,J. Geophys. Res., 108(D20), 9000, doi:10.1029/2002JD003276.
Jacob, D. J., et al. (2005), Global budget of methanol: Constraints fromatmospheric observations, J. Geophys. Res., 110, D08303, doi:10.1029/2004JD005172.
Jost, C., et al. (2003), Trace gas chemistry in a young biomass burningplume over Namibia: Observations and model simulations, J. Geophys.Res., 108(D13), 8482, doi:10.1029/2002JD002431.
Karl, T., et al. (2002), Transient releases of acetaldehyde from tree leaves—products of a pyruvate overflow mechanism?, Plant Cell Environ., 25,1121–1131.
Li, Q. B., et al. (2000), Atmospheric Hydrogen Cyanide (HCN): Biomassburning source, ocean sink?, Geophys. Res. Lett., 27, 357–360.
Li, Q. B., et al. (2003), A global three-dimensional model analysis of theatmospheric budget of HCN and CH3CN: Constraints from aircraft andground measurements, J. Geophys. Res., 108(D21), 8827, doi:10.1029/2002JD003075.
Liu, W., et al. (2005), Atmospheric aerosol over two urban-rural pairs in thesoutheastern United States: Chemical composition and sources, Atmos.Environ., 39, 4453–4710.
Lobert, J. M., D. H. Scharffe, W. M. Hao, and P. J. Crutzen (1990),Importance of biomass burning in the atmospheric budgets of nitrogen-containing gases, Nature, 346, 552–554.
Marandino, C. A., et al. (2005), Oceanic uptake and the global atmo-spheric acetone budget, Geophys. Res. Lett., 32, L15806, doi:10.1029/2005GL023285.
McCulloch, A., et al. (1999), Global emissions of hydrogen chlorideand chloromethane from coal combustion, incineration, and industrialactivities: Reactive chlorine emissions inventory, J. Geophys. Res.,104, 8391–8403.
Northway, M. J., et al. (2004), Evaluation of the role of heterogeneousoxidation of alkenes in the detection of atmospheric acetaldehyde, Atmos.Environ., 38, 6017–6028.
Novelli, P. C., J. E. Collins Jr., R. C. Myers, G. W. Sachse, and H. E.Scheel (1994), Reevaluation of the NOAA/CMDL carbon monoxidereference scale and comparisons with CO reference gases at NASA-Langley and the Fraunhofer Institut, J. Geophys. Res., 99(D6), 12,833–12,840.
Paatero, P. (1997), Least squares formulation of robust non-negative factoranalysis, Chemometr. Intell. Lab. Syst., 37, 23–35.
Paatero, P., et al. (2002), Understanding and controlling rotations in factoranalytic model, Chemometr. Intell. Lab. Syst., 60, 253–264.
Pouton, J. E. (1990), Cyanogenesis in plants, Plant Physiol, 94, 401–405.
Raper, J. L., et al. (2001), Pacific Exploratory Mission in the tropicalPacific: PEM-Tropics B, March–April 1999, J. Geophys. Res., 106,32,401–32,425.
Rinsland, C. P., et al. (1998), ATMOS/ATLAS 3 infrared profile mea-surements of trace gases in the November 1994 tropical and subtropicalupper troposphere, J. Quant. Spectrosc. Radiat. Transfer, 60, 891–901.
Rubin, J. I., A. J. Kean, R. A. Harley, D. B. Millet, and A. H. Goldstein(2006), Temperature dependence of volatile organic compound evapo-rative emissions from motor vehicles, J. Geophys. Res., 111, D03305,doi:10.1029/2005JD006458.
Schade, G., and A. H. Goldstein (2001), Fluxes of oxygenated volatileorganic compounds from a ponderosa pine plantation, J. Geophys.Res., 106(D3), 3111–3124.
Singh, H, D. Jacob, L. Pfister, and J. Crawford (2002), INTEX-NA: Inter-continental Chemical Transport Experiment-North America, from http://cloud1.arc.nasa.gov/docs/intex-na/white_paper.pdf.
Singh, H., et al. (2003a), In situ measurements of HCN and CH3CN overthe Pacific Ocean: Sources, sinks, and budgets, J. Geophys. Res.,108(D20), 8795, doi:10.1029/2002JD003006.
Singh, H., et al. (2003b), Oxygenated volatile organic chemicals in theocean: Inferences and implications based on atmosphere observationsand air-sea exchange models, Geophys. Res. Lett., 30(16), 1862,doi:10.1029/2003GL017933.
Singh, H., et al. (2004), Analysis of the atmospheric distribution, sources,and sinks of oxygenated volatile organic chemicals based on measure-ments over the Pacific during TRACE-P, J. Geophys. Res., 109, D15S07,doi:10.1029/2003JD003883.
Staudt, A. C., et al. (2001), Continental sources, transoceanic transport, andinterhemispheric exchange of carbon monoxide over the Pacific,J. Geophys. Res., 106(D23), 32,571–32,589.
Talbot, R. W., et al. (1997), Chemical characteristics of continental outflowfrom Asia to the troposphere over the western Pacific Ocean duringFebruary–March 1994: Results from PEM-West B, J. Geophys. Res.,102, 28,255–28,274.
Vetter, J. (2000), Plant cyanogenic glycosides, Toxicon, 38, 11–36.
D10305 SHIM ET AL.: SOURCE CHARACTERISTICS OF OVOCS AND HCN
11 of 12
D10305

Wang, Y., and T. Zeng (2004), On tracer correlations in the troposphere:The case of ethane and propane, J. Geophys. Res., 109, D24306,doi:10.1029/2004JD005023.
Wang, Y., et al. (2001), Factors controlling tropospheric O3, OH, NOx, andSO2 over the tropical Pacific during PEM-Tropics B, J. Geophys. Res.,106, 32,733–32,748.
Wang, Y., et al. (2003), Intercontinental transport of pollution manifested inthe variability and seasonal trend of springtime O3 at northern middleand high latitudes, J. Geophys. Res., 108(D21), 4683, doi:10.1029/2003JD003592.
Yoshida, Y., et al. (2004), A three-dimensional global model study of atmo-spheric methyl chloride budget and distributions, J. Geophys. Res., 109,D24309, doi:10.1029/2004JD004951.
�����������������������R. Blake, Department of Chemistry, University of California, Irvine, CA,
USA.A. B. Guenther, National Center for Atmospheric Research, Boulder, CO,
USA.C. Shim and Y. Wang, Department of Earth and Atmospheric Sciences,
Georgia Institute of Technology, Atlanta, GA, USA. ([email protected])H. B. Singh, NASA Ames Research Center, Moffett Field, CA, USA.
D10305 SHIM ET AL.: SOURCE CHARACTERISTICS OF OVOCS AND HCN
12 of 12
D10305