sorption of methane, ethane, propane, butane, carbon dioxide, and nitrogen on kerogen
TRANSCRIPT
ISSN 0036�0244, Russian Journal of Physical Chemistry A, 2014, Vol. 88, No. 6, pp. 1028–1036. © Pleiades Publishing, Ltd., 2014.Original Russian Text © A.A. Pribylov, N.A. Skibitskaya, L.A. Zekel’, 2014, published in Zhurnal Fizicheskoi Khimii, 2014, Vol. 88, No. 6, pp. 1043–1051.
1028
INTRODUCTION
It is well known that in addition to the steam�and�gas phase, such high�molecular compounds as kero�gens, asphaltenes, resins, paraffins, and gas and liquidhydrocarbon fluids are found in the deposits of gascondensate fields. The above high�molecular com�pounds have different structures and therefore differ�ent physicochemical properties. Earlier [1], we stud�ied the sorption of gases found in gas condensate fieldsusing asphaltenes. It was shown that this high�molec�ular compound is characterized by great sorptioncapacity; at the same time, asphaltenes behave some�what differently from such solid adsorbents as thosethat contain carbon. It was therefore of interest tostudy gas sorption by another organic component ofgas condensate fields: kerogen.
According to modern concepts, kerogen is a sourceof oil and gas in gas condensate fields. These high�molecular organic compounds have linear or chainstructures. Their macromolecules are long structuresin which atoms are bound in the form of fibers (orchains). The length of such macromolecules exceedstheir transverse diameter by several orders of magni�tude. Some chains have side branches in branched or2D chains. Chains of macromolecules can be boundby chemical bonds (e.g., bridges of sulfur atoms) and
form cross�linked 3D structures. Substances like ker�ogens with a 3D structure are inelastic and are usuallyinsoluble.
The physicochemical properties of high�molecularcompounds are determined by the sizes and shapes ofmacromolecules, the intensity of interaction betweenmacromolecules, and the affinity of the compoundtoward some substances. Studies of the sorption ofmethane, ethane, propane, butane, carbon dioxide,and nitrogen on high�molecular substances (particu�larly on kerogen) are not only of scientific interest, butalso have practical value, since we must consider thegas fraction sorbed by these components when esti�mating gas reserves in gas condensate fields. The sorp�tion properties of kerogens have yet to be studied. Theaim of this work was to determine sorption propertiesof kerogen in respect to the above gases under condi�tions close to real ones, and to find the sorption mech�anism and the adsorbent class to which this substancecan be assigned.
EXPERIMENTAL
Two adsorbents with different kerogen contentswere used (Table 1). The elemental compositions ofthe kerogens are also given in Table 1. The sorptivesused were nitrogen, methane, ethane, propane,butane, and carbon dioxide with purities of 99.9%.
Sorption of Methane, Ethane, Propane, Butane, Carbon Dioxide, and Nitrogen on Kerogen
A. A. Pribylova, N. A. Skibitskayab, and L. A. Zekel’c
a Institute of Physical Chemistry and Electrochemistry, Russian Academy of Sciences, Moscow, 119071 Russiab Institute of Problems of Oil and Gas, Russian Academy of Sciences, Moscow, 119333 Russia
c A.V. Topchiev Institute of Petrochemical Synthesis, Russian Academy of Sciences, Moscow, 119991 Russiae�mail: [email protected]; [email protected]; [email protected]
Received May 6, 2013
Abstract—Sorption isotherms of nitrogen, methane (in the pressure range of 0.1–40 MPa), ethane (0.1–3.7 MPa), propane (0.01–1 MPa), butane (0.01–0.2 MPa), and carbon dioxide (0.1–6 MPa) are measuredon two adsorbents with kerogen contents of 16 and 75% at temperatures of 303, 323, 343 K. Adsorption vol�umes are calculated for all adsorption systems using two independent methods. The BET technique is usedto determine the surface area values of the two adsorbents on the basis of sorption data for ethane, propane,butane, and carbon dioxide. The initial and isosteric adheat of sorption values are calculated on the basis ofsorption isotherms of ethane, propane, butane, carbon dioxide measured at three temperatures. It is foundfrom comparing the dependences of isosteric heat of sorption on the two adsorbents that molecules of theabove gases diffuse into its bulk (adsorbent 2) in addition to sorbing on the outside surface formed by kerogenmolecules, while sorption of the same gases on the rock (adsorbent 1) is similar to sorption on a smooth hardadsorbent surface.
Keywords: sorption, specific surface area of adsorbents, isosteric heat, kerogen.
DOI: 10.1134/S0036024414060259
PHYSICAL CHEMISTRYOF SURFACE PHENOMENA
RUSSIAN JOURNAL OF PHYSICAL CHEMISTRY A Vol. 88 No. 6 2014
SORPTION OF METHANE, ETHANE, PROPANE, BUTANE, CARBON DIOXIDE 1029
The volume–weight setup described in detail in [2] wasused for our experimental studies of sorption of thesecompounds. The gas phase parameters in the systemwere determined using equations of state. A multicom�ponent gas state equation [3–5] was used for methane,ethane, nitrogen, and carbon dioxide. Gas densities ρg
of propane and butane were determined according tothe tables in [6]. Our choice of the ranges of sorptionpressures and temperatures was based on the need of thebest simulation of the conditions under which solids(and the high�molecular compounds in them) exist andat which natural gas extraction occurs (pressures of 30–40 MPa and temperatures of 30–70°C).
Sorption isotherms were measured at the tempera�tures of 303, 323, and 343 K in the 0.1–40 MPa rangeof nitrogen and methane pressures; ethane pressures of0.1–3.7 MPa; propane pressures of 0.01–1 MPa;butane pressures of 0.01–0.2 MPa; and carbon dioxidepressures of 0.1–6 MPa on adsorbent 2. Measure�ments on sample 1 were similar, with the exclusion ofbutane. The sorption values of the above substances onthe two adsorbents at the given temperatures and equi�librium pressures were calculated according to theequation
Г (mmol/g) = (m – (Vаmр
– mads/ρads)ρg)1000/(Мmads). (1)
Here, m is the gas mass supplied to an ampoule withvolume Vаmр (V = 6.131 cm3) containing an adsorbentand mads is the mass of the adsorbent (m(1) = 2.459 g,m(2) = 1.935 g); ρads is the adsorbent density (ρads(1) =1.935 g/cm3, ρads(2) = 1.21 g/cm3), determined bymeans of helium picnometry; and M is the molecularweight of the gas. The sorption values calculatedaccording to (1) are excess sorption values Γ
(mmol/g). For all practical purposes, however, abso�lute sorption values a are more important, and therelationship between a and Γ is found to be
а = Г + ρgW0, (2)
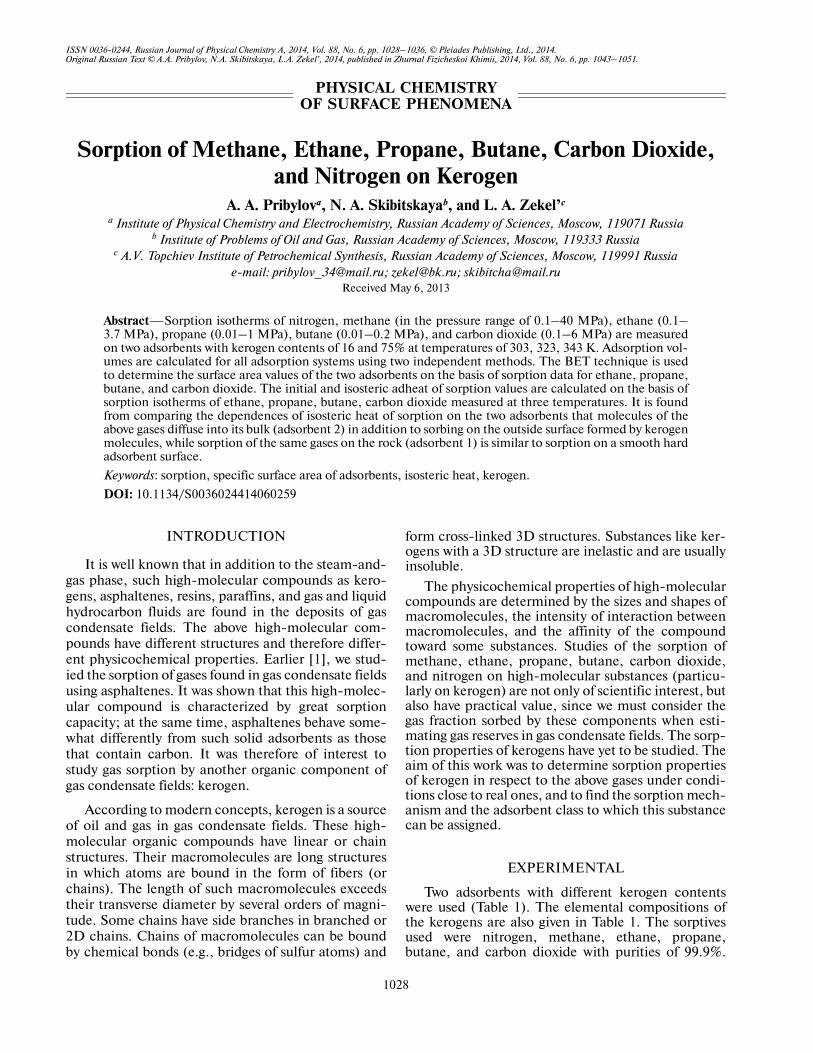
where W0 is the adsorption volume. The adsorptionvolume here is the space near the adsorbent surfaceand the volume of macro�and micropores (<2 nm)where the density of substances differs significantlyfrom the density of the equilibrium gas phase. Sorp�tion isotherms of the above gases on the two samplescalculated according to (1) are shown in Figs. 1, 2.
Determining Adsorption Volume
To determine W0 on the basis of the experimentaldata for ethane, propane, butane, and carbon dioxideon samples 1 and 2 at all temperatures, we used themethod developed in [7], in which experimental dataon the sorption of substances at temperatures belowand above the critical value for Тс + 100 K areemployed. When a sorption isotherm is measured at anincrease in gas phase pressure Р, mass Δm of the sub�stance introduced into an ampoule with Vamp contain�ing adsorbent with mass mаds and density ρаds can beconditionally divided into two parts: Δmаd is the varia�tion in the adsorbed mass of the substance and Δmg isthe variation in the mass of the substance in the gasphase. At a constant sorption system volume, the ΔWvolume occupied by the adsorbate in an adsorptionspace with density ρаd is equal to the reduction in thevolume occupied in the system by a substance withdensity ρg upon an increase in the pressure of the equi�librium gas phase; i.e., ΔWad = –ΔWg:
Δm = Δmаd + Δmg, (3)
Δm = ρаdΔW + ρg(Vamp – mаds/ρаds – ΔW), (4)
Table 1. Elemental composition of kerogens (wt %) wherec is the content of kerogen
Samples c, % C H S N О S + N + O
Adsorbent 1 15.95 74.64 7.85 2.37 1.97 13.2 17.54
Adsorbent 2 75.09 70.87 8.38 5.77 1.64 13.4 20.8
0 40302010P, MPa
0.5
1.0
1.5
2.0(b)
12
3
45
6
0 40302010
0.5
1.0
1.5(a)
12
3 456
Γ, mmol/g
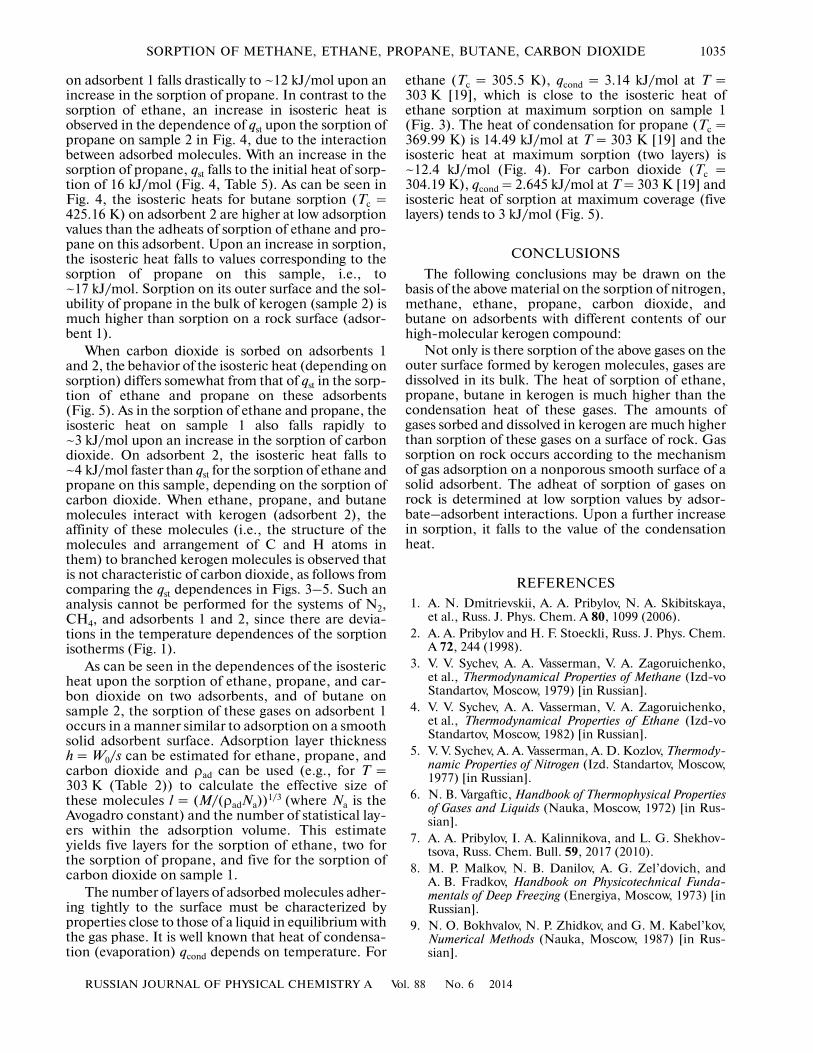
Fig. 1. Excess sorption isotherms of (a) nitrogen and (b)methane on adsorbent 1 ((1) 303, (2) 323, and (3) 343 K)and on adsorbent 2 ((4) 303, (5) 323, and (6) 343 K).
1030
RUSSIAN JOURNAL OF PHYSICAL CHEMISTRY A Vol. 88 No. 6 2014
PRIBYLOV et al.
hence
ΔW = [Δm – ρg(Vаmp – mаds/ρаds)]/(ρаd – ρg). (5)
Variations in volume ΔW due to an increase in theexperimental value of pressure Р are calculated for themeasured isotherm according to Eq. (5). Let us denoteas W0 the maximum possible volume ΔW of anadsorbed substance filled by adsorbate with density ρаdat pressure Рs. Density ρаd of the adsorbed substance isassumed to be equal to the density of the liquid at theboiling point. If the temperature of measuring sorp�tion isotherms is above the boiling point, or even abovecritical temperature Тc of the substances, the densityof the adsorbed substance is calculated according tothe equation
. (6)
Here, is the density of the liquid adsorbate at boil�ing point Тb and pressure Ps, α is the thermal coeffi�cient of limiting sorption regardless of Р or Т. Thermalexpansion coefficients = – (1/v)(dv/dT)Р for liquids
ad b b0( ) exp[ ( )]T T Tρ = ρ −α −
b0
ρ
α
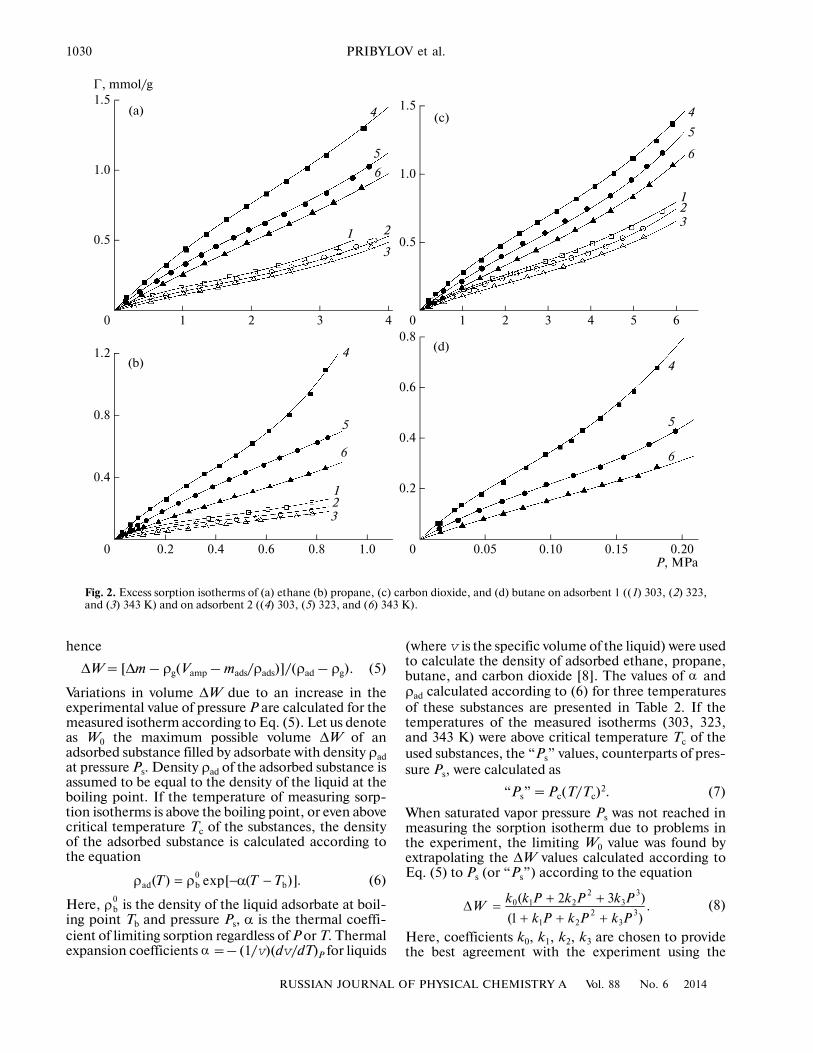
(where v is the specific volume of the liquid) were usedto calculate the density of adsorbed ethane, propane,butane, and carbon dioxide [8]. The values of andρаd calculated according to (6) for three temperaturesof these substances are presented in Table 2. If thetemperatures of the measured isotherms (303, 323,and 343 K) were above critical temperature Tc of theused substances, the “Ps” values, counterparts of pres�sure Ps, were calculated as
“Ps” = Pc(T/Tc)2. (7)
When saturated vapor pressure Рs was not reached inmeasuring the sorption isotherm due to problems inthe experiment, the limiting W0 value was found byextrapolating the ΔW values calculated according toEq. (5) to Рs (or “Ps”) according to the equation
(8)
Here, coefficients k0, k1, k2, k3 are chosen to providethe best agreement with the experiment using the
α
2 30 1 2 3
2 31 2 3
( 2 3 ).
(1 )
k k P k P k PW
k P k P k P
+ +Δ =
+ + +
0 4321
0.5
1.0
1.5(a)
1 2
3
4
5
6
0 1.00.80.60.2
0.4
0.8
1.2(b)
123
4
5
6
0.4
0 4321
0.5
1.0
1.5(c)
123
4
5
6
5 6
0 0.150.100.05
0.2
0.4
0.8(d)
4
5
6
0.20P, MPa
0.6
Γ, mmol/g
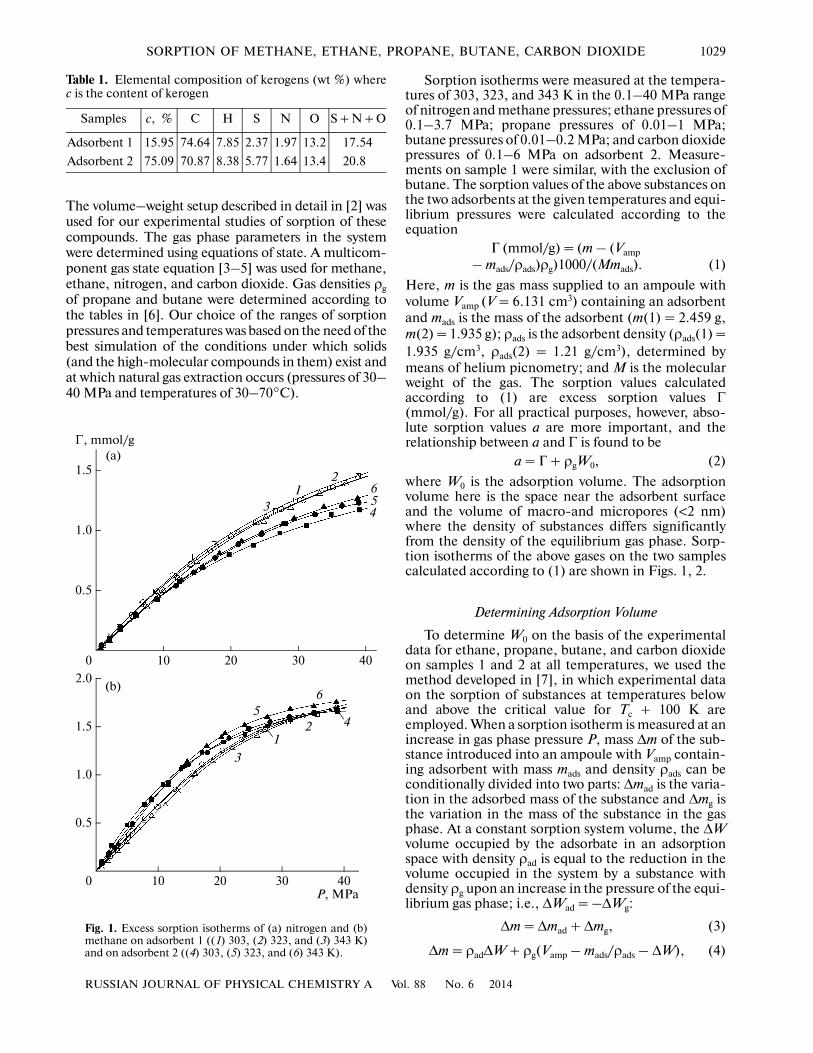
Fig. 2. Excess sorption isotherms of (a) ethane (b) propane, (c) carbon dioxide, and (d) butane on adsorbent 1 ((1) 303, (2) 323,and (3) 343 K) and on adsorbent 2 ((4) 303, (5) 323, and (6) 343 K).
RUSSIAN JOURNAL OF PHYSICAL CHEMISTRY A Vol. 88 No. 6 2014
SORPTION OF METHANE, ETHANE, PROPANE, BUTANE, CARBON DIOXIDE 1031
Newton method [9]. W0 was calculated at pressure Psaccording to Eq. (8) with the coefficients found for k0,k1, k2, k3. As the range of extrapolation to pressure Ps(or “Ps”) grows at higher measuring temperatures, thecalculated W0 value must be elaborated by means ofiteration. The experimental isotherm calculatedaccording to (5) is therefore approximated by Eq. (8),but the W0 value obtained for an isotherm correspond�ing to a lower temperature is substituted for k0. TheNewton method is then used to find new values ofcoefficients k1, k2, k3 for this isotherm. Equation (8)can now be used with these coefficients to calculate W0for higher temperatures at Ps (or “Ps”). The W0 valuescalculated using this method for all of the above sys�tems are presented in Table 3.
In the literature, an approach is described fordetermining adsorption volume based on the adsorp�tion of vapors on nonporous adsorbents, e.g., on thesurfaces of transition pores of active carbons, and oncarbon black [10]. The following expression is used inthis approach:
а = W0/vexp[–(ln(Ps/Р)/Eβ)]. (9)
Here, v = 1/ρаd is the specific volume of the liquidadsorptive, E is the characteristic energy, β is the affin�ity coefficient, and the maximum sorption value is a0 =W0/v at a given temperature. The sorption isotherm in
the coordinates of lna–ln(Ps/P) is approximated by astraight line and the W0 value is determined by extrap�olating lna(P) at Р → Рs. When W0 is determinedaccording to (9), it is assumed that а = W0ρаd = Г +W0ρg, but the excess sorption isotherm is used. Toexpress the a values in expression (9) through excess Γvalues, let us use Eq. (2): а = W0ρаd = Г + W0ρg, fromwhich Г = W0(ρаd – ρg).
Г = W0(ρаd – ρg)exp[–(ln(Ps/Р)/βE)n]. (10)
In point of fact, Eqs. (9) and (10) are the Dubinin–Astakhov equation [11] with exponent n = 1. As wasshown in [12], Eq. (9) at n < 1 is an acceptable approx�imation for all isotherms characteristic of sorption onswelling polymers. The W0 values calculated accordingto Eq. (10) in linear form with n ≤ 1 and ρаd for (6) arepresented in Table 3 for all of the investigated systems.
Determining Adsorbent Specific Surface Area
The BET technique is mainly used to determinethe specific surface area of adsorbents, since it pro�vides the results closest to real values. Formally, this
Table 2. Values of pressure Ps (MPa) and density ρads (g/cm3) of adsorbed substances
Gases Tc, К Pc, MPa α, К–1303 K 323 K 343 K
ρаds Ps ρаds Ps ρаds Ps
С2Н6 305.5 4.913 0.0023 0.416 4.68 0.3974 5.492* 0.3795 6.193*
С3Н8 369.99 4.264 0.0019 0.582 1.0878 0.484 1.724 0.463 2.646
С4Н10 425.16 3.796 0.002 0.565 0.2865 0.5431 0.496 0.5218 0.81
СО2 304.19 7.382 0.005 0.766 7.18 0.693 8.32* 0.627 9.386*
* “Ps.”
Table 3. Values of adsorption volume (W0, cm3/g), calculated using two methods (1 and D)
Gases303 K 323 K 343 K
1 D 1 D 1 D
Adsorbent 1–Sorptive
СH3CН3 0.068 0.067 0.082 0.086* 0.09 0.09*
СH3CН2CH3 0.032 0.03 0.05 0.04* 0.05 0.05
СО2 0.075 0.072 0.094 0.087* 0.11 0.11*
Adsorbent 2–Sorptive
СH3CН3 0.15 0.15* 0.15 0.16* 0.157 0.16*
СH3CН2CH3 0.16 0.14* 0.14 0.12 0.145 0.12
СH3CН2CH2CН3 0.14 0.13* 0.17 0.15* 0.17 0.13
СО2 0.13 0.13* 0.15 0.17* 0.17 0.18*
* n = 0.8.
1032
RUSSIAN JOURNAL OF PHYSICAL CHEMISTRY A Vol. 88 No. 6 2014
PRIBYLOV et al.
technique is applicable only to vapor adsorption. TheBET equation is
(11)
Here, Γm is the limiting sorption value in the layer clos�est to the surface, and C is the BET constant. Plottingthe sorption values in the coordinates P/Ps/(Г(1 –P/Ps)) – P/Ps and using the corresponding landingsurface areas σ of molecules [13], we determined spe�cific surface areas s of two samples, based on the sorp�tion of ethane at T = 303 K, propane at T = 303, 323,and 343 K, carbon dioxide at T = 303 K, butane at T =303, 323, 343 K. The calculated S values are presentedin Table 4.
Determination of Initial Heat of Sorption
The value of heat of sorption obtained using theHenry constants reflects the interaction between gasesand adsorbents, uncomplicated by the interactionbetween adsorbed molecules:
КH = exp(q/RT)exp(ΔS/R). (12)
Here, q is the differential heat of sorption. ΔS is thechange in entropy of a substance upon transitioningfrom the gas phase into the adsorbed state. Sorptionisotherms of all our systems measured at three temper�atures were used to determine Henry constants KH. Toobtain Henry constants, sorption isotherms wereapproximated by an adsorption equation obtainedfrom statistical thermodynamics [14]:
(13)
Coefficients K0, K1, K2, and К3 were selected using theNewton method for the best agreement with an exper�iment, КH = К0К1. The lnКH–1/T temperature depen�dence was used to calculate the initial heat of sorptionvalues presented in Table 5.
For the sorption systems of ethane, propane, car�bon dioxide on adsorbent 1 and also of the same sub�stances plus butane on sample 2, isosteric heat of sorp�tion values were calculated with account for interac�tion of adsorbed molecules with the adsorbent andbetween themselves:
. (14)
Here, qst is the isosteric heat of sorption. When anisostere is constructed for a chosen value of sorptionΓ, the corresponding value of P is found for all thesorption isotherms measured at different tempera�tures. The slope of the isostere is used to determine qst.The isosteric heat of sorption values calculated for theabove systems are presented in Figs. 3–5.
s
s s
Г /Г
/ /.
(1 )[1 ( 1)]mCP P
P P P P C=
− + −
Г2 3
0 1 2 32 3
1 2 3
( 2 3 ).
(1 )
k k P k P k P
k P k P k P
+ +=
+ + +
( )st Г
2 lnq RT P T= ∂ ∂
RESULTS AND DISCUSSION
Systems of Nitrogen and Methane on Adsorbents 1 and 2
As can be seen in Fig. 1, the isotherms of excesssorption of nitrogen and methane measured at T =303, 323, and 343 K on the two samples grow monot�onously upon an increase in pressure to 40 MPa. Nosaturation effects are observed in the isotherms. It iswell known that isotherms of the excess sorption ofgaseous N2, Kr, Ar, and CH4, measured in the samerange of temperatures and pressures on microporous
Table 4. Values of the specific surface area of our adsorbents
Gases σ, nm2 s, m2/g
303 K 323 K 343 K
Adsorbent 1–Sorptive
С2Н6 0.227 27 – –
С3Н8 0.425 30 35 43
СО2 0.203 34
Adsorbent 2–Sorptive
С2Н6 0.227 84 – –
С3Н8 0.425 120 120 120
С4Н10 0.434 80 83 110
СО2 0.203 67 – –
Table 5. Values of the initial sorption heat for our sorptionsystems (q, kJ/mol)
System N2 CH4 C2H6 C3H8 C4H10 CO2
Adsorbent 1 17 11 15.2 21.7 – 11.6
Adsorbent 2 11 9 11.5 16 21 11.3
1.00.80.60.2
2
6
14
1
2
0.4Γ, mmol/g
0
10
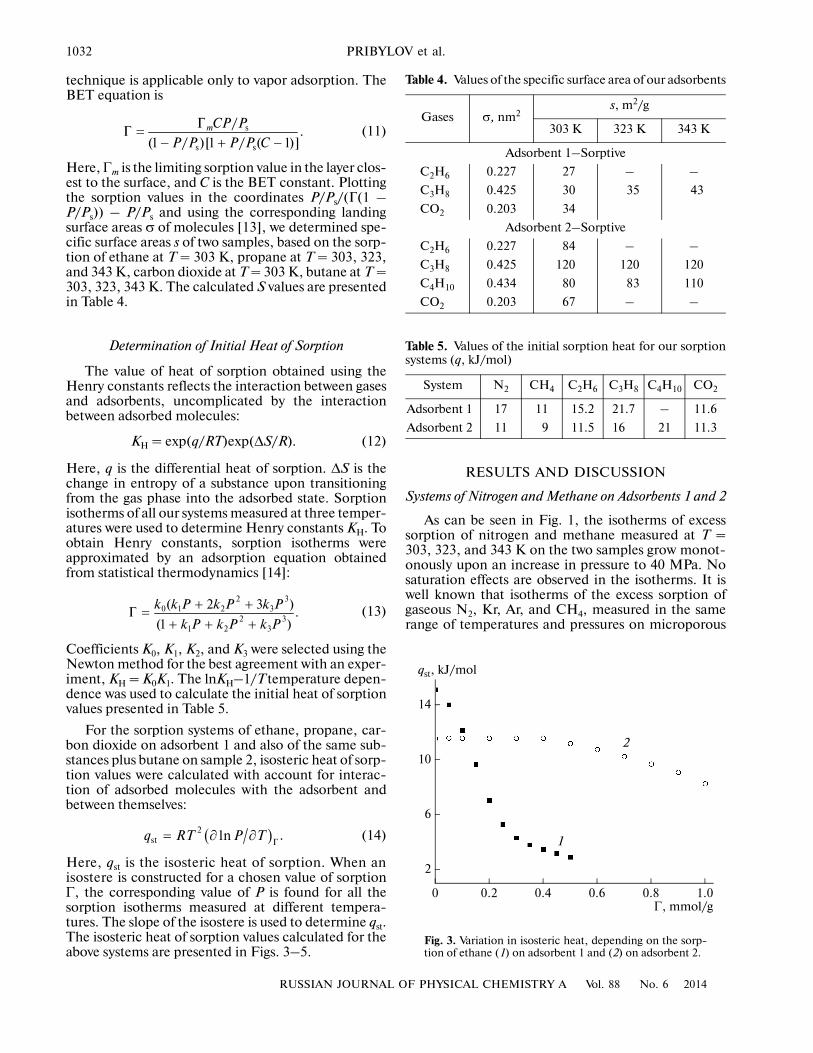
qst, kJ/mol
Fig. 3. Variation in isosteric heat, depending on the sorp�tion of ethane (1) on adsorbent 1 and (2) on adsorbent 2.
RUSSIAN JOURNAL OF PHYSICAL CHEMISTRY A Vol. 88 No. 6 2014
SORPTION OF METHANE, ETHANE, PROPANE, BUTANE, CARBON DIOXIDE 1033
adsorbents of different chemical composition (zeo�lites, activated carbons, polymers) and on adsorbentswith developed mesoporosity (layered silicates) [15–19], differ qualitatively from the sorption isothermsconsidered in this work. The isotherms of excess gasadsorption on these adsorbents grow with an increasein pressure, pass through a maximum, diminish, andeven reach zero values. The shape of the excess sorp�tion isotherms of nitrogen and methane on the twoadsorbents indicates there is no significant fraction ofmicropores, and that gas sorption occurs on them as itdoes on a nonporous surface.
The specific surface area values of the two adsor�bents (Table 4), determined on the basis of sorptionisotherms of ethane, propane, butane, and carbondioxide on the two samples, have values correspondingto nonporous adsorbents. As seen from Fig. 1, thesorption of nitrogen on adsorbent 1 is higher than onsample 2 at all temperatures, even though the specificsurface area of adsorbent 1 is approximately half thesize (Table 4). The heat of sorption for nitrogen ishigher on sample 1 than on sample 2 (Table 5). Thehigher heat of sorption on sample 1 (Table 5) is due tothe contribution to the heat of sorption of interactionbetween nitrogen molecules and the rock; the contentof the latter in adsorbent 1 is much higher than in sam�ple 2 (Table 1). When nitrogen is sorbed on samples 1and 2 (Fig. 1) at intermediate and high pressures, devi�ations are observed from the temperature dependenceof sorption upon an increase in temperature; i.e., thesorption value stops falling upon an increase in tem�perature, as it does on rigid adsorbents. In contrast, itgrows, which is especially noticeable for sample 1.
We may assume that the increase in sorption upona rise in temperature is related to the diffusion of nitro�gen molecules into pores of the rock that were inacces�sible at lower temperatures (the process of activatedsorption). Nitrogen sorption by the high�molecular
kerogen compound most likely grows upon anincrease in temperature and in pressure; i.e., nitrogenmolecules diffuse into the kerogen matrix. Thisassumption is confirmed by this effect being muchstronger for adsorbent 2 with high kerogen content(Fig. 1a and Table 1). It can be seen more clearly in thecase of methane sorption (Fig. 1b). As can be seenfrom Fig. 1b, methane is sorbed better on sample 2with its high kerogen content (Table 1), but this isrelated to the chemical composition of adsorbentsrather than to the energy characteristics of methanesorption (the heat of sorption) (Table 5). As with nitro�gen sorption, an increase in temperature results in ele�vated methane sorption on the two samples. Thiseffect is stronger on adsorbent 2 with its higher kero�gen content.
Based on the above data, we may conclude that thesorption of nitrogen on the two adsorbents (1 and 2) isaffected more strongly by the energy between the gasmolecules and the rock (rather than the kerogen).However, it is the specific interaction between the gasmolecules and the kerogen (rather than their energycharacteristics) that produce this effect in methanesorption, also distinguishing the sorption of thesegases on kerogen from their sorption on such solidadsorbents as nonporous carbon blacks.
Systems of Ethane, Propane, Butane, and Carbon Dioxide on Adsorbents 1 and 2
As can be seen in Fig. 2, the excess sorption iso�therms of ethane, propane, butane, and carbon diox�ide at all temperatures on the two sorbents display anormal temperature dependence, as opposed to thesorption isotherms of N2 and СН4. The sorption valuesfor all substances on sample 2 with its high kerogencontent are much higher than on sample 1. As can beseen in Table 4, the values of the specific surface area
0.50.40.30.110
14
22
1
2
0.2Γ, mmol/g
0
18
qst, kJ/mol
3
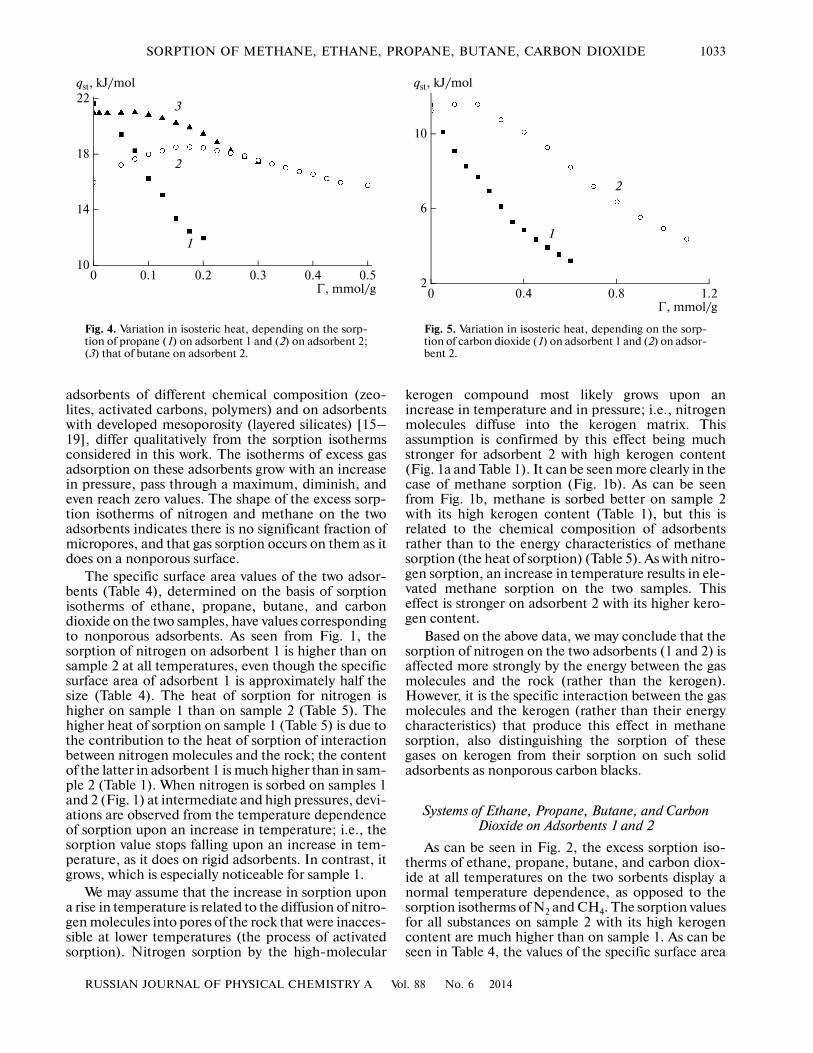
Fig. 4. Variation in isosteric heat, depending on the sorp�tion of propane (1) on adsorbent 1 and (2) on adsorbent 2;(3) that of butane on adsorbent 2.
1.20.80.42
6
1
2
Γ, mmol/g0
10
qst, kJ/mol
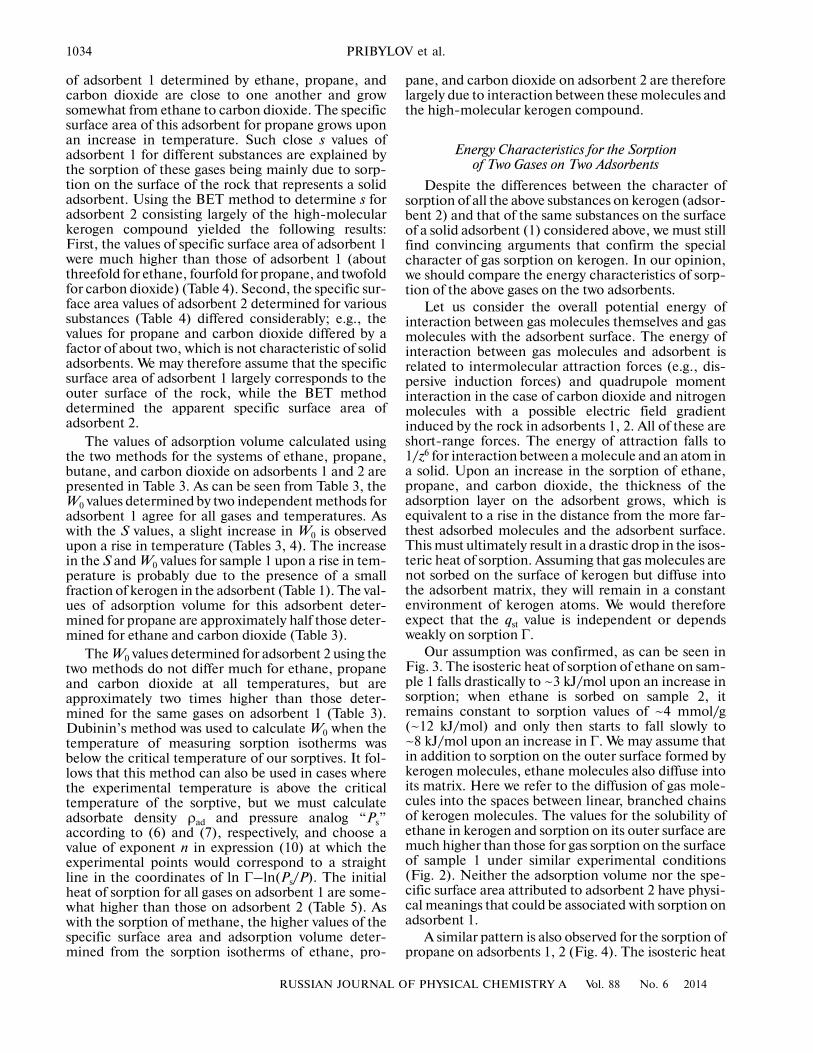
Fig. 5. Variation in isosteric heat, depending on the sorp�tion of carbon dioxide (1) on adsorbent 1 and (2) on adsor�bent 2.
1034
RUSSIAN JOURNAL OF PHYSICAL CHEMISTRY A Vol. 88 No. 6 2014
PRIBYLOV et al.
of adsorbent 1 determined by ethane, propane, andcarbon dioxide are close to one another and growsomewhat from ethane to carbon dioxide. The specificsurface area of this adsorbent for propane grows uponan increase in temperature. Such close s values ofadsorbent 1 for different substances are explained bythe sorption of these gases being mainly due to sorp�tion on the surface of the rock that represents a solidadsorbent. Using the BET method to determine s foradsorbent 2 consisting largely of the high�molecularkerogen compound yielded the following results:First, the values of specific surface area of adsorbent 1were much higher than those of adsorbent 1 (aboutthreefold for ethane, fourfold for propane, and twofoldfor carbon dioxide) (Table 4). Second, the specific sur�face area values of adsorbent 2 determined for varioussubstances (Table 4) differed considerably; e.g., thevalues for propane and carbon dioxide differed by afactor of about two, which is not characteristic of solidadsorbents. We may therefore assume that the specificsurface area of adsorbent 1 largely corresponds to theouter surface of the rock, while the BET methoddetermined the apparent specific surface area ofadsorbent 2.
The values of adsorption volume calculated usingthe two methods for the systems of ethane, propane,butane, and carbon dioxide on adsorbents 1 and 2 arepresented in Table 3. As can be seen from Table 3, theW0 values determined by two independent methods foradsorbent 1 agree for all gases and temperatures. Aswith the S values, a slight increase in W0 is observedupon a rise in temperature (Tables 3, 4). The increasein the S and W0 values for sample 1 upon a rise in tem�perature is probably due to the presence of a smallfraction of kerogen in the adsorbent (Table 1). The val�ues of adsorption volume for this adsorbent deter�mined for propane are approximately half those deter�mined for ethane and carbon dioxide (Table 3).
The W0 values determined for adsorbent 2 using thetwo methods do not differ much for ethane, propaneand carbon dioxide at all temperatures, but areapproximately two times higher than those deter�mined for the same gases on adsorbent 1 (Table 3).Dubinin’s method was used to calculate W0 when thetemperature of measuring sorption isotherms wasbelow the critical temperature of our sorptives. It fol�lows that this method can also be used in cases wherethe experimental temperature is above the criticaltemperature of the sorptive, but we must calculateadsorbate density ρаd and pressure analog “Ps”according to (6) and (7), respectively, and choose avalue of exponent n in expression (10) at which theexperimental points would correspond to a straightline in the coordinates of ln Γ–ln(Ps/P). The initialheat of sorption for all gases on adsorbent 1 are some�what higher than those on adsorbent 2 (Table 5). Aswith the sorption of methane, the higher values of thespecific surface area and adsorption volume deter�mined from the sorption isotherms of ethane, pro�
pane, and carbon dioxide on adsorbent 2 are thereforelargely due to interaction between these molecules andthe high�molecular kerogen compound.
Energy Characteristics for the Sorptionof Two Gases on Two Adsorbents
Despite the differences between the character ofsorption of all the above substances on kerogen (adsor�bent 2) and that of the same substances on the surfaceof a solid adsorbent (1) considered above, we must stillfind convincing arguments that confirm the specialcharacter of gas sorption on kerogen. In our opinion,we should compare the energy characteristics of sorp�tion of the above gases on the two adsorbents.
Let us consider the overall potential energy ofinteraction between gas molecules themselves and gasmolecules with the adsorbent surface. The energy ofinteraction between gas molecules and adsorbent isrelated to intermolecular attraction forces (e.g., dis�persive induction forces) and quadrupole momentinteraction in the case of carbon dioxide and nitrogenmolecules with a possible electric field gradientinduced by the rock in adsorbents 1, 2. All of these areshort�range forces. The energy of attraction falls to1/z6 for interaction between a molecule and an atom ina solid. Upon an increase in the sorption of ethane,propane, and carbon dioxide, the thickness of theadsorption layer on the adsorbent grows, which isequivalent to a rise in the distance from the more far�thest adsorbed molecules and the adsorbent surface.This must ultimately result in a drastic drop in the isos�teric heat of sorption. Assuming that gas molecules arenot sorbed on the surface of kerogen but diffuse intothe adsorbent matrix, they will remain in a constantenvironment of kerogen atoms. We would thereforeexpect that the qst value is independent or dependsweakly on sorption Γ.
Our assumption was confirmed, as can be seen inFig. 3. The isosteric heat of sorption of ethane on sam�ple 1 falls drastically to ~3 kJ/mol upon an increase insorption; when ethane is sorbed on sample 2, itremains constant to sorption values of ~4 mmol/g(~12 kJ/mol) and only then starts to fall slowly to~8 kJ/mol upon an increase in Γ. We may assume thatin addition to sorption on the outer surface formed bykerogen molecules, ethane molecules also diffuse intoits matrix. Here we refer to the diffusion of gas mole�cules into the spaces between linear, branched chainsof kerogen molecules. The values for the solubility ofethane in kerogen and sorption on its outer surface aremuch higher than those for gas sorption on the surfaceof sample 1 under similar experimental conditions(Fig. 2). Neither the adsorption volume nor the spe�cific surface area attributed to adsorbent 2 have physi�cal meanings that could be associated with sorption onadsorbent 1.
A similar pattern is also observed for the sorption ofpropane on adsorbents 1, 2 (Fig. 4). The isosteric heat
RUSSIAN JOURNAL OF PHYSICAL CHEMISTRY A Vol. 88 No. 6 2014
SORPTION OF METHANE, ETHANE, PROPANE, BUTANE, CARBON DIOXIDE 1035
on adsorbent 1 falls drastically to ~12 kJ/mol upon anincrease in the sorption of propane. In contrast to thesorption of ethane, an increase in isosteric heat isobserved in the dependence of qst upon the sorption ofpropane on sample 2 in Fig. 4, due to the interactionbetween adsorbed molecules. With an increase in thesorption of propane, qst falls to the initial heat of sorp�tion of 16 kJ/mol (Fig. 4, Table 5). As can be seen inFig. 4, the isosteric heats for butane sorption (Тс =425.16 K) on adsorbent 2 are higher at low adsorptionvalues than the adheats of sorption of ethane and pro�pane on this adsorbent. Upon an increase in sorption,the isosteric heat falls to values corresponding to thesorption of propane on this sample, i.e., to~17 kJ/mol. Sorption on its outer surface and the sol�ubility of propane in the bulk of kerogen (sample 2) ismuch higher than sorption on a rock surface (adsor�bent 1).
When carbon dioxide is sorbed on adsorbents 1and 2, the behavior of the isosteric heat (depending onsorption) differs somewhat from that of qst in the sorp�tion of ethane and propane on these adsorbents(Fig. 5). As in the sorption of ethane and propane, theisosteric heat on sample 1 also falls rapidly to~3 kJ/mol upon an increase in the sorption of carbondioxide. On adsorbent 2, the isosteric heat falls to~4 kJ/mol faster than qst for the sorption of ethane andpropane on this sample, depending on the sorption ofcarbon dioxide. When ethane, propane, and butanemolecules interact with kerogen (adsorbent 2), theaffinity of these molecules (i.e., the structure of themolecules and arrangement of C and H atoms inthem) to branched kerogen molecules is observed thatis not characteristic of carbon dioxide, as follows fromcomparing the qst dependences in Figs. 3–5. Such ananalysis cannot be performed for the systems of N2,CH4, and adsorbents 1 and 2, since there are devia�tions in the temperature dependences of the sorptionisotherms (Fig. 1).
As can be seen in the dependences of the isostericheat upon the sorption of ethane, propane, and car�bon dioxide on two adsorbents, and of butane onsample 2, the sorption of these gases on adsorbent 1occurs in a manner similar to adsorption on a smoothsolid adsorbent surface. Adsorption layer thicknessh = W0/s can be estimated for ethane, propane, andcarbon dioxide and ρаd can be used (e.g., for T =303 K (Table 2)) to calculate the effective size ofthese molecules l = (М/(ρаdNa))1/3 (where Na is theAvogadro constant) and the number of statistical lay�ers within the adsorption volume. This estimateyields five layers for the sorption of ethane, two forthe sorption of propane, and five for the sorption ofcarbon dioxide on sample 1.
The number of layers of adsorbed molecules adher�ing tightly to the surface must be characterized byproperties close to those of a liquid in equilibrium withthe gas phase. It is well known that heat of condensa�tion (evaporation) qcond depends on temperature. For
ethane (Тс = 305.5 K), qcond = 3.14 kJ/mol at T =303 K [19], which is close to the isosteric heat ofethane sorption at maximum sorption on sample 1(Fig. 3). The heat of condensation for propane (Тс =369.99 K) is 14.49 kJ/mol at T = 303 K [19] and theisosteric heat at maximum sorption (two layers) is~12.4 kJ/mol (Fig. 4). For carbon dioxide (Тс =304.19 K), qcond = 2.645 kJ/mol at T = 303 K [19] andisosteric heat of sorption at maximum coverage (fivelayers) tends to 3 kJ/mol (Fig. 5).
CONCLUSIONS
The following conclusions may be drawn on thebasis of the above material on the sorption of nitrogen,methane, ethane, propane, carbon dioxide, andbutane on adsorbents with different contents of ourhigh�molecular kerogen compound:
Not only is there sorption of the above gases on theouter surface formed by kerogen molecules, gases aredissolved in its bulk. The heat of sorption of ethane,propane, butane in kerogen is much higher than thecondensation heat of these gases. The amounts ofgases sorbed and dissolved in kerogen are much higherthan sorption of these gases on a surface of rock. Gassorption on rock occurs according to the mechanismof gas adsorption on a nonporous smooth surface of asolid adsorbent. The adheat of sorption of gases onrock is determined at low sorption values by adsor�bate–adsorbent interactions. Upon a further increasein sorption, it falls to the value of the condensationheat.
REFERENCES
1. A. N. Dmitrievskii, A. A. Pribylov, N. A. Skibitskaya,et al., Russ. J. Phys. Chem. A 80, 1099 (2006).
2. A. A. Pribylov and H. F. Stoeckli, Russ. J. Phys. Chem.A 72, 244 (1998).
3. V. V. Sychev, A. A. Vasserman, V. A. Zagoruichenko,et al., Thermodynamical Properties of Methane (Izd�voStandartov, Moscow, 1979) [in Russian].
4. V. V. Sychev, A. A. Vasserman, V. A. Zagoruichenko,et al., Thermodynamical Properties of Ethane (Izd�voStandartov, Moscow, 1982) [in Russian].
5. V. V. Sychev, A. A. Vasserman, A. D. Kozlov, Thermody�namic Properties of Nitrogen (Izd. Standartov, Moscow,1977) [in Russian].
6. N. B. Vargaftic, Handbook of Thermophysical Propertiesof Gases and Liquids (Nauka, Moscow, 1972) [in Rus�sian].
7. A. A. Pribylov, I. A. Kalinnikova, and L. G. Shekhov�tsova, Russ. Chem. Bull. 59, 2017 (2010).
8. M. P. Malkov, N. B. Danilov, A. G. Zel’dovich, andA. B. Fradkov, Handbook on Physicotechnical Funda�mentals of Deep Freezing (Energiya, Moscow, 1973) [inRussian].
9. N. O. Bokhvalov, N. P. Zhidkov, and G. M. Kabel’kov,Numerical Methods (Nauka, Moscow, 1987) [in Rus�sian].
1036
RUSSIAN JOURNAL OF PHYSICAL CHEMISTRY A Vol. 88 No. 6 2014
PRIBYLOV et al.
10. M. M. Dubinin and E. G. Zhukovskaya, Russ. Chem.Bull. 8, 1636 (1959).
11. M. M. Dubinin and V. A. Astakhov, Russ. Chem. Bull.20, 3 (1971).
12. S. F. Grebennikov and A. T. Kynin, Zh. Prikl. Khim.55, 2299 (1982).
13. A. L. McClellan and H. F. Hernsberger, J. ColloidInterface Sci. 23, 577 (1967).
14. V. A. Bakaev, Dokl. Akad. Nauk SSSR 167, 369 (1966).15. A. A. Pribylov, V. V. Serpinski, and S. M. Kalashnikov,
Zeolites 11, 846 (1991).
16. A. A. Pribylov and T. S. Yakubov, Russ. Chem. Bull. 45,1078 (1996).
17. An. A. Pribylov and Al. A. Pribylov, Russ. J. Phys.Chem. A 75, 1340 (2001).
18. A. A. Pribylov, S. Z. Muminov, I. A. Kalinnikova, et al.,Russ. Chem. Bull. 57, 2460 (2008).
19. R. Reid and T. Sherwood, The Properties of Gases andLiquids (McGraw�Hill, New York, 1958; Khimiya,Leningrad, 1971).
Translated by M. Ehrenburg