sonochemical digestion of soil and sediment samples
TRANSCRIPT

PNNL-16036
Sonochemical Digestion of Soil and Sediment Samples
S. I. Sinkov
G. J. Lumetta
October 2006 Prepared for the U.S. Department of Energy under Contract DE-AC05-76RL01830

DISCLAIMER This report was prepared as an account of work sponsored by an agency of the United States Government. Neither the United States Government nor any agency thereof, nor Battelle Memorial Institute, nor any of their employees, makes any warranty, express or implied, or assumes any legal liability or responsibility for the accuracy, completeness, or usefulness of any information, apparatus, product, or process disclosed, or represents that its use would not infringe privately owned rights. Reference herein to any specific commercial product, process, or service by trade name, trademark, manufacturer, or otherwise does not necessarily constitute or imply its endorsement, recommendation, or favoring by the United States Government or any agency thereof, or Battelle Memorial Institute. The views and opinions of authors expressed herein do not necessarily state or reflect those of the United States Government or any agency thereof. PACIFIC NORTHWEST NATIONAL LABORATORY operated by BATTELLE for the UNITED STATES DEPARTMENT OF ENERGY under Contract DE-ACO5-76RL01830
Printed in the United States of America
Available to DOE and DOE contractors from the Office of Scientific and Technical Information,
P.O. Box 62, Oak Ridge, TN 37831-0062; ph: (865) 576-8401 fax: (865) 576 5728
email: [email protected]
Available to the public from the National Technical Information Service, U.S. Department of Commerce, 5285 Port Royal Rd., Springfield, VA 22161
ph: (800) 553-6847 fax: (703) 605-6900
email: [email protected] online ordering: http://www.ntis.gov/ordering.htm

PNNL-16036
i
Sonochemical Digestion of Soil and Sediment Samples S. I. Sinkov G. J. Lumetta October 2006 Prepared for the U.S. Department of Energy under Contract DE-AC05-76RL01830 Pacific Northwest National Laboratory Richland, Washington 99352

iii
Summary
This work was performed as part of a broader effort to automate analytical methods for determination of plutonium and other radioisotopes in environmental samples. The work described here represented a screening study to determine the potential for applying ultrasonic irradiation to sample digestion. Two standard reference materials (SRMs) were used in this study: Columbia River Sediment and Rocky Flats Soil. The key experiments performed are listed below along with a summary of the results.
SRM dissolution in HNO3. The action of nitric acid, regardless of its concentration and liquid-to-solid ratio, did not achieve dissolution efficiency better that 20%. The major fraction of natural organic matter (NOM) remained undissolved by this treatment. Sonication did not result in improved dissolution for the SRMs tested.
SRM dissolution in HF. The action of hydrofluoric acid at concentrations of 8 M and higher achieved much more pronounced dissolution (up to 97% dissolved for the Rocky Flats soil sample and up to 78% dissolved for the Columbia River Sediment sample). Dissolution efficiency remains constant for solid-to-liquid ratios of up to 0.05 to 1 and decreases for the higher loadings of the solid phase. Sonication produced no measurable effect in improving the dissolution of the samples compared with the control digestion experiments.
SRM dissolution in mixtures of HNO3 and HF. Combined treatment of the SRM by mixtures of HNO3 and HF showed inferior performance compared with the HF alone. An adverse effect of sonication was found for the Rocky Flats soil material, which became more noticeable at higher HF concentrations. Sonication of the Columbia River sediment samples had no positive effect in the mixed acid treatment.
The results indicate that applying ultrasound in an isolated cup horn configuration does not offer any advantage over conventional “heat and mix” treatment for dissolution of the soil and sediment based on the SRM examined here. This conclusion, however, is based on an approach that uses gravimetric analysis to determine gross dissolution efficiency. This approach does not allow any conclusion regarding the possible advantage of sonication in selective dissolution of plutonium traces incorporated into an inorganic or organic fraction of the samples. It would be necessary to perform further experiments (with inductively coupled plasma-mass spectrometry) to explore this possibility. The effect of sonication on the dissolution of pure plutonium oxide phases will be discussed in a separate report.


v
Acronyms
CRS Columbia River Sediment
DI deionized (water)
HF hydrofluoric acid
HNO3 nitric acid
ICP-MS inductively coupled plasma-mass spectrometry
LSC liquid scintillation counting
NIST National Institute of Standards and Technology
NOM natural organic matter
RFS Rocky Flats Soil
SRM standard reference material


vii
Acknowledgments
This work was funded by the National Nuclear Security Agency (NA-22). Pacific Northwest National Laboratory is operated by Battelle for the U.S. Department of Energy under Contract DE-AC05-76RL01830. The authors thank Wayne Cosby and Brian Rapko for their review of this manuscript.


ix
Contents
Summary ...................................................................................................................................................... iii
Acronyms...................................................................................................................................................... v
Acknowledgments.......................................................................................................................................vii
1.0 Introduction........................................................................................................................................ 1.1
2.0 Experimental ...................................................................................................................................... 2.1
3.0 Results and Discussion....................................................................................................................... 3.1
3.1 SRM Samples Dissolution in a Strong But Weakly Complexing Acid: HNO3 ......................... 3.1
3.2 SRM Samples Digestion in a Weak but Strongly Complexing Acid: HF.................................. 3.4
3.3 SRM Samples Dissolution in Mixtures of HNO3 and HF.......................................................... 3.5
4.0 Conclusions and Recommendations .................................................................................................. 4.1
5.0 References .......................................................................................................................................... 5.1
Tables
2.1. Composition of Standard Reference Materials Used in Digestions Experiments.............................. 2.3
2.2. Radionuclide Concentrations in the SRM Samples Used in Digestion Experiments As Reported by NIST (NIST Certificate 1980 and NIST Certificate 1981) ........................................... 2.3

x
Figures
2.1. a) Sonication Apparatus in a Cup Horn Configuration Used in this Project; b) Self- Centering Vial Holder........................................................................................................................ 2.1
2.2. Temperature Profile Measured Inside of a Cup Horn Water Bath During 60 min of Sonication Run at 46% of Full Power (dial setting at 40% of full scale) .......................................... 2.2
3.1. Visual Appearance of Sonicated and Control Samples of the SRM 4350B Samples in 8.0 M HNO3 after 60 min of Treatment............................................................................................. 3.2
3.2. Optical Absorbance Spectra of Nitric Acid Leachates from the SRM4350B Samples Shown in 3.1 after a 10-Fold Dilution in 8 M HNO3......................................................................... 3.2
3.3. Dissolution Efficiency of the SRM 4350B (CRS) and SRM 4353 (RFS) Samples in 8 M HNO3 (liquid-to-solid ratio varies from 80:1 to 5:1 for 12.5- mg to 200-mg amounts of soil sample, respectively) .............................................................................................................. 3.3
3.4. Dissolution Efficiency of the SRM 4350B (CRS) and SRM 4353 (RFS) Samples in HNO3 (liquid-to-solid ratio is approximately 20:1 based on mixing 50 mg of SRM with 1.0 mL of acid)................................................................................................................................... 3.4
3.5. Dissolution Efficiency of the SRM 4350B (CRS) and SRM 4353 (RFS) Samples in HF (liquid-to-solid ratio is 20:1).............................................................................................................. 3.5
3.6. Dissolution Efficiency of the SRM 4350B (CRS) and SRM 4353 (RFS) Samples in 14 M HF (liquid-to-solid ratio varies from 80:1 to 5:1 (mL:mg) for 12.5 mg to 200 mg amounts of soil sample, respectively) .............................................................................................................. 3.5
3.7. Dissolution Efficiency of the SRM 4350B (CRS) and SRM 4353 (RFS) Samples in a Mixture of HNO3 and HF. ................................................................................................................. 3.6
3.8. Dissolution Efficiency of the SRM 4350B (CRS) and SRM 4353 (RFS) Samples in a Mixture of HNO3 and HF .................................................................................................................. 3.7

1.1
1.0 Introduction
The application of ultrasound in chemistry (i.e., sonochemistry) has evolved over the last two decades. Introducing ultrasonic waves into a liquid such as water creates microbubbles that collapse implosively, forming localized “hot spots.” This phenomenon is generally referred to as cavitation. The interesting feature of the cavitation effect is that the temperatures in the hot spots are roughly 5,000°C with pressures of several hundred atmospheres, but the bulk solution conditions remain at near ambient conditions (Suslick 1988). The extreme localized temperature and pressure conditions caused by acoustic cavitation can open up reaction pathways that are not easily accessible otherwise.
Most studies on the application of ultrasound in chemistry have been performed on homogeneous aqueous samples or on aqueous samples containing tiny amounts of suspended material with a liquid-to-solid mass ratio in the range of 1000 to 1 (mL/mg) or higher (natural organic matter [NOM] or inorganic colloids). Much less information is available on effect of ultrasound on the dissolution of macroamounts of soil- and sediment-based materials in a comparable volume of inorganic acid or other leaching agent with a liquid-to-solid mass ratio of 20:1 (1 mL to 50 mg) and less.
In these materials, plutonium and other transuranic contaminants, if present at trace quantities, do not form their own phases (excluding hot particles), but might be associated both with an organic fraction of the sample (silt and/or humic substances, plant decay residues) and inorganic minerals (iron oxides/hydroxides, alumosilicates, sand [quartz] and other components of an inorganic nature). There are several standard reference materials of environmental origin available from the National Institute of Standards and Technology (NIST) that contain ultratrace amounts of Pu and other actinides. Unfortunately, the contamination levels of transuranic elements in these materials are too low (< 8 mBq/g, or less than 3.5 pg of 239Pu/g of soil) to be reliably detected by standard radiometric counting techniques (e.g., liquid scintillation counting [LSC]). For LSC counting to be capable of determining Pu levels in these samples, high amounts of standard reference material (SRM) (10 to 100 g scale) must be dissolved and a subsequent volume reduction or Pu pre-concentration must be performed before mixing with the LSC cocktail. Nevertheless, we decided to select NIST SRMs to study the effect of sonication on the dissolution of soil-like matrixes in acidic solutions rather than to prepare “synthetic” soil mimicking samples doped with much higher concentrations of Pu. With synthetic preparation, it is very difficult to recreate a migration prehistory of initially soluble Pu and its sorption/ incorporation paths onto/into the synthetic soil components.
In these experiments, the efficiency of dissolution was calculated simply by comparing the amount of residue remaining after digestion with the initial amount of material. This approach does not provide any information about the extent of dissolution of transuranic and fission product contaminants, but it does help to monitor the dissolution behavior of major components of the sample. Two kinds of NIST standard reference materials have been tested in the course of this project:
• SRM 4350B (Columbia River sediment)
• SRM 4353 (soil sample collected from Rocky Flats, Colorado)
A detailed description of these samples, including mineralogical and radionuclide composition, is given in the Experimental section.
2.1
2.0 Experimental
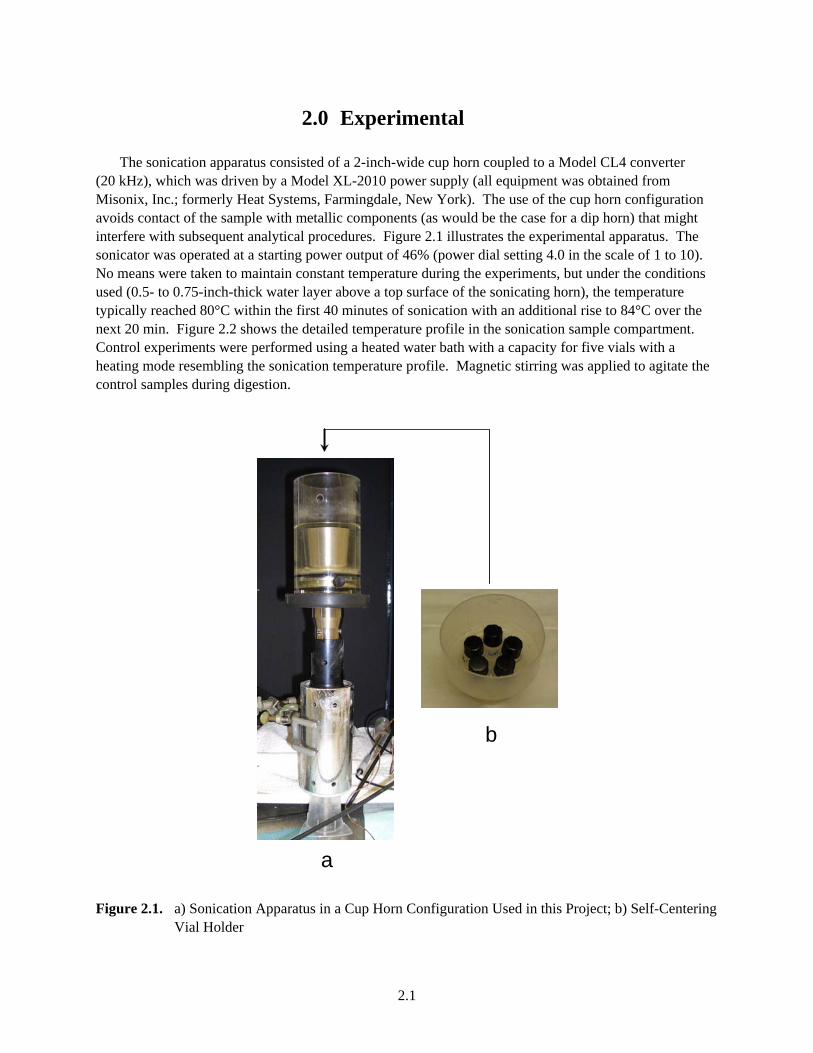
The sonication apparatus consisted of a 2-inch-wide cup horn coupled to a Model CL4 converter (20 kHz), which was driven by a Model XL-2010 power supply (all equipment was obtained from Misonix, Inc.; formerly Heat Systems, Farmingdale, New York). The use of the cup horn configuration avoids contact of the sample with metallic components (as would be the case for a dip horn) that might interfere with subsequent analytical procedures. Figure 2.1 illustrates the experimental apparatus. The sonicator was operated at a starting power output of 46% (power dial setting 4.0 in the scale of 1 to 10). No means were taken to maintain constant temperature during the experiments, but under the conditions used (0.5- to 0.75-inch-thick water layer above a top surface of the sonicating horn), the temperature typically reached 80°C within the first 40 minutes of sonication with an additional rise to 84°C over the next 20 min. Figure 2.2 shows the detailed temperature profile in the sonication sample compartment. Control experiments were performed using a heated water bath with a capacity for five vials with a heating mode resembling the sonication temperature profile. Magnetic stirring was applied to agitate the control samples during digestion.
a)
b
Figure 2.1. a) Sonication Apparatus in a Cup Horn Configuration Used in this Project; b) Self-Centering Vial Holder

2.2
020406080
100
0:00 0:28 0:57 1:26
Time, min
Tem
pera
ture
, oC
Figure 2.2. Temperature Profile Measured Inside of a Cup Horn Water Bath During 60 min of Sonication Run at 46% of Full Power (dial setting at 40% of full scale)
Ultraviolet-visible (UV/vis) spectrophotometric measurements of selected leachate solutions were made on a 400-Series Charge Coupled Device Array Spectrophotometer (Spectral Instruments, Inc.). The solutions for analysis were retrieved from the sonication vessel (or control vial) in 100-μL aliquots, followed by a 10-fold dilution in the same solvent and transfer into plastic cells with a pathlength of 10 mm. In SRM dissolution experiments, the amount of soil material taken for dissolution (typically within the 12- to 200-mg range) was determined with a 0.1-mg uncertainty using a four-place balance.
The chemical and radionuclide composition of NIST standard reference materials tested in the course of this project is compiled in Table 2.1 and Table 2.2, respectively.
The amount of residue after digestion was determined after removing 95% of the leaching solution above the centrifuged solids followed by washing the wet residue with 1 mL of deionized (DI) water and similarly removing 95% of the rinsate. The rinsed samples with remaining liquid were left to air dry in a fume hood. A high linear air flow rate created by lowering the fume hood sash accelerated the samples’ drying time. The residual weight was determined 2.5 days after the samples were exposed to the air flow. Dissolution efficiency was calculated by comparing the weights of the tested SRM before and after digestion. There were no attempts to measure the dissolved Pu concentration in the leachates by LSC counting because of the very low activity of Pu in the leach solution (even in case of a hypothetical 100% dissolution) and a very strong interference to the Pu signal from much more abundant natural alpha emitters for which the LSC counting provides no adequate energy resolution (see Table 2.2).

2.3
Table 2.1. Composition of Standard Reference Materials Used in Digestions Experiments. The numbers below are based on semi-quantitative emission spectrographic analysis as reported by NIST (NIST Certificate 1980 and NIST Certificate 1981)
Fraction, % Major Components Recalculated as Oxides SRM 4350B (Columbia River Sediment) SRM 4353 (Rocky Flats soil)
SiO2 > 73 > 73 Al2O3 17 13 Fe2O3 9.5 5.7 MgO 2.7 0.49 CaO 3.5 0.92 Na2O 2.9 1.1 K2O > 1.8 > 1.8 TiO2 1.0 0.33 P2O5 < 0.16 < 0.19 MnO 0.085 0.072
Note 1: The relative uncertainty for each reported concentration is plus 50% and minus 33%.
Note 2: For the SRM-4353 sample, semi-quantitative mineralogical composition data by X-ray diffraction measurements are available which show that the sample is composed of quartz (55–60 wt.%), clays (25–30%), alkali feldspar (5–10%), and plagioclase (5%).
Table 2.2. Radionuclide Concentrations in the SRM Samples Used in Digestion Experiments As Reported by NIST (NIST Certificate 1980 and NIST Certificate 1981)
Activity Concentration, mBq/gRadionuclide SRM 4350B SRM 4353
40K - 723 90Sr - 7.63 60Co 4.64 - 137Cs 29 17.6 152Eu 30.5 - 154Eu 3.78 - 226Ra 35.8 43.0 228Ac - 69.8 228Th - 70.8 230Th - 44.3 232Th - 69.3 234U - 39.1 238U - 38.9 238Pu 0.013 0.166(a)
239Pu+240Pu 0.508 8.03(a) 241Am 0.15 1.25(a)
(a) Excluding hot particles.
3.1
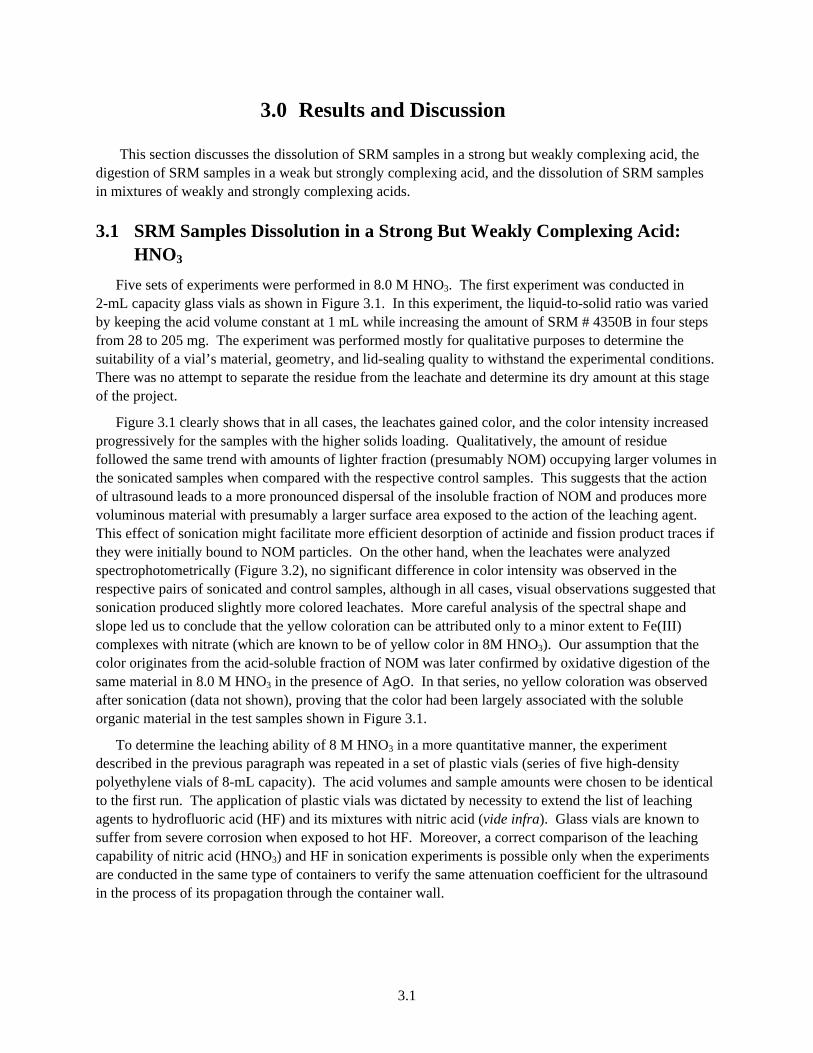
3.0 Results and Discussion
This section discusses the dissolution of SRM samples in a strong but weakly complexing acid, the digestion of SRM samples in a weak but strongly complexing acid, and the dissolution of SRM samples in mixtures of weakly and strongly complexing acids.
3.1 SRM Samples Dissolution in a Strong But Weakly Complexing Acid: HNO3
Five sets of experiments were performed in 8.0 M HNO3. The first experiment was conducted in 2-mL capacity glass vials as shown in Figure 3.1. In this experiment, the liquid-to-solid ratio was varied by keeping the acid volume constant at 1 mL while increasing the amount of SRM # 4350B in four steps from 28 to 205 mg. The experiment was performed mostly for qualitative purposes to determine the suitability of a vial’s material, geometry, and lid-sealing quality to withstand the experimental conditions. There was no attempt to separate the residue from the leachate and determine its dry amount at this stage of the project.
Figure 3.1 clearly shows that in all cases, the leachates gained color, and the color intensity increased progressively for the samples with the higher solids loading. Qualitatively, the amount of residue followed the same trend with amounts of lighter fraction (presumably NOM) occupying larger volumes in the sonicated samples when compared with the respective control samples. This suggests that the action of ultrasound leads to a more pronounced dispersal of the insoluble fraction of NOM and produces more voluminous material with presumably a larger surface area exposed to the action of the leaching agent. This effect of sonication might facilitate more efficient desorption of actinide and fission product traces if they were initially bound to NOM particles. On the other hand, when the leachates were analyzed spectrophotometrically (Figure 3.2), no significant difference in color intensity was observed in the respective pairs of sonicated and control samples, although in all cases, visual observations suggested that sonication produced slightly more colored leachates. More careful analysis of the spectral shape and slope led us to conclude that the yellow coloration can be attributed only to a minor extent to Fe(III) complexes with nitrate (which are known to be of yellow color in 8M HNO3). Our assumption that the color originates from the acid-soluble fraction of NOM was later confirmed by oxidative digestion of the same material in 8.0 M HNO3 in the presence of AgO. In that series, no yellow coloration was observed after sonication (data not shown), proving that the color had been largely associated with the soluble organic material in the test samples shown in Figure 3.1.
To determine the leaching ability of 8 M HNO3 in a more quantitative manner, the experiment described in the previous paragraph was repeated in a set of plastic vials (series of five high-density polyethylene vials of 8-mL capacity). The acid volumes and sample amounts were chosen to be identical to the first run. The application of plastic vials was dictated by necessity to extend the list of leaching agents to hydrofluoric acid (HF) and its mixtures with nitric acid (vide infra). Glass vials are known to suffer from severe corrosion when exposed to hot HF. Moreover, a correct comparison of the leaching capability of nitric acid (HNO3) and HF in sonication experiments is possible only when the experiments are conducted in the same type of containers to verify the same attenuation coefficient for the ultrasound in the process of its propagation through the container wall.

3.2
Figure 3.1. Visual Appearance of Sonicated and Control Samples of the SRM 4350B Samples in 8.0 M HNO3 after 60 min of Treatment. The solids were allowed to settle over 2.5 days. The left vial within each pair shows the control sample (heating in a water bath and occasional mechanical mixing), while the right one represents the sonicated sample. The amount of SRM for each pair from left to right are 28±1, 54± 2, 106±2, 156± 2, and 205± 1 mg. Note that the right vial in the leftmost pair developed a tiny crack in the process of sonication, and its content was entirely displaced by cooling water from the water bath.
Wavelength, nm340 360 380 400 420 440 460 480 500
Opt
ical
abs
orba
nce
0.0
0.2
0.4
0.6
0.8
1.0
With sonication (S02-S05)Without sonication (C01-C05)Sample C05 after treatment with hydrazine nitrate17 mM of Fe3+ in 8.0 M HNO3 120 mM Fe3+ in 8.0 M HNO3
Figure 3.2. Optical Absorbance Spectra of Nitric Acid Leachates from the SRM4350B Samples Shown in Figure 3.1 after a 10-Fold Dilution in 8 M HNO3
3.3
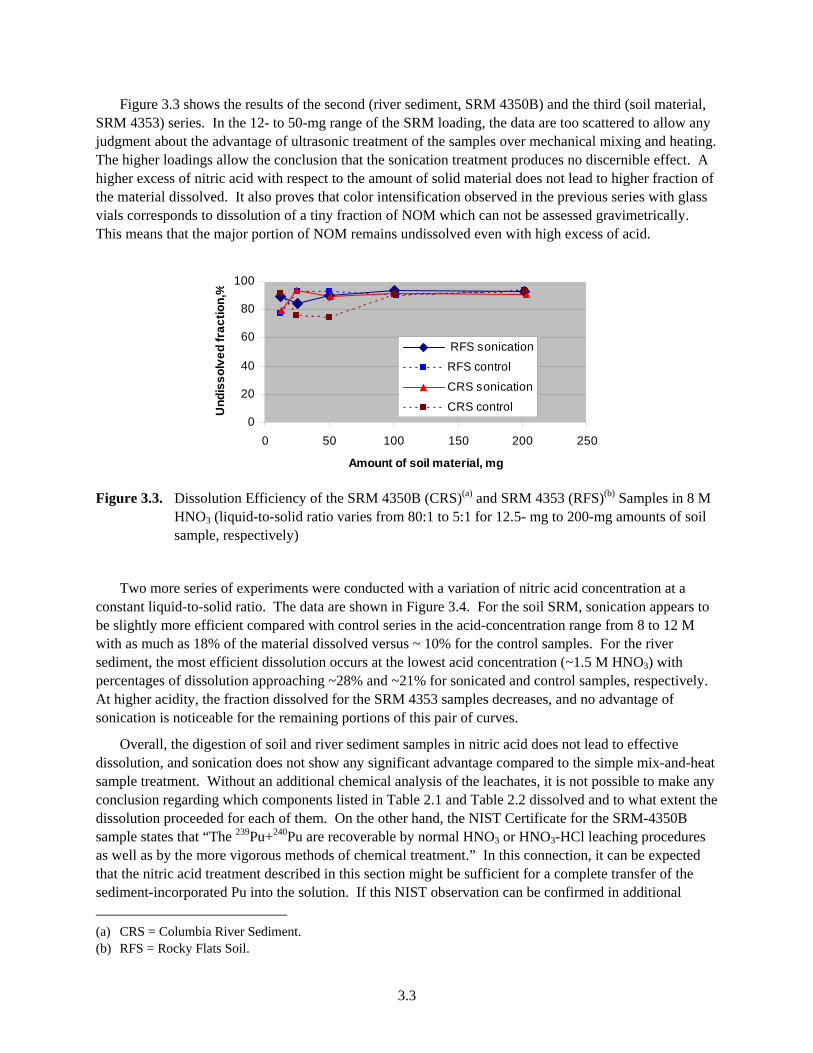
Figure 3.3 shows the results of the second (river sediment, SRM 4350B) and the third (soil material, SRM 4353) series. In the 12- to 50-mg range of the SRM loading, the data are too scattered to allow any judgment about the advantage of ultrasonic treatment of the samples over mechanical mixing and heating. The higher loadings allow the conclusion that the sonication treatment produces no discernible effect. A higher excess of nitric acid with respect to the amount of solid material does not lead to higher fraction of the material dissolved. It also proves that color intensification observed in the previous series with glass vials corresponds to dissolution of a tiny fraction of NOM which can not be assessed gravimetrically. This means that the major portion of NOM remains undissolved even with high excess of acid.
0
20
40
60
80
100
0 50 100 150 200 250
Amount of soil material, mg
Und
isso
lved
frac
tion,
%
RFS sonicationRFS control
CRS sonication
CRS control
Figure 3.3. Dissolution Efficiency of the SRM 4350B (CRS)(a) and SRM 4353 (RFS)(b) Samples in 8 M HNO3 (liquid-to-solid ratio varies from 80:1 to 5:1 for 12.5- mg to 200-mg amounts of soil sample, respectively)
Two more series of experiments were conducted with a variation of nitric acid concentration at a constant liquid-to-solid ratio. The data are shown in Figure 3.4. For the soil SRM, sonication appears to be slightly more efficient compared with control series in the acid-concentration range from 8 to 12 M with as much as 18% of the material dissolved versus ~ 10% for the control samples. For the river sediment, the most efficient dissolution occurs at the lowest acid concentration (~1.5 M HNO3) with percentages of dissolution approaching ~28% and ~21% for sonicated and control samples, respectively. At higher acidity, the fraction dissolved for the SRM 4353 samples decreases, and no advantage of sonication is noticeable for the remaining portions of this pair of curves.
Overall, the digestion of soil and river sediment samples in nitric acid does not lead to effective dissolution, and sonication does not show any significant advantage compared to the simple mix-and-heat sample treatment. Without an additional chemical analysis of the leachates, it is not possible to make any conclusion regarding which components listed in Table 2.1 and Table 2.2 dissolved and to what extent the dissolution proceeded for each of them. On the other hand, the NIST Certificate for the SRM-4350B sample states that “The 239Pu+240Pu are recoverable by normal HNO3 or HNO3-HCl leaching procedures as well as by the more vigorous methods of chemical treatment.” In this connection, it can be expected that the nitric acid treatment described in this section might be sufficient for a complete transfer of the sediment-incorporated Pu into the solution. If this NIST observation can be confirmed in additional (a) CRS = Columbia River Sediment. (b) RFS = Rocky Flats Soil.

3.4
experiments (e.g., using ICP-MS to determine the dissolved Pu), then a broad range of sediment-based materials in which the potential plutonium contamination occurred when an initially soluble or colloidal Pu-containing waste stream was dumped into a river or lake water can be conveniently processed by HNO3 treatment alone. This simple treatment would leave a substantial fraction of non-radioactive ballast material behind and allow less competition from a number of multicharged metal cations [Ti(IV), Zr(IV), Fe(III)] at the subsequent stages of Pu pre-concentration and isolation before analysis.
0
20
4060
80
100
120
0 5 10 15 20
Nitric acid concentration, M
Und
isso
lved
frac
tion,
% RFS sonication
RFS control
CRS sonication
CRS control
Figure 3.4. Dissolution Efficiency of the SRM 4350B (CRS) and SRM 4353 (RFS) Samples in HNO3 (liquid-to-solid ratio is approximately 20:1 based on mixing 50 mg of SRM with 1.0 mL of acid)
3.2 SRM Samples Digestion in a Weak but Strongly Complexing Acid: HF As can be seen from the Table 2.1 data, both of the SRM samples selected for this project are
composed mostly of the silicon-containing materials, including silica and alumosilicates, which are not soluble in nitric acid. Therefore, we chose to investigate the use of hydrofluoric acid to enhance the dissolution of these sample matrixes. First, the effect of HF concentration on dissolution efficiency was studied as depicted in Figure 3.5. No significant improvement in dissolution efficiency can be achieved by increasing the acid concentration above 8 M. The soil sample appears to be much more soluble in HF (with less than 5% of undissolved fraction) than the river sediment sample (22% of residue). This difference is most likely related to a higher percentage of NOM material in the sediment-rich material compared with the soil sample. NOM is not soluble in HF as the latter exhibits no oxidation power. Unfortunately, the NIST certificates do not give any information on the relative content of NOM in the tested samples to validate this assumption.
Figure 3.6 illustrates the dissolving capacity of 14 M HF as a function of the solid-to-liquid ratio. One can see that for the amount of SRM material up to 50 mg/mL of 14 M HF, the dissolved fraction remains constant within experimental uncertainty. For higher solids loadings, the fraction dissolved decreases linearly for the river-sediment sample and nonlinearly for the soil sample. Regarding the influence of ultrasound, there is an apparent enhancement in the dissolution of the Rocky Flats soil sample for the liquid-to-solid ratios from 80:1 to 20:1; however, at lower liquid-to-solid ratios, this effect becomes less noticeable. No sonochemical enhancement was observed for the dissolution of the Columbia River-sediment sample in 14 M HF. It is noteworthy that comparing the last two pairs of

3.5
points in Figure 3.5 with the third two pairs of points in Figure 3.6 proves that reproducibility of experimental results for the same acid strength and for the same loading (50 mg of SRM/1.0 mL of the acid solution) in experiments performed on different days is quite satisfactory for both types of SRM tested.
0
20
40
60
80
100
0 5 10 15
HF concentration, M
Undi
ssol
ved
fract
ion,
% RFS sonication
RFS control
CRS sonication
CRS control
Figure 3.5. Dissolution Efficiency of the SRM 4350B (CRS) and SRM 4353 (RFS) Samples in HF (liquid-to-solid ratio is 20:1)
0
20
40
60
80
100
0 50 100 150 200 250
Amount of soil material, mg
Und
isso
lved
frac
tion,
% RFS sonicationRFS controlCRS sonicationCRS control
Figure 3.6. Dissolution Efficiency of the SRM 4350B (CRS) and SRM 4353 (RFS) Samples in 14 M HF (liquid-to-solid ratio varies from 80:1 to 5:1 (mL:mg) for 12.5 mg to 200 mg amounts of soil sample, respectively)
3.3 SRM Samples Dissolution in Mixtures of HNO3 and HF As follows from the data discussed in the previous section, hydrofluoric acid is much more efficient
in dissolving the silicate-rich natural samples than nitric acid. On the other hand, it has been recently reported (Garcia et al. 2001) that complete dissolution (>99.9%) of soil samples with a closed vessel microwave oven system requires a two-step treatment: 14 M HF is applied in the first step (45 mL of the solution per 3 g of soil) followed by 4 M HNO3 saturated with boric acid (60 mL per remaining amount of the soil sample). It was of interest in this project to examine the action of these two acids as a single

3.6
treatment step by applying wider concentration ranges for the both acids. We chose to perform basically two major series of experiments with variations of the HF-to-HNO3 ratio:
• Constant concentration of HNO3 at 8 M with HF variation from 2.8 M to 14 M • Constant HF concentration at 14 M with HNO3 variation from 1.8 M to 8 M.
Generally speaking, a mixture of a strong but poorly complexing acid with oxidative action (HNO3)
with a weak (pKa = 3.1) but strongly complexing acid (HF) should offer some advantage over a single acid treatment for dissolving complex matrices when the dissolution mechanism involves both the complexing action of fluoride and the action of a high concentration of free protons. On the other hand, a high concentration of free protons might suppress the dissociation of HF and reduce the availability of F- for complexation.
Figure 3.7 shows data on the sample dissolution efficiency in HF+HNO3 mixtures at a fixed HNO3 concentration of 8 M. As the concentration of HF increases, there is a slight improvement in dissolution efficiency of the river sediment sample and a more pronounced effect for the Rocky Flats soil sample. Oddly, the sonication produces an inhibiting effect on the dissolving action of this acidic mixture compared with the control samples for both types of the standard reference materials, with the most pronounced difference observed for the last two pairs of points in the Rocky Flats sample curves. The reason for this inhibition effect is not clear.
Comparing the Figure 3.5 and Figure 3.7 data indicates a disadvantage of using the double acid mixture compared to using HF alone (at the same HF concentration), especially for the sonicated samples. The most likely reason for the inferior performance of the HF+HNO3 mixture is a suppressed dissociation of HF in the presence of a high concentration of free protons from 8 M HNO3. On the other hand, if a drop in the concentration of free fluoride ions were the only factor in reducing the dissolution ability of the HF+HNO3 mixture, then an increase of the HNO3 concentration at constant HF concentration should lead to suppression of the dissolving power. Figure 3.8 does not support this simple prediction. It appears that a nitric acid concentration has practically no effect on the dissolution efficiency of the Rocky Flats samples (with a slightly better dissolution yield at 3.5 M and 8 M concentrations of HNO3). With the river sediment samples, the best result is indeed achieved at the lowest HNO3 concentration, but the magnitude of the subsequent changes is too small to derive any significant effect from the observed trend. For both samples, sonication produced no measurable improvement in dissolution, but it did not show the adverse effect noted in the previous figure.
0
20
40
60
80
100
0 5 10 15HF concentration, M
Und
isso
lved
frac
tion,
%
RFS sonication
RFS control
CRS sonication
CRS control
Figure 3.7. Dissolution Efficiency of the SRM 4350B (CRS) and SRM 4353 (RFS) Samples in a
Mixture of HNO3 and HF. The HNO3 concentration is maintained constant at 8 M (liquid-to-solid ratio is 20:1 (mL:mg) for all samples).

3.7
0
20
40
60
80
100
0 2 4 6 8 10
Nitric acid concentration, M
Undi
ssol
ved
resi
due,
% RFS sonication
RFS control
CRS sonication
CRS control
Figure 3.8. Dissolution Efficiency of the SRM 4350B (CRS) and SRM 4353 (RFS) Samples in a Mixture of HNO3 and HF. The HF concentration is maintained constant at 14 M (liquid-to-solid ratio is 20:1 (mL:mg) for all samples)

4.1
4.0 Conclusions and Recommendations
The major findings obtained in the course of this project can be summarized as follows:
• The action of nitric acid, regardless of its concentration and liquid-to-solid ratio, does not achieve dissolution efficiency better that 20%. The major fraction of NOM remained undissolved by this treatment. Sonication resulted in no improvement for either of the samples examined here.
• The action of hydrofluoric acid at concentrations of 8 M and higher achieved much more pronounced dissolution (up to 97% dissolved for the Rocky Flats soil sample and up to 78% dissolved for the Columbia River Sediment sample). The dissolution efficiency remained constant for solid-to-liquid ratios of up to 0.05 to 1 and decreased for the higher loadings of the solid phase. Sonication produced no measurable effect in improving the dissolution of the samples compared with the control digestion experiments.
• The combined treatment of the tested samples by mixtures of HNO3 and HF showed inferior performance compared with the HF alone. An adverse effect of sonication was found for the Rocky Flats soil material, which becomes more noticeable at higher HF concentrations. Sonication of the Columbia River sediment samples had no positive effect in the mixed acid treatment.
The results indicate that application of ultrasound in an isolated cup horn configuration does not offer any advantage over conventional “heat and mix” treatment for dissolving the soil- and sediment-based samples in inorganic acids. This conclusion however, is based on using gravimetric analysis to determine the efficiency of gross dissolution. This approach does not allow assessment of the possible advantage of sonication in the selective dissolution of plutonium traces incorporated into inorganic or organic fractions of the samples. Further experiments (with ICP-MS detection of Pu) would be necessary to verify this possibility.

5.1
5.0 References
Garcia R, and B Kahn. 2001. “Total Dissolution of Environmental and Biological Samples by closed vessel microwave digestion for radiometric analysis.” J. Radioanalyt. Nucl. Chem., 250(1):85-91.
National Institute for Standards and Technology (NIST). 1980. “National Bureau of Standards Certificate for Standard Reference Material.” Source ID 4353 (Rocky Flats Soil #1).
National Institute for Standards and Technology (NIST). 1981. “National Bureau of Standards Certificate for Standard Reference Material.” Source ID 4350B (River Sediment).
Suslick KS (Ed.). 1988. Ultrasound, its Chemical, Physical and Biological Effect. VCH Press, New York, NY.

PNNL-16036
5.1
Distribution No. of Copies OFFSITE
No. of Copies ONSITE
2 U.S. Department of Energy National Nuclear Security Agency (DOE/NA-22) Les Pitts NNSA/NA-22, GH-068 U.S. Department of Energy (Forrestal Bldg.) 1000 Independence Avenue, S.W. Washington, D.C. 20585 Alan Icenhour NNSA/NA-22, GH-068 U.S. Department of Energy (Forrestal Bldg.) 1000 Independence Avenue, S.W. Washington, D.C. 20585
1 Los Alamos National Laboratory
Pat Brug Los Alamos National Laboratory P.O. Box 1663 Los Alamos, NM 87545
12 Pacific Northwest National Laboratory S. Bonde P8-50 R. G. Clemmer K8-02 D. A. Dickman K8-46 G. B. Dudder K8-02 J. I. Friese P8-01 J. W. Grate K8-93 G. J. Lumetta P7-22 T. C. Maiti P7-07 M. J. O’Hara P7-22 S. L. Petersen P7-07 S. W. Sharpe K8-02 J. F. Wacker P7-07