sonic boom startle effects report of a field study...sonic boom startle effects-report of a field...
TRANSCRIPT

FAA-AM-73-11
SONIC BOOM STARTLE EFFECTS REPORT OF A FIELD STUDY
Richard I. Thackray, Ph.D.* Ragnar Rylander, M.D.**
R. Mark Touchstone, M.S.* *FAA Civil Aeromedical Institute
P .0. Box 25082 Oklahoma City, Oklahoma 73125
**National Swedish Environmental Protection Board Department of Environmental Hygiene
Stockholm, Sweden
July 1973
Availability is unlimited. Document may be released to the National Technical Information Service, Springfield, Virginia 22151, for sale to the public.
Prepared for
DEPARTMENT OF TRANSPORTATION FEDERAL AVIATION ADMINISTRATION
Office of Aviation Medicine Washington, D.C. 20591

1. Report No. '2:. Government Accession No .
FAA-AM-73-11 4. Title and Subtitle
SONIC BOOM STARTLE EFFECTS--REPORT OF A FIELD STUDY
7. Author( s)
Richard I. Thackray, Ph.D., Ragnar Rylander, M.D., and R. Mark Touchstone, M.S.
9 . Performing Organization Nome and Address
FAA Civil Aeromedical Institute P. 0. Box 25082 Oklahoma City, Oklahoma 73125
12. Sponsoring Agency Name and Addres•
Office of Aviation Medicine Federal Aviation Administration 800 Independence Avenue, S.W. Washington, D. C. 20591
15. Supplementary Notes
----------------~
This research was performed under Task AM-B-73-PSY-41.
16 . Abstract
TECHNICAL REPORT STANDARD TITLE PAGE
3. Recipient's Catalog No.
5 . Report Date
July 1973 6. Performing Organization Code
8. Performing Organization Report No.
10 . Work Unit No.
11. Contract or Grant No .
13. Type of Report and Period Covered
OAM Report
14. Sponsoring Agency Code
The present study reports the results of a sonic boom field study conducted in Sweden during October 1972. Ten female subjects were tested indoors on each of six days. Two age groups were studied: 20-35 and 50-65 years. Fighter aircraft flying at various heights over thz test site produced booms with outdoor overpressures ranging from 60-640 N/m . The number of booms extended from 5 to 13 per day. Subjects performed indoors on an arm-hand steadiness task. The results indicated that outdoor overpressures ranging from 70-120 N/m2 (26-35 N/m2 indoors) produced reflexive arm-hand movements in about 10 per cent of the subjects. Booms of 300 N/m2 (67 N/m2 indoors) and greater produced responses in about 75 per cent of the subjects. Between these extremes of overpressure there was the suggestion of a critical overpressure range lying between 150-180 N/m2 (40-46 N/m2 indoors) in which an abrupt increase in startle response occurred. In all aspects of the startle response studied, older subjects were less responsive than the younger ones. There was some evidence of response habituation to low and moderately intense booms, but not to high intensity booms.
17 . Key Words
Noise Performance Sonic Booms Startle
19. Security Closs i f. (of this report)
Unclassified
Form DOT F 1700.7 !B·691
18. Distribution Statement
Availability is unlimited. Document may be released to the National Technical Information Service, Springfield, Virginia 22151, for sale to the public.
20. Security Clossif. (of this page) 21. No. of Pages 22. Price
Unclassified 16 $3.00

ACKNOWLEDGMENTS
The authors wish to express their particular appreciation to Birger Bakke, Armin Guhl, and Tord Hessleryd for designing and constructing the steadiness testers employed in this study and for their many other technical contributions. They would also like to gratefully a elm ow ledge the assistance of Christina Langerkrans, Gun-Inger Loboda, Helena Hasselgren, and Rolf Carlsson in handling many of the routine, but important, details which were so necessary for the successful accomplishment of this study.
SONIC BOOM STARTLE EFFECTS- REPORT OF A FIELD STUDY
I. Introduction.
Although a number of studies have been conducted to investigate the extent of performance disruption resulting from sonic boom exposure, the results, unfortunately, have been some\Yhat inconclusiYe and exact dose-response relationships are still lacking. As noted elsewhere,9 exposure to real or simulated sonic booms has been reported to produce results ranging from performance impairment,4 8 11 to generally non-significant effects,3 to an actual improvement in performance.10 ·with the exception of the study by Rylander et al.,8 all the other studies employed simulated or recorded sonic booms. Since few simulators are capable of faithfully producinosonic boom signatures within the range of ris: times and overpressures likely to be generated by SST-type aircraft, some of the discrepancies between the results of these studies may be due to qualitative as well as quantitative differences in the types of booms produced. It is believed, for example, that the rise time of sonic booms is a major determinant of the startle response. May5 found that subjective ratings of startle magnitude to actual sonic booms increased rapidly with rise times of 3 msecs or less. Of the aboYe-mentioned studies usina simulated booms
0 '
all employed booms having rise times greater than this Yalue. (Rise times reported ranged from approximately 7 to 21 msecs.) Since the rise times of booms produced by actual aircraft are frequently less than 3 msecs, there is some question as to whether laboratory studies using representatiYe OYerpressure leYels, but failing to demonstrate significant startle effects, are employing boom signatures which accurately reflect those likely to be encountered under actual field conditions.
In an effort to study exposure effects under more realistic conditions, a field experiment was conducted during October 1972 on the island of Gotland located approximately 100 kilometers off the southeast coast of Sweden. The essential
1
purpose of this study was to obtain information on sonic boom exposure which would be difficult, if not virtually impossible, to obtain with most existing simulation facilities. The study, which was initiated by the Swedish Department of Environmental Hygiene, represented the joint efforts of inYestigators from various institutes evaluating different aspects (involuntary motor responses, physiological reactions, animal reSJ?onses, s~ructural changes in buildings, commumty reactwns, etc.) of sonic boom exposure. Only those data relating to human startle responses (as reflected in performance on an arm-hand steadiness task) will be reported here.
One of the primary goals of the startle tests was to determine more precisely the dose-response r~lationships between sonic booms and the magmtude and frequency of startle reactions. It was hoped that threshold levels could be established below which sonic booms would not be expected to produce startle or other measurable responses. A second aspect \Yas to study the startle reactions of subjects differing widely in age. On the basis of animal research showing diminished startle response with increasing age,1 it was expected that older subjects (50 to 65 years) would show less startle response to the booms than younger (20 to 35 years) subjects. A final aspect was to study habituation effects to sonic booms and to determine whether these effects differed as a function of boom level.
II. Method.
A. S~tbjects. Subjects consisted of 60 paid, female volunteers recruited from surroundino-
. . 0
commumtles. Two age groups were employed: 20-35 and 50-65 with five Ss from each group tested each day. There were a few subjects whose ages slightly exceeded these limits, and each was placed in the most appropriate age group.
All subjects received a brief audiometric examination at the test site. Because of background
noise, only hearing losses exceeding 20 dB at 500, 2000, and 6000 Hz could be measured reliably. Table 1 sho"·s the number of subjects in eoch age group ha ,·ing a hearing loss in both ears which exceeds 20 dB.
T .\TILE J. Subject;; Showing Hearing Loss in Both Ears Exceed ing 20 dB.
F'1·cqueucy (Hz ) Old Yom1g
500 4 2 2,000 0 0 (),000 3 0
500 + 2,000 0 0 2,000 + (),000 1 0
500 + 2,000 + (),000 3 2 500 + (),000 4 0
Total with hearing loss 15 4
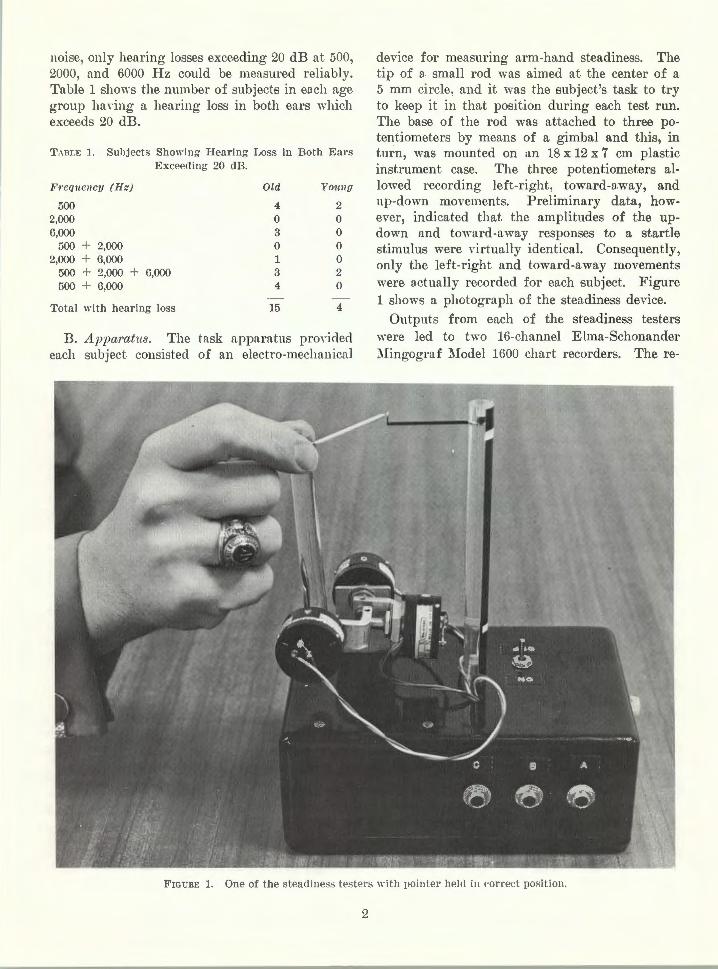
B. Apparatus. The task apparatus prO\·ided each subject consisted of an electro-mechanical
device for measurmg arm-hand steadiness. The tip of a. small rod was aimed at the center of a 5 mm circle, and it was the subject's task to try to keep it in that position during each test run. The base of the rod was attached to three potentiometers by means of a gimbal and this, in turn, was mounted on ;tn 18 x 12 x 7 em plastic instrument case. The three potentiometers allowed recording left-right, toward-away, and up-down movements. Preliminary data, however, indicated that the amplitudes of the updown and to"·ard-away responses to a startle stimulus were virtually identical. Consequently, only the left-right and toward-away movements were actually recorded for each subject. Figure 1 shows a photograph of the steadiness device.
Outputs from each of the steadiness testers were led to two 16-channel E!ma-Schonander ::\lingograf :~\lodel 1600 chart recorders. The re-
FIGURE 1. One of the stead ine><s testers with pointer helcl in !'Orred position.
2

corders were calibrated to yield 1 mm of pen deflection for 1 mm of hand moYement in either plane. Paper speed was 25 mm/ sec.
Startle responses to the sonic booms were also recorded on film by means of Fairchild Type KKA4 16 mm cameras. The cameras operated at 64 frames/ sec. (A report of the film data will be published at a later date.)
C. Test Building. The test building was a converted summer restaurant situated 200 meters from the sea and 15 meters aboYe sea level. The building was one story in height, of frame construction, and approximately six meters wide by 42 meters long. All 'mlls contained windows which were specially designed to withstand the high winds often present in the area. The test building is shown in Figure 2.
The subjects' test room was approximately six meters square and located at one end of the
building. None of the test equipment, with the exception of the cameras and the subjects' steadiness testers, was physically located in the test room. Subjects were located behind two diagonally placed stands in such a way that each row of subjects faced one of the two banks of cameras. The steadiness testers were located on top of the stands, and each stand was constructed in such a manner that it could be separately adjusted to the heights of the subjects. Background noise leYel in the test room was 72 dB (A) with cameras operating and 52 dB(A) without camera noise present. Figure 3 shows a view of the subjects standing in position behind the steadiness testers.
D. Physical jJJ easw·ements. Noise levels of the booms and subsonic flights were obtained from several microphones (sensitivity 0.01 Hz -10 KHz) located both inside and outside the test building. An instrumentation tape recorder
FIGURE 2. View of the test building.
3

FIGURE 3. Five of the test subjects in the positions they as;o;nmed prior to a test run. The wooden pointers held in their left hands " ·ere nsed as aids in photographing arm movements during ltoom exposures.
using frequency modulation allowed recordings of frequencies from DC to 2.5 KHz. A microphone in the subjects' test room led to one of the channels of each Elma-Schonancler recorder to record noise onset. Measurements of the sonic booms included outdoor overpressure, rise time, and duration as well as indoor overpressure. Subsonic measurements included indoor and outdoor dB (lin) and dB(A) ]e,·els. These data for each supersonic and subsonic flight are given in Appendix I.
E. Flight P1·ogram and Expe1·imental Design. The test site was overflown at ,-a rious altitudes by SAAB J35 Draken aircraft from fighter wings located on the mainland. The original flight program called for fi ,.e sn personic and fi ,-e subsonic oYerflights on each of four successiYe clays. By varying altitude of the supersonic
4
T .\nu; 2. Bas ic Flight Plan for Days One to Fonr and Expected Ont><ide O\·erpressnres (in N/m').
Flight Nttmbe1·
Day 1 2 3 4 5
1 50 100 150 200 50 2 100 150 200 50 100 3 150 200 50 100 150 4 200 50 100 150 200
flights from 6500 to 2000 meters, it was hoped that approximate overpressures of 50, 100, 150, and 200 N/ m2* could be achieved on the first and fifth flight of each clay, with these same o,·erpressures programmed in a partially counterbalanced fashion for flights two through four. Table 2 shows the original flight program and expected outside overpressure leYels.
* 47.880258 ~e\\'tons (:'\) / m'=1.0 psf.

It was expected that this program would allow determination of habituation effects by comparing flight one with flight five on each day. In addition, it would allow determination of doseresponse relationships, relatively independent of habituation effects, by combining similar overpressure levels across days. However, as can be seen in T able 3, the actual overpressures differed markedly in some instances from the expected levels. This made precise determinations of habituation effects more difficult than was expected.
TABLE 3. Actual Outside Overpressures (in N/ m') for Days One to Four.
Flight Number
Day 1 2 3 4 5
1 70 130 170 250 105 2 110 160 330 120 130 3 180 370 60 250 80 4 240 100 140 250 290
In addition to the basic flight program, four additional supersonic flights were added to days three and four with overpressures ranging from 130 to 420 N / m2
• Half of these were with cameras operating and ha.lf without in order to investigate the possible effect of the background noise level made by the cameras on startle responses. On the basis of a superficial examination of the response data obtained during these flights, it appeared tha.t startle responses might be occurring more frequently without the camera noise present. Consequently, day five consisted of six overflights without cameras and with boom levels ranging from 60 to 340 N/ m2
• On the last test day (day six), 13 overflights were made with overpressures randomly distributed across flights and ranging from 70 to 640 N/ m2• Subjects used on this day had all been employed on previous days, and the essential intent of this last day of tests was to provide further information on habituation effects as well as to pro,·ide more data on dose-response relationships to booms covering a wide range of OYerpressures.
As noted, it was also intended to study response to subsonic flights of varying noise le1·els, with these flights inserted among the supersonic flights. However, subsonic o\·erflights were discontinued after the first two days since, with the exception of one flight, no apparent startle responses occurred. Appendix I shows the time
5
of occurrence and nOise level for each of the subsonic flights.
In addition to the actual exposure tests, control tests under identical experimental conditions were introduced at random times to control for expectancy effects. Following the last flight of each day, a 22 caliber starter pistol was fired in order to provide a reference response to a known startling stimulus. Noise level of the gun at the subjects' location was 107 dB(lin).
On days three, four, and five, reaction times to a series of four 1000 Hz, 70 dB (A) tones were obtained. The required response was a movement of the pointers of the steadiness testers away from the center position as rapidly as possible as soon as each tone was heard. It was felt desirable to obtain a measure of reaction time for comparison with response latencies tn both the sonic booms and the pistol shot.
F. Geneml Expe1imental Procedure. Following initial instructions, the subjects assumed their positions behind the stands and the stands were adjusted for height. They were told that they could remain seated in chairs located behind the stands until informed that a test was to begin. At that time they were to stand up, grasp the top of the shaft holding the pointer \Yith the thumb and index fingers of their right hand, and attempt to keep it aimed at the small circle until told that the test " ·as completed.
The exact timing of the boom exposure was obtained via direct radio contact with the pilot. In addition, a fisherman who was stationed 10 km from the test site directly along the flight path radioed to the test building when he experienced the boom. Warning lights, invisible to the subjects, signaled to the experimenter when to start the cameras and chart recorders. The cameras and recording equipment were started approximately 20 sees before the expected time of boom arrival and continued until after the boom had occurred. Although this noise served as a definite cue to the subjects that a boom might shortly occur, uncertainty was still present since the subjects neyer knew whether a giYen test was a control run or an actual boom, and the exact timing of the boom's occurrence was sufficiently difficult that the boom never occurred exactly 20 sees after the equipment was turned on. Thirty sees after boom exposure (or after the time a boom would be expected to occur

in the case of a control run) the subjects were told that they could be seated until the next test occurred.
As noted earlier, the lnst test of each day was the pistol shot exposure. The experimental procedure employed was identical to that of the other tests, and subjects had no prior knowledge that the last test would be anything other than a boom or control test. The series of reaction time trials was included during the day when a sufficient time period between booms was available.
G. Scming and jJJea.surenwnt of Performance Data. The basic criteria for deciding whether a response to a sonic boom was an involuntary, reflexive startle response or whether it could be more appropriately considered a voluntary or "reaction-time" response were obtained from the response latencies to the pistol shot. 1\fean latency of response to this stimulus was 180 msecs 'vith a standard deviation of 64 msecs and a range of 100 to 400 msecs. Although information in the literature regarding latency of the arm-hand response to startle is rather sparse, Landis and Hunt2 gave a latency range of 125 to 195 msecs for the arm-hand response to a pistol shot. This range would include approximately 76 per cent of the la.tencies obtained to the pistol shot in the present study.
Examination of the latencies to the shot revealed that most of the longer latencies were associated with the older subjects, and a statistical comparison of the mean latencies of the young (X=150 msecs) and old (X=212 msecs) subjects was significant (t=3.54; p<.01). While the longer latencies of some of the older subjects might suggest that a reflexive startle response was not evoked in these subjects, it could also mean that startle responses in older subjects have generally longer latencies. As noted in the introduction, Birren1 found startle latencies of older rats to be considerably longer (up to 100 per cent longer) than those of the younger animals.
There was no apparent way to be absolutely certain on the basis of the latency data alone that any given response to the shot, regardless of its latency, always represented a. startle reaction. However, since there was little overlap between the distribution of reaction times to the 1000 Hz tone (X=313 msecs; SD=62.6 msecs)
6
and the distribution of latencies to the pistol shot, and in view of the likely possibility that older individuals have lengthened startle latencies, it was decided that there was no justifiable reason for not including the entire range of latencies to the pistol shot in establishing latency criteria for startle response to the booms. Thus, any boom response falling within the range of 80 to 420 msecs was considered to be a reflex response. It should be emphasized that the authors are fully aware that in adopting this latency range a certain small percentage of responses "·ould probably be classified as startle reactions that might be more appropriately considered \·oluntary or orienting responses to the booms.
In addition to the latency criteria, a response was not counted if its amplitude did not exceed the maximum peak-to-peak amplitude of hand tremor in the two-sec period prior to the boom. Finally, a subject's reaction was not scored as a startle response if the latency and amplitude requirements were not met in both the left-right and the toward-a"·ay planes of movement. This last requirement was felt necessary since the natural pattern of arm-hand startle response involves movement in both the above planes, and this was invariably the response pattern to the pistol shot. If a given subject's response met all these requirements, the left-right and towardaway amplitudes were a.veraged together to yield a single amplitude measure.
H. jJfea.stt1'e of Boom Intensity. Preliminary analyses of the startle response data indicated that the clearest relationships appeared to be obtained using outside, rather than inside, overpressure levels. Also, since this is the most generally used measure of boom intensity, it was felt that the obtained relationships would be most readily related to other sonic boom data if the results were expressed in terms of this measure. No attempt was made to categorize booms with respect to rise time. Although rise time is believed to be a significant variable influencing both the loudness and startle effects of sonic booms,6 7 9 10 the distribution of rise times associated with the booms in the present study was considered too leptokurtic (X= 2.51 msecs; SD = 2.34 msecs), and the number of booms having the same overpressure but differing in rise time too few, to warrant the inclusion of rise

time as a variable m determining dose-response 5.oo
relationships.
III. Results.
A. Dose-Response Relationships. Functional relationships between the magnitude or extent of startle response and boom intensity were determined primarily from the response data obtained during the first five boom exposures of the first four test days. (It will be recalled that on some of these days more than five booms were presented.) Of the varwus ways m which these data may be examined, the only dose-response comparison completely free of possible habituation effects is the comparison of the response to the first boom occurring on each of the four days. These data are shown m Figures 4 and 5 for per cent response and mean amplitude of response respecti ,·ely. The most significant aspect of these two figures lS the relatiYe lack of response to booms of approximately 100 N/ m2 and below with a rather abrapt increase occurring to the 180 N/ m2 boom. The 240 K/ m2 boom shows a further increase in per cent response, but not in response amplitude.
80
70 • . c 0
60 a. .. 50 • lr
c 40
• 30 u ~ • 20
I IL
10 I 0 I I
0 50 100 150 200 250 300
Overpressure (N/m 2 l
Frarm: 4. 0\·erpressure,; of the first booms octurring on days one through four and percentage of subjects showing a startle response to each.
A second method of exploring dose-response relationships invohed combining comparable overpressure leYels across days. Thus, the first fiye booms for each day were ranked from one to fiye according to oYerpressure, and the data for each le,·el separately averaged across days. Referring back to Table 3, the lo\Yest ]e,·el booms for days one through four occurred on flights one, one, three, and two for the first four days respecti Yely. The data for these four flights \\'ere
7
4 .00 e E -• .., 3.00 :::1
<>. E <(
• 2.00 • c 0 <>. . • lr 1.00
I 0 50 100 150 200 250 300
Overpressure (N /mt)
FIGURE 5. Overpressures of the first booms occurring on days one through four and mean amplitudes of movement to each.
aYeraged together and constituted the data for the lowest leYel booms to occur across all four days. Data for the other levels were obtained in a similar manner. Although there was some o\·erlap between ]e,·els, this was generally rather minimal, and there was no way that this could be avoided if legitimate statistical compansons were to be made. Per cent response and mean response amplitude for the five levels (as well as the pistol shot) are shown in Figures 6 a.nd 7 respectively. Although these data are not as free of possible habituation or other progressive effects as are the data shown in Figures 4 and 5, nevertheless, the correspondence between the sets
100
90
80
"' "' 70 c 0 a. "' 60 "' a::
50 c "' 40 u
;;; 30 IL
20
10
0 I I Level I Level 2 Level 3 Level 4 Level 5 Pislol
(i ~ 85) (i~l112l (i~l70l (i~207. 5l (i~310) Shot
Boom Levels with Mean Overpressures ( N I m2 l
Franu: !i. AYera~e,; across flay,; one through four of the lowest to hi~hest hoom levels within each day ancl total percentage of suhject,; showing a startle response to ea{'h leYel. Also shown is the total percentage response to the pistol shot.

12.00
11 .00
10.00
'E 9 .00 E .. 8.00
" " 7.00 Q.
E 6 .00 < ::: 5.00
c 4 .00 0 Q.
"' 3.00 .. a:
2 .00
1.00
I l Level I Level 2 Level 3 Level 4 Level 5 Pistol (i • 85) (i•lll.2) (i •170) (i•2075) (i•310) Shot
Boom Levels with Me on Overpressures (N I m2 l
FIGt:RE 7. Averages across days one through four of the lowest to highest boom levels within each day and mean response amplitudes of subjetts showing a startle response.
of data is rather striking. In both Figures 4 ana 6, there is an abrupt increase in per cent response to booms of approximately 170-180 N/m2
• A similar relationship is apparent with the amplitude data shown in Figures 5 and 7. A comparison of the data of all four figures would suggest the existence of some critical overpressure level in the vicinity of 170 N /m 2
in which a noticeable increase in startle response occurs relative to the minimal response occurring to booms of about 100 N/m2 or less.
In order to evaluate the apparent relationship between response amplitude and overpressure, statistical comparisons were made of differences between certain of the levels shown in Figure 7. The first comparison involved identifying those subjects who responded to either or both of the two highest levels and to either or both of the two lowest levels to which they were exposed on their particular days. Mean response amplitudes were obtained to the lo"·est and two highest levels for each subject and differences tested for significance by means of a t test for repeated observations. The obtained value was significant (t=2.67; p<.05). A similar approach was used to compare mean response amplitude of the level three booms with mean amplitude of the level five booms. Although the data presented in Figure 7 suggest a difference between these two levels, the t test was non-significant (t=1.17; p>.05). A final test involved comparing response amplitude to the highest boom le,·el with
8
response amplitude to the pistol shot. Since mean response amplitude to the pistol shot was almost twice the amplitude of response to the level five booms, it is not too surprising that this comparison was significant (t=3.97; p<.01).
B. Dose-Response Relationships Without Background 0 amera Noise. Although filming response to the sonic booms was a major aspect of the study, several additional boom tests with and without cameras and run at the conclusion of the major tests on days three and four suggested that the noise of the cameras (approximately 72 dB (A) ) tended to mask the sonic booms and reduce the startle response. Consequently, subjects were exposed to six sonic booms on the fifth day of tests without cameras operating. Per cent response and response magnitude to the booms presented on this day are shown in Figures 8 and 9 respectively. A cumparison of Figures 8
100
90
80 D ~ 70 c
~ 60
0: 50 c D 40 u
D 30 a.
20
10
0 I I 0 50 100 150 200 250 300 350 Pistol
Overpressure {N I m2} Shot
FIGU RE 8. Per cent startle response to the booms and pistol shot occurring on day five with camera noise absent.
10.00
9 00
'E 8 .00 ~ D 7.00 '0 ~
6 .00 ;;; E 5.00 <t D 4 00 ~ c 3.00 0 0. ~ 2 00 D 0:
1.00
0 5 0 100 150 200 25 0 300 350 P1s tol
Overpressure (N I m2) Shot
FIGU RE 9. Mean amplitudes of response to the booms and pistol shot occurring on day five with camera noise absent.
and 9 with Figures 4, 5, 6, and 7 reveals that the general pattern of the data obtained without the cameras quite closely parallels the data obtained

with camera noise present. This degree of correspondence is somewhat surprising in view of the fact that it was not possible to present the boom levels on day five in any form of counterbalanced fashion in order to control for progressive exposure effects. Both per cent response and response amplitude are generally higher without cameras than with (compare Figures 8 and 9 with Figures 6 and 7), although the absolute magnitudes of the differences are not large. It is interesting to note in Figure 8 that the abrupt increase in per cent response occurred at about the same overpressure level ( 150-160 N /m2
)
as was found with camera noise present as shown in Figures 4 and 6.
C. Age Eff'ects. The data obtained for the first five booms of days one to four were examined for possible age effects. In order to determine whether older subjects differed from the younger in terms of frequency of response to the booms, each subject was initially classified according to whether she sho,Yed a startle response to zero to one, two to three, or four to five of the booms to which each was exposed. The resulting frequencies are shown in Table 4. Since previous re-
TABLE 4. Boom Response as a Function of Age With Subjects Classified According to Whether They Responded to Zero to One, Two to Three, or Four to Five of the Booms to Which They Were Exposed. Data Are For Days One to Four Only.
Age Group
Young Old
Nwnbcr of Boon~s to Which Each Group Responded
0-1
7 11
2-3
9 9
4-5 4 0
Chi square=5.37 p<.05 ( one-tn iled)
search had suggested that the startle response diminished with age, the chi square test conducted on the data in Table 4 was e1·aluated against one-tailed probability ,·alues. The obtained chi square of 5.37 was significant (p < .05; one-tailed), indicating fe,Yer startle responses in the older subjects. A comparison of response frequency to the pistol shot was also significant (chi square=4.73; p<.O:'l; one-tailed) with the older subjects being less responsi 1·e.
The two age groups were compared with respect to magnitude of response by obtaining each subject's mean response amplitude across the five booms. ::\Iean amplitudes \Yere 5.6± mm
9
and 2.90 mm for the young and old groups respectively. A t test for independent groups yielded a significant t-Yalue of 2.24 (p<.05; onetailed).
As discussed earlier, the two age groups also differed significantly in their latencies to the pistol shot. In addition, there was a significant difference between the mean response latency to the booms of the young (X= 206 msecs) and old (X=241 msecs) subjects. The obtained t was 2.68 (p<.01; one-tailed).
D. 11 abitnation Effects. Habituation to the booms was assessed by examining the response data obtained from flights one and five on days one through four, and also by examining the data of the sixth test day in which subjects who had participated in one of the previous test days were again exposed to a series of booms.
Table 5 giYes the percentages of subjects showing measurable startle responses to the first and fifth boom occurring on the first four days of tests. Although a comparison of flight one with flight fiye shows a decrease in mean per cent response, it is difficult to evaluate the meaning of this decrease since actual overpressures on the first and fifth flight of each day were not comparable. By referring back to Table 3, it can be
T.1nr.E 5. Percentage of Subjects Showing a Measurable Startle Response to the Booms Occurring During Flights One and Five on Days One to Four.
Flight Nttmber Day One Five
1 20 10 2 10 20 3 50 0 4 80 40
:\lean Per C'ent Response 40 17.5
seen, hmYeYer, that the booms on flights one and fi 1·e of days one and hYo differed the least in o1·erpressnre, and there \Yas no apparent eYidence of habituation to these booms. Although the first and last booms on day four differed by 50 N/m\ with the last being the greater, it is interesting to note that per cent response decreased from 80 per cent to 40 per cent. This is the only eYidence of any apparent habituation that may be gained from a comparison of the first and last booms ol-er the four days. OYerpressures for the first and last booms on day

three differed too greatly to allow any meaningful comparison with respect to habituation.
Table 6 shows mean response amplitudes for flights one and five of those subjects who produced measurable startle responses. Interpretation of these data is difficult for the same reasons given with respect to the data presented in Table 5. There is obviously no evidence of habituation on days one, two, and four. Amplitudes, in fact, show an increase. There is no way of evaluating the possible statistical significance of the increase during days one and two because of the small number of subjects involved. The increase in mean amplitude from boom one to boom five on day four was non -significant ( t = 0.33; p > .05), suggesting that the apparent increase during days one and two can probably also be attributed to chance factors.
TABLE 6. Mean Response Amplitude (in mm) of Those Subjects Showing a Measurable Startle Response to the Booms Occurring During Flights One and Five on Days One to Four.
Flight Number Day One Five
1 2.40 5.75 2 0.63 5.10 3 5.00 • 4 4.65 8.02
Mean Amplitude 3.17 6.29
*No subjects gave a response to the boom occurring on this flight.
A more adequate appraisal of possible habituation effects was gained from an analysis of the data of the subjects tested on day six, all of whom had been exposed to booms on previous days. The 13 booms presented on this day ranged in overpressure from 70 to 640 N/m2 with the various levels distributed in a random manner within the series. With the exception of two flights at the end of the series, all boom exposures were without the cameras operating. The two flights with cameras operating were included primarily for comparison with the pistol shot data and the results are not analyzed here.
Figure 10 shows per cent response to each of the 11 booms. It is of interest to compare this figure with Figures 4, 6, and 8. All the data in these figures are in general agreement that booms having outside overpressures of approximately
10
100
90
80
" .. 70 c 0
:; 60 " a:
50 c
" 40 u
" 30 Cl.
20
I 10 o Ill 0
0 roo 200 300 400 500 600 P•stol
Ov er pressure (N f mZ) Shot
FIGURE 10. Percentage of subjects showing a startle response to the booms occurring on day six.
300 N/ m2 or greater produced startle responses in 60 to 90 per cent of the subjects, with 75 per cent being the approximate mean value. Previous exposure to sonic booms appeared not to affect the percentage of subjects responding to booms of this magnitude. For low magnitude booms (70 to 120 N / m2
), per cent response ranged from 0 to 20 per cent, with the mean response being about 10 per cent. Since the lowest per cent response occurred during day six (Figure 10), this suggests a slight habituation effect to the low level booms.
For booms with overpressures between approximately 150 to 290 N/ m2 the percentage of subjects responding varied from 20 to 80 per cent with these percentages seemingly related to previous exposure. Thus, the percentages shown in Figure 10 for this overpressure range extend from 20 to 40 per cent while those shown in Figures 4 and 6 extend from 50 to 80 per cent. The largest per cent response (80) within this overpressure range occurred in response to the first boom presented to one of the groups on days one to four, while the lowest percentages were obtained to the booms presented on day six. In addition, per cent response within this range extended from 40 to 60 per cent for booms presented on day fi ye (Figure 8) . Since both days five and six \Yere \Yithout camera noise present, there is fairly convincing e\·idence that habituation effects occurred within this overpressure range.
It is interesting that the rather abrupt increase in per cent response noted earlier in Figures 4, 6, and 8 and which appeared to occur with overpressures of 150-180 N/m2 was also seemingly present in the data of Figure 10. Although the
increase was less pronounced, it occurred at about the same overpressure (170 N/ m2 ).
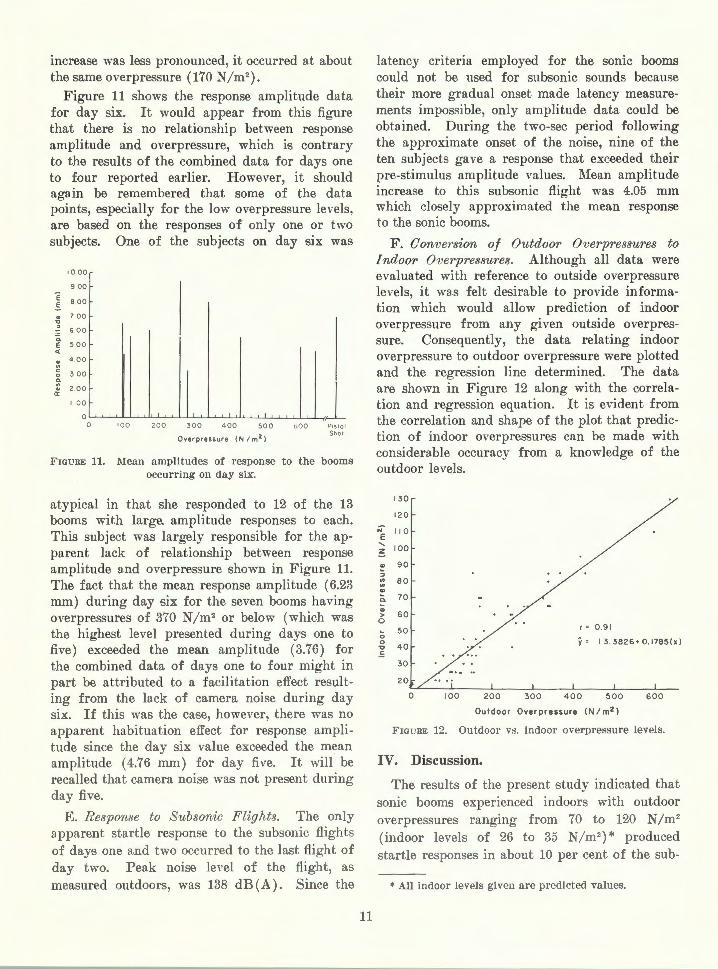
Figure 11 shows the response amplitude data for day six. It would appear from this figure that there is no relationship between response amplitude and overpressure, which is contrary to the results of the combined data for days one to four reported earlier. However, it should again be remembered that some of the data points, especially for the low overpressure levels, are based on the responses of only one or two subjects. One of the subjects on day six was
10 00
9 00
e 8 00 5 " 7 00
" , 6 00 a. E 5 00 <[
" 4 00
~ c
3 00 0 a.
" 2 .00 0:
I 00
0 0 100 200 300 4 00 500
Overpressure (N /m 2 )
600 PiST Ol
Shot
FIGURE 11. Illean amplitudes of response to the booms occurring on day six.
atypical in that she responded to 12 of the 13 booms with large. amplitude responses to each. This subject was largely responsible for the apparent lack of relationship between response amplitude and overpressure shown in Figure 11. The fact that the mean response amplitude (6.23 mm) during day six for the seven booms having overpressures of 370 N/ m2 or below (which was the highest level presented during days one to five) exceeded the mean amplitude (3.76) for the combined data of days one to four might in part be attributed to a facilitation effect resulting from the lack of camera noise during day six. If this was the case, however, there was no apparent habituation effect for response amplitude since the day six value exceeded the mean amplitude (4.76 mm) for day five. It will be recalled that camera noise was not present during day five.
E. Response to Subsonic Flights. The only apparent startle response to the subsonic flights of days one and two occurred to the last flight of day two. Peak noise leYel of the flight, as measured outdoors, was 138 dB (A). Since the
11
latency criteria employed for the sonic booms could not be used for subsonic sounds because their more gradual onset made latency measurements impossible, only amplitude data could be obtained. During the two-sec period following the approximate onset of the noise, nine of the ten subjects gave a response that exceeded their pre-stimulus amplitude values. M:ean amplitude increase to this subsonic flight was 4.05 mm which closely approximated the mean response to the sonic booms.
F. Oonve?'Sion of Outdoor Overpressures to Indoor Overpressures. Although all data were evaluated with reference to outside overpressure levels, it was felt desirable to provide information which would allow prediction of indoor overpressure from any given outside overpressure. Consequently, the data relating indoor overpressure to outdoor overpressure were plotted and the regression line determined. The data are shown in Figure 12 along with the correlation and regression equation. It is evident from the correlation and shape of the plot that prediction of indoor overpressures can be made with considerable occuracy from a knowledge of the outdoor levels.
130
120
N' 110 E ' 100 ~
~ 90 ::> .. 80 .. Q)
0. 70 ;;;
60 > 0
;; 50 0
40 "0
r • 0 .91
y • 13 . 3826+0.1785(x)
= 30
20
0 100 200 300 400 500 600
Outdoor Over pressure ( N I m2)
FIGURE 12. Outdoor vs. indoor overpressure levels.
IV. Discussion.
The results of the present study indicated that sonic booms experienced indoors with outdoor overpressures ranging from 70 to 120 N/ m2
(indoor leYels of 26 to 35 N/ m2) * produced
startle responses in about 10 per cent of the sub-
*All indoor levels given are predicted values.

ject population. On the other hand, sonic booms with outdoor overpressures of approximately 300 N/m2 (67 N/m2 indoors) or greater elicited startle reactions in about 75 per cent of the subjects. Although response amplitudes to the lowest intensities were generally less than those to the highest, the range of individual differences in response amplitude across all boom exposures was quite large ( < 1.00 mm to 21.00 mm), and fairly sizable amplitudes were occasionally found even to the lowest intensities. Of the two measures (per cent response and response amplitude), per cent response was the more consistent measure of dose-response relationships. Outdoor overpressures between 150 to 280 N / m 2 ( 40 to 63 N / m2 indoors) elicited startle responses in 20 to 80 per cent of the subjects, with the larger percentages occurring among those subjects experiencing booms within this range as their first exposure and the smaller percentages associated with the day six subjects, all of whom had been exposed to booms on previous days. Although this is a rather wide range of o\·erpressure and per cent response, the data across all days were quite consistent in suggesting that within this range there existed some form of "critical" level of overpressure lying bet\Yeen 150 to 180 N /m2
(40 to 46 N/ m2 indoors) in which a rather abrupt increase in per cent response occurred. Generally, this amounted to an increase of about 30 to 40 percentage points above the minimal response to the 70 to 120 N / m2 booms.
It is unfortunate that the number of booms ha,·ing ,-ery low 0\·erpressnres " ·as insufficient to establish accurately a "threshold" level below which startle responses would not be expected to occur. Per cent response to booms having outdoor overpressure levels of 60 to 70 N / m2 (24 to 26 N/ m2 indoors) ranged from 0 to 20 per cent. The single boom to which no subjects responded occurred on day six. Since these subjects had been exposed to booms previously, this might suggest that booms of perhaps 50 N/ m2 or less might be close to the threshold le,·el for indoor startle effects for a population exposed to frequent booms. However, further research is needed to establish clearly this threshold level.
'With respect to age, the results revealed that the older age group responded less frequently to the booms and with lower amplitudes of moYement than the young group. In addition, the
12
older group was less responsive to the pistol shot and had longer response latencies to both the pistol shot and the sonic booms. These results support the earlier-mentioned findings concerning startle response in animals as a function of age and suggest a general pattern of declining responsiveness to startle with increasing age which may, at least in part, be attributed to the increased hearing loss with age.
There was some evidence of habituation to sonic boom exposure but, within the range of exposures studied, this appeared to be rather slight. There was a reduction in per cent response to the 70 to 120 N/m2 booms and to the moderately intense booms (150 to 290 N/m2
)
among the subjects on day six, especially with respect to the response during day five. For booms of 300 N/ m2 or greater, however, the overall pattern reflected a rather stable per cent response to the booms regardless of prior exposure. Possibly the number of boom exposures in the present study was not sufficient to reveal pronounced habituntion effects. On the basis of the habituation which did appear to occur, it could be hypothesized that prolonged exposure to sonic booms, eYen if they occurred unexpectedly, would probably result in a further reduction in the number of persons responding. It is doubtful that complete habituation would ever occur in all individuals even to the lowest levels employed in the present study.
Studies reviewed by Thackray9 have found human startle responses to impulsive noise to be reduced in the presence of continuous background noise. Although there was a slight increase in startle responsiYeness to sonic booms noted in the present study with camera noise absent, this was considered to be minimal. Higher levels of background noise could concei,·ably result in a much greater reduction in startle response to sonic booms.
Subsonic overflights, with one exception, were not found to eYoke startle reactions in any of the subjects. The one flight in which apparent startle responses were noted \Yas an extremely low level overflight with a peak outdoor noise level of 138 dB(A) ..
V. General Summary and Conclusions.
The present study was concerned with the startle effects of sonic booms as experienced in-

doors. The results indicated that outside overpressures ranging from 70 to 120 N / m2 (26 to 35 N / m2 indoors) produced apparent reflexive arm-hand responses in about 10 per cent of the subjects, while sonic booms of 300 N/ m2 (67 N/ m2
indoors) and over prod need responses in about 75 per cent of the subjects. Between these extremes, both per cent and magnitude of response were more variable, with some suggestion of a critical range lying between 150 to 180 N / m2
(40 to 46 N/ m2 indoors) in which there was a rather steep increase in per cent response to the booms. Although there was some evidence that very low overpressures produced arm-hand response amplitudes of lower magnitude than those produced to the highest levels, there was a wide range of individual differences in response amplitude to the booms ( < 1.00 mm to 21.00 mm), and even low level booms occasionally produced large responses. Of the two measures (per cent response and response amplitude), per cent response was the more consistent measure of doseresponse relationships. An overpressure level below which startle responses did not occur was not clearly established, but the results suggested that the startle threshold probably was in the vicinity of 50 N/ m2 (22 N/ m2 indoors) or less. Older subjects were found to be less responsive to the booms than younger subjects in every aspect of the startle response examined. There was some evidence of habituation to low and moderate level sonic booms, but no real evidence
of habituation to extremely high boom levels. Background noise levels of 72 dB(A) appeared to reduce response to low and moderate level booms, but not to high level booms.
In conclusion, it should be emphasized again that the present study examined only the startle effects of sonic booms experienced indoors, in a building of frame construction, and under semilaboratory conditions. Dose-response relationships for booms experienced outdoors cannot be extrapolated from the data obtained. Also, the data were obtained on female subjects only, and while there is no evidence in the literature suggesting the existence of sex differences in startle response, the possibility nevertheless exists. Finally, virtually all of the booms had rather fast rise times. The importance of rise time as a significant variable influencing the loudness and startle effects of sonic booms is now well known. \Vhile rise times of booms occurring under actual flight conditions cannot be predicted or controlled, it must be emphasized that booms produced in the present study with equivalent overpressures, but considerably longer rise times, might have markedly reduced the startle effects. Questions relative to the effect of changes in rise time on the startle response can only be answered with simulation facilities capable of producing booms with rise times extending over the complete range of rise times likely to be associated with the booms produced by SST-type aircraft.
13
I

REFERENCES
1. Birren, J. E. : Age Differences in Startle Reaction Time of the Rat to Noise and Electric Shock, JOURNAL OF GERONTOLOGY, 10:437-440, 1955.
2. Landis, C., and W. A. Hunt: The Startle Pattern, New York, Farrar and Rinehart, 1939.
3. Lukas, J. S., and K. D. Kryter: A Preliminary Study of the Awakening and Startle Effects of Simulated Sonic Booms. Stanford Research Institute Report No. NASA-cit-1193, Menlo Park, California, 1968.
4. Lukas, J. S., D. J. Peeler, and K. D. Kryter: Effects of Sonic Booms and Subsonic Jet Flyover Noise on Skeletal Muscle Tension and a Paced Tracing Task. Stanford Research Institute Report No. NASA-7592, Menlo Park, California, 1969.
5. May, D. N.: Sound-Induced Startle With Particular Reference to the Sonic Boom. Unpublished Doctoral Dissertation, University of Southampton, 1971.
6. May, D. N.: Startle Due to Sonic Booms Heard Outdoors as Functions of Overpressure and Rise
14
Time, JOURNAL OF SOUND AND VIBRATION, 18:144-145, 1971.
7. May, D. N.: The Loudness of Sonic Booms Heard Outdoors as Simple Functions of Overpressure and Rise Time, JOURNAL OF SOU~D AND VIBRA'l'ION, 18:31-43, 1971.
8. Rylander, R., S. Sorensen, K. Berglund, and C. Brodin: Experiments on the Effect of Sonic Boom Exposure on Humans, JOURNAL OF ACOUSTICAL SOCIETY OF AMERICA, 51 :790-798, 1972.
9. Thackray, R. I.: Sonic Boom Exposure Effects II.3: Startle Responses, JOUR~AL OF SOUND AND VIBRATIO~. 20:519-526, 1972.
10. Thackray, R. I., R. ~I. Touchstone, and K. N. Jones: Effects of Simulated Sonic Booms on Tracking Performance and Autonomic Response, AEROSPACE MEDICINE, 43 :13-21, 1972.
11. Woodhead, l\1. l\1.: Performing a Visual Task in the Vicinity of Reproduced Sonic Bangs, JOURNAL OF SOUND AND VIBRATION, 9:121-125, 1969.

Day and Date
1 10/16/72
2 10/17/72
3 10/19/72
4 10/20/72
Exposure No.
1
2
3
4
5
6
8
9
10
11
12
13
14
15
16
17
18
19
20
21
22
23
24
25
26
27
28
29
30
31
32
33
34
35
36
37
38
39
40
41
42
43
Time Type Camera
10:15 Boom
10 :20 Subs
10:25 Subs
11 : 15 Boom
11 :25 Subs
13:15
13:20
14 :05
Boom
Subs
Boom
14:10 Subs
14:40 Boom
14:45 Subs
15:00 Pistol
10:05 Boom
10:15 Subs
10:55 Boom
11:00 Subs
11:45
11:50
Boom
Subs
13:15 Boom
13:20 Subs
14 :05 Boom
14:10 Subs
14:15 Pistol
10:05 Boom
10:30 Boom
10:55 Boom
11: 20 Boom
11 :45
13:15
Boom
Boom
13 :30 Boom
14:05 Boom
14:20 Boom
14:30 Pistol
10:00 Boom
10: 40 Boom
10:50 Boom
11 : 25 Boom
11:30 Boom
13:10
13:15
Boom
Boom
13:45 Boom
13:50 Boom
14: 00 Pisto l
X
X
X
X
X
X
X
X
X
X
X
X
X
X
X
X
X
X
X
X
X
X
X
X
X
X
X
X
X
No
X
No
X
X
X
X
X
X
X
No
X
No
X
APPENDIX !--Exposure Data
70
130
170
250
105
110
160
330
120
130
180
370
60
250
80
140
160
130
150
240
100
140
250
290
150
150
340
420
OUTDOOR MEASUREMENTS Duration (msecs)
100
110
125
90
107
91
89
83
103
66
115
83
115
91
90
103
90
84
94
83
94
85
84
81
86
86
86
81
15
Rise Time (msecs)
2
4
2
4
4
6
4
4
< 0.1
4
< 0. 1
2
12.5
4
3
4
2
2
< 0. 1
2
2
2
dB (lin)
< 95
106
105
111
106
115
114
115
117
132
dB(A)
< 95
99
102
107
97
114
112
111
116
13 8
INDOOR MEASUREMENTS
N/m2
dB(lin)
25
10
65
60
35
25
45
70
35
50
85
30
60
35
40
35
45
30
65
25
35
40
65
35
40
80
95
< 95
< 95
< 95
< 95
< 95
107
107
107
99
112
106
107
dB(A)
< 92
< 92
< 92
< 92
< 92
< 92
< 92
94
< 92
103
100
100
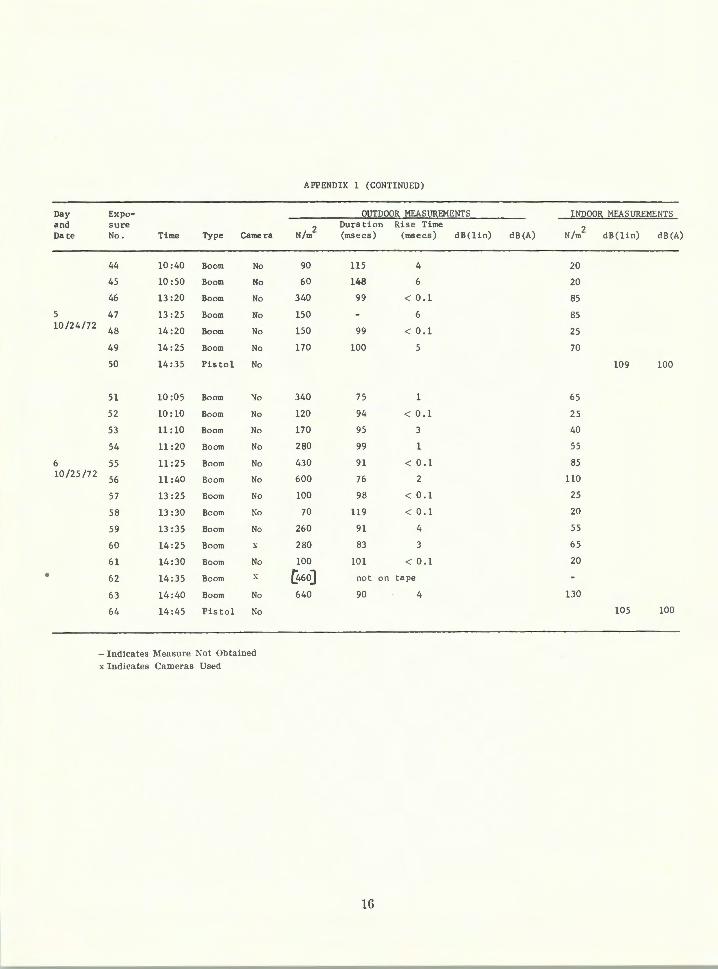
APPENDIX 1 (CONTINUED)
Day Expo- OUTDOOR MEASUREMENTS INDOOR MEASUREMENTS and sure
N/m2 Duration Rise Time N/m2
Date No. Time Type Came ra (ms ecs ) (msecs) dB(lin) dB(A) dB(lin) dB(A)
44 10:40 Boom No 90 l15 4 20
45 10:50 Boom No 60 148 6 20
46 13:20 Boom No 340 99 < 0.1 85
5 47 13:25 Boom No 150 6 85 10/24/72
48 14:20 Boom No 150 99 < 0.1 25
49 14:25 Boom No 170 100 5 70
50 14:35 Pistol No 109 100
51 10:05 Boom ~0 340 75 65
52 10:10 Boom No 120 94 < 0.1 25
53 ll :10 Boom No 170 95 3 40
54 ll :20 Boom No 280 99 1 55
6 55 ll :25 Boom No 430 91 < 0.1 85 10/25/72
56 ll :40 Boom No 600 76 2 uo 57 13:25 Boom No 100 98 < 0.1 25
58 13:30 Boom No 70 l19 < 0.1 20
59 13:35 Boom No 260 91 4 55
60 14:25 Boom " 280 83 3 65
61 14:30 Boom No 100 101 < 0.1 20
62 14:35 Boom " [460] not on tape
63 14:40 Boom No 640 90 4 130
64 14:45 Pis to1 No 105 100
- Indicates Measure Not Obtained x Indicates Cameras Used
16

Federal Aviation Administration, Office of Aviation Medicine, Civil Aeromedical Institute, Oklahoma City, Oklahoma. SONIC BOOM STARTLE EFFECTSREPORT OF A FIELD STUDY by Iticharcl I. Thacluay, Ragnar Rylander, and R. Mark Touchstone, July 1973, 16 pp. Report No. FAA-AM-73-11.
The present study reports the results of a sonic boom field study conducted in Sweden during October 1972. Ten female subjects were tested indoors on each of six clays. Two age groups were stucliecl : 20-35 and 50-G5 years. Fighter aircraft flying at various heights over the test site produced booms with outdoor overpressures ranging from G0-640 N;m.' The number of booms extenclecl from 5 to 13 per clay. Subjects performed indoors on an arm-hand steadiness task. The results indicated that outdoor overpressures ranging from 70-120 N/m' (26--35 N/ m' indoors) produced reflexive arm-hancl movements in about 10 per cent of the subjects. Booms of 300 N/m' (67 N/m' indoors) ancl greater produced responses in about 75 per cent of the subjects. Between these extremes of overpressure there was the suggestion of a criti<:al overpressure range lying between 150-180 N/m' (40-46 N/m'
I. Thackray, R.I.
II. Rylander, R. III. Touchstone,
R. M.
Descriptors ::\'oise Performance Sonic Booms Startle
Federal Aviation Administration, Office of Aviation 1\feclicine, Civil Aeromedical Institute, Oklahoma City, Oklahoma. SONIC BOOM STARTLE EFFECTSREPORT OF A FIELD STUDY by Richard I. Thackray, Ragnar Rylander, ancl R. 1\fark Touchstone, July 1973, 16 pp. Report No. FAA-AM-73-11.
The present study reports the results of a sonic boom field study conducted in Sweden during October 1972. Ten female subjects were tested indoors on each of six days. Two age groups were studied: 20-35 and 50-G5 years. Fighter aircraft tlying at various heights over the test site produced booms with outdoor overpressures ranging from 60-640 N/m.' The number of booms extended from 5 to 13 per day. Subjects performed indoors on an arm-hand steadiness task. The results indicated that outdoor overpressures ranging from 70-120 N/ m' (26--35 N/m' indoors) proclucecl reflexive arm-hand movements in about 10 per cent of the subjects. Booms of 300 ::\'/m' (67 N/m' indoors) and greater produced responses in about 75 per cent of the subjects. Between these extremes of o>erpressure there was the suggestion of a critical overpressure range lying between 150-180 N/m' (40-46 N/m'
I. Thackray, R.I.
II. Rylander, R. III. 'l'ouchstone,
R. M.
Descripto1·s Noise Performance Sonic Booms Startle
·------------------------------------------------------------------------- ----------------------------------------------------------- ---------- ---- ... ·--- -------------- ---------------------------------------------------------------------
indoors) in which an abrupt increase in startle response occurred. In all aspects of the startle response studied, older subjects were less responsive than the younger ones. There was some evidence of response habituation to low ancl moderately intense booms, but not to high intensity booms.
indoors) in which an abrupt increase in startle response occurred. In all aspects of the startle response studied, older subjects were less responsive than the younger ones. There was some evidence of response habituation to low and moderately intense booms, but not to high intensity booms.