some relationships between soil … relationships between soil nutrients, vegetation and site index...
TRANSCRIPT
SOME RELATIONSHIPS BETWEEN SOIL NUTRIENTS, VEGETATION AND
SITE INDEX FOR WESTERN HEMLOCK ECOSYSTEMS
IN THE VERY WET MARITIME CWH SUBZONE
Section 88 Research Report submitted
by
Richard Kabzems
to
C.I.P., Inc.
March 1988
63.3. * 909';;r 1 j BC:ILIF" R E S 1'388 r"s: 1 1 $ 2 1 tna
SUMMARY
Twenty-one natural western hemlock stands on Vancouver Island and the Lower Mainland were sampled and described for vegetation, soil properties, foliar nutrients, and si te index. The sample plots represented a range of environmental conditions. Granitic and volcanic parent material lithologies (PML) were used to sample the widest possible variation in base status. Each plot was classified for soil nutrient regime (SNR) and soil moisture regime.
Were there differences between the two PMLs'?
Yes. Foliar N and P concentrations, soil pH and Mg quantities were significantly greater in the volcanic PML. Nutrient relationships within each PML were different. The two PMLs' differed in location, site history and average stand age. Due to the small sample size, all effects were confounded with PML and could not be separated.
What was the nutrient s ta tus of the trees?
Foliar nutrients on all plots were below recommended adequate levels for N , P, K, S and Zn. Two plots had low foliar B. The potential for N fertilizer induced B deficiencies was identified on seven additional plots.
Were there correlations between soil and foliar nutrients?
Yes. On the granitic PML plots, mineral soil pH was correlated positively with foliar P, and negatively with foliar N. Mineral soil N was negatively correlated with foliar P and B. On the volcanic PML there were correlations between soil and foliar measures of P, K , and Ca.
Did hemlock s i te index correlate with s i te nutrient status?
Yes on the granitic PML with mineral soil nitrogen, but not significantly on the volcanic PML.
Did the S N R classification identify nutrient differences?
On the volcanic PML significant differences in forest floor pH and soil N were identified by the field SNR classification. On the granitic PML the SNR classification was less successful in identifying differences in nutrient status, possibly due to previous disturbance of two plots.
More detailed discussion of results are given in the body of the report.
Management implications and research recommendations are outlined a t the end of the report.
TABLE OF CONTENTS
TITLE ...................................................................... i SUMMARY ................................................................... ii
CONTENTS ........................................................ iii ACKNOWLEDGEMENTS .......................................................... iv INTRODUCTION ............................................................... 1 METHODS .................................................................... 2
................................... Sampling. Description and Measurements 2 .................................... Collection and Preparation of Samples 2 ...................................................... Laboratory Analysis 3
................................................... Soil Moisture Analysis 5 .................................... Data Summary and Statistical Analysis 5
.................................................. Vegetation Analysis 5 ............................................... Foliar Nutrient Status 6 ...................................................... Soil Properties 6
................................................... Property Variation 7
RESULTS AND DISCUSSION . ............................................... Description of Study Plots 9
Vegetation Analysis ...................................................... 9 Soil Moisture Analysis .................................................. 16 Root Distribution ....................................................... 1 9 Soil Properties ......................................................... 19
Parent Material Lithology ............................................ 19 ............................. Multivariate Analysis of Soil Properties 22
Foliar Nutrients ........................................................ 24 ......................................... Correlations Between Properties 29 Soil - Foliar Correlations ........................................... 29
................. Correlations Between Site Index and Other Properties 33 Correlations Between Vegetation and Other Properties ................. 35
.................................. Classification of Soil Nutrient Regime 37
CONCLUSIONS ............................................................... 47 ................................................... MANAGEMENT IMPLICATIONS 48
FUTURE RESEARCH ........................................................... 49 LITERATURE CITED .......................................................... 50
Appendix 1 . Soil data for study plots. .................................. 54 Appendix 2 . Selected characteristics vr study plots ....................... 57 Appendix 3 . Foliar data ................................................... 58
..... Appendix 4 . Indicator species spectral analysis and vegetation tables 59
LIST OF FIGURES
Figure 1 . Figure 2 . Figure 3 . Figure 4 . Figure 5 . Figure 6 . Figure 7 . Figure 8 . Figure 9 . Figure 10 . Figure 11 . Figure 12 . Figure 13 . Figure 14 . Figure 15 . Figure 16 . Figure 17 . Figure 18 . Figure 19 . Figure 20 . Figure 21 . Figure 22 . Figure 23 . Figure 24 . Figure 25 . Figure 26 . Figure 27 . Figure 28 . Figure 29 . Figure 30 .
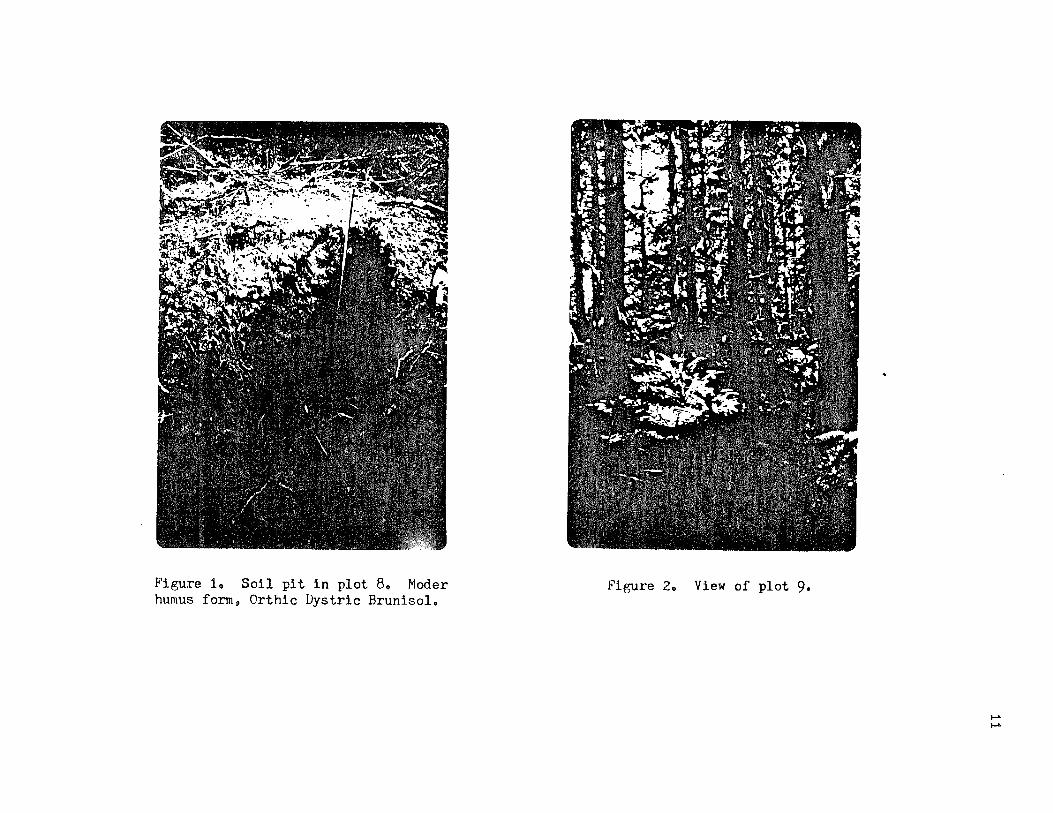
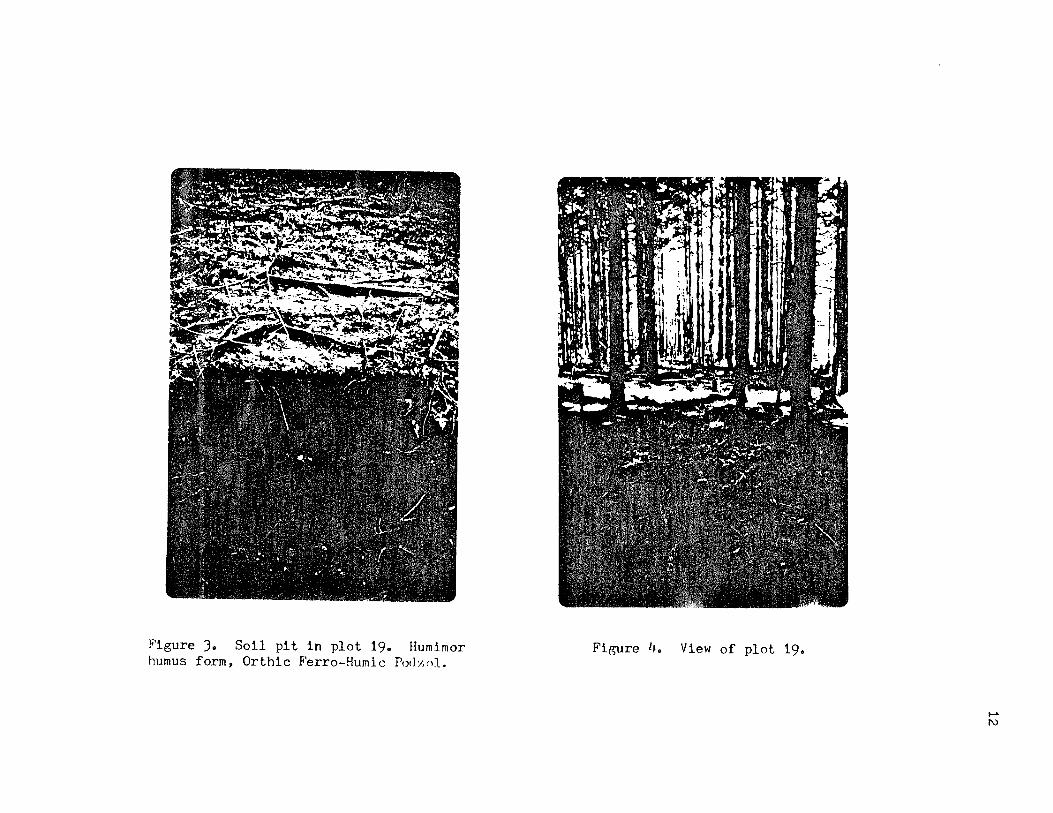
Soil pit in plot 8 .............................................. 11 View of plot 9 .................................................. 11 Soil pit in plot 19 ............................................. 12 View of plot 19 ................................................. 12
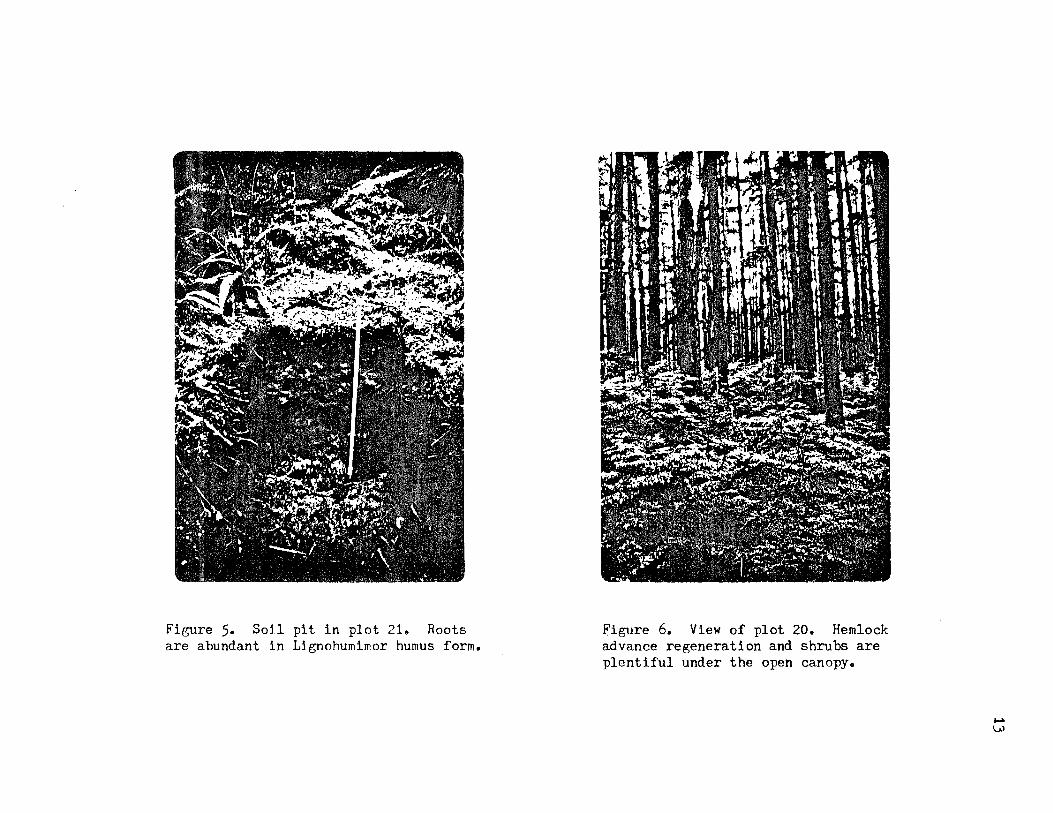
............................................. Soil pit in plot 21 13 View of plot 20 ................................................. 13
........................ Ordination of RA results for study plots 17 Soil moisture histogram for plant subassociations ............... 18
............... Soil nutrient histogram for plant subassociations 18 Ordination of forest floor (kg/ha) PCA .......................... 23 Ordination of upper mineral soil chemical properties PCA ........ 23 Ordination of forest floor plus mineral soil (kg/ha) PCA ........ 23 Ordination of foliar nutrient PCA for all study plots ........... 28 Ordination of foliar nutrient PCA for young - immature study plots ..................................................... 28 Relationship between foliar P and extractable P of forest floor plus upper mineral soil (kg/ha) on volcanic PML ........... 30 Relationship between foliar K and mineral soil extractable K (kg/ha) on volcanic PML ........................... 30 Relationship between foliar Ca and mineral soil
.......................... extractable Ca (kg/ha) on volcanic PML 30 Relationship between foliar N and upper mineral soil pH on granitic PML ................................................. 32 Relationship between foliar P and upper mineral soil pH on granitic PML ................................................. 32 Relationship between foliar P and mineral soil total N (kg/ha) on granitic PML ................................................. 32 Relationship between foliar B and mineral soil
......................... mineralizable N (kg/ha) on granitic PML 32 Relationship between mineral soil mineralizable N Ikg/ha)
....................... and site index (m/50 yrs) on granitic PML 34 Forest floor pH for SNRs' ....................................... 40
....................... Forest floor pH for SNRs' on volcanic PML 40 Forest floor pH for SNRs' on granitic PML ....................... 40
..................... Upper mineral soil minN (kg/ha) for SNRs'.. 42 Upper mineral soil minN (kg/ha) for Snrs' on volcanic PML ....... 42
....... Upper mineral soil minN (kg/ha) for SNRs' on granitic PML 42 Ordination of discriminant analysis results for SNR on volcanic
...... PML using forest floor pH. upper mineral soil minN and mCa 45 Ordination of discriminant analysis results for SNR on
................. granitic PML using upper mineral soil pH and TN 45
LIST OF TABLES
Table 1.
Table 2.
Table 3. Table 4. Table 5.
Table 6.
Table 7. Table 8.
Table 9.
Table 10.
Table 11.
Table 12.
Summary of laboratory analysis methods used and abbreviations ...................................................... used in text 5 Coefficients of variation for forest floor, upper mineral soil (0 - 30 cm), and lower mineral soil ( >30 cm) properties in variability plots ................................................. 8 Site index (SI) and selected properties for the study plots ...... 10
.......... Synopsis of vegetation units distinguished in the study 14 Diagnostic combination of species for the associations and .......................... subassociations recognized in the study 15 Percentage of variation in soil properties explained by Parent Material Lithology (PML) .... ........................... 20 Summary of foliar nutrient analysis results ...................... 25 Percentage of variance accounted for by parent lithology (PML) and soil nutrient regimes (SNR) within lithologies for foliar
......................................... nutrients and site index 26 Rich indicator spectra and selected soil properties of the Tsuga - Kindberg ia - Vaccinium (TKV) and Tsuga - Kindberg ia - Rubus (TKR) plant subassociations.. ............................. - 3 6 Percentage of variation in soil properties.exp1ained by Soil Nutrient Regime for volcanic PML plots ........................... 38 Percentage of variation in soil properties explained by Soil Nutrient Regime for granitic PML plots ........................... 39 Tentative classification of actual Soil Nutrient Regimes for soils in southwestern British Columbia (amended version of Courtin et al. 1985)... ....................................... 43
ACKNOWLEDGEMENTS
My thanks is given t o t h e following people whose assis tance made th is project possible. Mary-Jane Douglas, Harry Williams and Roy Nordvik efficiently carried out sampling. Pacific Soils Analysis performed a l l laboratory analyses. Brian McCutcheon of C.I.P., Inc. arranged a l l logistical and technical support. Gordon Joyce made arrangements for t h e sampling in t h e Seymour Valley. Dr. Karel Klinka of UBC supported and encouraged al l s tages of th i s s tudy, and conducted the tabular analysis of t h e vegetation. Dr. Karel Klinka (UBC), Reid Carter (UBC), and Vlad Korelus (C.I.P., Inc.) reviewed a n ini t ial draft of the report and provided helpful advice and comments.
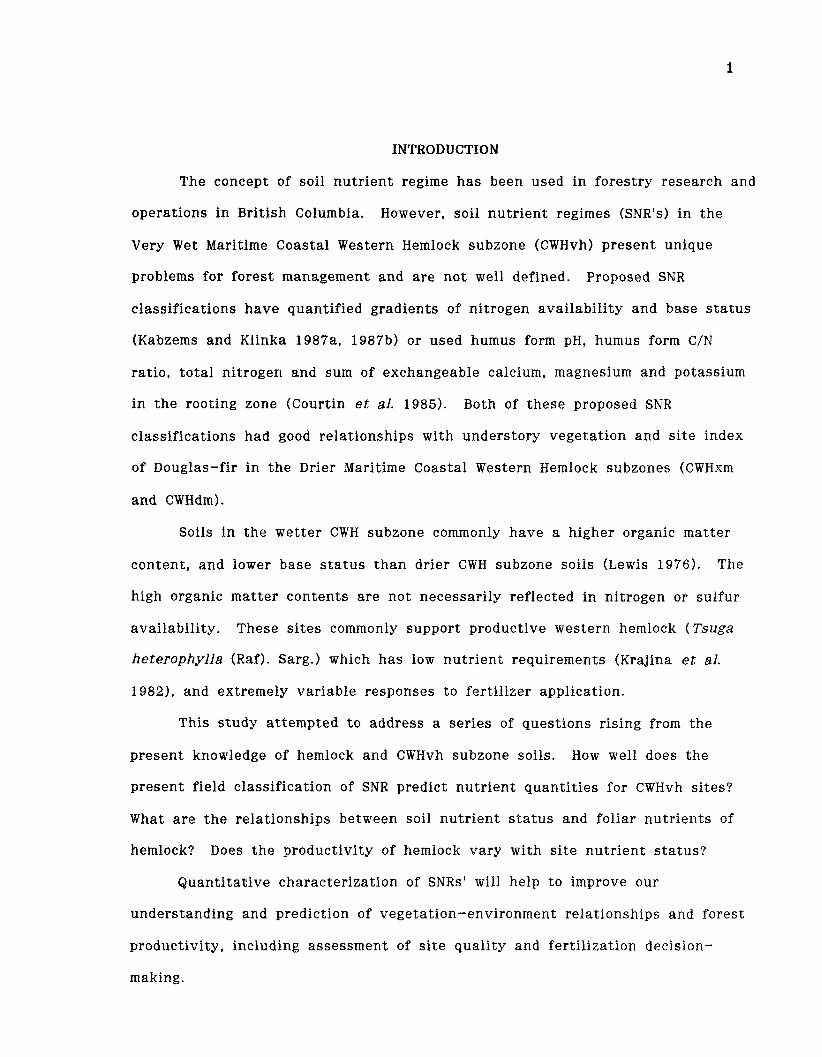
INTRODUCTION
The concept of soil nu t r ien t regime h a s been used in forestry research and
operations i n British Columbia. However, soil nu t r ien t regimes (SNR's) i n t h e
Very Wet Maritime Coastal Western Hemlock subzone (CWHvh) present unique
problems for fores t management and a r e no t well defined. Proposed SNR
classifications h a v e quantified gradients of nitrogen avai labi l i ty and base s t a t u s
(Kabzems and Klinka 1987a, 1987b) or used humus form pH, humus form C/N
rat io , t o t a l nitrogen and sum of exchangeable calcium, magnesium and potassium
i n t h e rooting zone (Courtin et al. 1985). Both of t hese proposed SNR
classifications had good relationships with understory vegetat ion and s i t e index
of Douglas-fir i n t h e Drier Maritime Coastal Western Hemlock subzones (CWHxm
and CWHdm).
Soils i n t h e wet te r CWH subzone commonly have a higher organic matter
content , and lower base s t a t u s t han drier CWH subzone soils (Lewis 1976). The
high organic matter conten ts a r e not necessarily reflected in nitrogen or sulfur
availabili ty. These s i t e s commonly support productive western hemlock (Tsuga
heterophyl la (Raf). Sarg.) which h a s low nut r ien t requirements (Krajina et al.
19821, and extremely variable responses t o ferti l izer application.
This s tudy at tempted t o address a ser ies of quest ions rising from t h e
present knowledge of hemlock and CWHvh subzone soils. How well does t h e
present field classification of SNR predict nu t r ien t quant i t ies for CWHvh s i tes?
What a r e t h e relat ionships between soil nu t r i en t s t a t u s and foliar nu t r ien ts of
hemlock? Does t h e productivity of hemlock v a r y with s i t e nu t r ien t s t a tu s?
Quant i ta t ive character izat ion of SNRs' will help t o improve our
understanding and prediction of vegetation-environment relationships and forest
productivity, including assessment of s i t e qual i ty and ferti l ization decision-
making.
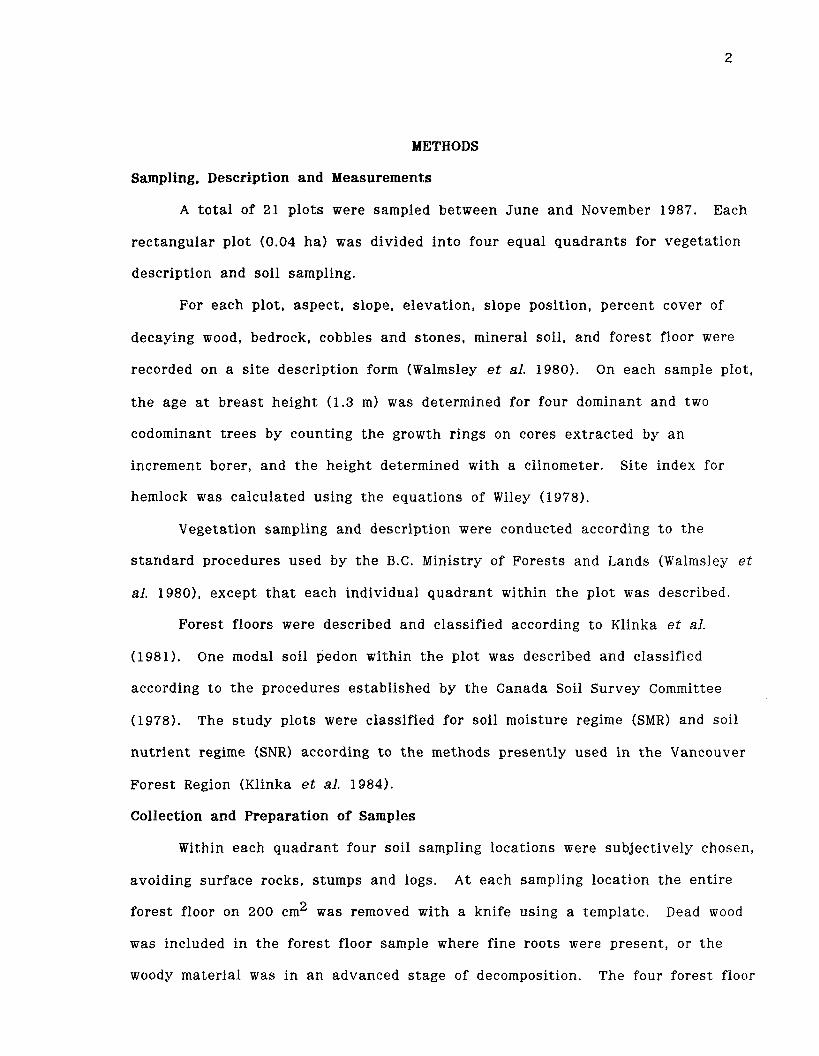
METHODS
Sampling, Description a n d Measurements
A to t a l of 21 plots were sampled between June and November 1987. Each
rectangular plot (0.04 ha) was divided in to four equal quadrants for vegetation
description and soil sampling.
For each plot , aspect , slope, e levat ion, slope position, percent cover of
decaying wood, bedrock, cobbles and s tones, mineral soil, and forest floor were
recorded on a s i t e description form (Walmsley e t al. 1980). On each sample plot,
t h e age at breas t height (1.3 m) was determined for four dominant and two
codominant t r ee s by counting t h e growth rings on cores ex t rac ted by a n
increment borer, and t h e height determined with a clinometer. Si te index for
hemlock was calculated using t h e equat ions of Wiley (1978).
Vegetation sampling and description were conducted according t o t h e
s tandard procedures used by t h e B.C. Ministry of Forests and Lands (Walmsley et
al. 1980), except t h a t each individual quadrant within t h e plot was described.
Forest floors were described and classified according t o Klinka et al.
(1981). One modal soil pedon within t h e plot was described and classified
according t o t h e procedures establ ished by t h e Canada Soil Survey Committee
(1978). The s tudy plots were classified for soil moisture regime (SMR) and soil
nu t r i en t regime (SNR) according t o t h e methods present ly used in t h e Vancouver
Forest Region (Klinka e t al. 1984).
Collection a n d Preparation of Samples
Within each quadrant four soil sampling locations were subjectively chosen,
avoiding surface rocks, stumps and logs. At each sampling location t h e en t i re
forest floor on 200 cm2 was removed with a knife using a template. Dead wood
was included in t h e forest floor sample where f ine roots were present , or t h e
woody material was in a n advanced s t age of decomposition. The four forest floor
samples for each quadrant were composited in t h e field. At each sampling
location a small pi t was dug t o allow sampling of t h e upper 30 cm of mineral
soil. At two of t h e four locations, pi ts were dug t o t h e bottom of rooting depth.
Within each quadrant , t h e four upper mineral soil samples were composited, and
t h e two lower mineral soil ( >30 cm) samples were composited, One bulk
density sample was taken within each quadrant for each sampling s t r a t a (forest
floor, upper mineral soil, lower mineral soil). From one p i t within each plot,
coarse fragments larger than 2.5 cm in diameter were weighed and t h e pi t
dimensions measured to determine coarse fragment content. For two plots, a l l
soil samples were analyzed individually to assess property variability.
After air-drying, a l l mineral soil samples were crushed with a wooden
roller, passed through a 2 mm sieve to remove the coarse fraction and stored
unti l chemical analysis was complete. Forest floor samples were ground with a
Wiley Mill a f te r a i r drying, and stored unti l chemical analysis was complete.
Subsamples of mineral soil and forest floor were oven-dried a t 105' C and
70' C, respectively, t o calculate t h e rat io of air-dry to oven-dry weight. All
da ta were expressed on a n oven-dry basis.
During September and October, 1987, on each plot the current year 's
foliage from fifteen dominant or codominant hemlock t rees was sampled following
t h e guidelines given by Ballard and Carter (1986). Foliage samples were oven
dried at 70° C for eight hours, ground finely in a Braun model KSM2 coffee
grinder, and stored unt i l chemical analysis was complete.
Laboratory Analysis
Laboratory methods used for analysis of forest floor and mineral soil
samples and abbreviations used in the t ex t a re given in Table 1.
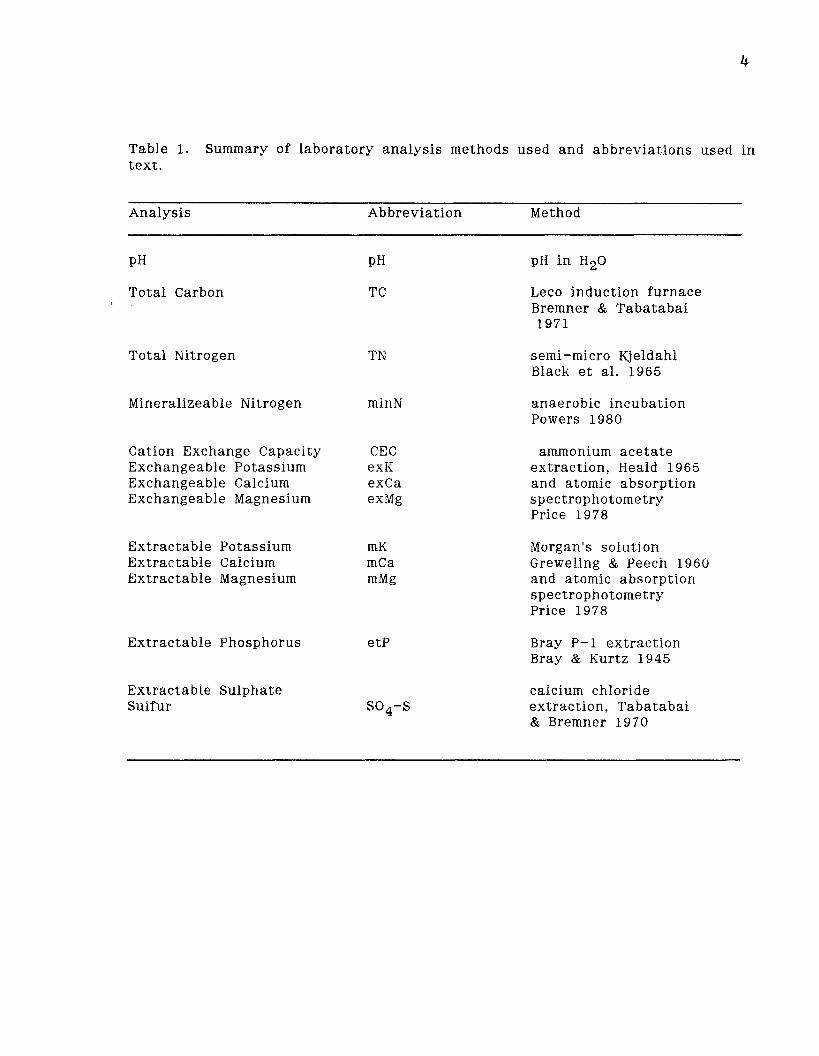
Table I . Summary of laboratory analysis methods used and abbreviat ions used in tex t .
Analysis Abbreviation Method
Total Carbon
Total Nitrogen
Mineralizeable Nitrogen minN
Cation Exchange Capacity CEC Exchangeable Potassium exK Exchangeable Calcium exCa Exchangeable Magnesium exMg
Extractable Potassium mK Extractable Calcium mCa Extractable Magnesium mMg
Extractable Phosphorus e tP
Extractable Sulphate Sulfur SO4-S
Leco induction furnace Bremner & Tabatabai 1971
semi-micro Kjeldahl Black e t al . 1965
anaerobic incubation Powers 1980
ammonium ace t a t e extract ion, Heald 1965 and atomic absorption spectrophotometry Price 1978
Morgan's solution Greweling & Peech 1960 and atomic absorption spectrophotometry Price 1978
Bray P-1 extraction Bray & Kurtz 1945
calcium chloride extract ion, Tabatabai & Bremner 1970
Bulk density of t h e forest floor and mineral soil samples was determined
according to t h e procedures described in Klinka e t al. (1981). Mineral soil bulk
densi ty was determined on a coarse-fragment free basis.
Foliar samples were analyzed for N, P, K, S, Ca, Mg, Fe, Al, Mn, Cu, Zn, B,
SO4-S, and 'active' Fe (AFe) using methods recommended by Ballard and Carter
(1986).
Soil Moisture Analysis
The growing season water balance model of Spittlehouse and Black (1981)
was used t o calculate potential evapotranspiration, actual evapotranspiration and
monthly moisture deficit.
Data Summary and Stat is t ical Analysis
Vegetation Analysis
Classification of sample plots was carried out according to the tabular
method (Mueller-Dombois and Ellenberg, 19741, using computerized tabling
programs (Emanuel, 1986) and following t h e methods described by Pojar et al.
(1987).
Each species was assigned to one of eleven life-form and indicator species
groups. Species without indicative values were excluded from the spectral
analysis. Krajina et al. (1986) was t h e source of ecological amplitudes for the
species. Klinka e t al. (1986) provided indicator groups, and classification of
these groups. For each quadrant a n a t t r ibu te and spectral value was calculated
from a sum or percent cover of al l species. The resulting values gave the
relat ive proportions (weighted by abundance-dominance) of particular species
groups present in t h e plot.
Multivariate analysis of vegetation was conducted using the reciprocal
averaging (RA) subroutine of the ORDIFLEX (Release B) program (Gauch, 1977).
Foliar Nutrient S ta tus
Analysis of foliar nut r ient s t a t u s for t h e s tudy s t ands was performed with
t h e FNA program (Emanuel 1984) which is based on the research and programs of
Dr. T. M. Ballard (Department of Soil Science and Faculty of Forestry, U.B.C.).
Soil Properties
Seven da ta s e t s were used in da ta analysis. Forest floor, and upper (0-30
cm) mineral soil da ta expressed a s chemical concentrations were two da ta se ts .
Four other da ta s e t s expressed values on a n areal basis (kg/ha). The kg/ha
da ta s e t s were: 1) forest floor, 2) upper mineral soil, 3) upper plus lower mineral
soil, 4) forest floor plus upper mineral soil, and 5) forest floor plus mineral
soil.
In al l soil da ta s e t s a na tura l log transformation In ( x + l ) was used to
improve homogeneity of variance for al l soil properties except pH, and t h e
chemical concentrations of TC, and TN.
Analysis of variance (ANOVA) was used to determine if significant
differences were present between groups of s tudy s tands using SYSTAT
(Wilkinson, 1987). Size effects in ANOVA ( ~ t a ~ ) were also determined. ~ t a ~
and r2 are identical i n the i r calculation and interpretation. They express the
proportion of to ta l variation accounted for by an effect.
The following ANOVA model was used:
y = group + plot within group + e
where y is t h e variable (eg. TN) and group i s the effect being examined (eg.
plots grouped according to lithology).
Multivariate analysis techniques (SYSTAT, Wilkinson 1987) were utilized to
determine. 1; vnderlying or unknown relationships between the variables and
s tudy plots (principal components analysis, PCA), 2) to asses whether natural
groups occur in t h e sample population and t o determine the extent to which the
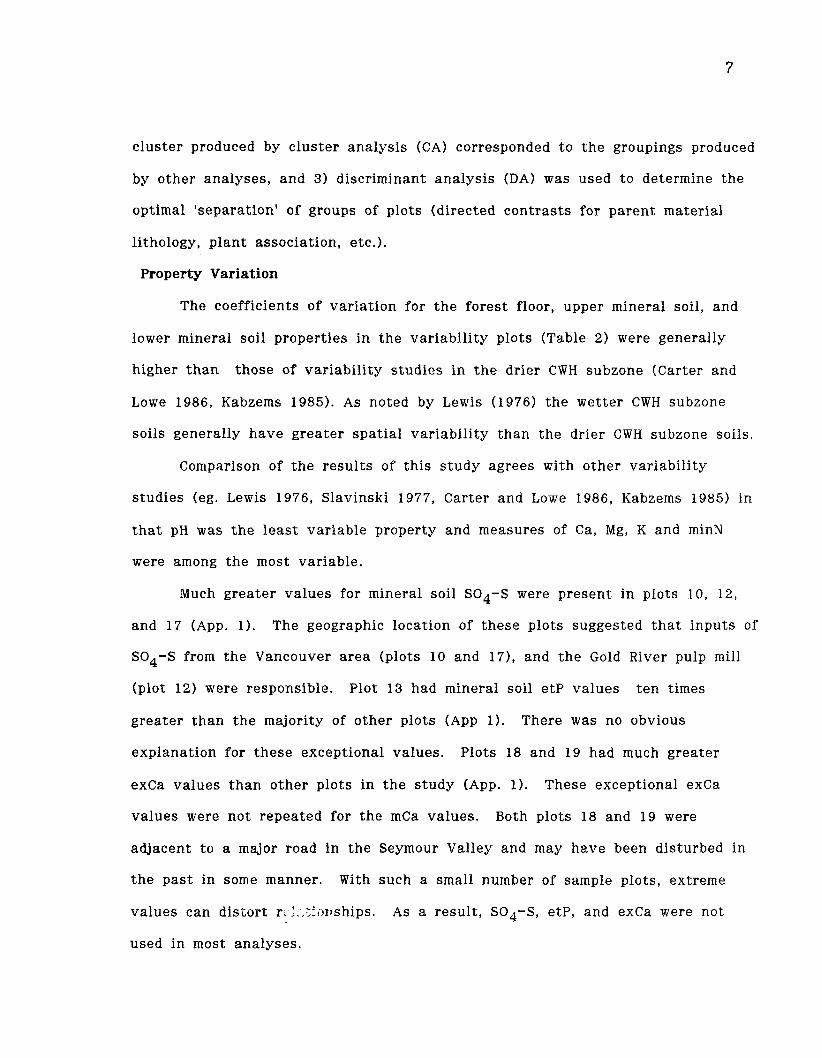
cluster produced by c lus te r analysis (CAI corresponded t o t h e groupings produced
by o ther analyses , and 3) discriminant ana lys is (DA) was used t o determine t h e
optimal 'separation' of groups of plots (directed cont ras t s for parent material
lithology, p lan t association, etc.).
Property Variation
The coefficients of var iat ion for t h e forest floor, upper mineral soil, and
lower mineral soi l properties i n t h e variabi l i ty plots (Table 2) were generally
higher t h a n those of variabi l i ty s tud ies i n t h e drier CWH subzone (Carter and
Lowe 1986, Kabzems 1985). As noted by Lewis (1976) t h e wet te r CWH subzone
soils generally have grea te r spa t ia l var iabi l i ty t h a n t h e drier CWH subzone soils.
Comparison of t h e resu l t s of t h i s s tudy agrees with o ther var iabi l i ty
s tud ies (eg. Lewis 1976, Slavinski 1977, Carter and Lowe 1986, Kabzems 1985) i n
t h a t pH was t h e l e a s t var iable property and measures of Ca, Mg, K and minN
were among t h e most variable.
Much grea te r va lues for mineral soil SO4-S were present i n plots 10, 12,
and 17 (App. 1). The geographic location of t hese plots suggested t h a t inputs of
SO4-S from t h e Vancouver a r ea (plots 10 and 171, and t h e Gold River pulp mill
(plot 12) were responsible. Plot 13 had mineral soil e tP va lues t en times
grea te r t han t h e majority of o ther plots (App 1). There was no obvious
explanation for t hese exceptional values. Plots 18 and 19 had much grea te r
exCa values t h a n o ther plots i n t h e s tudy (App. 1). These exceptional exCa
values were not repeated for t h e mCa values. Both plots 18 and 19 were
adjacent t o a major road in t h e Seymour Valley and may have been disturbed in
t h e pas t in some manner. With such a small number of sample plots, extreme
values can d is ior t r, l.,:ir,rlships. As a resu l t , SO4-S, etP, and exCa were not
used in most analyses .
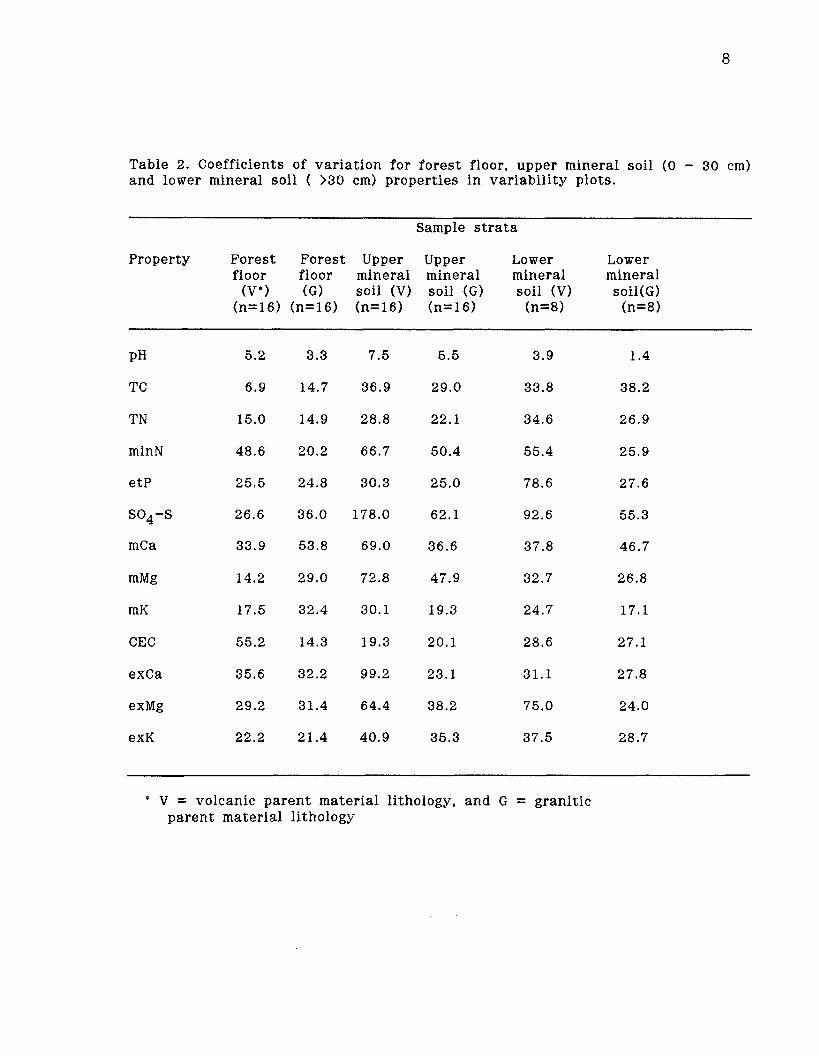
Table 2. Coefficients of variat ion for forest floor, upper mineral soil (0 - 30 cm) and lower mineral soil ( >30 em) properties in variability plots.
Sample s t r a t a
Property Forest Forest Upper Upper Lower Lower floor floor mineral mineral mineral mineral
(V') (GI soil (V) soil (GI soil (V) soil(G) (n=16) (n=16) (n=16) (n=16) (n=8> (n=8)
CEC
exCa
" V = volcanic parent material lithology, and G = granitic parent material lithology
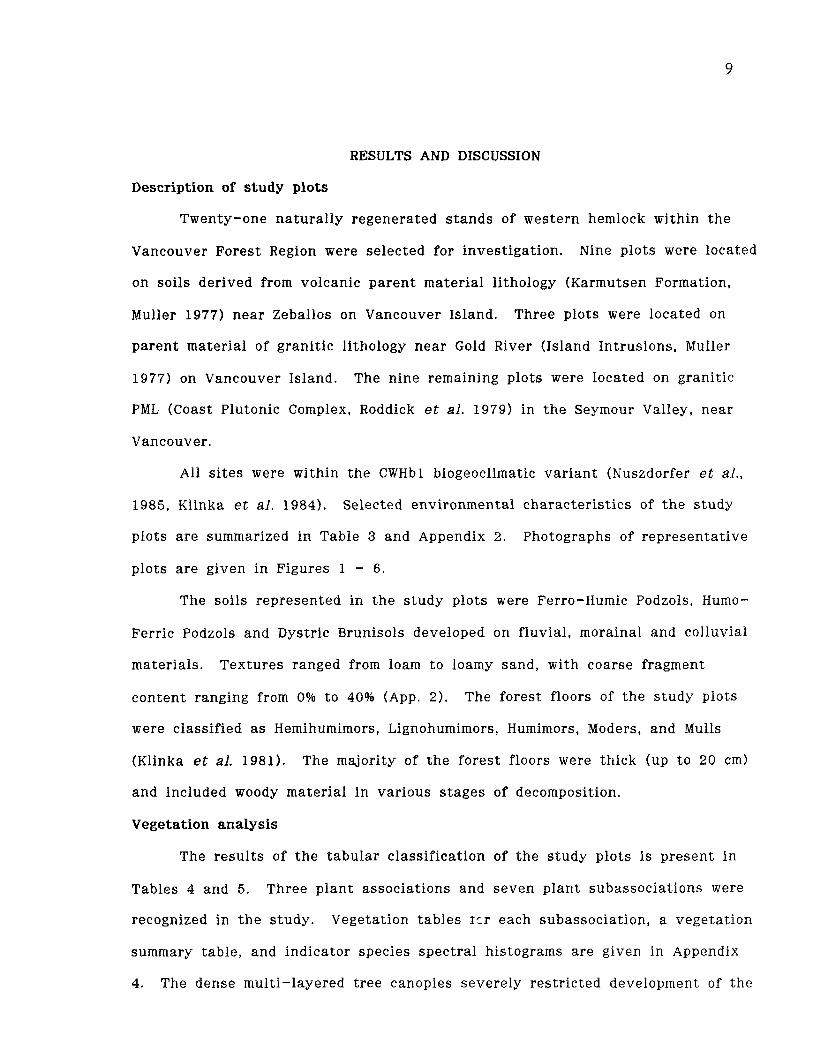
RESULTS AND DISCUSSION
Description of s tudy plots
Twenty-one natural ly regenerated s t ands of western hemlock within the
Vancouver Forest Region were selected for investigation. Nine plots were located
on soils derived from volcanic parent material lithology (Karmutsen Formation,
Muller 1977) near Zeballos on Vancouver Island. Three plots were located on
parent material of granitic lithology near Gold River (Island Intrusions, Muller
1977) on Vancouver Island. The nine remaining plots were located on granitic
PML (Coast Plutonic Complex, Roddick e t al . 1979) in the Seymour Valley, near
Vancouver.
All s i tes were within t h e CWHbl biogeoclimatic var iant (Nuszdorfer e t al.,
1985, Klinka e t al. 1984). Selected environmental character is t ics of t h e s tudy
plots a re summarized in Table 3 and Appendix 2 . Photographs of representat ive
plots a re given in Figures 1 - 6.
The soils represented in t h e s tudy plots were Ferro-Humic Podzols, Humo-
Ferric Podzols and Dystric Brunisols developed on fluvial, morainal and colluvial
materials. Textures ranged from loam t o loamy sand, with coarse fragment
content ranging from 0% to 40% (App. 2). The forest floors of the s tudy plots
were classified a s Hemihumimors, Lignohumimors, Humimors, Moders, and Mulls
(Klinka et al. 1981). The majority of t h e forest floors were thick (up to 20 cm)
and included woody material i n various s tages of decomposition.
Vegetation analysis
The resul ts of t h e tabular classification of t h e s tudy plots is present in
Tables 4 and 5. Three plant associations and seven plant subassociations were
recognized in t h e s tudy. Vegetation tables rcr each subassociation, a vegetation
summary table, and indicator species spectral histograms are given in Appendix
4. The dense multi-layered t ree canopies severely restricted development of the
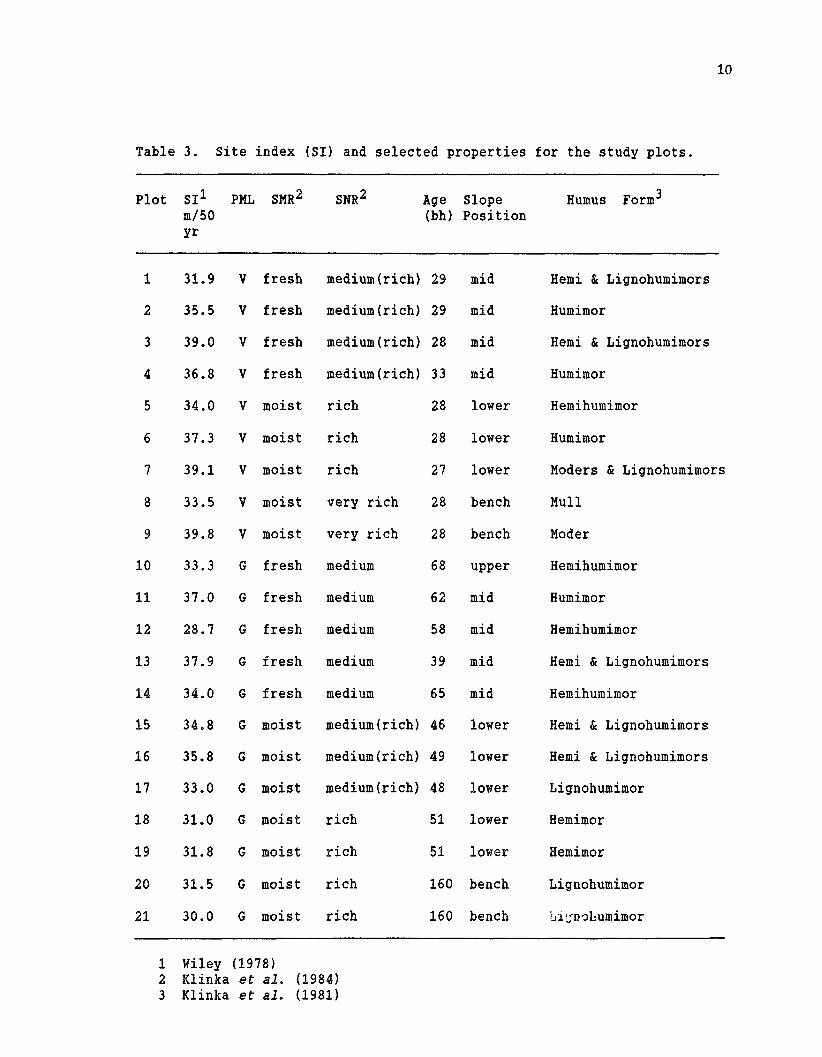
Table 3. Site index (SI) and selected properties for the study plots.
plot S I ~ PML S M R ~ S N R ~ Age Slope Humus Form 3 m/50 (bh) Position Yr
V fresh
V fresh
V fresh
V fresh
V moist
V moist
V moist
V moist
V moist
G fresh
G fresh
G fresh
G fresh
G fresh
G moist
G moist
G moist
G moist
G moist
G moist
G moist
medium(rich) 29
medium (rich) 29
medium (rich) 28
medium (rich) 33
rich 2 8
rich 2 8
rich 27
very rich 28
very rich 28
medium 6 8
medium 6 2
medium 5 8
medium 3 9
medium 6 5
medium(rich) 46
medium (rich) 49
medium (rich) 48
rich 5 1
rich 51
rich 160
rich 160
mid
mid
mid
mid
lower
lower
lower
bench
bench
upper
mid
mid
mid
mid
lower
lower
lower
lower
lower
bench
bench
Hemi & Lignohumimors
Humimor
Hemi & Lignohumimors
Humimor
Hemihumimor
Humimor
Moders & Lignohumirnors
Mull
Moder
Hemihumimor
Humimor
Hemihumimor
Hemi & Lignohumimors
Hemihumimor
Hemi & Lignohumimors
Hemi & Lignohumimors
Lignohumimor
Hemimor
Hemimor
Lignohumimor
21 'jn31:umimor
1 Wiley (1978) 2 Klinka et al. (1984) 3 Klinka et al. (1981)
d+
r
ld t
kk
Q
,Q
,Q
,
4 ca
>Q
,C
bc
5
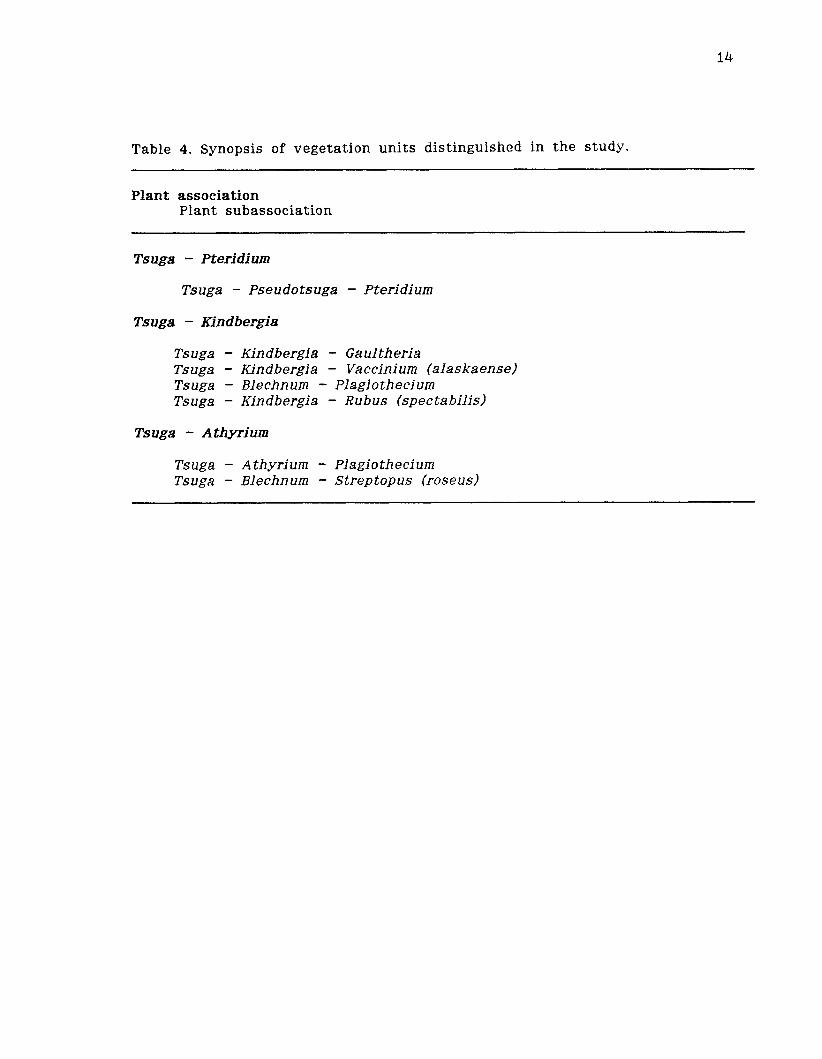
Table 4. Synopsis of vegetation units distinguished in the study.
Plant association Plant subassociation
Tsuga - Pteridium
Tsuga - Pseudotsuga - Pteridium
Tsuga - Kindbergia
Tsuga - Kindbergia - Gaultheria Tsuga - Kindbergia - Vaccinium (alaskaense) Tsuga - Blechnum - Plagiothecium Tsuga - Kindbergia - Rubus (spectabilis)
Tsuga - Athyrium
Tsuga - Athyrium - Plagiothecium Tsuga - Blechnum - Streptopus (roseus)
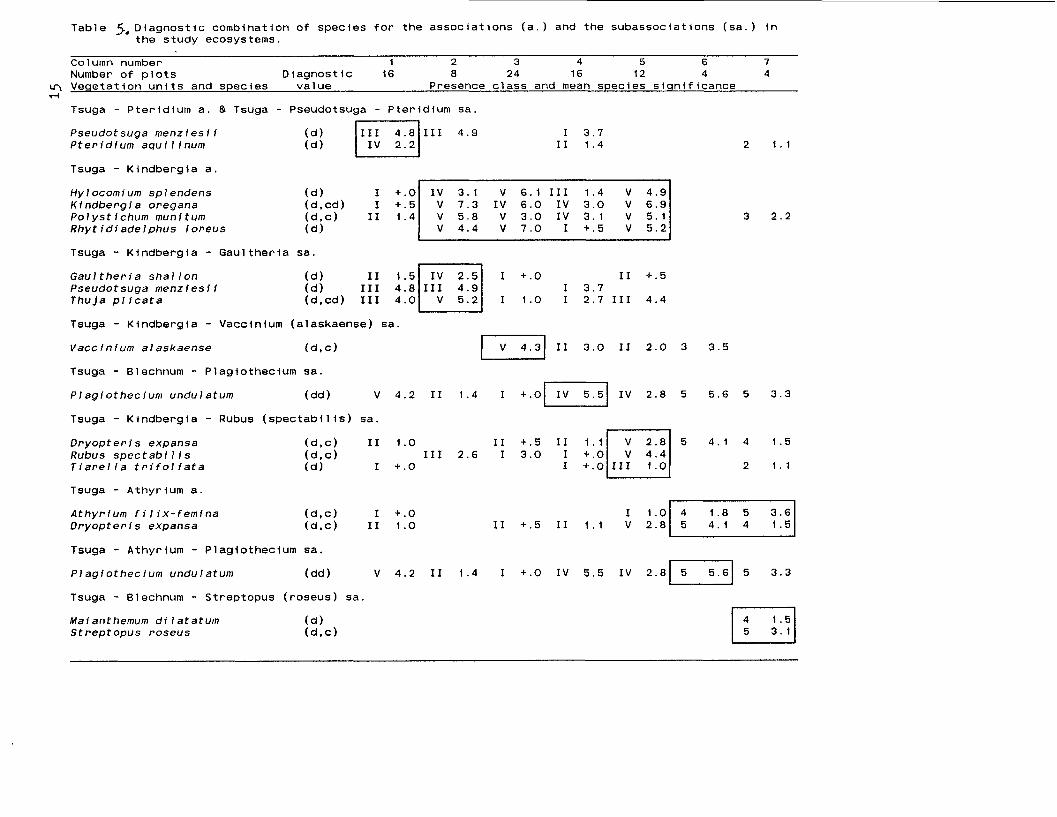
Table 5,Diagnostic comblnation of species for the associations (a.) and the subassociations (sa.) in the study ecosystems.
Column number 1 2 3 4 5 6 7 Number of plots Diagnostic 16 8 2 4 16 12 4 4
u-1 Veaetatlon units and species value Presence class and mean species significance 4
Tsuga - Pteridium a. & Tsuga - Pseudotsuga - Pteridium sa.
Pseudotsuga menziesii Pteridium aquilinum
Tsuga - Klndbergia a.
Tsuga - Ktndbergia - Gaultherla sa. Gaultheria shallon (d ) I1 +.5 Pseudotsuga menzlesii (d 1 3 . 7 Thuja plicata I 2.7 I11 4 . 4
Tsuga - Kindbergia - Vaccinium (alaskaense) sa.
Hylocomium splendens (dl I + . O Kindbergia oregana (d,cd) I + . 5 Polystichum munitum (d,c) I1 1 . 4 Rhytidiadelphus loreus ( d )
Vaccinfum alaskaense ( d , ~ )
IV 3 . 1 V 6 . 1 I11 1 . 4 V 4 . 9 V 7 . 3 IV 6 . 0 IV 3 . 0 V 6 . 9 V 5.8 V 3 . 0 IV 3 . 1 V 5 . 1 V 4 . 4 V 7 . 0 1 + . 5 V 5 . 2
Tsuga - Blechnum - Plagtothectum sa.
Plagiothecium undulatum (dd) V
Tsuga - Ktndbergia - Rubus (spectabtlts) sa. Dryopteris expansa Rubus spectabflis Tiarella trifoliata
Tsuga - Athyrlum a. Athyrium filix-femina Dryopteris expansa
Tsuga - Athyrium - Plagiothecium sa. Plagiothecium undulatum (dd V
Tsuga - Blechnum - Streptopus (roseus) sa. Maianthemum dilatatum Streptopus roseus
understory vegetat ion. The two plots (20, 21) i n older s t ands with more open
canopies had a much be t te r developed understory (Fig. 6).
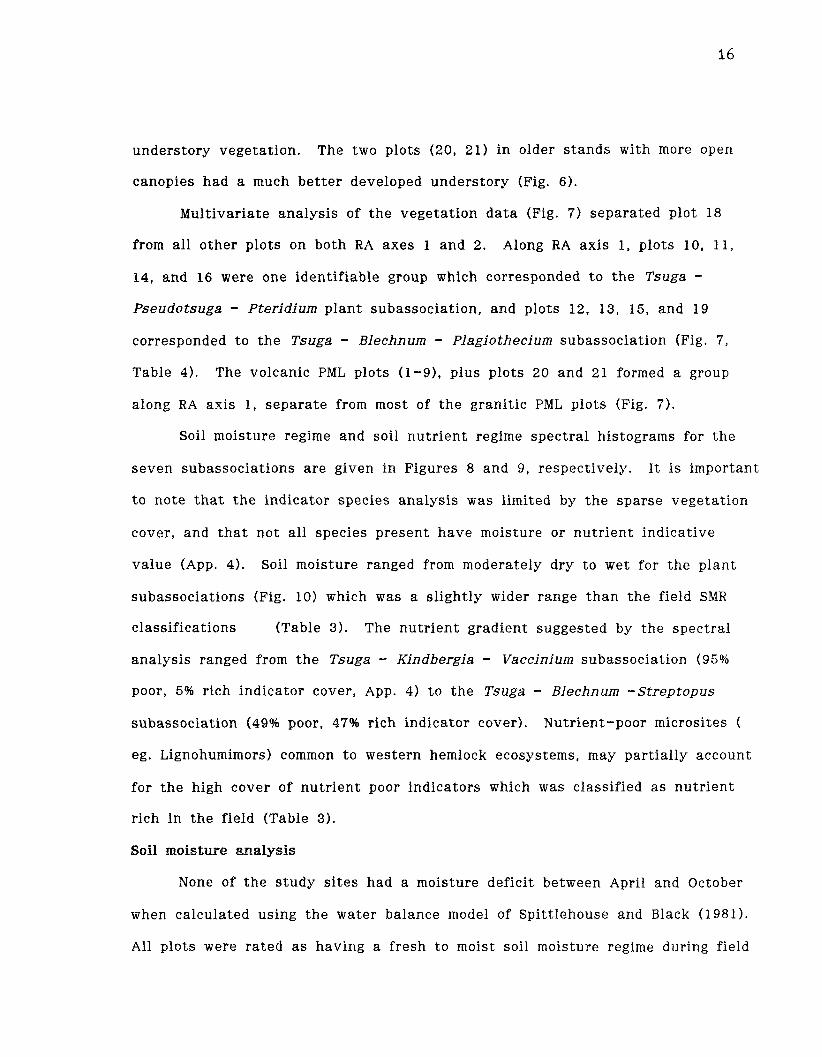
Multivariate analysis of t h e vegetat ion d a t a (Fig. 7) separa ted plot 18
from a l l o ther plots on both RA axes 1 and 2. Along RA axis 1, plots 10, 11,
14, and 16 were one identifiable group which corresponded t o t h e Tsuga -
Pseudotsuga - Pteridium plant subassociation, and plots 12, 13, 15, and 19
corresponded t o t h e Tsuga - Blechnum - Plagiothecium subassociation (Fig. 7,
Table 4). The volcanic PML plots (1-91, plus plots 20 and 21 formed a group
along RA axis 1, separa te from most of t h e grani t ic PML plots (Fig. 7).
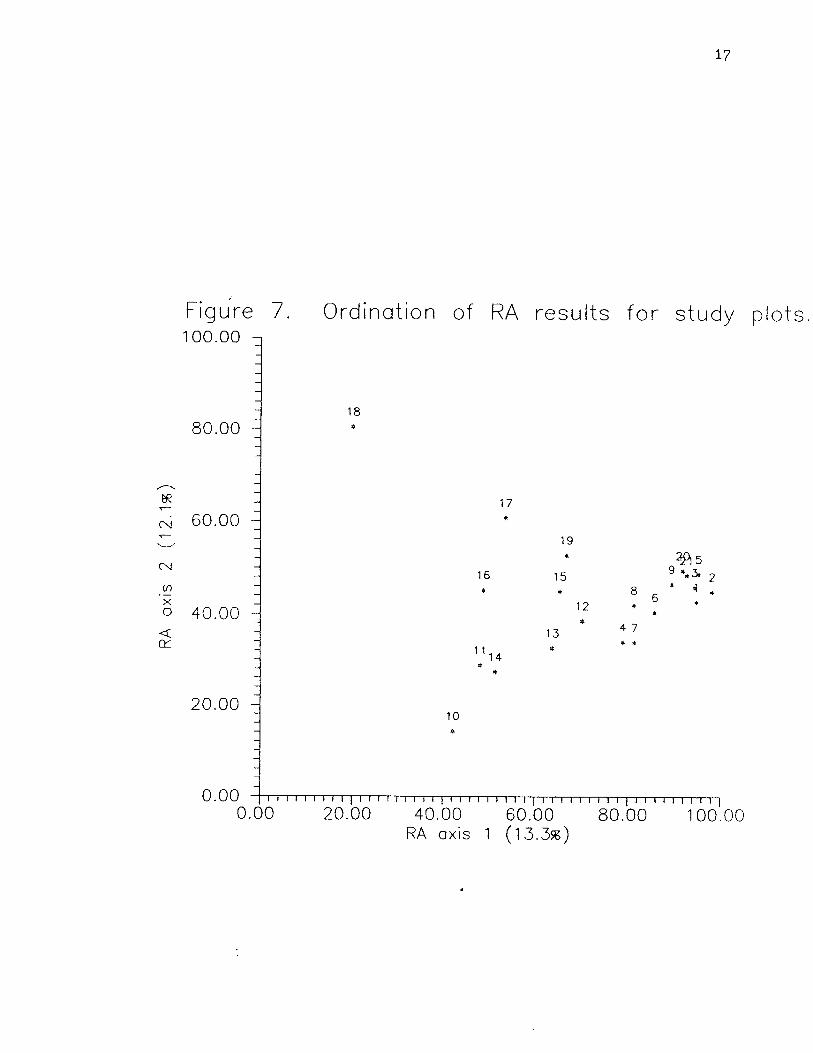
Soil moisture regime and soil nu t r ien t regime spec t ra l histograms for t h e
seven subassociations a r e given in Figures 8 and 9, respectively. I t is important
t o note t h a t t h e indicator species analysis was limited by t h e sparse vegetat ion
cover, and t h a t no t a l l species present have moisture or nu t r ien t indicat ive
va lue (App. 4). Soil moisture ranged from moderately dry to wet for t h e plant
subassociations (Fig. 10) which was a s l ight ly wider range than t h e field SMR
classifications (Table 3) . The nut r ien t gradient suggested by t h e spectral
analysis ranged from t h e Tsuga - Kindbergia - Vaccinium subassociation (95%
poor, 5% rich indicator cover, App. 4) t o t h e Tsuga - Blechnum -Streptopus
subassociation (49% poor, 47% rich indicator cover). Nutrient-poor microsites (
eg. Lignohumimors) common t o western hemlock ecosystems, may part ia l ly account
for t h e high cover of nu t r ien t poor indicators which was classified as nut r ien t
rich in t h e field (Table 3) .
Soil moisture analysis
None of t h e s tudy s i t e s had a moisture deficit between April and October
when calculated using t h e water balance model of Spitt lehouse and Black (1981).
All plots were ra ted a s having a fresh t o moist soil moisture regime during field
~ i ~ u r e 7. Ordination of RA results for study plots. 100.00 -
- - - - - - - -
80.00 - - - - - -
A
eR - -
T - 60.00 1
7 - V -
- CU - - v, - . - - X - 0 40.00 < 4 - CY -
- - - - - -
20.00 - - - - - - - -
0.00 0.00
I l l l r l l l l ~ l l l l l l l l l ~ l l l l l " ~ l ~ l " " " " , l l ' l l l l ' l ~
20.00 40.00 60.00 80.00 100.00 RA axis 1 (13.3%)
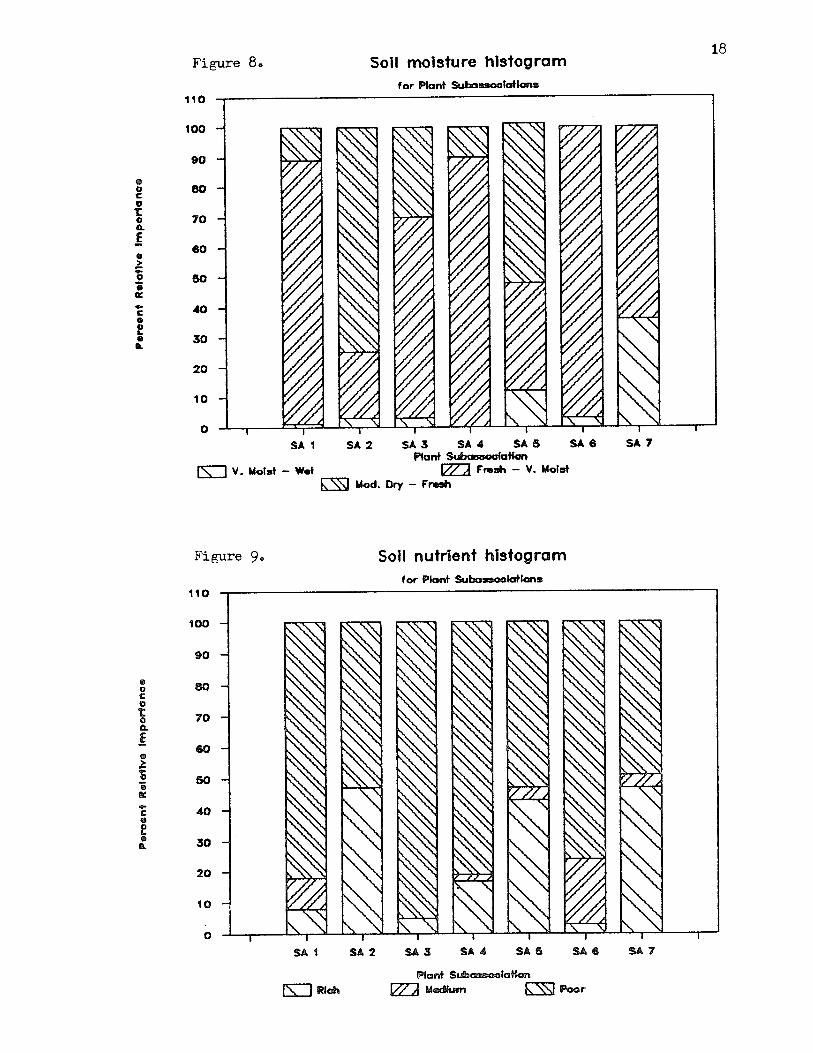
Figure 8. Soil moisture histogram
Figure 9. Soil nutrlent histogram
classification, which would not have a moisture deficit i n most years in t he Very
Wet Maritime CWH subzone (Klinka et al. 1984).
The water balance model did not incorporate factors for slope, aspect , or
depth of forest floor. The differences i n evapotranspirat ion between plots a s
predicted by t h e model was mainly due t o differences in rooting depth, t ex ture ,
and coarse fragment content (App. 2). As a resu l t of t hese deficiencies, t h e
evapotranspirat ion va lues for each plot probably were not representa t ive of
ac tua l conditions.
Root Distribution
During soil sampling t h e majority of fine roots important for nu t r ien t
uptake were observed t o be in t h e forest floor, or a t t h e forest floor - mineral
soil interface. The maximum mineral soil rooting depths ranged from 35 to 80 cm
(App. 2). For classification of a s i te , t h e to ta l volume of soil avai lable for
rooting should be used t o characterize SNR (Klinka et al. 1984). Western
hemlock on most of t h e sampled s i t e s did not appear t o be utilizing the en t i re
potent ial rooting space. This suggested t h e possibility t h a t hemlock nutr i t ional
s t a t u s may correlate be t t e r t o a portion (eg. forest floor plus upper mineral soil)
of t he potent ial rooting volume, r a the r t h a n t h e en t i re rooting volume. This
hypothesis was examined by comparing soil nu t r i en t s from various portions of t h e
rooting zone t o foliar nu t r ien ts and s i t e index.
SOIL PROPERTIES
Parent Material Lithology
Over 73% of t h e variat ion i n forest floor chemical d a t a could be explained
by differences i n PML, for a l l properties except TC and CEC (Table 6). However,
on a kg/ha basis, forest ~'il-o? TC, TN, minN and CEC had over 80% of the i r
var iat ion explained by differences in PML (Table 6). In general t h e volcanic PML
plots had higher forest floor pH and grea te r concentrations of Ca, Mg, and K.
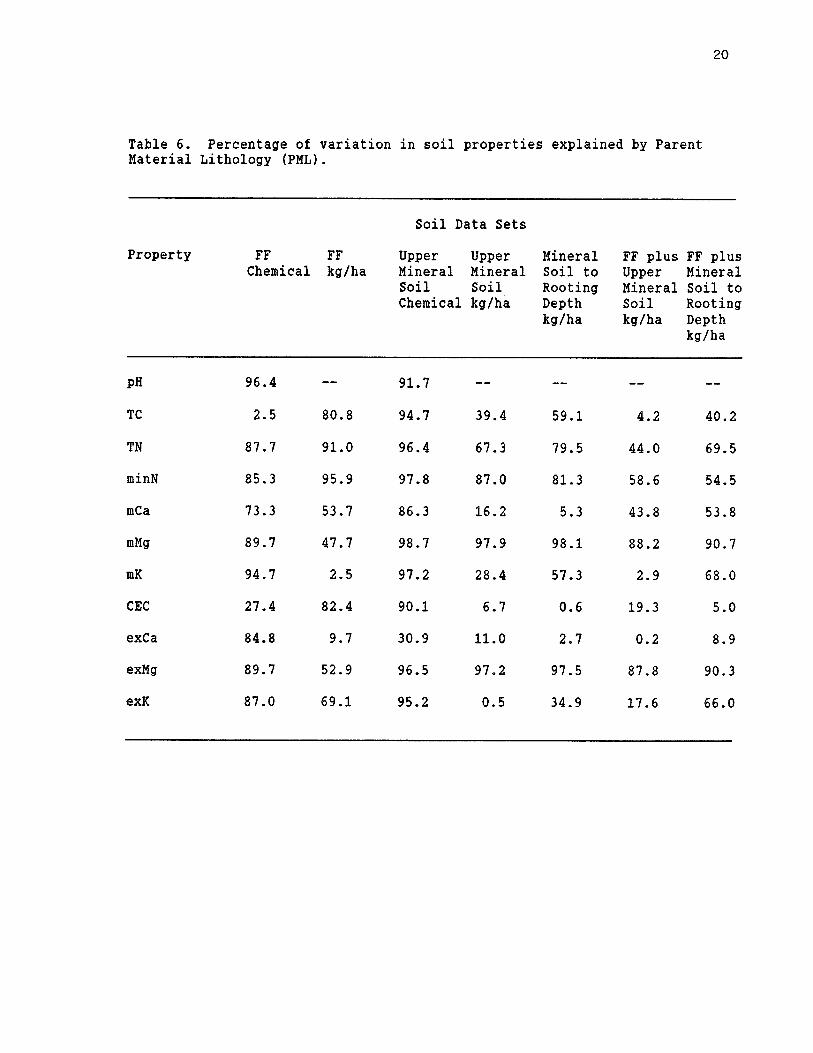
Table 6. Percentage of variation in soil properties explained by Parent Material Lithology (PML).
Soil Data Sets
Property FF FF Upper Upper Mineral FF plus FF plus Chemical kg/ha Mineral Mineral Soil to Upper Mineral
Soil Soil Rooting Mineral Soil to Chemical kg/ha Depth Soil Rooting
kg/ha kg/ha Depth kg/ha
PH
TC
TM
minN
mCa
mMg
mK
CEC
exCa
exMg
exK
Forest floor TC, TN and minN were grea te r i n t h e grani t ic PML (App. 1). The
grea te r depth and bulk densi ty of most of t h e grani t ic forest floors, resulted in
generally grea te r nu t r i en t quant i t ies i n t h e grani t ic PML plots (App. 1). The
depth and bulk dens i ty of t h e forest floor would reflect s i t e his tory, inputs of
large woody material in to t h e forest floor, and humus form.
For a l l upper mineral soil chemical properties except exCa, over 86% of t he
variat ion could be explained by PML (Table 6). The s t ra t i f ica t ion of plots by
lithology assumed t h a t t h e granitic PML plots would have grea te r K avai labi l i ty ,
and t h e volcanic PML plots grea te r Ca and Mg avai labi l i ty , based on mineralogy
of t h e parent material lithology. Al l chemical concentrations, including mK and
exK, were grea te r i n t h e upper mineral soil of t h e volcanic PML plots (App. 1) .
When physical factors (coarse fragment content , bulk densi ty) were used t o
determine nut r ien t avai labi l i ty on a kg/ha basis, only TN, minN, mMg and exMg
had over 50% of var iat ion explained by PML (Table 6). Plot within PML
variat ion was larger t h a n between PML variat ion for all o ther upper mineral soil
(kg/ha) properties. Mineral soil t o rooting depth had t h e majority of var iat ion
explained by differences between t h e lithologies for mMg and exMg s t a t u s , and to
a lesser ex t en t minN, TN, and mK (Table 6). With t h e forest floor plus upper
mineral soil, and forest floor plus mineral soil t o rooting depth d a t a s e t s , only
mMg and exMg had over 60% of t h e variat ion explained by PML. Over 50% of
t h e variat ion in forest floor plus mineral soil t o rooting depth properties of TN,
minN, mK and exK could be explained by PML.
For each of t h e seven soil d a t a s e t s PML accounted for grea te r t han 50%
of t h e variat ion for t h e majority of soil properties. The assumed differences in
base s t a t u s were most strongly expressed for Mg. . l 'ke differences between the
two PMLs' could not be a t t r ibu ted t o different mineralogy of t h e parent materials
alone because of t h e s tudy design. The two PMLs' were also confounded by
differences i n location, (which may include climatic differences), and s i t e history.
These important factors could not be separa ted out in s t a t i s t i ca l analysis , and
were a l l included in t h e 'PML' variation.
Multivariate Analysis of Soil Properties
The PCA of forest floor kg/ha properties (Fig. 10) separated t h e Moders
and Mulls (plots 7,8,9) from t h e thickest Lignohumimors (17,20,21) on t h e f i r s t
PCA axis . The relat ively th in moders and mulls had lower fores t floor nut r ien t
quant i t ies , bu t higher pH values t h a n most other plots (App. 1) . The second
PCA axis separated most of t h e granitic PML plots. The grani t ic PML plots
generally had grea te r minN and lower mMg quant i t ies t han t h e volcanic PML
plots. The exceptions were plot 12 with low minN values, and plots 19, 20, and
21 which had t h e highest forest floor mMg and mK quant i t ies (App. 1).
The upper mineral soil chemical properties PCA (Fig. 11) was interpreted
a s a n organic matter gradient . Plots 5, 6, 7, 8 , 9, and 17 represented t h e high
organic matter content end of t h e gradient and plot 10 t h e low end. The second
PCA axis again separated t h e two PMLs' on t h e basis of pH and mMg, with the
exceptions of plots 10, 12, and 1 3 (Fig. 11).
The PCA of forest floor plus mineral soil t o rooting depth (Fig. 12) also
separated t h e two PMLs'. Along t h e second PCA axis plots 10 and 12 were
separated from t h e majority of grani t ic PML plots. Plots 10 and 12 had grea te r
pH values bu t lower TN and TC quant i t ies within t h e rooting zone.
The resu l t s of t h e PCA confirmed t h a t t h e two PMLs' should be considered
as separa te populations. The PCA of fores t floor kg/ha properties separated t h e
plots in to three groups of contrast ing humus form (axis 1) a s well a s PML (axis
2). In each PCA analysis nu t r ien t gradients were present , wkizk were usually
highly correlated with TC, TN and minN.
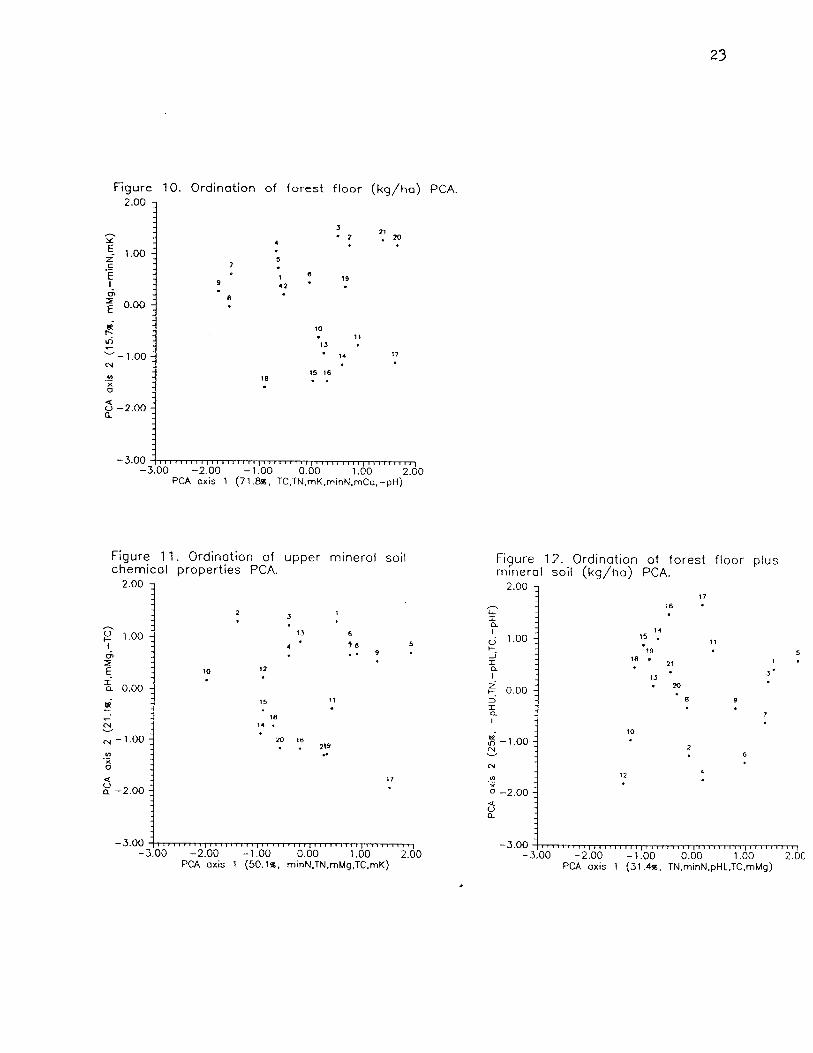
Figure 10. Ordina t ion of f o r e s t floor (kg /ha ) PCA.
2.00 3
U) .- j X
Q u -2.00 - a
-3.00 , , , , , , , , , , , , , , , , , , , -3.00 -2.00 -1.00 0.00 1.00 2.00
PCA axis 1 (71.8%. TC.TN.rnK.rninN.rnCo,-pH)
Figure 11. Ordination of upper mineral soil chemical properties PCA.
j 'OO i 2 3 1
-3.00 . . . . . . . . . . . . . . . . . . . . . . . . . . . . . . . . . . . . . . . . . . . . . . . . . . . -3.00 -2.00 -1.00 0.00 1.00 2.00
PCA axis 1 (50.1%. rninN.TN.rnMg.TC.rnK)
Figure 12. Ordination of forest floor plus m~neral soil (kg/ha) PCA.
17 ,--. 16 .
-3.00 0, -3.00 -2.00 -1.00 0.00 1.00 2.0C
PCA axis 1 (31.4%, TN.rninN.pHL.TC,rnMg)
FOLIAR NUTRIENTS
Foliar nu t r ien t analysis was conducted using t h e FNA program (Ballard and
Carter, 1986). All twenty-one s tudy plots were below recommended adequate
levels for N, P, K, S, and Zn (Table 7). All twenty-one plots were ra ted a s
e i ther having t h e likelihood of P deficiency or induced P deficiencies a f t e r N
ferti l ization. Plot 8 which had t h e highest foliar N content (1.41%, App. 31, had
t h e lowest foliar B levels. Eight of t h e remaining twenty plots had t h e
possibility of N ferti l ization induced or aggravated B deficiencies (Table 7).
Five plots had t h e potent ial for N fer t i l izer induced S deficiencies (Table 7).
The resu l t s were similar t o t h a t of o ther s tud ies of hemlock foliar nu t r ien t
s t a t u s . Nitrogen deficiencies a r e common and widespread for conifers in t he
Pacific Northwest. Nitrogen ferti l izer t r ia l s for hemlock have given variable
resu l t s (Webster et al. 1976, RFNRP 1982) . This has been a t t r ibu ted to
deficiencies of P or other essent ia l nu t r ien ts and other character is t ics of hemlock
s i t e s and s t ands (Radwan e t al. 1984). Particularly a f t e r urea ferti l ization, there
may be a decrease in nut r ien t uptake caused by changes in pH, soil nu t r ien t
concentrations, and number and type of mycorrhizae (Gill and Lavender 1981).
In greenhouse t r ia l s with hemlock seedlings, Newsome (1985) found t h e optimum
response t o be for a combined N and P ferti l ization. Application of N ferti l izer
alone reduced foliar P concentrations, and vice versa.
Parent mater ial lithology accounted for t h e majority of t h e variat ion of
foliar N and P (Table 8) . The volcanic lithology plots had grea te r foliar
concentrations of both these nut r ien ts . The differences i n lithology were
confounded with differences i n s tand age (in general t h e grani t ic plots were
older, Table 31, a2d s i t e history, par t icular ly burning a f t e r harvest ing of t he old
growth in t h e Seymour Valley. The large difference in SOq-S between PMLs', was
probably due to indus t r ia l inputs from Vancouver and t h e Gold River pulp mill.
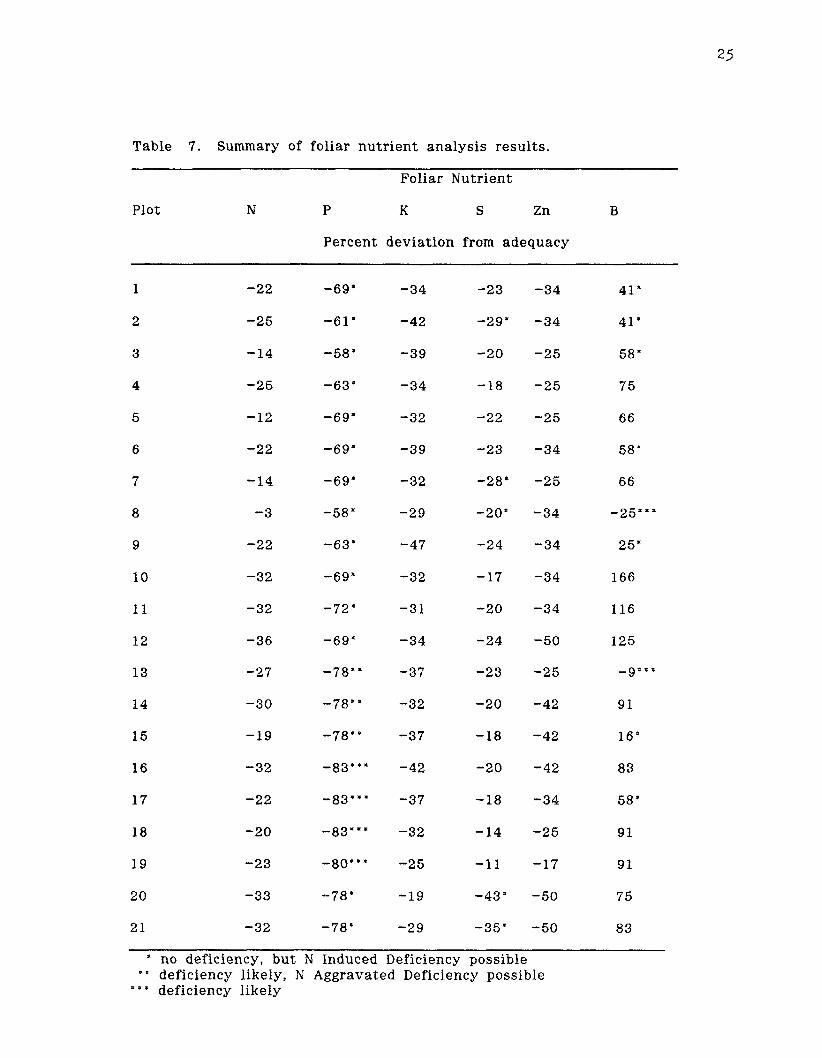
Table 7. Summary of foliar nut r ient analysis resul ts .
Foliar Nutrient
Plot N P K S Zn B
Percent deviation from adequacy
a no deficiency, but N Induced Deficiency possible "' deficiency likely, N Aggravated Deficiency possible " * deficiency likely
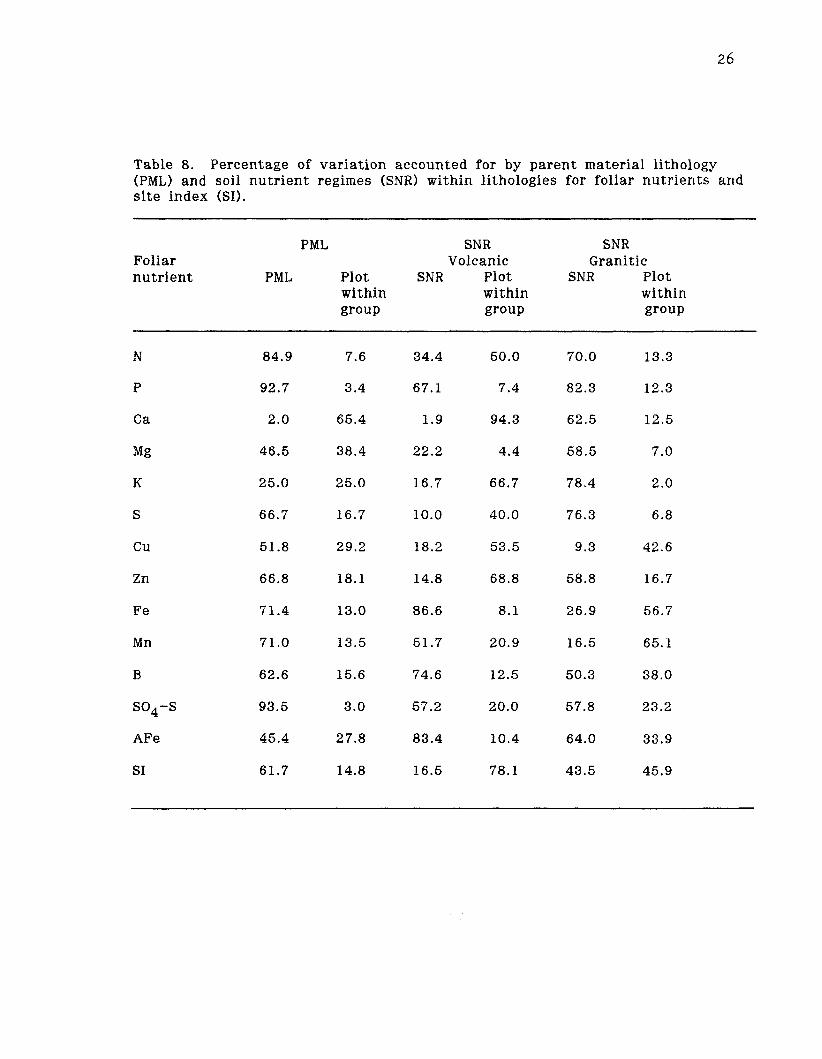
Table 8. Percentage of variation accounted for by parent material lithology (PML) and soil nutrient regimes (SNR) within lithologies for foliar nutrients and s i te index @I).
PML SNR SNR Foliar Volcanic Granitic nutrient PML Plot SNR Plot SNR Plot
within within within group group group
These SO4-S inputs may also have affected t h e foliar concentrations of other
nu t r ien ts .
Within t h e volcanic PML t h e SNR classifications accounted for t h e majority
of var iat ion for P, Fe and AFe (Table 8). The rich SNR plots (6,7,8) had lower
foliar P t h a n most o ther volcanic plots (App. 3). The very r ich SNR plots (8,9)
had higher foliar Fe and AFe t h a n a l l o ther plots (App. 3). No t rends were
evident between SNR and foliar N concentrations.
For t h e grani t ic PML plots (excluding plots 20 and 211, average foliar N
levels corresponded t o t h e SNR classification, increasing along t h e gradient of
medium SNR (1.00% N), medium - rich (1.10% N), and rich (1.15% N ) . Due to t h e
small sample size t hese differences were not s ta t i s t ica l ly significant. In cont ras t
t h e medium SNR plots had t h e grea tes t foliar P concentrations, and foliar P was
lower for t h e medium-rich and rich SNRs' (App. 3) . This decrease may part ia l ly
reflect a dilution of P in t h e foliar biomass, r a the r t h a n simply a lower P
availabili ty. Average foliar K concentrations were ,5496, .50%, and .58%, for t h e
medium, medium - rich and rich SNRs' respectively. The dynamics of soil K -
soil water relationships, and in te rna l nu t r ien t cycling may a l l be contributing t o
t h e observed pa t t e rn of foliar K var iat ion between t h e three SNRs' on the
grani t ic PML.
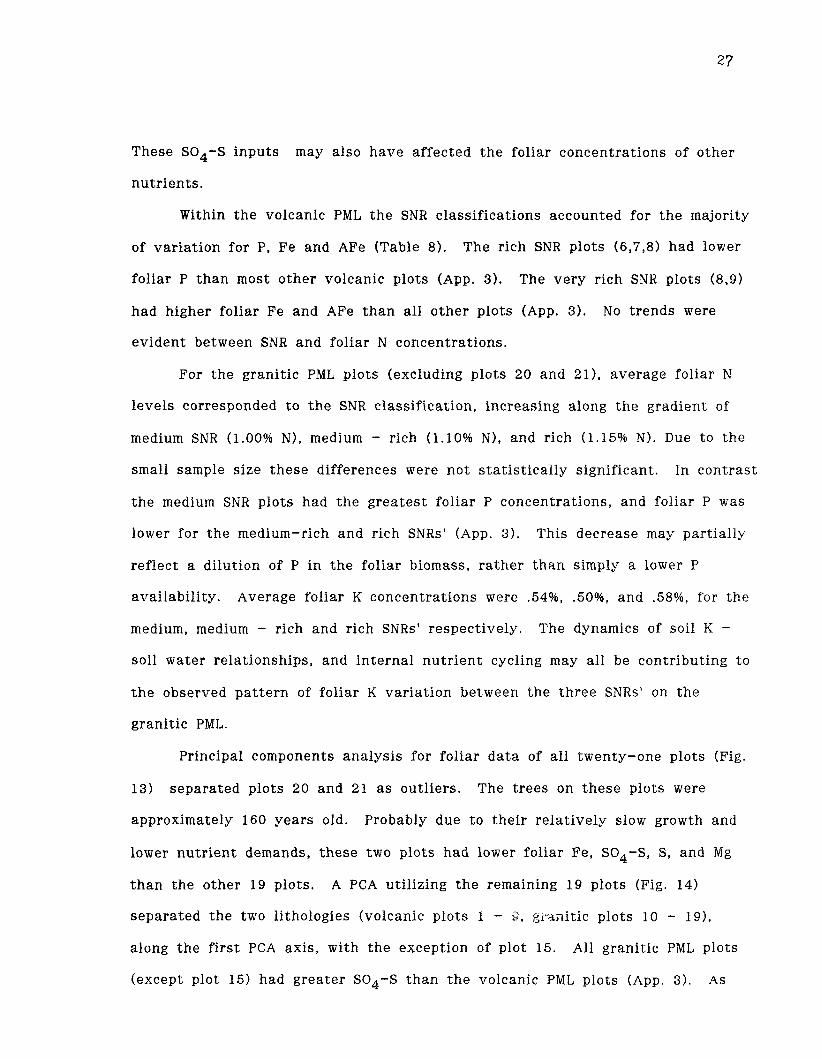
Principal components analysis for foliar d a t a of a l l twenty-one plots (Fig.
13) separated plots 20 and 21 as outliers. The t r ee s on these plots were
approximately 160 years old. Probably due t o t he i r re lat ively slow growth and
lower nut r ien t demands, t hese two plots had lower foliar Fe, SO4-S, S, and Mg
t h a n t h e other 19 plots. A PCA util izing t h e remaining 19 plots (Fig. 14)
separated t h e two lithologies (volcanic plots 1 - 3 , ;;ranitic plots 10 - 191,
along t h e f i r s t PCA axis , with t h e exception of plot 15. All grani t ic PML plots
(except plot 15) had grea te r SO4-S than t h e volcanic PML plots (App. 3) . As
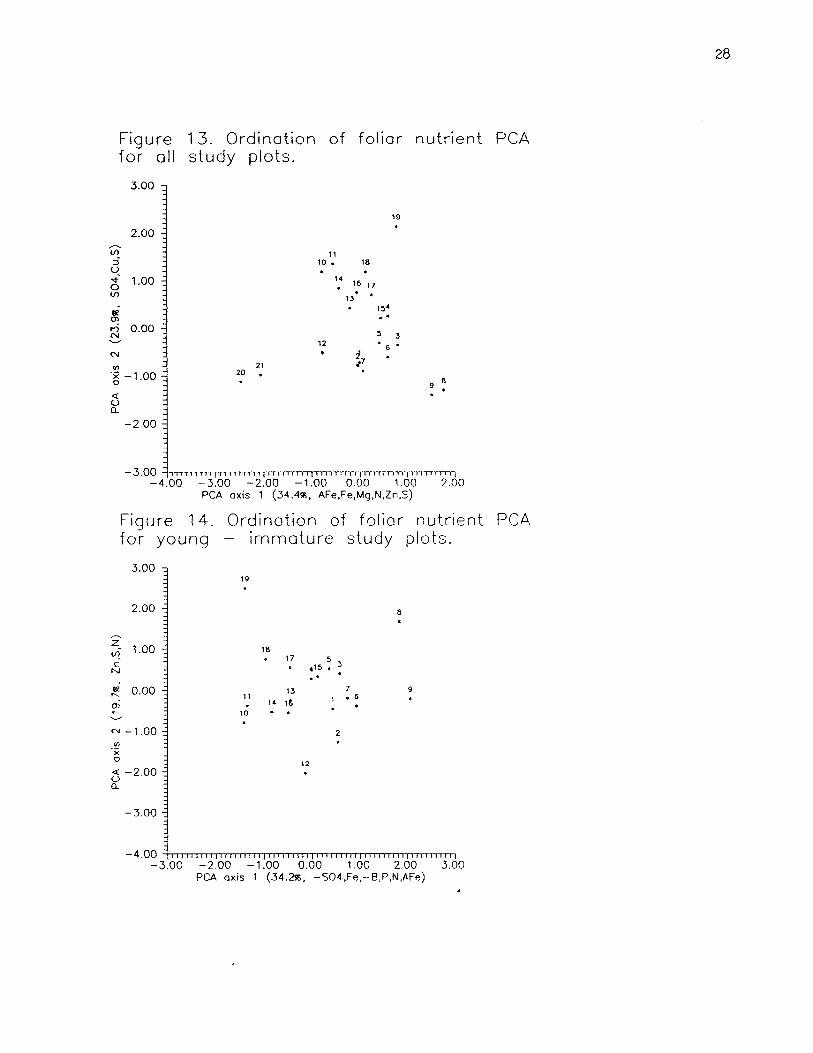
Figure 13. Ordination of foliar nutrient PCA for all study plots.
-3 .00 & I - T T T T T T ~ I
-4 .00 -3 .00 -2 .00 -1.00 0.00 1.00 2.00 PCA axis 1 (34.4%. AFe.Fe,Mg,N.Zn.S)
Fiqure 14. Ordination of foliar n u t r i e n t PCA fo; young - irnniature study plots.
PCA oxis 1 (34.2%. -504,Fe.-B,P,N,AFe)
noted previously t h e volcanic plots a lso had grea te r foliar N and P than t h e
grani t ic plots. The highest foliar Fe levels of a l l s t udy plots were in plots 8
and 9 (App. 3) . PCA axis 2 separated t h e plots along a gradient of Zn, S , and
N (Fig. 14). Plot 19 had t h e grea tes t quant i t ies of foliar Zn and S, while plot
12 had t h e lowest foliar N and Zn levels (App. 3).
The mult ivar iate analysis of foliar d a t a supported t h e ana lys is of t h e two
PMLs' a s separa te populations. Other PCA's using different combinations of
foliar nu t r ien ts a lso were interpreted a s separat ing t h e plots according t o PML.
CORRELATIONS BETWEEN PROPERTIES
Soil - Foliar correlations
Relationships between soil properties and foliar properties were examined
for each PML separately. Plots 20 and 21 were not used in t h e correlations
because of t he i r unique soil and foliar properties. Correlations made with small
sample sized may be strongly influenced by a few extreme va lues and should be
viewed with caution.
There were significant correlations between foliar concentrations of P, K,
C a and soil measures of t hese nut r ien ts on t h e volcanic PML (Figs. 15, 16, 17).
Foliar P on t h e volcanic PML ranged from 58% t o 69% below recommended
adequate levels (Table 7 ) . Forest floor plus upper mineral soil e tP was
positively correlated with foliar P (Fig. 15). The primary roots and mycorrhizae
important in P uptake by western hemlock a r e concentrated in t h e forest floor
and upper mineral soil. Extractable P, par t icular ly i n t h e forest floor, has had
significant correlations with N ferti l izer response for hemlock (Radwan and
Shumway 1984). Particularly when P deficiencies a r e suspected, a good
relationship between soil t e s t s and foliar nu t r ien ts could be a useful tool for
ferti l ization decisions.
Figure 15. Relationship between foliar P and extractable P of forest floor plus upper mineral soil (kg/ha) on volcanic PML (r=.772, p<0.01). 3.00
8
2.80
,-. Z, 2.60 - 0
9 /
L /
k2.40 / Y
/ / 3
a / ,
1.60 -1 0.09 0.10 0.11 0.12 0.13 0.14 0.15 0.16
Folior P (m)
Fiyure 16. Relationship between foliar K clnd mineral soil extractable K (kg/ha) on volcanic PML (r=.643, p<0.05).
3 8
3.00 ? t 3 n 3 a t t , , , , n 3 , , , , ~ , ~ ~
0.36 0.40 0.44 0.48 0.52 0.56 0.60 foliar K (%)
Figure 17. Relationship between foliar Ca an( mineral soil extractable Ca (kg/ho) on volca PML (r=.691, p (0.05). 3.60
5 1 .
3.20 . -. 9 2 , . 5 , - ,
1.60 ~ q , , , r , , , , , , , , , , , , , , , , , , , , , , , , , , , , , , , , , , , , , r r , , + r r ~ O.1G 0.18 0.20 0.22 0.24 0.2C
Folior Ca (%)
Foliar K concentrations on t h e volcanic PML ranged from 29% t o 47% below
recommended adequate levels (Table 7). Mineral soil mK was positively
correlated with foliar K on t h e volcanic PML (Fig. 161, bu t plot 9 was a n outlier.
Plot 9 had t h e highest SI of a l l s t udy plots (Table 3) , and t h e low foliar K
concentrations may reflect dilution in a grea te r foliar biomass.
Even though none of t h e volcanic PML plots had foliar Ca levels below
recommended levels , t h e m C a - foliar Ca correlation (Fig. 17) suggested t h a t mCa
(Morgan's solution extractable Ca) was a be t te r measure of p lan t avai lable Ca
t h a n exchangeable Ca (exCa - foliar Ca, r=.338). This supports t h e
recommendation of Klinka e t al. (1980) t o use Morgan's solution for assessing
cation s t a t u s of forest soils i n t h e CWH biogeoclimatic zone.
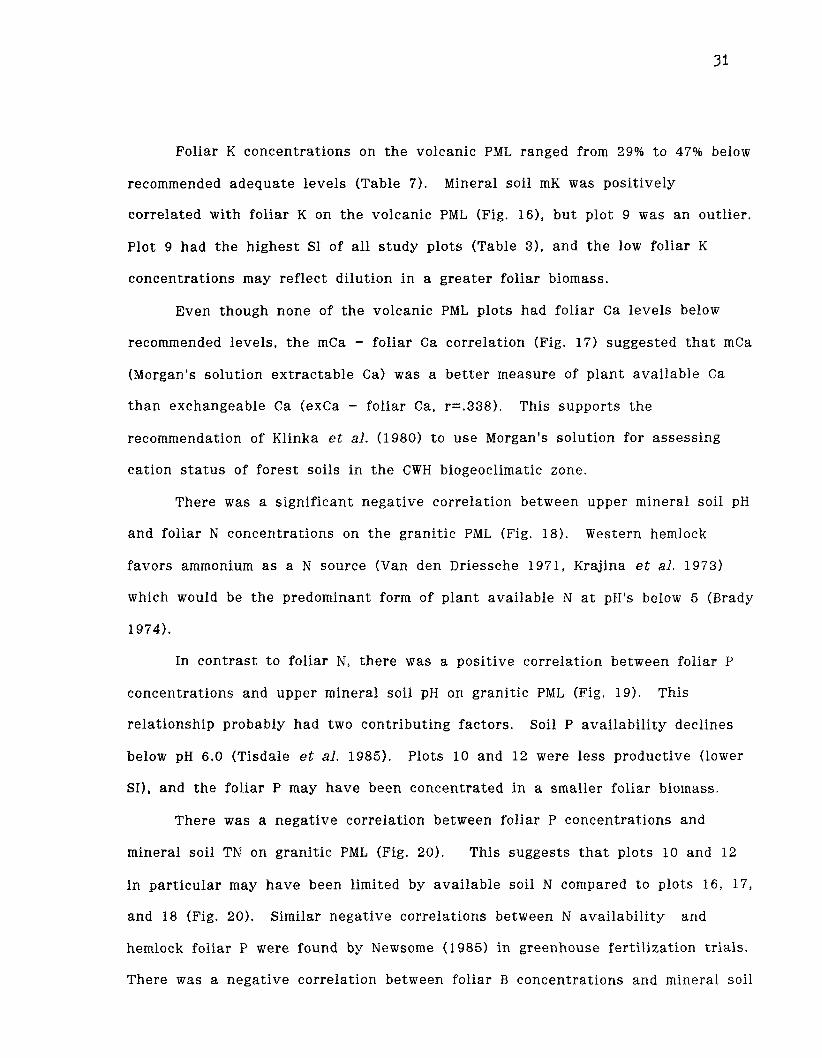
There was a significant negat ive correlation between upper mineral soil pH
and foliar N concentrations on t h e grani t ic PML (Fig. 18) . Western hemlock
favors ammonium a s a N source (Van den Driessche 1971, Krajina e t al. 1973)
which would be t h e predominant form of plant avai lable N at pH's below 5 (Brady
1974).
In cont ras t t o foliar N, t he re was a positive correlation between foliar P
concentrations and upper mineral soil pH on grani t ic PML (Fig. 19). This
relationship probably had two contributing factors. Soil P avai labi l i ty declines
below pH 6.0 (Tisdale e t al. 1985). Plots 10 and 12 were less productive (lower
SI), and t h e foliar P may have been concentrated in a smaller foliar biomass.
There was a negat ive correlation between foliar P concentrations and
mineral soil TN on grani t ic PML (Fig. 20). This suggests t h a t plots 10 and 12
in par t icular may have been limited by avai lable soil N compared t o plots 16, 17,
and 18 (Fig. 20). Similar negat ive correlations between N avai labi l i ty and
hemlock foliar P were found by Newsome (1985) in greenhouse ferti l ization t r ia ls .
There was a negat ive correlation between foliar B concentrations and mineral soil
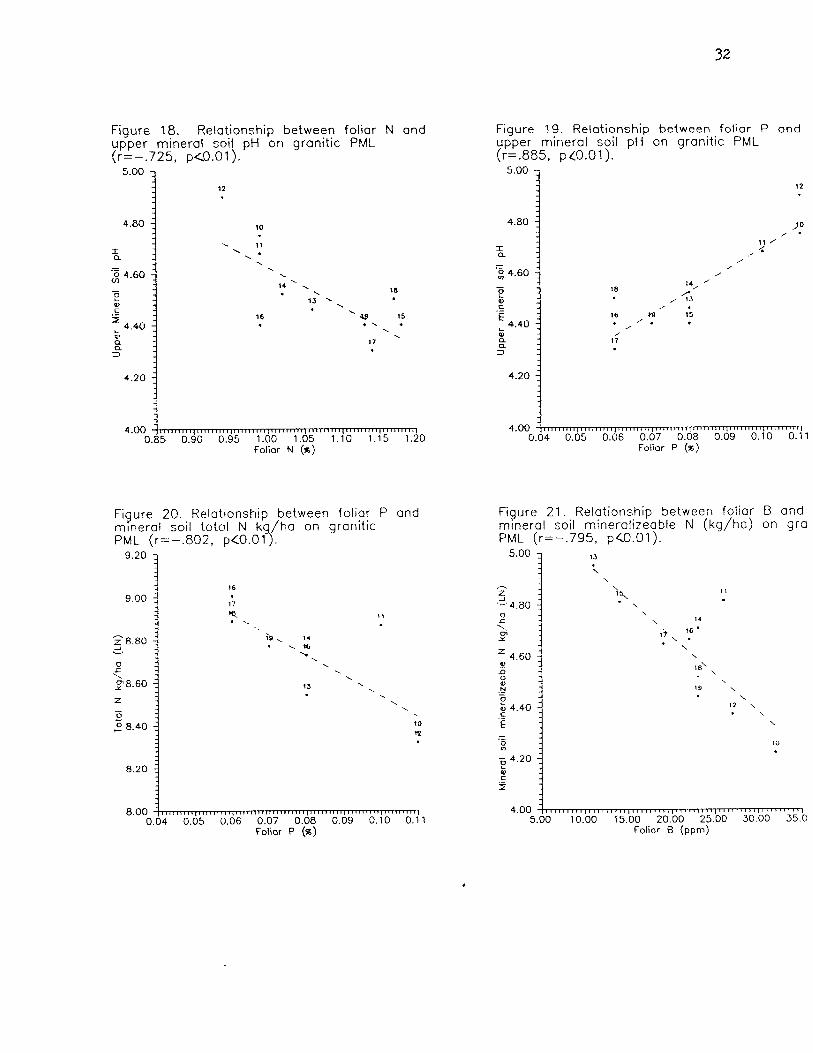
Figure 20. Relationship between foliar P and rn~nerai soil total N k /ha on granitic PML (r=-.802, p < ~ . ~ h .
9.20
9.00
8.80 L.
Figure 18. Relationship between foliar N and upper mineral soil pH on granitic PML (r=-.725, p<O.O1).
8.00 0 0.04 0.05 0.06 0.07 0.08 0.09 0.10 0.11
Foiior P (ps)
5.00
4.80
I a - '0 4.60
Figure 19. Relationship between foliar P and upper mineral soil pH on granitic PML (r=.885, p40.01).
4.00 0 . F 1
Folior P (%)
12
10
\ 11 ' . .. . \
Figure 21. Relationship between foliar B and mineral soil mineralizeable N (kg/ha) on gra PML (r=-.795, p<0.01).
13
,-.
\
- w - e C .- I
4.40 1 w a a 3
4.20 1
5.00 10.00 15.00 20.00 25.00 30.00 35.0 Folior B (ppm)
\
14 ' -. . 18
13 L \ .. 43 15 . \ . .. .
17
Folior N (%)
minN (Fig. 21). Nitrogen and/or phosphorus fertil ization has resulted in decreased
foliar B levels in hemlock (Gill and Lavender 1983, Newsome 1985). Plot 15 had
t h e highest foliar N concentrations for t h e granitic PML plots, but foliar nutr ient
analysis suggested t h a t a nitrogen induced B deficiency was possible (Table 7).
The relationships discussed above emphasize the importance of interactions
between different nutr ients . While al l t h e granitic PML plots had below adequate
foliar N levels, four plots with relatively good foliar N had t h e lowest foliar P
levels. Two other granitic PML plots (13, 15) with higher foliar N levels had low
foliar B. These relationships were in agreement with the hypothesis t h a t lack of
N fertilizer response in hemlock s tands was due to deficiencies of other nutr ients
(Radwan and DeBell 1980, Gill 1981, Radwan and Shumway 1984).
Correlations Between Site Index and Other Properties
There were few significant correlations between soil properties and SI. -- -
Mineral soil minN had a significant positive correlation with SI on granitic PML
(Fig. 22). The low SI of plot 18 was unexpected considering t h a t environmental
( ~ p p . 2) and vegetation analysis (Figs. 7, 8 , App. 4) of the s i t e indicated good
growing conditions for hemlock. Fertilizer response of western hemlock has not
had positive correlations with soil minN values (Radwan and Shumway 1984).
The only s tat is t ical ly significant correlations between foliar nutr ients and
SI were for foliar K on t h e volcanic PML (r=-,546, p<0.05), and foliar Mn on t h e
granitic PML (r=-.836, p<0.01). Site index was positively correlated to foliar N ,
and Fe, and negatively correlated with Mn and SO4-S in hemlock s tands in
Washington (Radwan and DeBell 1980). Decreases in foliar Mn af ter N fertilization
have been described in hemlock (Gill and Lavender 1983). The negative
correlations between foliar Mn - SI, and foliar Mn - mineral soil minN (r=-.523,
p<0.05) on the granitic PML was consistent with these results.
Figure 22 mineral ize or) Graniti 38.00 3
. Relat ionship between mineral soil able N (kg/ha) and site index (m/50 yrs) c PML (r=.767, p(0.01).
13
- - - - - - - 36.00 1
- - - - - -
n - v, -
34.00 : X 4
0 - Ln - ' . - - E -
- -32.00 z
zC - -
0 - T1) - c -
- . - - -
2 30.00 1 . - u> -
- - - -
28.00
1 1 *
/ /
16 / /
'15
, f 4 *
/
*/ 17 / 4
/
19/ .'*
,/ 18 1
/
1
12
26.00 4.00 0 4.20 4.40 4.60 4.80 5.00
Mineral soil mineralizeable N kg/ha (LN)
Correlations Between Vegetation and Other Properties
Quadrant scores for a RA analysis done on s tudy plots within each PML
were used in correlations with soil and foliar properties. Few correlations were
significant (p<0.05) between vegetation and other properties on t h e granitic PML.
Upper mineral soil TN (kg/ha) was significantly correlated with the f i r s t RA axis
(r=-,646). There were significant correlations between t h e f i r s t vegetation axis
and foliar P (r=.743), N (r=-.681), Mg (r=-.659), and Ca (r=-.645). Even though
t h e understory vegetation was relatively sparse, these correlations indicate t h e
potential for linking soil and foliar nut r ient s t a t u s using vegetation.
There were few significant correlations between vegetation and other
properties on t h e volcanic PML plots. The f i r s t vegetation RA axis was
significantly correlated with mineral soil t o rooting depth (kg/ha) SO4-S (r=.700),
and upper mineral soil chemical properties of TN (r=-.572) and minN (r=-.608).
Foliar K (r=.532) was t h e only property significantly correlated with t h e f i rs t RA
axis. Correlations with other RA axes were not significant or informative.
Selected properties for two plant subassociations with contrasting indicator
species spectra a re compared in Table 9. The values given a re for plots in the
Tsuga - Kindbergia - Vaccinium and Tsuga - Kindbergia - Rubus subassociations
located near Zeballos. The expected differences in soil properties (higher pH,
greater quanti t ies of minN, Ca, Mg, K ) were present only for forest floor pH.
The remaining properties ei ther had no significant difference, or were greater
(mMg, Table 9) in t h e Tsuga - Kindbergia - Vaccinium subassociation which had
a lower cover of rich indicator species (Table 9).
The lack of difference in soil properties between the two plant
subassoc;a';iens was probably due to several factors: 1) small sample size, 2)
the variability of the soil properties, and 3) t he dense canopy of second growth
western hemlock s tands which restr icts development of understory vegetation.
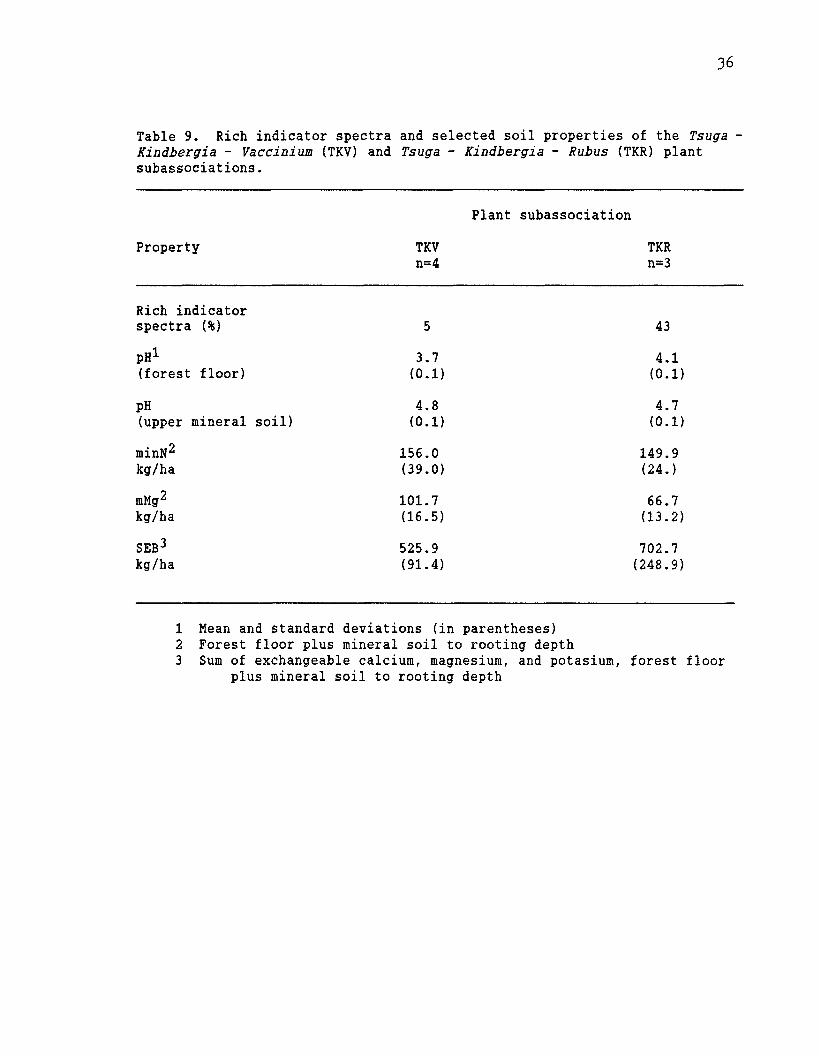
Table 9. Rich indicator spectra and selected soil properties of the Tsuga - Kindbergia - Vaccinium (TKV) and Tsuga - Kindbergia - Rubus (TKR) plant subassociations.
Plant subassociation
Property TKV n=4
TKR n=3
Rich indicator spectra (%)
pH1 (forest floor)
pH (upper mineral soil)
1 Mean and standard deviations (in parentheses) 2 Forest floor plus mineral soil to rooting depth 3 Sum of exchangeable calcium, magnesium, and potasium, forest floor
plus mineral soil to rooting depth
This example suggests t h a t environmental and morphological fea tures will be t h e
main tools in assessing SNR and SMR in second growth western hemlock
ecosystems.
CLASSIFICATION OF SOIL NUTRIENT REGIME
For t h e volcanic PML, t h e field SNR classification accounted for over 75%
of t h e variat ion i n almost a l l forest floor and upper mineral soil kg/ha properties
(Table 10). Forest floor chemical properties had more variat ion explained by
field SNR t h a n most upper mineral soil chemical properties (Table 10). TC, CEC,
TN, mCa and minN had over 80% of the i r var iat ion explained by t h e SNR
classification. The field SNR classification was relat ively poor in explaining t h e
variat ion of most forest floor plus mineral soil properties (Table 10).
Compared t o t h e volcanic PML, field SNR classification was relat ively poor
in accounting for soil property variat ion in t h e grani t ic PML plots (Table 1 1).
The assumed SNR differences i n pH, N and base s t a t u s were present in forest
floor chemical properties of pH, minN, mCa, and exCa, and upper mineral soil
chemical properties of pH, TN and exK (Table 11).
For classification purposes t h e pa t t e rn of var iat ion is important a s well a s
t h e amount of var iat ion explained. eg. For some properties there were large
differences between t h e SNR classes (high e t a2 values) , bu t t h e assumed
increases i n nut r ien t avai labi l i ty were not present.
Using a l l 21 plots, most soil properties did not show a pa t t e rn of
increasing pH or nut r ien t avai labi l i ty a s assumed by t h e SNR classification.
Forest floor pH had a large within SNR variabi l i ty so t h a t t h e medium to rich
SNRs did not have significant differences, nor did t h e mean forest floor pH show
a t rend (Fig. 23). Only t h e ver. :-il:h SNR plots were significantly different.
Within each PML there were different pa t te rns . For t h e volcanic PML
plots, forest floor pH increased along t h e SNR gradient, and each SNR was

Table 10. Percentage of variation in soil properties explained by Field Soil Nutrient Regime for Volcanic PML plots.
Soil Data Sets
Property FF FF Upper Upper Mineral FF plus FF plus Chemical kg/ha Mineral Mineral Soil to Upper Mineral
Soil Soil Rooting Mineral Soil to Chemical kg/ha Depth Soil Rooting
kg/ha kg/ha Depth kg/ha
pH
TC
TN
minM
mCa
mMg
mK
CEC
exC a
exMg
exK
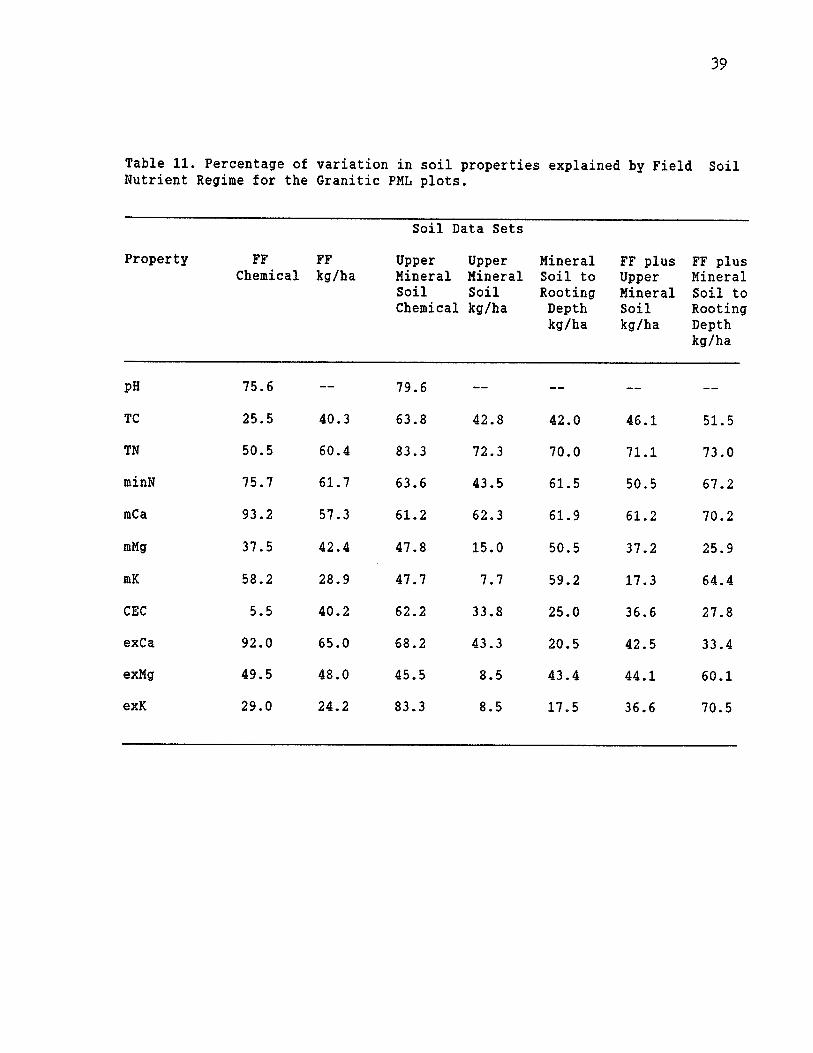
Table 11. Percentage of variation in soil properties explained by Field Soil Nutrient Regime for the Granitic PML plots.
Soil Data Sets
Property FF FF Upper Upper Mineral FF plus FF plus Chemical kg/ha Mineral Mineral Soil to Upper Mineral
Soil Soil Rooting Mineral Soil to Chemical kg/ha Depth Soil Rooting
kg/ha kg/ha Depth kg/ha
pH
TC
TN
minN
mCa
mMg
mK
CEC
exCa
exMg
exK
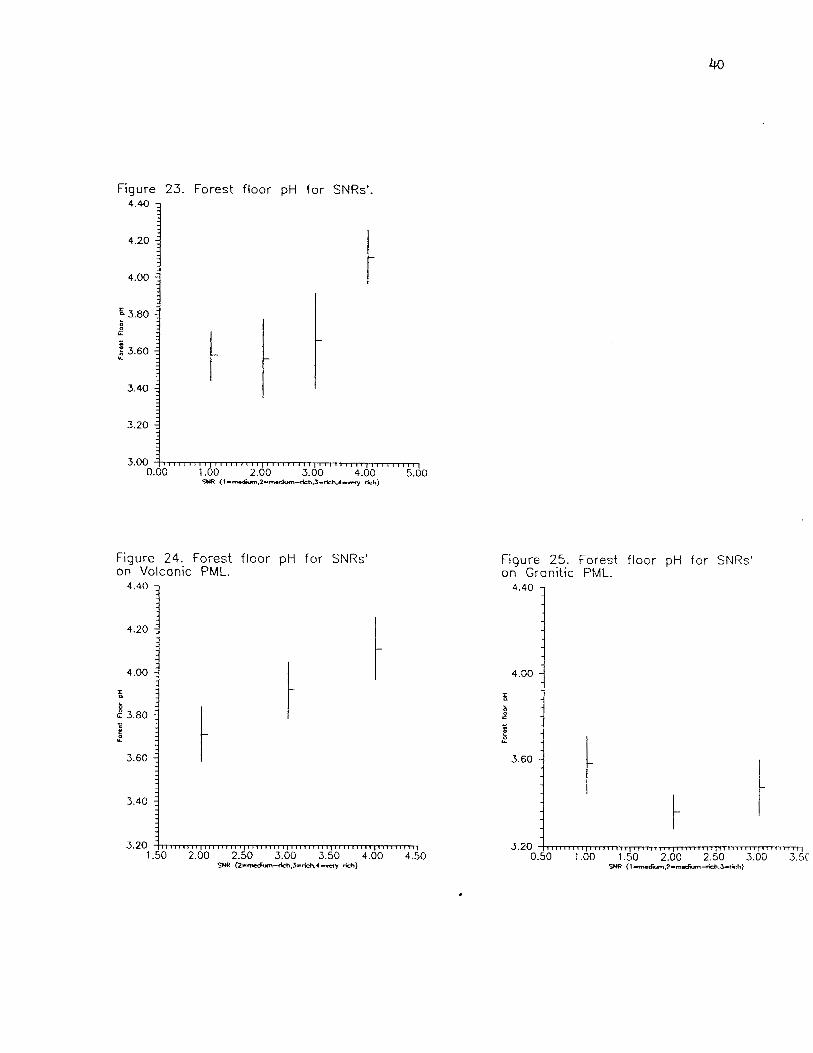
Figure 23. Forest floor pH for SNRs'.
4.40 1
3.00 +-"TI,, , , I , I , , , , , , , , , , , , , , , , , , , , , , , , , , , , , , , , 0.00 z o o
UIR (I-mdun.2mulium-irh,3-riCh.4- rich)
Figure 24. Forest floor pH for SNRs' on Volcanic PML.
4.00
Figure 25. Forest floor pH for SNRs' on Granitic PML.
4.00 O i
significantly different (Fig. 24). The granitic PML rich SNR had t h e lowest forest
floor pH, and the medium SNR had the highest (Fig. 25). Forest floor pH was
significantly lower on t h e granitic PML than t h e volcanic PML (App 1).
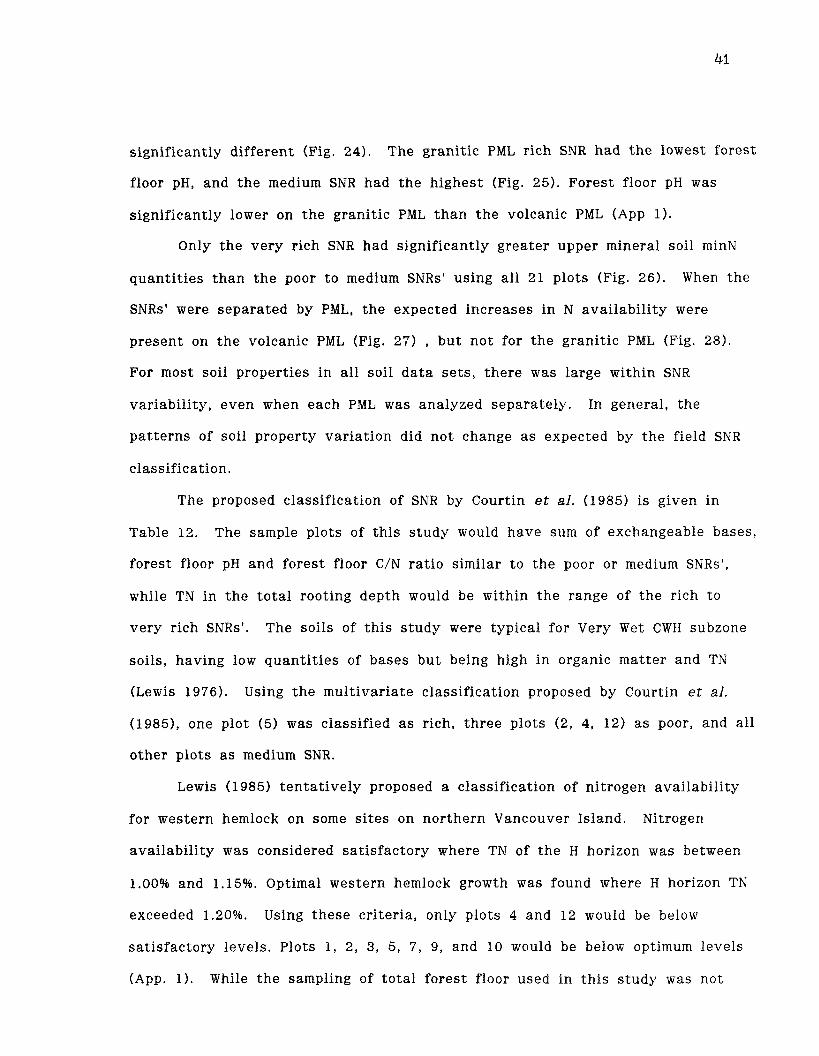
Only t h e very rich SNR had significantly greater upper mineral soil minN
quanti t ies than t h e poor to medium SNRs' using all 21 plots (Fig. 26). When the
SNRs' were separated by PML, the expected increases in N availability were
present on t h e volcanic PML (Fig. 27) , but not for the granitic PML (Fig. 28).
For most soil properties in al l soil da ta se t s , there was large within SNR
variability, even when each PML was analyzed separately. In general, the
pa t te rns of soil property variation did not change a s expected by the field SNR
classification.
The proposed classification of SNR by Courtin et al. (1985) i s given in
Table 12. The sample plots of th i s s tudy would have sum of exchangeable bases,
forest floor pH and forest floor C/N rat io similar to the poor or medium SNRs',
while TN in t h e to ta l rooting depth would be within t h e range of the rich to
very rich SNRs'. The soils of th i s s tudy were typical for Very Wet CWH subzone
soils, having low quanti t ies of bases but being high in organic matter and TN
(Lewis 1976). Using t h e multivariate classification proposed by Courtin et al.
(1985), one plot (5) was classified a s rich, three plots (2, 4, 12) a s poor, and al l
other plots a s medium SNR.
Lewis (1 985) ten ta t ive ly proposed a classification of nitrogen availability
for western hemlock on some s i tes on northern Vancouver Island. Nitrogen
availability was considered satisfactory where TN of the H horizon was between
1.00% and 1.15%. Optimal western hemlock growth was found where H horizon TN
exceeded 1.20%. Using these criteria, only plots 4 and 12 would be below
satisfactory levels. Plots 1, 2, 3, 5, 7, 9, and 10 would be below optimum levels
(App. 1). While t h e sampling of to ta l forest floor used in th is s tudy was no t
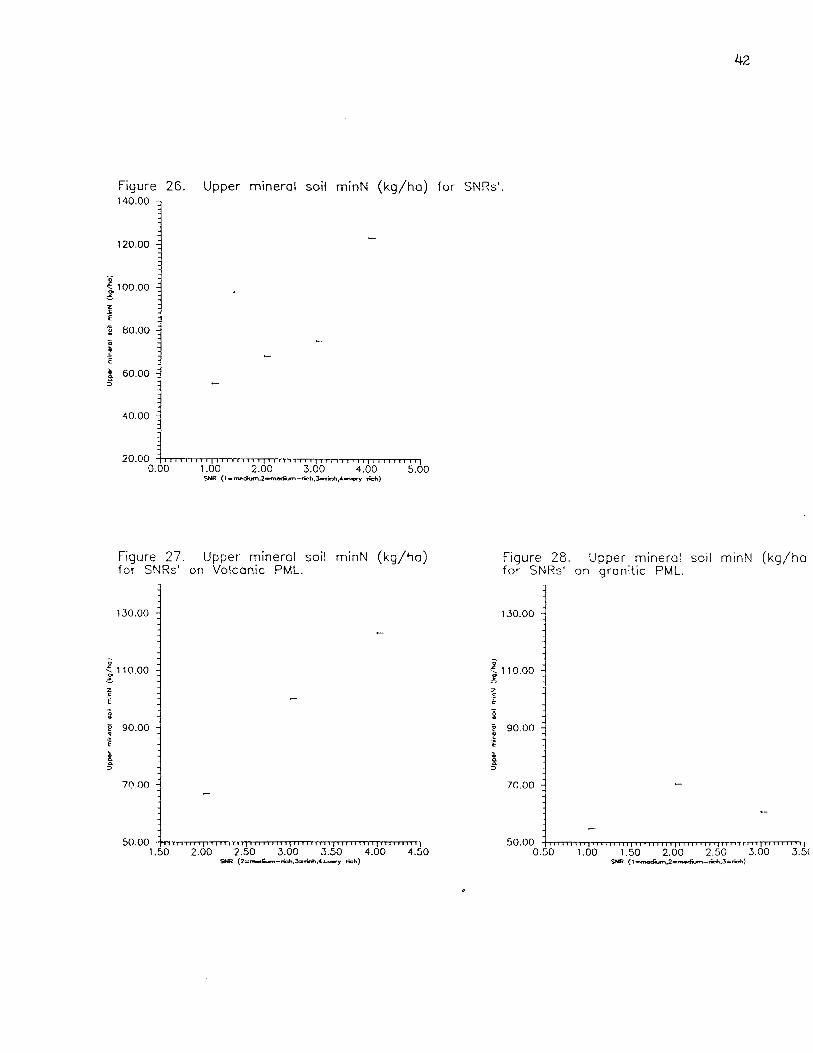
Figure 26. Upper mineral soil minN (kg/ha) for SNRs' 140.00 2
20.00 j,,,,,,,,,,,,,,,,,,,,,,,,,,,,, , , , , , , , , , , , , , , , , , , 0.00 1.00 2.00 3.60 4.=5.d0
W R (1-mdum.2-m&-+rhh3-rirhh4- rich)
Figure 27. Upper mineral soil minN (kg/ha) for SNRs' on Volcanic PML.
Figure 28. Upper mineral soil minN (kg/ha for SNRs' on granitic PML.
Table 12. Tentative classification of actual soil nutrient regimes for soils in southwestern British Columbia (amended version of Courtin et al. 1985).
Soil nutrient
Means and standard deviations1 for the differentiating characteristics
regime
Humus form2 Forest floor + mine a1 soil FH C/N 5 Total N (kg/ha) SEB (kg/ha)
Very poor
Poor
Medium
Rich
Very Rich
Numbers in parentheses are standard deviations. The humus forms of the rich and very rich SNRsf are usually Ah horizons. SEB = the sum of exchangeable calcium, magnesium, and potassium.
s t r ic t ly comparable, these va lues indicate t h a t most of t h e plots i n t h i s s tudy
should have had sa t i s fac tory N avai labi l i ty for western hemlock.
Neither of t hese two a l te rna t ive classifications identified groups of plots
which improved identification of nu t r ien t relationships of t hese plots.
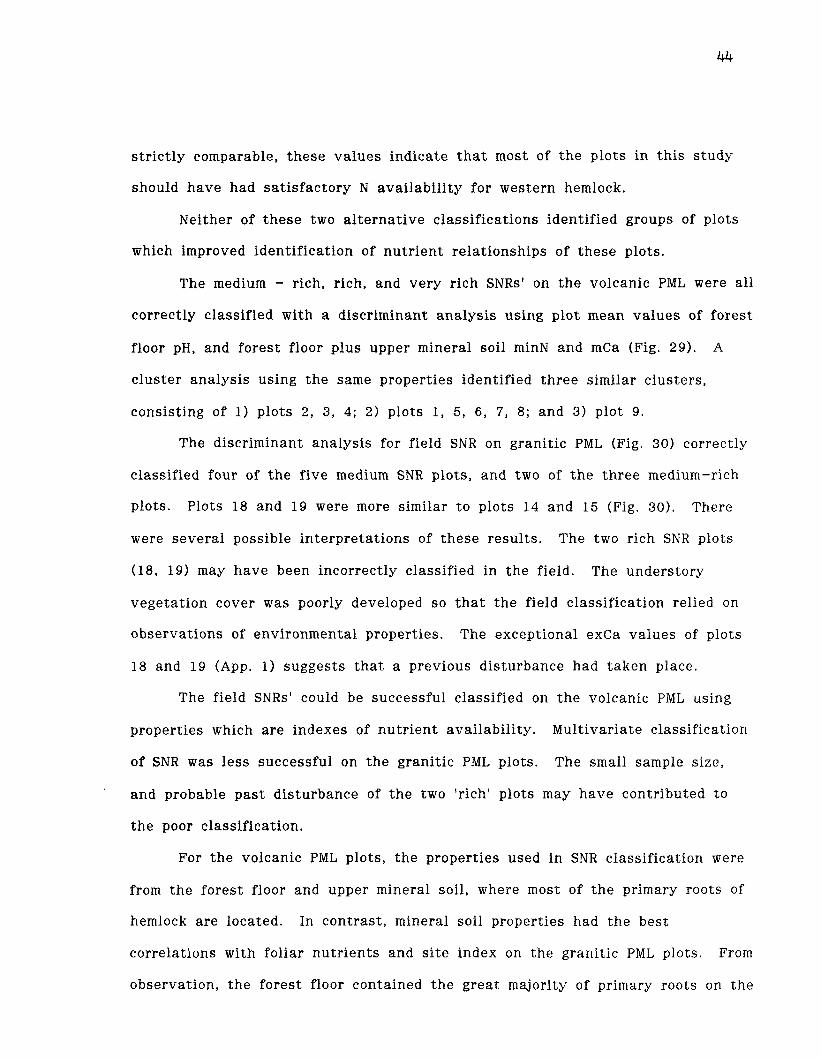
The medium - rich, rich, and very rich SNRs' on t h e volcanic PML were al l
correctly classified with a discriminant ana lys is using plot mean va lues of forest
floor pH, and forest floor plus upper mineral soil minN and mCa (Fig. 29). A
cluster analysis using t h e same properties identified th ree similar c lusters ,
consisting of 1) plots 2, 3, 4; 2) plots 1 , 5, 6, 7 , 8; and 3) plot 9.
The discriminant ana lys is for field SNR on grani t ic PML (Fig. 30) correctly
classified four of t h e f ive medium SNR plots, and two of t h e th ree medium-rich
plots. Plots 18 and 19 were more similar t o plots 14 and 15 (Fig. 30). There
were severa l possible interpretat ions of t hese resul ts . The two rich SNR plots
(18, 19) may have been incorrectly classified in t h e field. The understory
vegetat ion cover was poorly developed so t h a t t h e field classification relied on
observations of environmental properties. The exceptional exCa values of plots
18 and 19 (App. 1) suggests t h a t a previous dis turbance had taken place.
The field SNRs' could be successful classified on t h e volcanic PML using
properties which a r e indexes of nu t r ien t avai labi l i ty . Multivariate classification
of SNR was less successful on t h e grani t ic PML plots. The small sample size,
and probable p a s t dis turbance of t h e two 'rich' plots may h a v e contributed t o
t h e poor classification.
For t h e volcanic PML plots, t h e properties used in SNR classification were
from t h e forest floor and upper mineral soil, where most of t h e primary roots of
hemlock a r e located. In cont ras t , mineral soil properties had t h e best
correlations with foliar nu t r ien ts and s i t e index on t h e grani t ic PML plots. From
observation, t h e fores t floor contained t h e grea t majority of primary roots on t h e
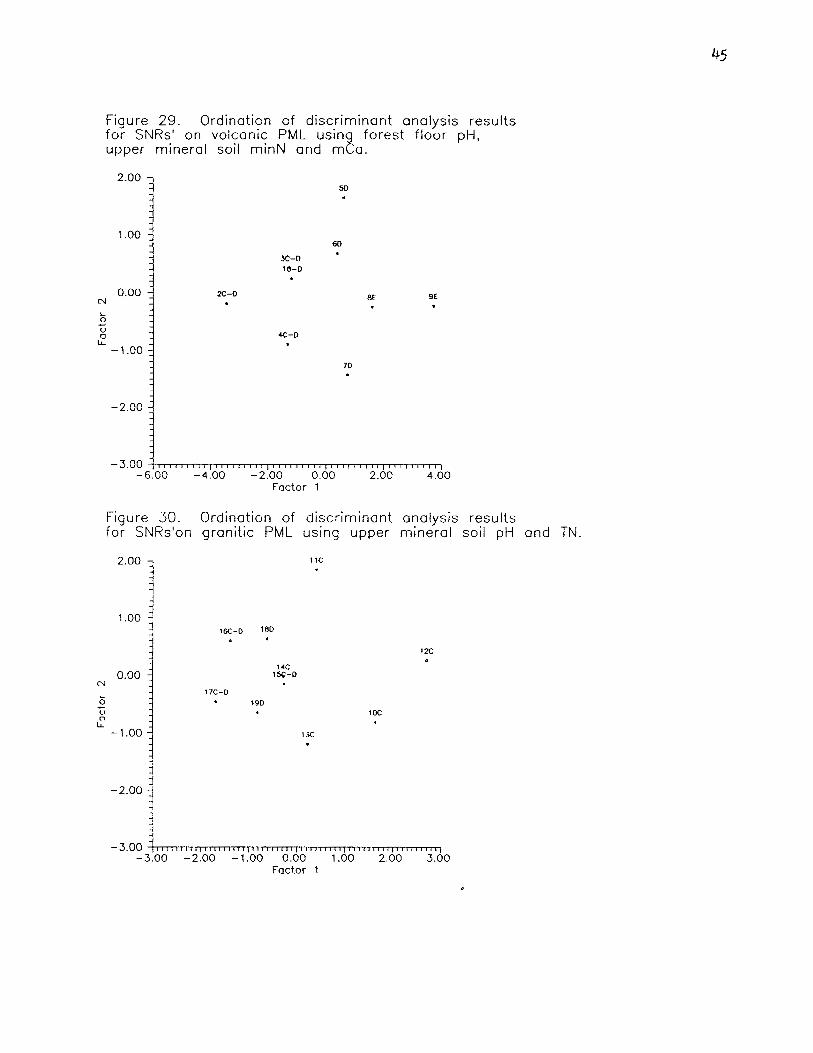
Figure 29. Ordination of discriminant analysis results for SNRs' on volcanic PML using forest floor pH, upper mineral soil minN and mCa.
X - D 14-0
X - D .
-3.00 1 , 6 r , I t , , , , , , , , , , , , , , , , , , , , , , , , , , , , , , , , , , , , , , , , , , , I -6.00 -4.00 -2.00 0.00 2.00 4 .OO
Factor 1
Figure 30. Ordination of discriminant analysis results for SNRs'on granitic PML using upper mineral soil pH and TN.
-3.00 ~ ~ ~ ~ ~ ~ ~ ~ 1 f 1 L 1 1 8 1 1 t 1 1 , 1 1 1 t I , , I I I ,,,,,,,, , , , , , , , , , , , , , , , , , , , -3.00 -2.00 -1.00 0.00 1.00 2.00 3.00
Factor 1
grani t ic PML plots. The nut r ien t relationships on t h e grani t ic PML did not
ref lect t h e generally accepted importance of t h e forest floor i n hemlock nutrit ion.
More detailed s tudies of hemlock nutr i t ion, hemlock rooting pa t t e rns and
mycorrhizal re lat ionships contrast ing mineral soil and forest floor a r e required.
Regression equat ions and o ther modelling techniques t o predict productivity
were not a t tempted in t h i s s tudy , The different relationships between t h e two
PMLs' and t h e small sample size within each PML made t h e resu l t s of a n y such
techniques questionable. Future s tudies using a larger sample size with a
grea te r range in s i t e index could focus on forest floor and upper mineral soil
properties of pH, TN, minN (or some o ther index of plant avai lable N ) , etP, and
extractable (Morgan's solution) Ca and Mg expressed on a kg/ha basis.
CONCLUSIONS
There were consistent differences in nut r ient relationships between the
two main locations sampled. The Zeballos (volcanic) and Seymour Valley
(granitic) locations differed not only in parent material lithology, but also in
s i t e history, s tand age, and possibly other factors (eg. genetics). All these
differences were confounded with parent material lithology in t h e s tudy design
and could not be analyzed separately.
The dense t ree canopy of second growth hemlock s tands severely limited
t h e development of shrubs and herbs. Changes in vegetation had few
correlations with foliar or soil nutr ients .
Within t h e volcanic PML the field classification of SNR could identify
differences in forest floor pH and mineralizable N in the soil. A multivariate
classification using quant i ta t ive soil properties was successful in discriminating
between t h e three SNRs' on t h e volcanic lithology. Soil phosphorus was highly
correlated with foliar phosphorus.
Within the granitic PML plots the field classification of SNR was poor in
identifying variation in soil properties. Foliar N variation did follow the
assumed increases in N availability. The poorly developed understory vegetation
may have limited identification of SNR in t h e field. In addition, possible
disturbances of plots 18 and 19 may have caused the poor success of the
quant i ta t ive classification. However, there were significant correlations between
soil properties, foliar nut r ients and s i te index. An improved field classification
could identify these changes in nutr ient availability.
MANAGEMENT IMPLICATIONS
1) All s i t e s were below recommended leve ls of foliar N , P, K, and S. In view of
t h e extremely variable his tory of hemlock fer t i l izer response, t hese predicted
deficiencies need t o be tes ted by field trials using a balanced application of
nu t r ien ts , aimed at al leviat ing a l l suspected deficiencies.
2) Site classification is a n important tool which needs improvement in t h e Very
Wet Maritime CWH subzone. There were dramatically different nu t r i en t
relationships between t h e two locations. On t h e volcanic PML plots, field
classification of SNR was useful i n identifying differences in nut r ien t quant i t ies .
3) Soil measures of P and N correlated well with potent ial nu t r ien t deficiencies
on some s i tes . However, t h e high variabi l i ty of soil properties i n t h e Very Wet
Maritime CWH subzone would suggest t h a t foliar sampling is more cost-effective
in identifying potent ial nu t r ien t deficiencies in second growth western hemlock
s tands .
FUTURE RESEARCH
1) Balanced ferti l izer applications over a range of s i t e and environmental
conditions t o improve prediction of fer t i l izat ion response and ident i fy crit ical
levels i n foliar nu t r i en t s for western hemlock.
2) Improvements i n s i t e classification of second growth western hemlock s t ands
with part icular emphasis on environmental and morphological fea tures since the
understory vegetat ion i s of ten sparse.
3) Rooting pa t t e rns and nut r ien t up take of hemlock should be examined in a
controlled environment. Split - pot s tud ies could examine rooting medium
preference (mineral versus different types of organic materials), ferti l izer effects,
and t h e role(s1 of mycorrhizae.
LITERATURE CITED
Ballard T.M. and R.E. Carter. 1986. Evaluating forest s tand nutrient s tatus. B.C. Ministry of Forests, Land Management Report No. 20. Victoria, B.C.
Brady, N.C. 1974. The nature and properties of soils. 8 th Edition. MacMillan Publishing Co., Ltd.
Bremner, J.M., and M. A. Tabatabai. 1971. Use of automated combustion techniques for total carbon, total nitrogen and total sulphur analysis of soils. pp. 1-16 IN: Instrumental methods for analysis of soils and plant tissues. Edited by L.M. Walsh. Soil Sci. Soc. Amer., Madison, WI.
Campbell, N.A. 1980. Robust procedures in multivariate analysis. Appl. Stat . 29: 231 - 237.
Canada Soil Survey Committee. 1978. The Canadian system of soil classification. Can. Dept. Agric. Publ. No. 1646.
Carter, R.E. and L.E. Lowe. 1986. Lateral variability of forest floor properties under second-growth Douglas-fir s tands and the usefulness of composite sampling techniques. Can. J . For. Res. 16: 1128 - 1132.
Courtin, P.J., K. Klinka, M.C. Feller, and J.P. Demaerschalk. 1985. An approach to quantitative classification of nutrient regimes of forest soils. A paper presented a t the symposium Community Organization and Ecosystem Conservation- a Contemporary Synthesis. Canadian Congress of Biology, London, Ontario, 1985.
Emanuel, J. 1984. Foliar nutrient analysis. Faculty of Forestry, University of British Columbia. Vancouver, B.C.
Emanuel, J. 1986. F405:VTAB A vegetation classification program. Faculty of Forestry, University of British Columbia. Vancouver, B.C.
Gauch, H.G. 1977. ORDIFLEX - A FORTRAN program for four ordination techniques: weighted averages, polar ordination, principal components analysis, and reciprocal averaging, Release B. Ecology and Systematics, Cornell University, Ithaca, New York.
Gill, 198 1. Factors affecting nitrogen nutrition of western hemlock. Ph.D. thesis, Oregon State University.
Gill, R., and D.P. Lavender. Urea fertilization: effects on primary root mortality and mycorrhizal development of young-growth Western Hemlock. Forest Sci. 29: 751 - 760
Gill, R.S. and D.P. Lavender. 1983. Urea fertilization and foliar nutrient composition of western hemlock (Tsuga heterophylla (Raf.) Sarg.). Forest Ecology and Management 6: 333 - 341.
Greweling, T. and Peech, M. 1960. Chemical soil tests . Cornell Agric Exp. Sta. Bull. 960.
Heald, W.R. 1965. Calcium and magnesium. pp. 999-1010 IN: C.A. Black e t al., eds. Methods of soil analysis. Agronomy No. 9. Amer. Soc. Agron., Madison, WI.
Kabzems, R.D. 1985. Characterization of soil nutr ient regimes in Douglas-fir ecosystems in the Drier Maritime Coastal Western Hemlock Subzone. M.Sc. thesis , Faculty of Forestry, University of British Columbia, Vancouver, B.C.
Kabzems, R.D. and K. Klinka. 1987a. Initial quant i ta t ive characterization of soil nut r ient regimes. I. Soil properties. Can. J. For. Res. 17: 1557 - 1564
Kabzems, R.D. and K. Klinka. 1987b. Initial quant i ta t ive characterization of soil nut r ient regimes. 11. Relationships among soils, vegetation and s i te index. Can. J. For. Res. 17: 1565 - 1571.
Klinka, K., Feller, M.C., Lavkulich L. M., and A. Kozak. Evaluation of methods of extracting soil cations for forest productivity s tudies in southwestern British Columbia. Can. J. Soil Sci. 60: 697 - 705
Klinka, K., R.N. Green, R.L. Trowbridge, and L.E. Lowe. 1981. Taxonomic classification of humus forms in ecosystems of British Columbia. B.C. Ministry of Forests, Land Manage. Rep. No. 8.
Klinka, K., R.N. Green, P. J. Courtin and F.C. Nuszdorfer. 1984. Site diagnosis, t ree species selection and slashburning guidelines for t h e Vancouver Forest Region. B.C. Ministry of Forests, Land Manage. Rep. No. 25.
Klinka, K., V.J. Krajina, A. Ceska, and A.M. Scagel. 1986. Indicator plants of coastal British Columbia. Faculty of Forestry, University of British Columbia, Vancouver, B.C. (unpublished manuscript).
Krajina, V.J., S. Madoc-Jones, and G. Mellor. 1973. Ammonium and n i t ra te in the nitrogen economy of some conifers growing in Douglas-fir communities of the Pacific North-West of America. Soil Biol. Biochem. 5: 143 - 147
Krajina, V.J., K. Klinka, and J. Worral. 1982. Distribution and ecological characteristics of t r ees and shrubs of British Columbia. Faculty of Forestry, Univ. of British Columbia, Vancouver, B.C.
Krajina, V.J., S. Kojima, K. Klinka, and E.B. Peterson. 1986. Ecology of vascular plants of British Columbia. Department of Botany, University of British Columbia, Vancouver, B.C. (unpublished manuscript).
Lewis, T. 1976. The till-derived podzols of Vancouver Island. Unpub. Ph.D. thesis. University of British Columbia.
Lewis, T. 1985. Ecosystems of Quatsino Tree - Farm Licence (TFL 6). Unpublished report for Western Forest Products Ltd.
Mueller-Dombois, D. and H. Ellenberg. 1974. Aims and methods of -,-,a:ion ecology. John Wiley and Sons, Toronto.
Muller, J.E. 1977. Geology of Vancouver Island. Geological Survey of Canada. Dept. of Energy, Mines, and Resources, Vancouver, B.C. 2 maps + marginal notes.

Newsome, T.H. 1985. Fertilization of western hemlock with nitrogen, phosphorus and lime: a greenhouse study. Unpub. M.Sc. thesis. University of British Columbia, Vancouver.
Nuszdorfer, F.C., K.L. Kassay and A.M. Scagel. 1985. Biogeoclimatic uni t s of t h e Vancouver Forest Region. Map.
Pojar, J., K. Klinka and D.V. Meidinger. 1987. Biogeoclimatic ecosystem classification in British Columbia. For. Ecol. Manage. 22: 119 - 154.
Powers, R.F. 1980. Mineralizeable soil nitrogen a s a n index of nitrogen availability t o forest trees. Soil Sci. Soc. Amer. J. 44: 1314 - 1320.
Price, W.M. 1978. Analytical atomic absorption spectrometry. Heydon & Son, Ltd. London.
Radwan, M.A. and D.S. DeBell. 1980. Site index, growth and foliar chemical composition relationships in western hemlock. For. Sci. 26: 283 - 290
Radwan, M.A. and J.S. Shumway. 1983. Soil nitrogen, sulpher, and phosphorus in relation to growth response of western hemlock to nitrogen fertil ization. For. Sci. 29: 469 - 477
Radwan, M.A., D.S. DeBell, S.R. Webster, and S.P. Gessel. 1984. Different nitrogen sources for fertilizing western hemlock in western Washington. Can. J. For. Res. 14: 155 - 162
Regional Forest Nutrition Research Project. 1982. Biennial report, 1980 - 1982, regional forest nutrition research project. Ins t i tu te of Forest Products. College of Forest Resources. University of Washington, Seattle.
Roddick, J.A., J.E., Muller and A.V. Okulitch. 1979. Fraser River. British Columbia - Washington. Map 1386A. Geological Survey of Canada.
Slavinski, H.C. 1977. Soil variability along a topographic sequence, U.B.C. Endowment Lands. M.Sc. thesis . Univ. of British Columbia, Vancouver, B.C.
Spittlehouse, D.L. and T.S. Black. 1981. A growing season water balance model applied t o two Douglas-fir s tands. Water Resour. Res. 17: 1651 - 1656
Tisdale, S.L., W.L. Nelson and J.D. Beaton. 1985. Soil Fertil i ty and Fertilizers. 4 th Ed. MacMillan Publishing Co. New York.
Van den Driessche, R. 1971. Response of conifer seedlings t o n i t ra te and ammonium sources of nitrogen. Plant and Soil 34 : 421 - 439
Walmsley, M., G. Utzig, T. Vold, D. Moon and J . van Barneveld. 1980. Describing ecosystems in the field. RAB Technical Paper 2. Land Manage. Rep. No. 7. Victoria, B.C.
Webster, S.R., D.S. DeBell, K.N. Wiley, and W.A. Atkinson. 1976. Fertilization of western hemlock. IN: W.A. Atkinson and R.J. Zasoski (eds.), Western Hemlock Management Conf. Proc., Univ. Washington, Seattle. (pp. 247 - 252)
Wiley, K.N. 1978. Site index tables for western hemlock in the Pacific Northwest. Weyerhaeuser For. Pap. No. 17.
Wilkinson, L. 1987. SYSTAT: The system for statistics. SYSTAT Inc. Evanston, IL.
Zar, J.H. 1974. Biostatistical analysis. Prentiee-Hall Inc., Englewood Cliffs, New Jersy.
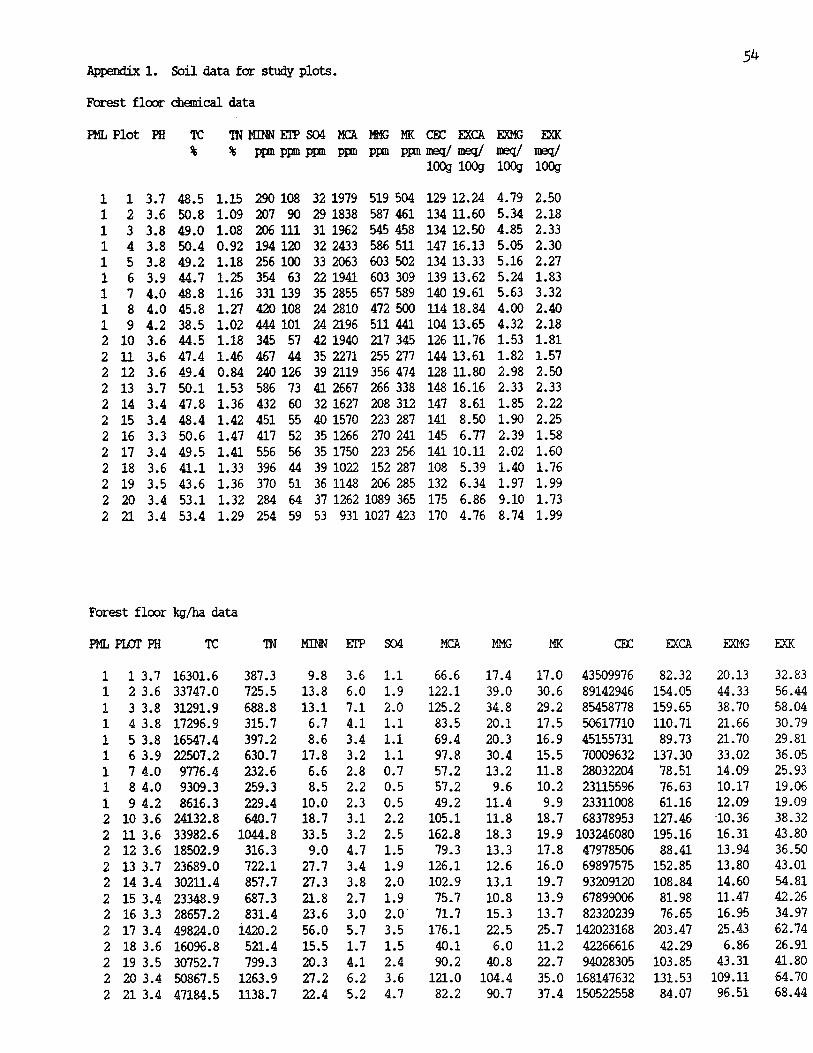
Appenaix 1. Soil data for study plots.
Forest f l a x hemica1 data
Forest floor
P M L m P H
1 1 3.7 1 2 3.6 1 3 3.8 1 4 3.8 1 5 3.8 1 6 3.9 1 7 4.0 1 8 4.0 1 9 4.2 2 10 3.6 2 11 3.6 2 12 3.6 2 13 3.7 2 14 3.4 2 15 3.4 2 16 3.3 2 17 3.4 2 18 3.6 2 19 3.5 2 20 3.4 2 21 3.4
b/ha data
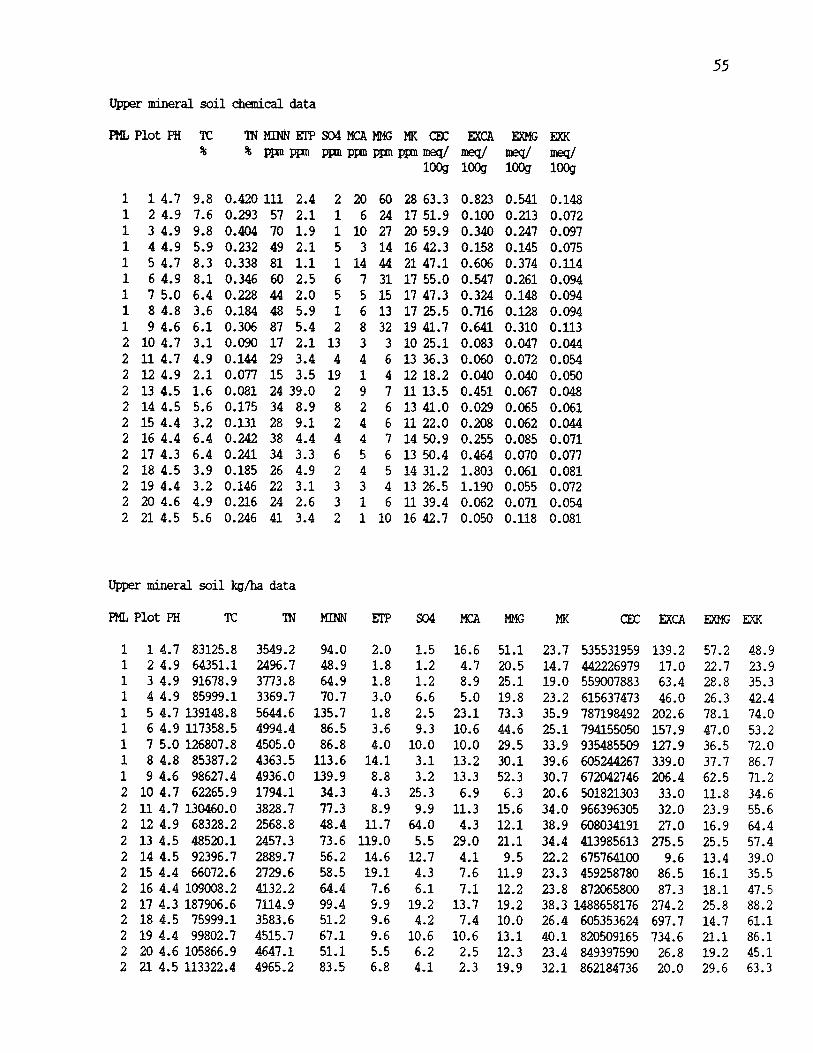
Upper mineral soil chemical data
PML Plot PH TC TN MINI? EI'P SO4 MCA MMG MK CEC EXCA EIOYK; FXK % % mppn ppnmPPnmmeq/ mep/ meq/ meq/
10% lOOg 10% lOOg
Upper mineral soil &/ha data
PML Plot pH TC m MINN SO4 MCA MMG
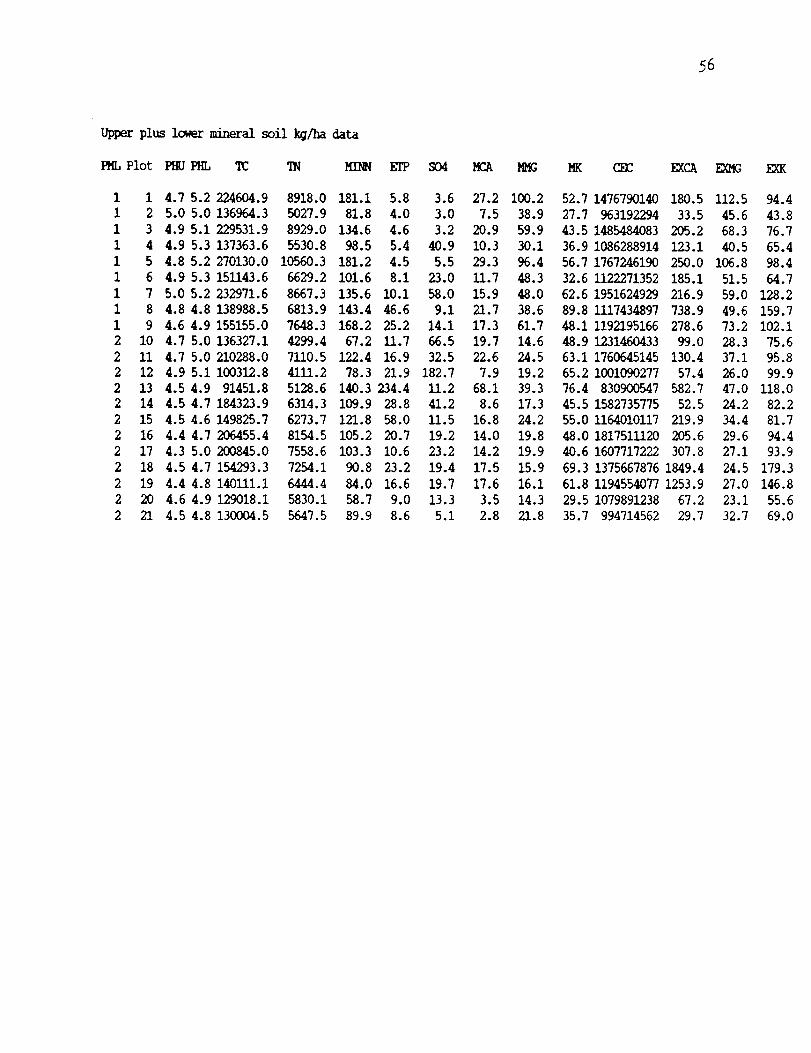
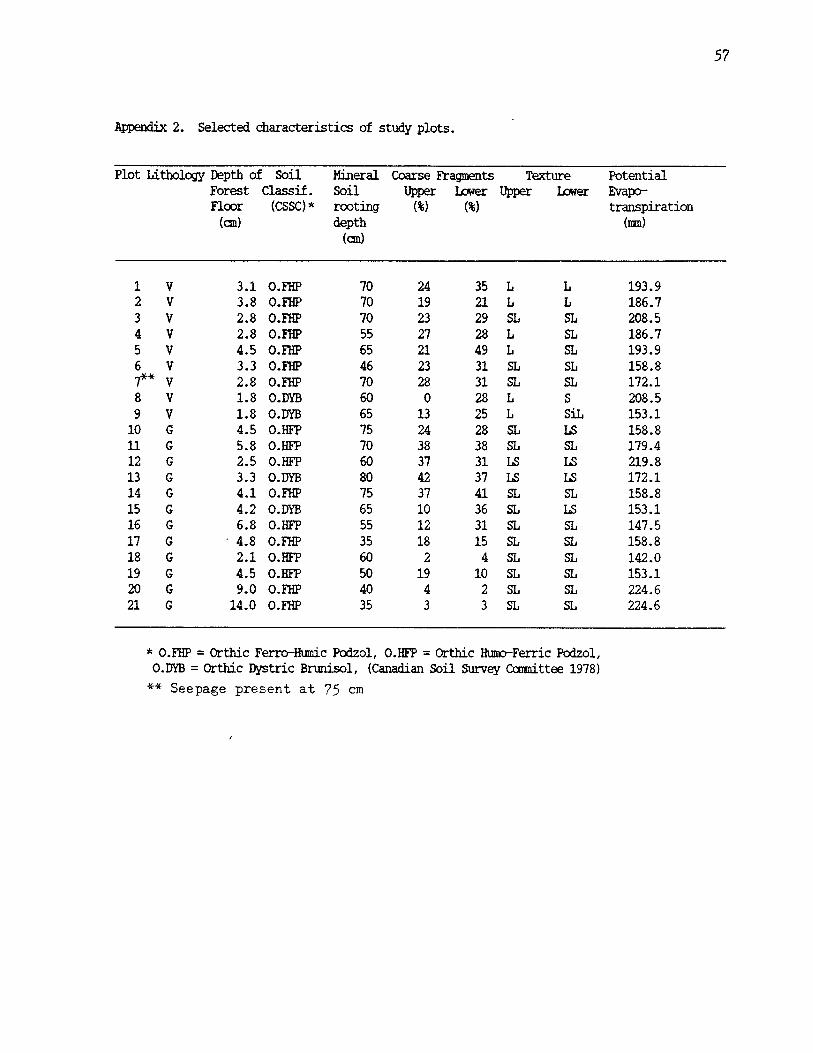
Appedix 2. Selected characteristics of study plots.
Plot Lithology Depth of Soil Mineral Coarse Fragments Texture Potential Forest Classif. Soil Wpper Lrrwer Upper bwer Evapo- Floor (CSSCI* m t i n g (%I (%I transpirat ion (an) depth (mn)
(an)
* 0.RIP = 0rthic Ferm-Wc Pcdzol, 0.HFP = Orthic HumrFerric Podzol, O.DYB = Orthic Dystric Bnolisol, (Canadian Soil Survey Camittee 1978) ** Seepage present at 75 cm
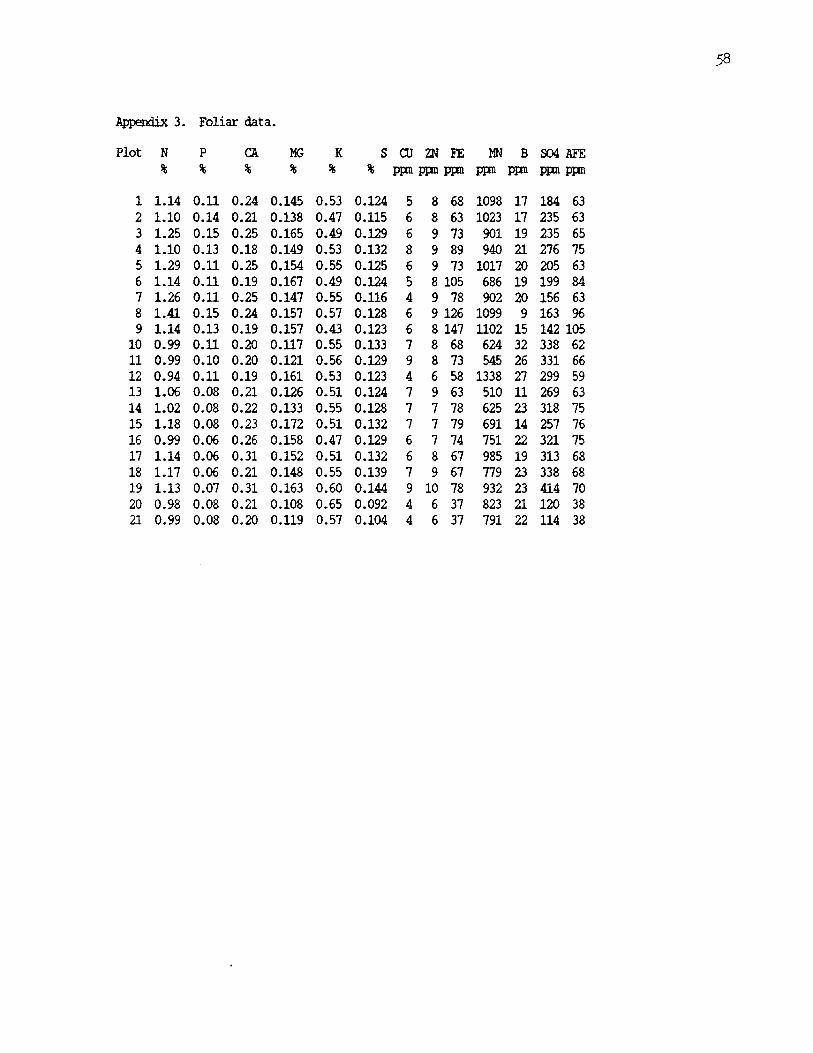
Appendix 3. Foliar data.
Plot N %

Appendix 4. Indicator species spectral analysis and vegetation tables
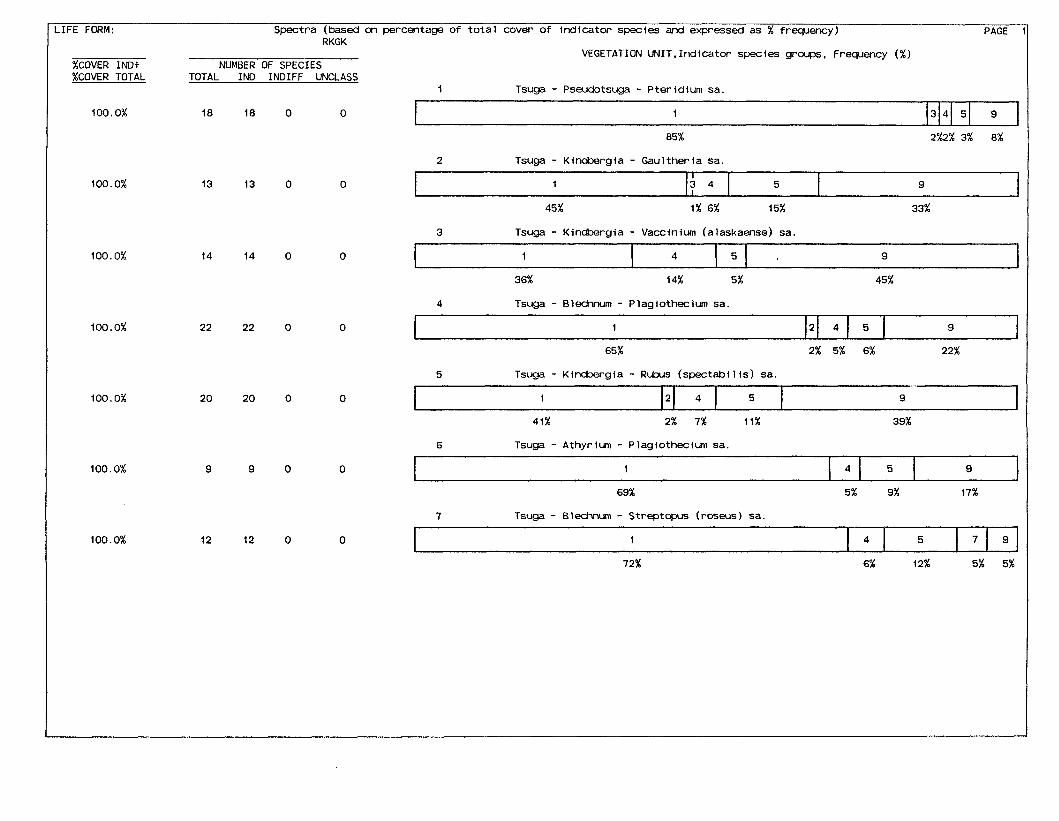
LIFE FORM: Spectra (based on percentage of total cover of lndlcator species and expressed as % frecpency) PAGE 1 RKGK
VEGETATION UNIT,Indlcator specles groups. Frecpency (%) %COVER IND+ NUMBER OF SPECIES %COVER TOTAL TOTAL IND INOIFF UNCLASS
I Tsuga - Pswdotsuga - Pterldium sa. 100.0% 18 18 0 0 1
85% 2%2% 3% 8%
2 Tsuga - Kindbergia - Gaultheria sa.
100.0%
9 3 4 5
1
45% 1% 6% 15% 33%
3 Tsuga - Kincbergia - Vacclnlun (alaskaense) sa.
100.0% I 1 4 5 9 I 36% 14% 5% 45%
4 Tsuga - Bled-inum - Plagiotheclum sa.
I I I 3 4 5
100.0%
9
1
65% 2% 5% 6% 22%
5 Tsuga - Kindbergfa - Rubus (spectabllls) sa.
2 4 5
100.0%
9 I
1
41% 2% 7% 11% 39%
6 Tsuga - Athyrium - Plaglotheclun sa.
2
100.0%
4 5
1 4
9
5 9
69% 5% 9% 17%
7 Tsuga - Blednum - Streptopls (roseus) sa.
I
100.0%
72% 6% 12% 5% 5%
1 4 5 7 9
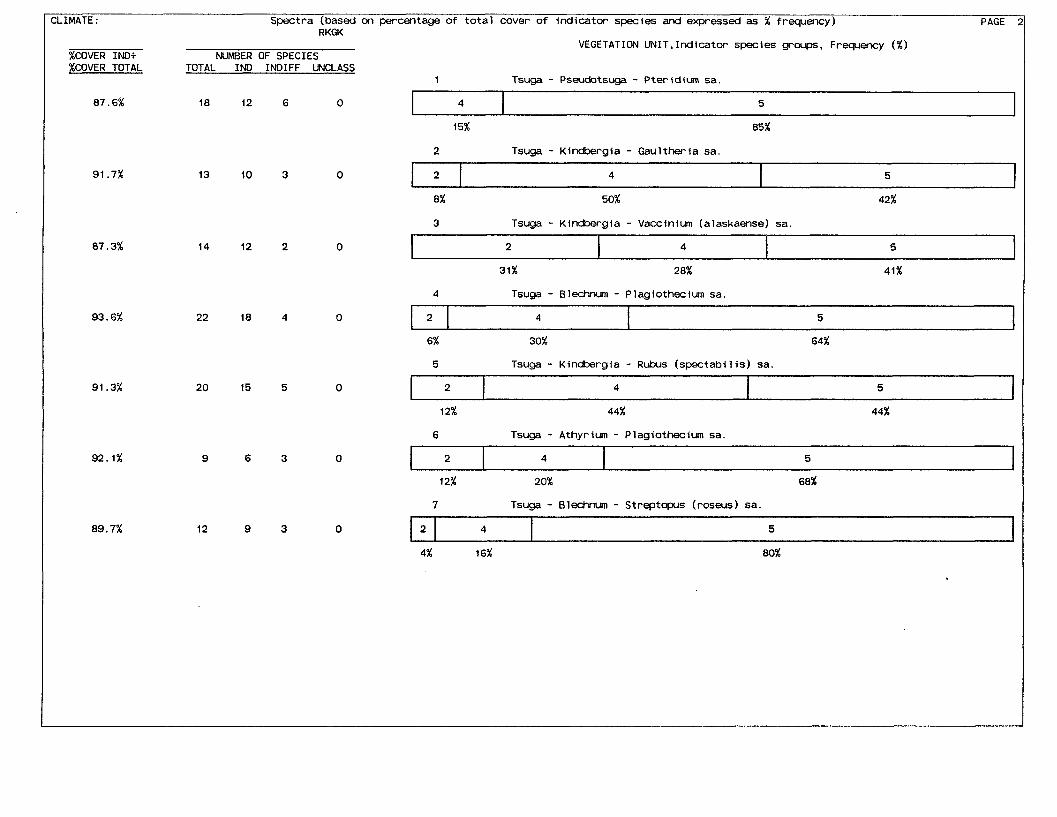
CLIMATE : Spectra (based on percentage of total cover of indtcator spectes and expressed as % frequeocy) PAGE RKGK
VEGETATION UNIT,Indicator spectes groups. Frequency (%) %COVER IND* NUMBER OF SPECIES %COVER TOTAL TOTAL INLI INDIFF UNCLASS
1 Tsuga - Pseudotsuga - Pteridiun sa.
2 Tsuga - Ktndbergta - Gaultheria sa.
4 Tsuga - Blechman - Plagtothectum sa.
3 Tsuga - Ktncbergia - Vacctntum (alaskaense) sa.
I 2
6 Tsuga - Athyrium - Plagiothecium sa.
4 I 5
5 Tsuga - Kincbergia - Rubus (spectabilis) sa.
7 Tsuga - BlechmKn - Streptopus (roseus) sa.
31% 28% 41%
2 4 I 5 I 12% 44% 44%
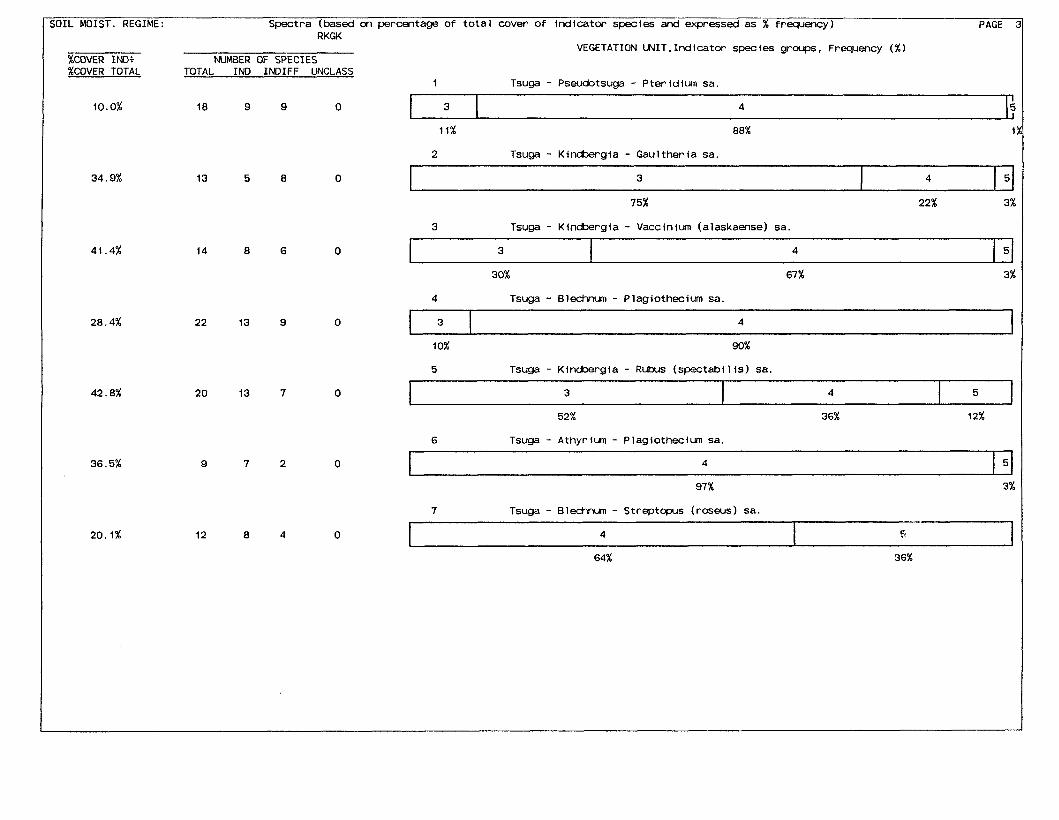
SOIL MOIST. REGIME: Spectra (based cn percentage of total cover of indicator species and expressed as % fr6qxr-c~) PAGE 3 RKGK
VEGETATION LNIT.Indicator species gaps. Frequency (%) %COVER IND+ NUNWER OF SPECIES %COVER TOTAL TOTAL IND INDIFF UNCLASS
1 Tsuga - Pswdotsuga - Pteridfum sa. 10.0% 18 9 9 0 3
1 4 5
11% 88% I %
2 Tsuga - Kincbergia - Gaultheria sa. 34.9% 3 4
75% 22% 3%
3 Tsuga - Kincbergia - Vaccinium (alaskaense) sa.
41.4% 3
30% 67% 3%
4 Tsuga - Blechnun - Plagiothecim sa. 28.4% I 3 4
I 0% 90%
5 Tsuga - Kincbergia - Rubus (spectabllis) sa.
4
42.8%
5
5 3
52% 36% 12%
6 Tsuga - Athyrfum - Plagiothecfm sa.
I 4
36.5% 4 5
97 % 3%
7 Tsuga - 8lednun - Streptopus (roseus) sa. 20.1% 4 I F
64% 36%
-- - --
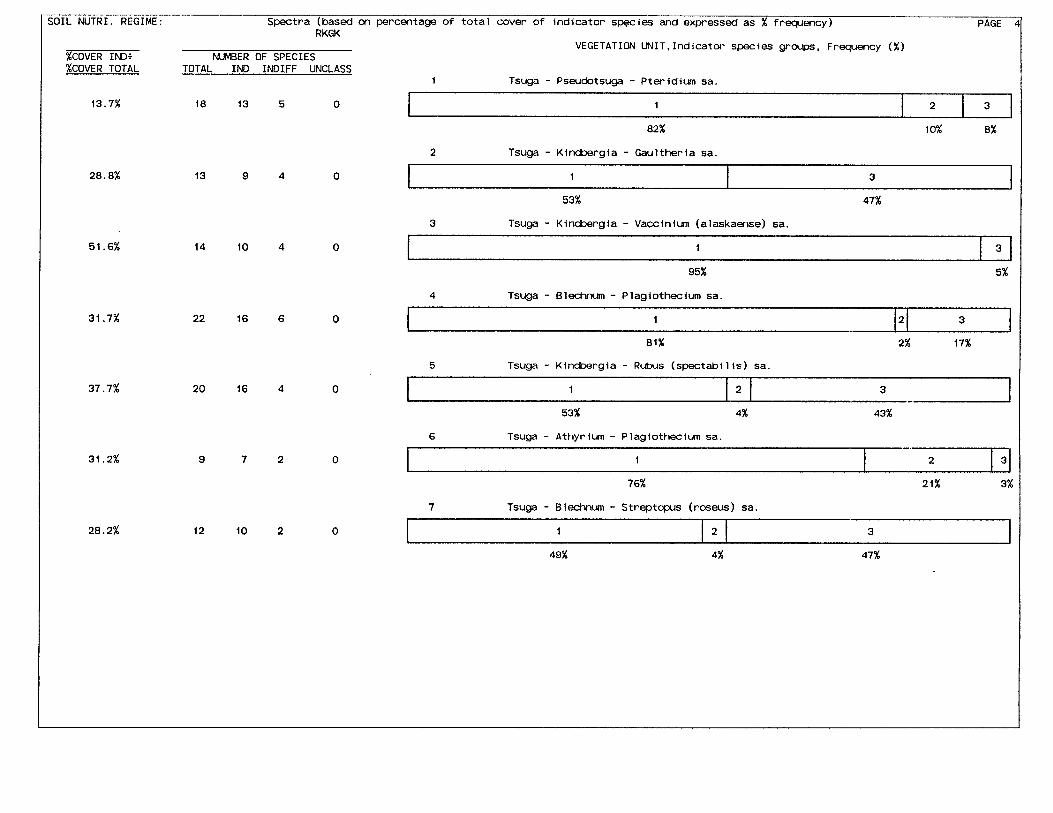
SOIL NUTRI. REGIME: Spectra (based cn percentage of to ta l cover of indicator species and expressed as % frequency) PAGE 4 RKGK
VEGETATION UNIT,Indicator species groups. Frequency (%) %COVER INDi NUMBER OF SPECIES %COVER TOTAL TOTAL IND INDIFF UNCLASS
1 Tsuga - Pseudotsuga - P te r i d im sa.
13.7% 18 13 5 0 1
82% 10% 8%
2 Tsuga - Kindbergia - Gaultherla sa.
2
28.8%
3
1 3
53% 47%
3 Tsuga - Kincbergia - Vacciniun (alaskaense) sa.
51.6% I I 3
95% 5%
4 Tsuga - B l e d n u m - Plagiotheciun sa.
31.7% I 1 2 3
81% 2% 17%
5 Tsuga - Kincbergia - Rubus (spectabil ls) sa.
37.7% I 1 2 3
53% 4% 43%
6 Tsuga - Athyr im - Plagiotheciun sa.
I
31.2%
76% 21% 3%
7 Tsuga - B l e d n u m - Streptopus (roseus) sa.
28.2% I I 2 3 I
49% 4% 47%
- 3 1 2
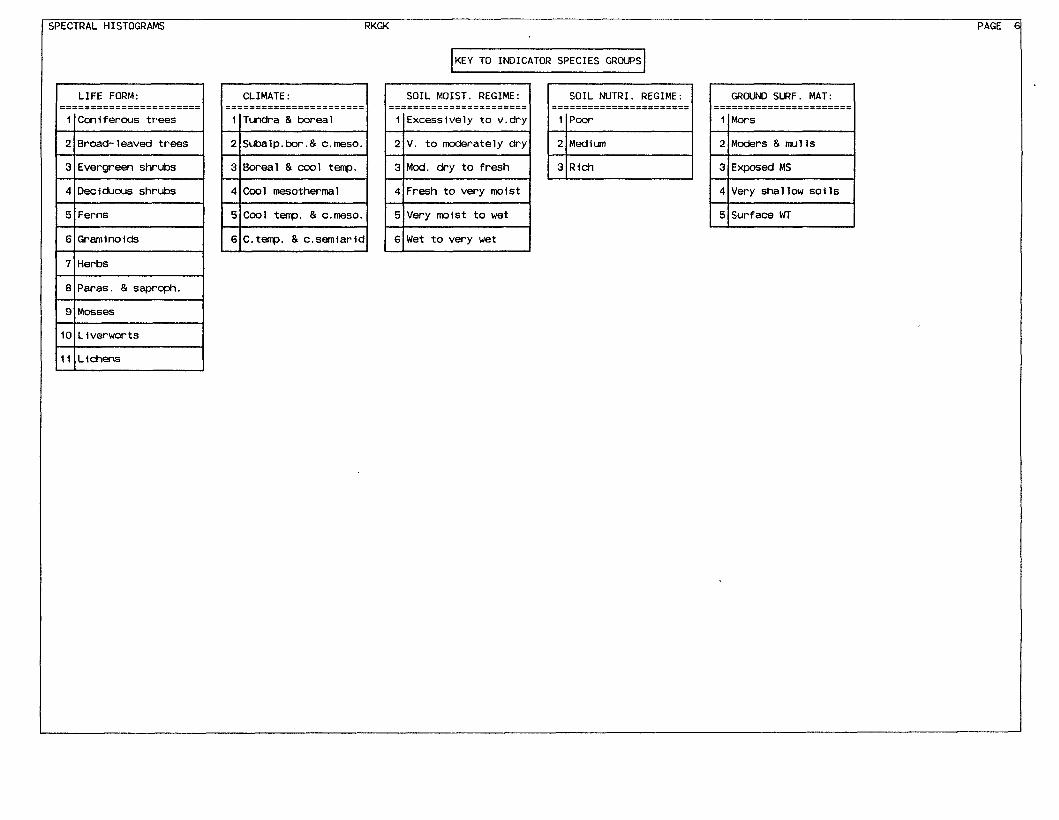
KEY TO I W I C A T O R SPECIES GROWS
CLIMATE : ============s==========
1
2
3
4
5
6
S O I L MOIST. REGIME: ---=--------- --- ---------=====s====
T u n d r a & boreal
S U b a l ~ . b O r . & c.mes0.
B o r e a l & cool tenp.
C o o l m e s o t h e r m a l
C o o l tenp. & c .meso .
C . t q . & c . s e m l a r i d
1
2
3
4
5
6
- S O I L NUTRI. REGIME: - - - - - - - - - - - - - - - -E==Dl===L=IPE====
E x c e s s i v e l y t o v.dry
V. t o m o d e r a t e l y d r y
Mod, d r y t o fresh
F r e s h to v e r y m o i s t
V e r y m o i s t t o w e t
Wet t o very w e t
I
2
3
SPECTRAL HISTOGRAMS RKGK PAGE 6
GROUM) SURF. MAT: ==E==I I=======E=I=====E
P o o r
M e d i u m
R i d 7
1
2
3
4
5
Mors
Mcders & m l l s
Expused MS
V e r y s h a l l o w so i l s
S u r f ace W
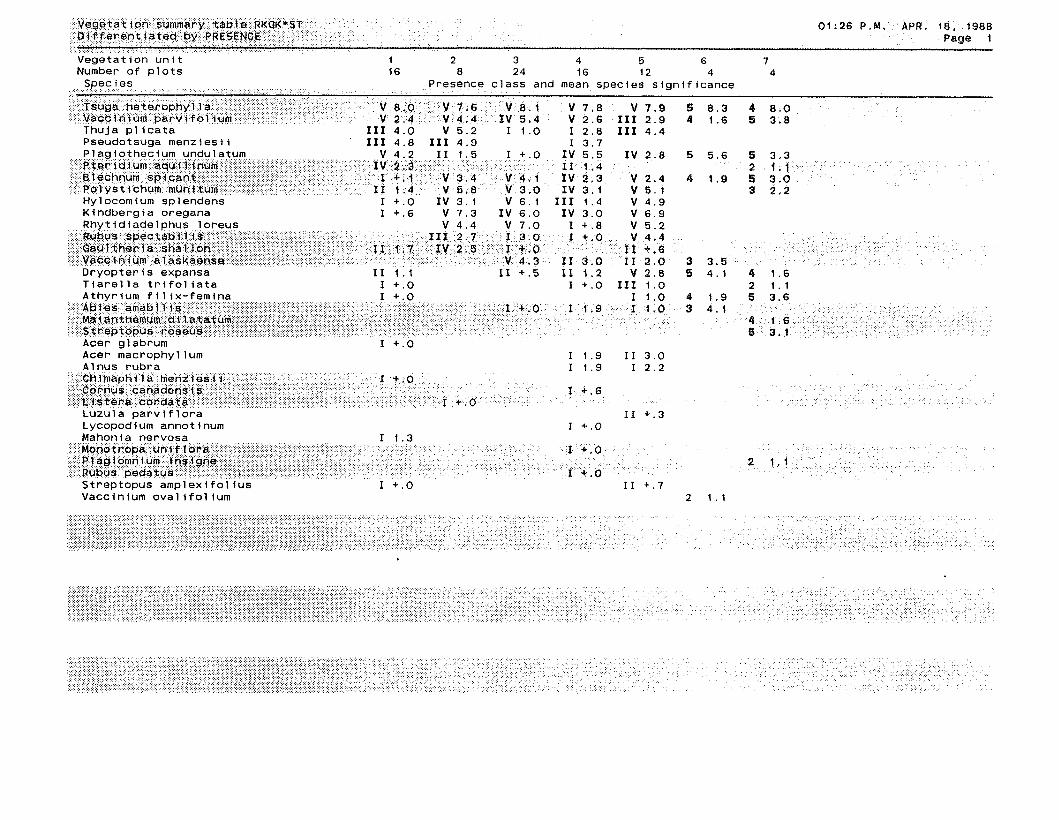
Vegetation summary t a b l e RKQKWST 0 1 : 2 6 P .M. APR. f a . 1988 D i P f e r e n t l a t e d by PRESENCE Page 1 - Vegetat ion u n i t 1 2 3 4 5 6 7 Number o f p l o t s 16 8 2 4 16 12 4 4
nd mean species s igni f icance
Thuja p l i c a t a 111 4 . 0 V 5 . 2 I 1 . 0 I 2 . 8 111 4 . 4 Pseudotsuga rnenziesti 111 4 . 8 I 1 1 4 . 9 1 3 . 7
I V 5 . 5 I V 2 . 8 5 5 . 6 , 5 3 . 3 . . . 5 1 11.4 ' ,; '
, + .: , .: . . . . . .
TV 2 . 3 v 2 . 4 4 1 . 9 5 3 . 0 . ,
I V 3 . 1 V 5 . 1 3 2 . 2 11 1 . 4 V 4 . 9
Kindbergia oregana I + . 6 V 7 . 3 I V 6 . 0 I V 3 . 0 V 6 . 9
. 8 5 4 . 1 4 1 .6 T l a r e l l a t r i f o l i a t a I + . O I + . O I 1 1 1 . 0 2 1 .1
Acer rnacro~hvllum 1 1 . 9 I 1 3 . 0
~ycopod'r urn annot 1 num Mahonia nervosa Mono t I + . O P I ~ Q ~ a 1 . 1 Rubus X + . O Streptopus amplex l fo l fus Vacclnlum ova l l fo l lu rn
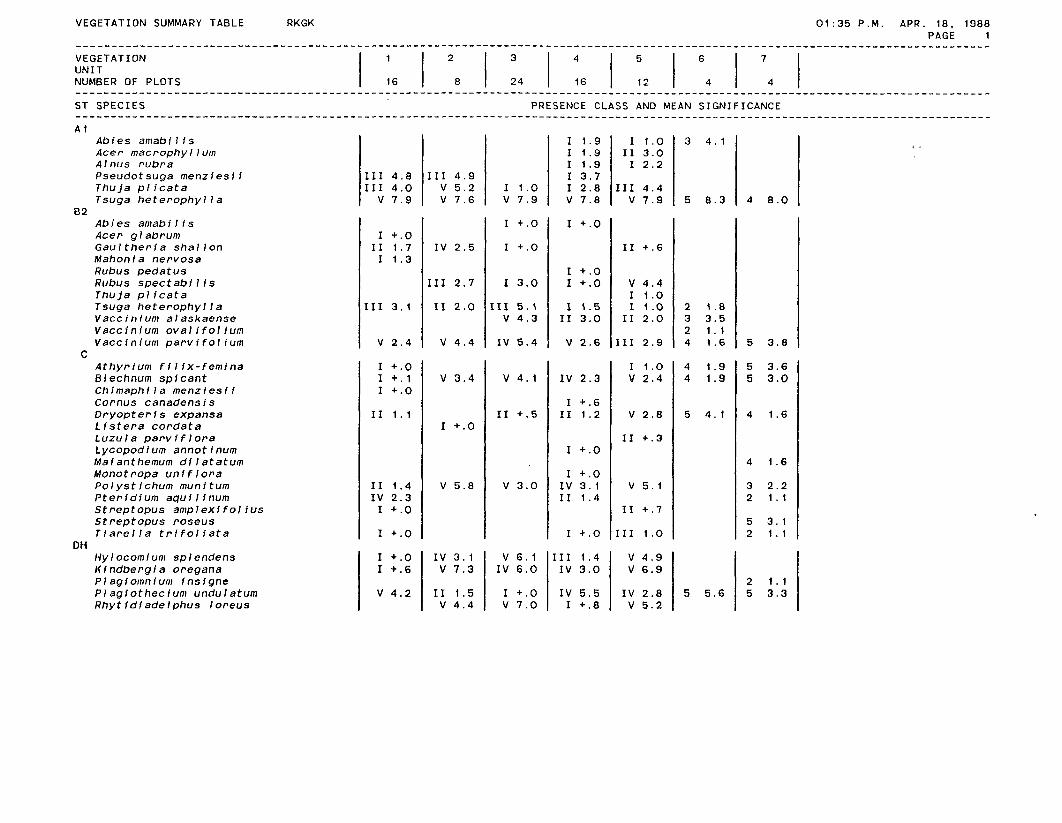
VEGETATION SUMMARY TABLE RKGK 01:35 P.M. APR. 18. 1988 PAGE 1 . . . . . . . . . . . . . . . . . . . . . . . . . . . . . . . . . . . . . . . . . . . . . . . . . . . . . . . . . . . . . . . . . . . . . . . . . . . . . . . . . . . . . . . . . . . . . . . . . . . . . . . . . . . . . . . . . . . . . . . . . . . . . . . . . . .
VEGETATION UNIT NUMBER OF PLOTS . . . . . . . . . . . . . . . . . . . . . . . . . . . . . . . . . . . . . . . . . . . . . . . . . . . . . . . . . . . . . . . . . . . . . . . . . . . . . . . . . . . . . . . . . . . . . . . . . . . . . . . . . . . . . . . . . . . . . . . . . . . . . . . . . . . ST SPECIES PRESENCE CLASS AND MEAN SIGNIFICANCE . . . . . . . . . . . . . . . . . . . . . . . . . . . . . . . . . . . . . . . . . . . . . . . . . . . . . . . . . . . . . . . . . . . . . . . . . . . . . . . . . . . . . . . . . . . . . . . . . . . . . . . . . . . . . . . . . . . . . . . . . . . . . . . . . . . A I
Abies amabilis Acer macrophyllum Alnus rubra Pseudotsuga menziesii Thuja plicata Tsuga heterophylla
8 2 Abies amabilis Acer glabrum Gaultheria shallon Mahonia nervosa Rubus pedatus Rubus spectabilis Thuja pl icata Tsuga heterophylla Vaccinium alaskaense Vaccinium ovalifolium Vaccinium parvifolium
C Athyrium filix-femina Blechnum spfcant Chimaphila menziesii Cornus canadensis Dryopteris expansa Listera cordata Luzula parviflora Lycopodium annotinum Maianthemum dilatatum Monotropa uniflora Polystichum munitum Pteridium aquilinum Streptopus amplexifolius Streptopus roseus Tiarella trifoliata
DH Hylocomium splendens Kindbergfa oregana Plagiomnium insigne Plagiothecfum undulatum Rhytidiadelphus loreus
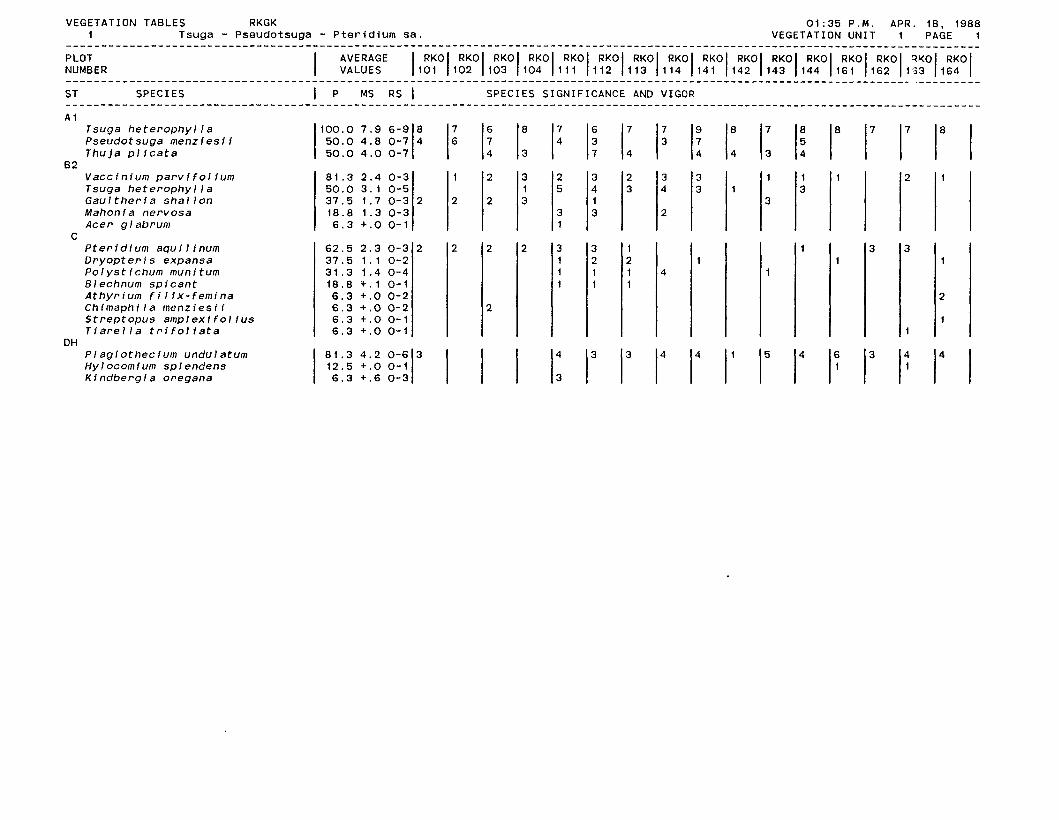
VEGETATION TABLES RKGK 0 1 : 3 5 P.M. APR. 18 . 1 9 8 8 1 T s u g a - P s e u d o t s u g a - P t e r f d l u m s a . VEGETAT IONUNIT 1 PAGE I ...................................................................................................................................
PLOT AVERAGE RKO RKO RKO RKO RKO RKO RKO RKO RKO RKO RKO RKO RKO RKO ?YO RKO NUMBER I VALUES 1101 1102 1103 1 1 0 4 l 1 1 1 1 1 1 2 1 1 1 3 1114 1 1 4 1 1 1 4 2 1143 1144 1 1 6 1 1 1 6 2 1153 I 1 6 4 ( . . . . ..................................................................................................................... "--------- ST SPECIES I P MS RS I SPECIES S IGNIF ICANCE AND VIGOR ................................................................................................................................... A 1
Tsuga heterophyl la Pseudotsuga menzfesfi Thufa plfcata 5 0 . 0 4 . 0 0 - 7
R 7 -- Vaccinium parvifolium Tsuga heterophyl la Gaultheria shallon Mahonia nervosa Acer glabrum
l-! - Pteridium aquilinum Dryopteris expansa Polystichum munitum Blechnum spicant Athyrium filix-femina Chimaphfla menzfesfi Streptopus amplexifolius Tiarella trifoliata
DH Plagiothecium undulatum Hylocomium splendens Kfndbergia oregana 6 . 3 + . 6 0 - 3
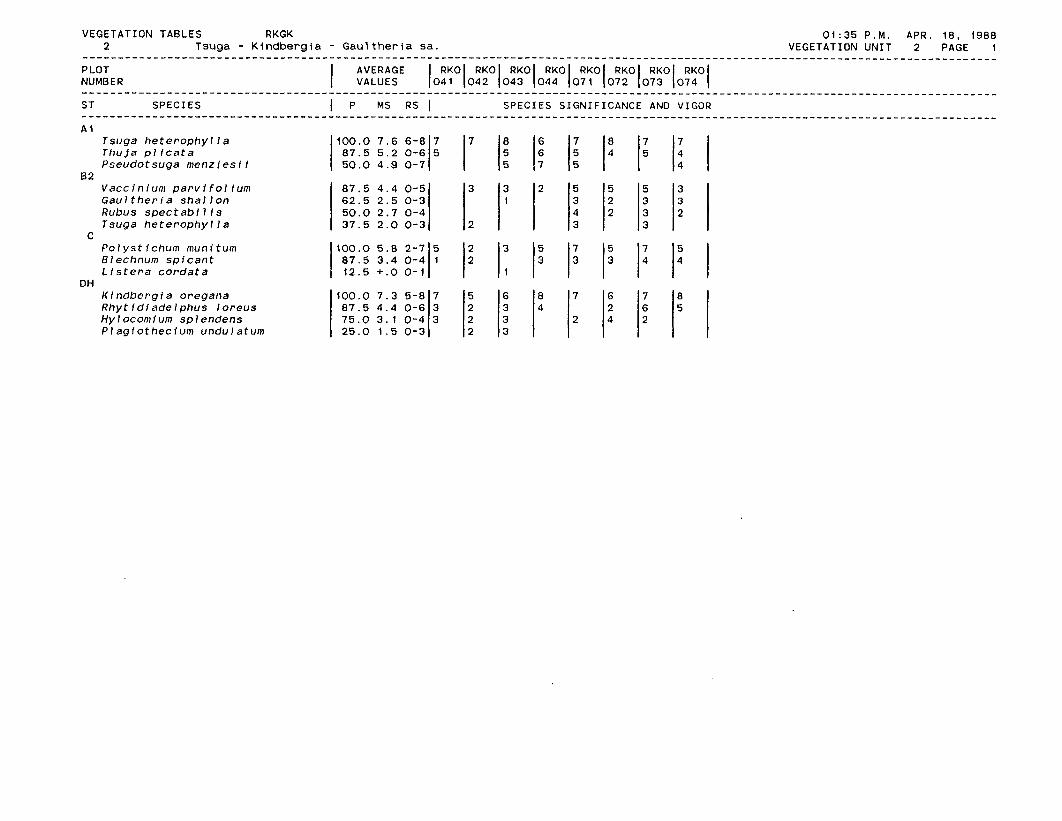
VEGETATION TABLES RKGK 01:35 P.M. APR. 18. 1988 2 Tsuga - K i n d b e r g i a - G a u l t h e r i a sa. VEGETATION UNIT 2 PAGE I ... . . . . . . . . . . . . . . . . . . . . . . . . . . . . . . . . . . . . . . . . . . . . . . . . . . . . . . . . . . . . . . . . . . . . . . . . . . . . . . . . . . . . . . . . . . . . . . . . . . . . . . . . . . . . . . . . . . . . . . . . . . . . . . . .
PLOT AVERAGE RKO RKO RKO RKO RKO RKO RKO RKO NUMBER I VALUES 1041 1042 1043 1044 1071 (072 1073 1074 ( . . . . . . . . . . . . . . . . . . . . . . . . . . . . . . . . . . . . . . . . . . . . . . . . . . . . . . . . . . . . . . . . . . . . . . . . . . . . . . . . . . . . . . . . . . . . . . . . . . . . . . . . . . . . . . . . . . . . . . . . . . . . . . . . . . . ST SPECIES I P MS RS 1 SPECIES SIGNIFICANCE AND VIGOR .... . . . . . . . . . . . . . . . . . . . . . . . . . . . . . . . . . . . . . . . . . . . . . . . . . . . . . . . . . . . . . . . . . . . . . . . . . . . . . . . . . . . . . . . . . . . . . . . . . . . . . . . . . . . . . . . . . . . . . . . . . . . . . . . A 1
Tsuga heterophylla 100.0 7 .6 6-8 7 Thuja plicata Pseudotsuga menzlesii 1 8 7 . 5 5 . 2 0 - 6 i 5 5 0 . 0 4 .9 0-7 I7 1 % 1; 1; 1' 1: 1 % I
82 Vaccinium parvffolium Gaultheria shallon Rubus spectabfl is Tsuga heterophylla
C Polystichum munitum 100.0 5 . 8 2-7 5 Blechnum spicant Lfstera cordata 1 8 7 . 5 3 . 4 0 - 4 1 , 1 12.5 +.O 0 - 1 1; 1: 1; 1; 1; 1: 1: I
OH Kindbergia oregana Rhytfdfadelphus loreus Hylocomium splendens Plagiothecfum undulatum 2 5 . 0 1 .5 0-3
87 .5 4 .4 0-5 62 .5 2 . 5 0-3 5 0 . 0 2.7 0-4 37.5 2 . 0 0-3
1 3 2
2 3 3
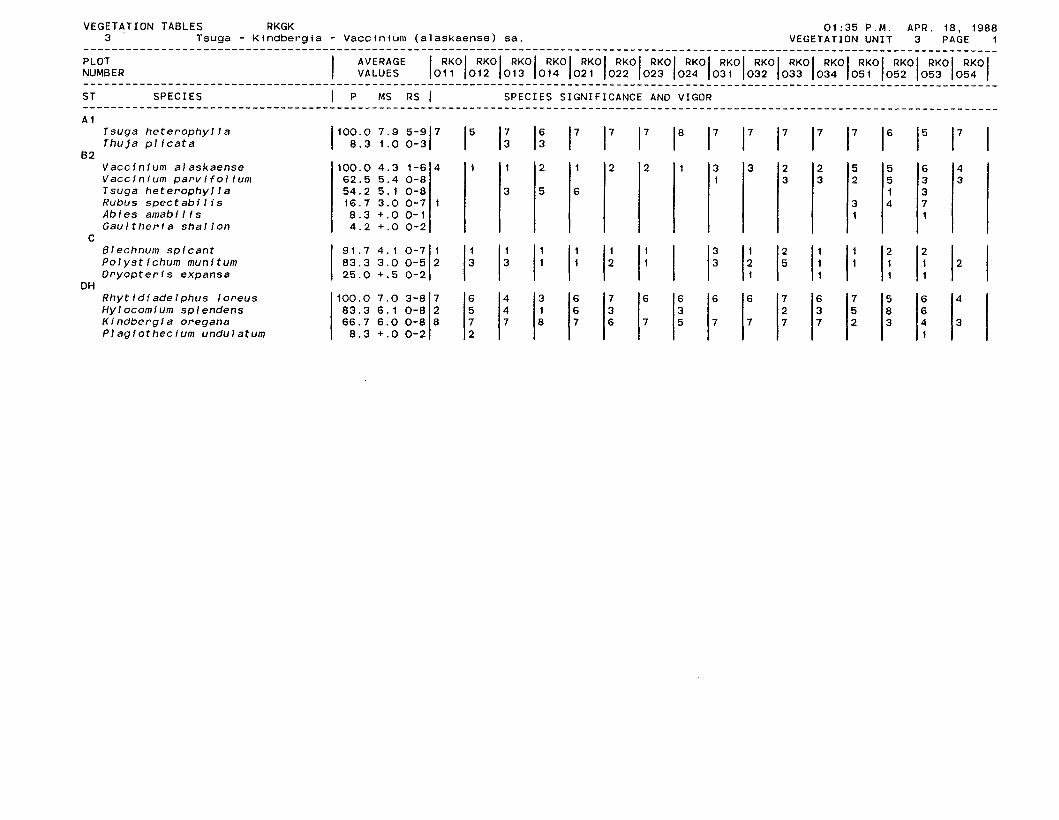
Rhytidiadelphus loreus Hylocomium splendens Hindbergfa oregana Plagiothecium undulatum
VEGETATION TABLES RKGK 01:35 P.M. APR. 18, 1988 3 Tsuga - K i n d b e r g i a - Vacc in ium (a laskaense ) sa . VEGETATION UNIT 3 PAGE 1 . . . . . . . . . . . . . . . . . . . . . . . . . . . . . . . . . . . . . . . . . . . . . . . . . . . . . . . . . . . . . . . . . . . . . . . . . . . . . . . . . . . . . . . . . . . . . . . . . . . . . . . . . . . . . . . . . . . . . . . . . . . . . . . . . . .
PLOT AVERAGE RKO RKO RKO RKO RKO RKO RKO RKO RKO RKO RKO RKO RKO RKO RKO RKO NUMBER 1 VALUES l o l l 1012 1013 1014 1021 1022 1023 1024 1031 1032 1033 1034 1051 1052 1053 1054 1 . . . . . . . . . . . . . . . . . . . . . . . . . . . . . . . . . . . . . . . . . . . . . . . . . . . . . . . . . . . . . . . . . . . . . . . . . . . . . . . . . . . . . . . . . . . . . . . . . . . . . . . . . . . . . . . . . . . . . . . . . . . . . . . . . . . ST SPECIES I P MS RS I SPECIES SIGNIFICANCE AND VIGOR .. . . . . . . . . . . . . . . . . . . . . . . . . . . . . . . . . . . . . . . . . . . . . . . . . . . . . . . . . . . . . . . . . . . . . . . . . . . . . . . . . . . . . . . . . . . . . . . . . . . . . . . . . . . . . . . . . . . . . . . . . . . . . . . . . . A l
Tsuga heterophylla Thufa plicata
8 2 Vaccinium alaskaense Vaccinium parvifolium Tsuga heterophylla Rubus spectabilis Abies amabilis Gaultheria shallon
C Blechnum spfcant Polystfchum munitum Qryopteris expansa 2 5 . 0 +.5 0-2
OH
100.0 4 . 3 1-6 62 .5 5 .4 0-8 54.2 5 . 1 0-8 16.7 3 . 0 0-7 8 . 3 +.O 0 -1 4 . 2 +.O 0-2
4
1
1
3 5 6
1 2 1 2 2 1 3 3 2 2 5 5 6 4 I 3 3 2 5 3 3
1
1 3 3 4 7
1
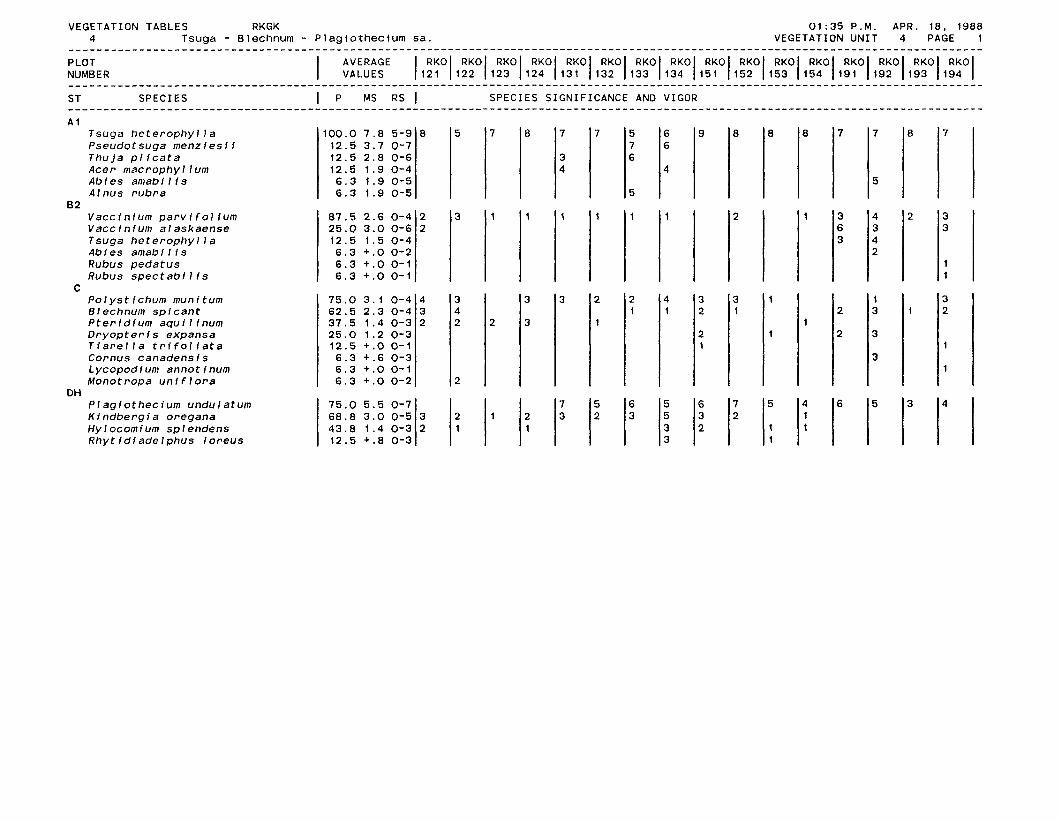
VEGETATION TABLES RKGK 01:35 P.M. APR. 18, 1988 4 Tsuga - Blechnum - Plagiothecium sa. VEGETATION UNIT 4 PAGE I . . . . . . . . . . . . . . . . . . . . . . . . . . . . . . . . . . . . . . . . . . . . . . . . . . . . . . . . . . . . . . . . . . . . . . . . . . . . . . . . . . . . . . . . . . . . . . . . . . . . . . . . . . . . . . . . . . . . . . . . . . . . . . . . . . .
PLOT AVERAGE RKO RKO RKO RKO RKO RKO RKO RKO RKO RKO RKO RKO RKO RKO RKO RKO NUMBER I VALUES 1121 1122 1123 1124 1131 1132 (133 1134 1151 1152 1153 1154 1191 1192 1193 1194 ( . . . . . . . . . . . . . . . . . . . . . . . . . . . . . . . . . . . . . . . . . . . . . . . . . . . . . . . . . . . . . . . . . . . . . . . . . . . . . . . . . . . . . . . . . . . . . . . . . . . . . . . . . . . . . . . . . . . . . . . . . . . . . . . . . . . ST SPECIES I P MS RS I SPECIES SIGNIFICANCE AND VIGOR . . . . . . . . . . . . . . . . . . . . . . . . . . . . . . . . . . . . . . . . . . . . . . . . . . . . . . . . . . . . . . . . . . . . . . . . . . . . . . . . . . . . . . . . . . . . . . . . . . . . . . . . . . . . . . . . . . . . . . . . . . . . . . . . . . . A 1
Tsuga heterophylla Pseudotsuga menziesii Thuja plicata Acer macrophyllum Abies amabilis Alnus rubra
8 2 Vaccinium parvffolfum Vaccinium alaskaense Tsuga heterophylla Abies arnabflis Rubus pedatus Rubus spectabilis
C Polystichum munitum Blechnum spicant Pteridium aquilinum Dryopteris expansa Tiarella trifoliata Cornus canadensis Lycopodium annotinum Monotropa uniflora
OH Plagiothecium undulatum Kindbergia oregana Hylocomium splendens Rhytidiadelphus loreus
5
3
3 4 2
2
100.07.85-98 12.5 3.7 0-7 12.5 2.8 0-6 12.5 1.9 0-4 6.3 1.9 0-5 6.3 1.9 0-5
87.5 2.6 0-4 25.0 3.0 0-6 12.5 1.5 0-4 6.3 +.O 0-2 6.3 +.O 0-1 6.3 +.O 0-1
75. 0 3 . 1 0 - 4 4 62.5 2.3 0-4 3 7 . 5 1 . 4 0 - 3 2 25.0 1.2 0-3 12.5 +.O 0-1 6.3 +.6 0-3 6.3 +.O 0-1 6.3 +.O 0-2
2 2
3
75.0 5.5 0-7 68.83.00-51' 43.8 1.4 0-3 2 12.5 +.8 0-3
7
1
2
8
1
7 5 6 5 6 7 5 4 6 5 3 4
I 1: 3 12 1" 1: 12 3
8
1 1
3
7
3 4
8
1
7
5
1 3 4 2 3 3 4 2
1 2 3 1 2
3
3
7
6 3
2
7
1
1
1
8 7
3
1 1
3
1
1
5 7 6
5
1 1
3 3 2 2 4 3 3 1 1
I
6 6
4
1 2
9
2 I
8
2
1
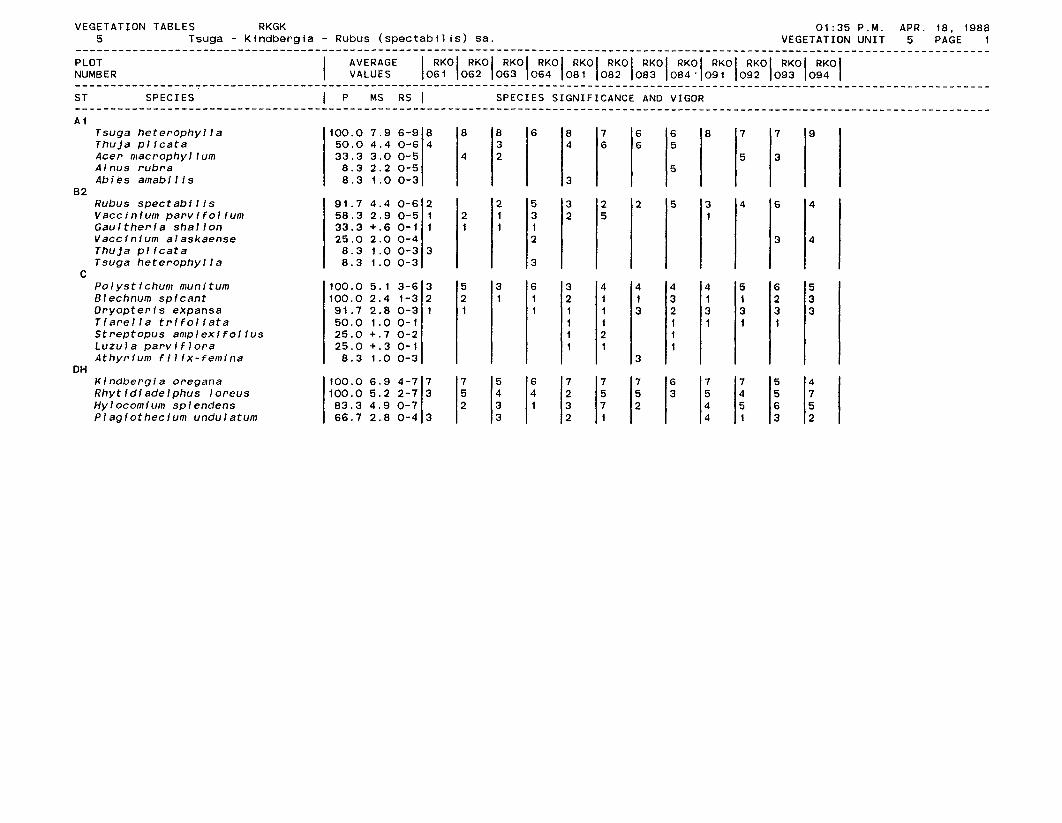
- - Rubus spectabilis Vaccinium parvifolium Gaultheria shallon Vaccinium alaskaense Thuja plicata Tsuga heterophylla
t.
V E G E T A T I O N T A B L E S RKGK 0 1 : 3 5 P . M . APR. 1 8 , 1 9 8 8 5 Tsuga - Kindbergla - R u b u s (spectabtlls) sa. VEGETATION U N I T 5 PAGE I .... . . . . . . . . . . . . . . . . . . . . . . . . . . . . . . . . . . . . . . . . . . . . . . . . . . . . . . . . . . . . . . . . . . . . . . . . . . . . . . . . . . . . . . . . . . . . . . . . . . . . . . . . . . . . . . . . . . . . . . . . . . . . . . .
P L O T AVERAGE RKO RKO RKO RKO RKO RKO RKO RKO RKO RKO RKO RKO NUMBER I VALUES 1 0 6 1 1 0 6 2 1 0 6 3 1 0 6 4 1 0 8 1 1 0 8 2 1 0 8 3 1 0 8 4 . 1 0 9 1 1092 1093 1 0 9 4 1 . . . . . . . . . . . . . . . . . . . . . . . . . . . . . . . . . . . . . . . . . . . . . . . . . . . . . . . . . . . . . . . . . . . . . . . . . . . . . . . . . . . . . . . . . . . . . . . . . . . . . . . . . . . . . . . . . . . . . . . . . . . . . . . . . . . S T S P E C I E S I P MS RS I S P E C I E S S I G N I F I C A N C E AND VIGOR . . . . . . . . . . . . . . . . . . . . . . . . . . . . . . . . . . . . . . . . . . . . . . . . . . . . . . . . . . . . . . . . . . . . . . . . . . . . . . . . . . . . . . . . . . . . . . . . . . . . . . . . . . . . . . . . . . . . . . . . . . . . . . . . . . . A 1
L!
Polystichum munitum Blechnum spicant Oryopteris expansa Tiarella trifoliata Streptopus amplexifolius Luzula parvfffora Athyrium filix-femina
DH
Tsuga heterophylla Thuja plicata Acer macrophyllum Alnus rubra Abies amabilis
Kindbergia oregana Rhytidiadelphus loreus Hylocomium splendens Plagiothecium undulatum
8 2
1 0 0 . 0 7 . 9 6 - 9 8 5 0 . 0 4 . 4 0 - 6 33.3 3 . 0 0 - 5
8 . 3 2 .2 0-5 8 . 3 1.0 0-3
4 8
4
8 3 2
6 8
3
7 4 6 6 5
6 6
5
8 7
5
7
3
9
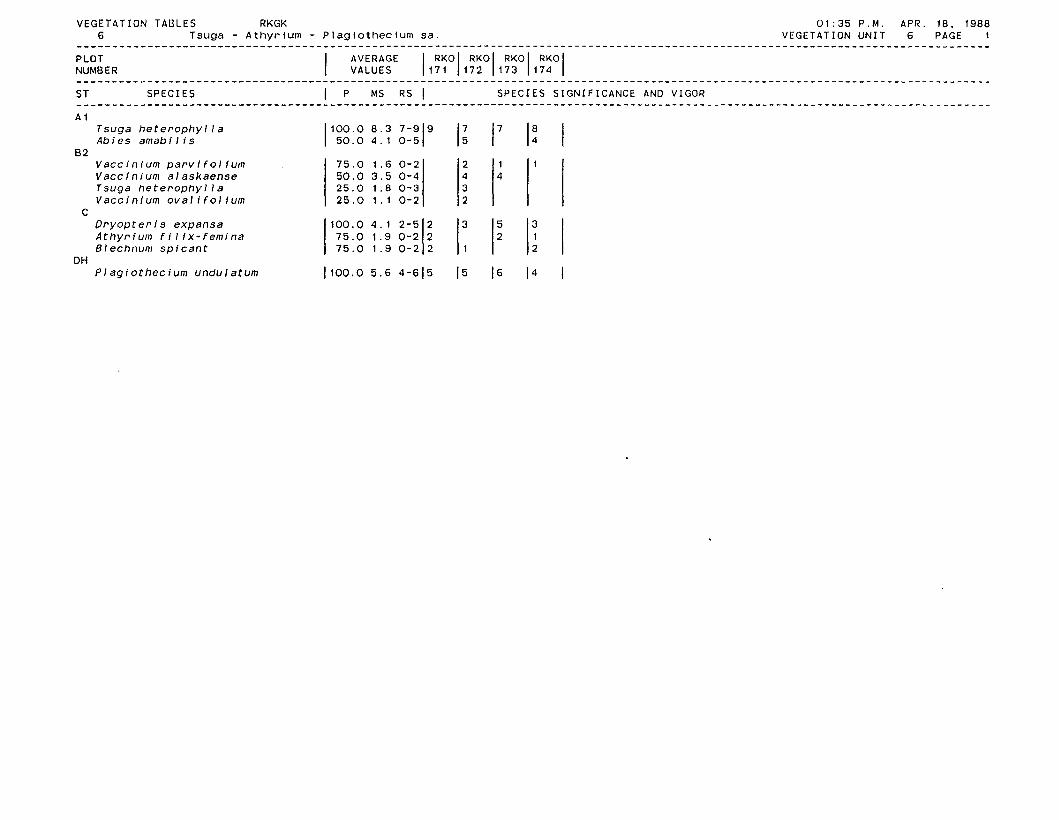
V E G E T A T I O N T A B L E S RKGK 0 1 : 3 5 P . M . APR. 18. 1988 6 Tsuga - Athyrium - Plagiothecium sa. V E G E T A T I O N U N I T 6 PAGE 1 . . . . . . . . . . . . . . . . . . . . . . . . . . . . . . . . . . . . . . . . . . . . . . . . . . . . . . . . . . . . . . . . . . . . . . . . . . . . . . . . . . . . . . . . . . . . . . . . . . . . . . . . . . . . . . . . . . . . . . . . . . . . . . . . . . .
P L O T AVERAGE RKO RKO RKO RKO NUMBER I VALUES I t 7 1 1172 1173 1174 1 . . . . . . . . . . . . . . . . . . . . . . . . . . . . . . . . . . . . . . . . . . . . . . . . . . . . . . . . . . . . . . . . . . . . . . . . . . . . . . . . . . . . . . . . . . . . . . . . . . . . . . . . . . . . . . . . . . . . . . . . . . . . . . . . . . . S T S P E C I E S ( P MS RS I S P E C I E S S I G N I F I C A N C E AND V IGOR . . . . . . . . . . . . . . . . . . . . . . . . . . . . . . . . . . . . . . . . . . . . . . . . . . . . . . . . . . . . . . . . . . . . . . . . . . . . . . . . . . . . . . . . . . . . . . . . . . . . . . . . . . . . . . . . . . . . . . . . . . . . . . . . . . . A I
Tsuga heterophyl la 1 0 0 . 0 8 . 3 7 - 9 9 Abies amabilis
R 7 1 5 0 . 0 4 . 1 0 - 5 1 1: l7 1: I -- Vaccinium parvifolium Vaccinium alaskaense Tsuga heterophylla Vaccinium ovaJ i f 0 1 ium
C Oryopteris expansa Athyrium filix-femina Blechnum spicant
DH Plagiothecium undulatum
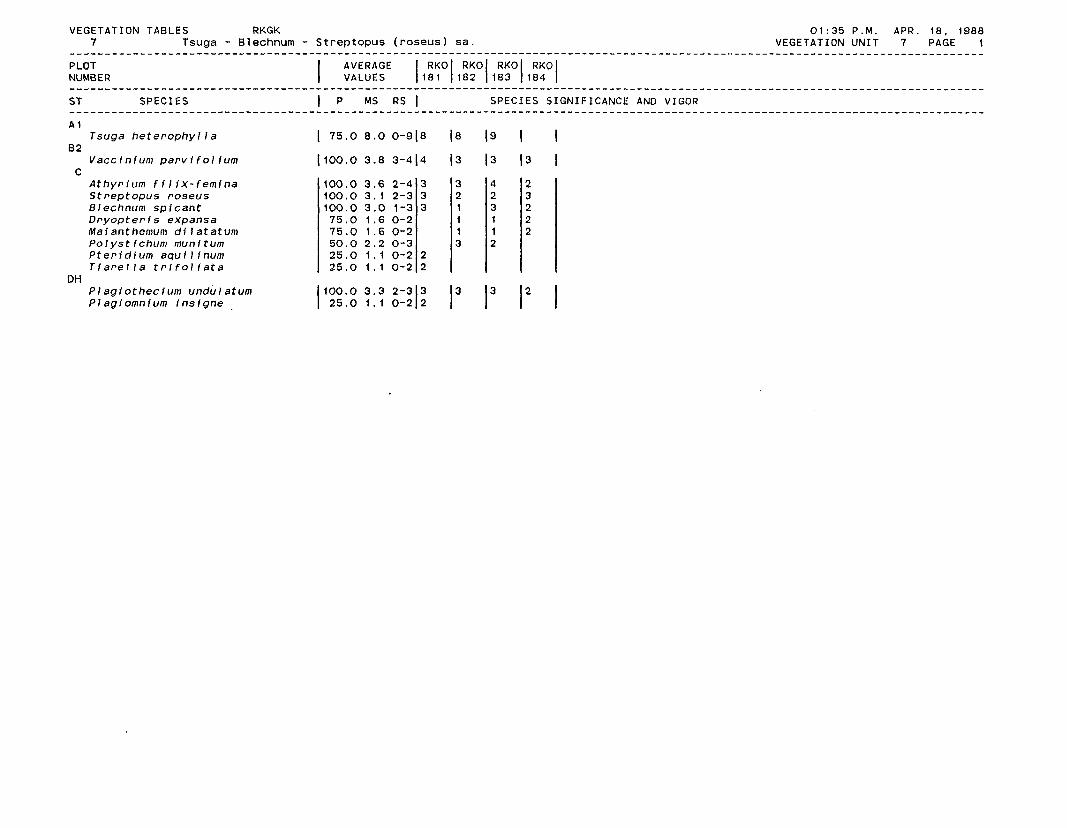
VEGETATION TABLES RKGK 01:35 P.M. APR. 18, 1988 7 Tsuga - Blechnum - Streptopus (roseus) sa. VEGETATION UNIT 7 PAGE 1 . . . . . . . . . . . . . . . . . . . . . . . . . . . . . . . . . . . . . . . . . . . . . . . . . . . . . . . . . . . . . . . . . . . . . . . . . . . . . . . . . . . . . . . . . . . . . . . . . . . . . . . . . . . . . . . . . . . . . . . . . . . . . . . . . . .
PLOT AVERAGE RKO RKO RKO RKO NUMBER 1181 (182 1183 1184 1 . . ................................................................................................................................. ST SPECIES I P MS RS I SPECIES SIGNIFICANCE AND VIGOR ................................................................................................................................... A 1
Tsuga heterophylla 1 75.0 8.0 0-918 18 (9 ( ( B 2
Vaccinium parvifolium Il00.0 3.8 3-414 13 13 (3 ( .. L
Athyrium filix-femina Streptopus roseus Blechnum spicant Dryopteris expansa Maianthemum dflatatum Polystichum munftum Pteridium aqullinum Tiarella trifoliata
DH Plagiothecium undulatum Plagiomnium insigne .