solving structural vibration problems using operating ... · analysis (ema) or “bump” testing,...
TRANSCRIPT

Maki M. Onari is Manager ofTurbomachinery Testing at MechanicalSolutions, Inc. (MSI), in Whippany, NewJersey. He is responsible for field vibrationtesting involving ODS and modal analysis.His career spans more than 12 years,primarily working with rotating equipmentanalysis and troubleshooting in thepetrochemical, refinery, and power generationindustries. Prior to joining MSI, Mr. Onari
was a Rotating Equipment Engineer in PDVSA-Venezuela,responsible for the predictive maintenance of one of the largestpetrochemical complexes in Latin America.Mr. Onari received his B.S. degree (Mechanical Engineering, 1996)
from the Zulia University in Venezuela. He is a member of ASME andthe ISO TC108/S2 Standards Committee for Machinery Vibration.
Paul A. Boyadjis is Manager ofTurbomachinery Analysis at MechanicalSolutions, Inc. (MSI), in Whippany, NewJersey. He has nearly 25 years of diverseexperience in the analysis and design ofrotating equipment. His specialty includescomplex 3D solids modeling of pumpand compressor casings and rotatingassemblies, and the performance of stressand vibration analysis using advanced
finite element techniques. Mr. Boyadjis has worked as a leadanalytical engineer for major compressor and pump manufacturerssuch as Ingersoll-Rand, Ingersoll-Dresser Pump, andFlowserve Corporation.Mr. Boyadjis has B.S. and M.S. degrees (Mechanical
Engineering) from Lehigh University. He is a member of the APIMachinery Standards Committee and a Standards Partner of theHydraulic Institute.
ABSTRACT
This tutorial focuses on vibration issues in pumps primarilyfor power plants, refineries, and municipal water and waste watertreatment plants. Over the years, the original equipment manufacturer(OEM) and the end user often have been able to solve vibrationproblems for this kind of equipment based on their experience. Anadequate maintenance program can identify and solve typicalvibration responses at 1× and 2× running speed due to imbalanceor misalignment. However, when the vibration is due to aresonance of a structural natural frequency or an unexpected
geometry change such as looseness or cracking, it becomes morecomplicated. The trial and error approach can be time consumingand is considered the least cost effective method to solve this typeof problem. Therefore, thorough vibration testing combined withdetailed calibrated finite element analysis (FEA) models havebecome powerful tools to identify and mitigate vibration issuesthrough well-conceived fixes while reducing the risk of introducingnew ones. This tutorial will provide an in-depth look at how thecombination of field testing and computer analysis can solvevibration issues in a timely and cost-effective manner. Several casestudies will be presented that demonstrate this method.
INTRODUCTION
Typically pump original equipment manufacturers (OEMs) andthe end users have used vibration information to diagnose and findthe root cause of any vibration-related problem by taking a fewreadings from the bearing housings and sometimes from the shaft(displacement) both during steady and transient conditions of thepump. Approximately 90 percent of the cases of excessivevibration can be diagnosed using such traditional readings from thebearing housings, and the solution can be implemented immediately(e.g., rotor imbalance, misalignment, bearing damage, etc.).However, the remaining 10 percent of pump vibration problemscan be more subtle and lead to chronic reliability issues such aspremature wear of bushings and seals, bearing failures, structuralcracks and looseness, coupling failures, and even broken shafts.One of the more common of these difficult chronic problems is thesynchronous excitation of structural natural frequencies, butunexpected problems can also occur due to subsynchronous andsupersynchronous problems. These result from rubs, fluid dynamicinstabilities, or resonances with high order excitation sources suchas vane pass frequency.Identifying the source of the problem requires a troubleshooting
investigation that plant personnel can carry out if they areexperienced. Alternatively they can be given appropriate guidanceby the OEM or a qualified consultant that uses modern tools andapproaches (available from large end user in-house groups, majorOEMs, and qualified consulting companies), such as vibration dataacquisition analyzers and computer simulation analysis software.The cost associated with this testing and analysis is considerednegligible when compared to the expenditures for the continuedrebuilding of damaged machinery components and associateddowntime. Specifically, these tools include vibration versus time(wave forms), orbit plots, vibration versus time trending, andvibration versus frequency analysis (i.e., a fast Fourier transform[FFT] spectrum). In addition, higher level analysis exists suchas operating deflection shapes (ODS), experimental modalanalysis (EMA) or “bump” testing, combined with finite elementanalysis (FEA).
85
SOLVING STRUCTURAL VIBRATION PROBLEMSUSING OPERATING DEFLECTION SHAPE AND FINITE ELEMENT ANALYSIS
byMaki M. Onari
Manager of Turbomachinery Testing
andPaul A. Boyadjis
Manager of Turbomachinery Analysis
Mechanical Solutions, Inc.
Whippany, New Jersey

BACKGROUND ON VIBRATION MEASUREMENTS
Excessive vibration of rotating equipment is one of the mostcommon issues that personnel experience industry-wide, fromlarge power plants and refineries to small wastewater treatmentplants. In most of the cases, high vibration is a detrimentalcondition that can lead to wasted energy due to wear of internalseals, environmental harm or physical danger due to failure ofexterior seals, undesirable noise, and potential failure of themachine. On the beneficial side, the amplitude of vibration at keyfrequencies in rotating machinery can be used to characterize howhealthy the equipment is, aided by specialized instrumentation.This section of the tutorial will explain the fundamentals ofvibration theory and vibration measurement.
Vibration Theory
The fundamental concept of vibration is basically the oscillatorymotion of the mass and the forces involved in the system. Ingeneral, any mass with elasticity is capable of vibrating. Thevibration can be classified in two types, free vibration and forcedvibration. The first one occurs when the system oscillates freelyafter some previous excitation, and the second one occurs whencurrent external forces excite the system. If the frequency of theexternal force coincides with the natural frequency of the system,a resonance condition will take place making the system vibratewith elevated amplitude. This should be avoided during the designof any structure and especially rotating machinery. Fortunately, ifthere is a resonance then damping in the system limits theamplitude at the resonance condition to some degree as energy isdissipated by friction and fluid-structure interaction.
Vibration Measurement Hardware
When performing vibration testing (whether routine or fortroubleshooting), the instrumentation required depends on theapplication, location, and purpose. For instance, eddy currentproximity probes are used to measure the shaft vibration indisplacement relative to the bearing housing in mils or �m.Velocity sensors are used to measure vibration in velocity in/s ormm/s. To measure vibration on the bearing housings and casingsthe typical transducers used are piezoelectric accelerometers,which measure the absolute vibration in g’s. Modern accelerometershave been designed to measure not only high frequency response,but also have been designed to measure low frequency vibration(down to 1 Hz and in special cases below 1 Hz). However, caremust be taken when the vibration in acceleration is integrated toobtain the vibration in terms of velocity or displacement becauseeach vibration peak is divided by its frequency, which could leadinto an “integration error” for low frequency spikes, in which asmall amount of low frequency noise appears to be a large amountof fictitious displacement. Therefore, the fact that the accelerometersare suitable only for high frequency vibration is no longer true.They are capable of covering a large frequency bandwidth,typically up to 10 kHz or higher, enabled by the typical resonantfrequency of the accelerometers being on the order of 50 kHz.Proximity probes do not require integration since they measurerelative displacement directly. Hence, they are free of integrationerror at low frequencies, and at the upper end typically areconsidered adequate up to several kHz, which is sufficient forpump applications. Probes that measure velocity directly are also available.
However, the construction of these probes results in a relativelylimited frequency range, and today accelerometers are typicallypreferred, even though a degree of integration error will be presentat lower frequencies.Proximity probes are thread mounted through the bearing housing
cap or on a bracket next to the housing. These sensors are poweredthrough a “proximitor” box that also converts the direct current (DC)output voltage into displacement. Accelerometers are usually
magnetic mounted for temporary use and also could be threadmounted on the casing with the appropriate stud. They alwaysshould be electrically isolated to avoid grounding issues between thepump casing and the analyzer. For temporary use for nonmagneticsurfaces (concrete, plastic, aluminum, austenitic steels, etc.) theaccelerometers can be placed with appropriate wax material for lowtemperature applications, and with epoxy for moderate temperatureapplications. Hand-held attachment can produce good results ifperformed by a properly experienced technician and taken at thesame location on the equipment each time. Accelerometers can vary in construction depending on the
application. For high temperature applications there are accelerometerswith the signal conditioning electronics built in a separate devicefrom the actual sensor, minimizing its exposure to the temperature.There are special accelerometers for submersible applications (e.g.,for below-ground structural measurements on vertical pumps) withan integrated sealed cable connection. The accelerometer can besingle-axis, double-axis, and tri-axis to measure in one, two, andthree orthogonal directions, respectively (i.e., x, y, and z directionssimultaneously). The size of the accelerometers can also varydepending on the application and can be as small as 0.2 inches long(5.1 mm) with 0.007 oz of weight (0.2 grams). The typicalaccelerometer used for troubleshooting purposes is about 1 inch(25 mm) long and 0.75 inches (19 mm) Hex with about 1 oz ofweight (30 grams) without the magnetic mount.Besides vibration measurement instrumentation, there are other
instruments that are useful for troubleshooting purposes, whichinclude dynamic pressure transducers to measure pressure pulsationsand piping system acoustic natural frequencies, microphonesand/or hydrophones for cavitation testing, strain gauges to measurestrain on casing nozzles, piping, and shafting in order to calculatestresses where failures have been experienced. The cables used for the vibration and other type of instruments
are designed to minimize electrical noise, and typically consist oftwisted pairs or coaxial shielding with the shield grounded at onlyone end to avoid ground loops.Vibration signal analyzers are required to provide power to the
piezoelectric instruments to collect raw vibration signals initially inthe time domain (amplitude versus time wave form data).Advanced analyzers further transform this complex raw signal intoa typically more friendly data form of amplitude versus frequencyby performing an internal mathematical operation know as the fastFourier transform. There are several basic kinds of vibrationanalyzer. One type is the handheld portable analyzer, whichtypically has one or two channels that are commonly equipped tostore the vibration data. It is used by end users to collect, on aperiodic basis, routine vibration measurements to monitor thedynamic behavior of the equipment over time. The vibration datacollected are part of the overall predictive maintenance program.This maintenance program usually is focused on vibration datataken at bearing housings where the interaction between the shaftnatural response and the casing structure is dominant. Anothertype of analyzer is the multichannel analyzer, which is used fortroubleshooting purposes, and typically incorporates between fourto 40 channels or more in order to gather large amounts ofvibration data simultaneously. Situations that would require such alarge amount of data particularly occur in cases involving transientconditions during start ups, shut downs, variable speed, or loadoperation, etc.The vibration analyzers are set up prior to the measurement,
according to the pump condition and event to be evaluated. Forinstance, it requires definition of the frequency span to be recorded(typically from 1.5 Hz to 25.6 kHz), and the frequency resolution(number of lines in the frequency span, typically between 50 linesand 6400 lines), and the type of averaging (could be instantaneousor linear for a periodic and stationary condition, instantaneous orexponential averaging for a transient condition, and in someanalyzers the peak-hold, which maintains the highest vibration
PROCEEDINGS OF THE TWENTY-FIFTH INTERNATIONAL PUMP USERS SYMPOSIUM • 200986

peaks that occur during transient conditions). In addition, theanalyzer requires the input of the high pass filter setting, which isthe minimum frequency of interest (e.g., frequency response that isin interest might require the DC voltage or frequency above 0.7 Hz,7.0 Hz, or 22.4 Hz). Too low a high-pass filter setting can result inmeasurements that tend to “hang-up” due to constant overloadingof the amplifier, combined with a long time constant for theoverloaded amplifier to “clear.”
Vibration Data Management—Display/Plots
The raw waveform signal is displayed as a sinusoidal plot ofvibration amplitude versus time. It is usually a very complexcombination of superimposed sine waves and is used to interpretvibration behavior over relatively long periods of time or duringtransient events of the unit, when variations of the speed and loadare present (Figure 1), or perhaps rubbing or cavitation events areoccurring. The time trace allows the analyst to identify particularevents related to nearly instantaneous changes in the process(system), spike events such as cavitation phenomena, etc. Whenthe vibration event occurs periodically over time (e.g., as a functionof the rotational speed), then FFT plots are more useful (experimentalmodal analysis being an exception, as will be discussed later).These frequency spectra are calculated in the analyzer understeady-state operation of the unit. It linearly averages a largeamount of vibration samples, with each sample covering a relativelyshort period of time, on the order of a second or so, dependingupon frequency range and the number of lines in the spectrum. Thespectra allow the analyst to identify the predominant vibrationpeaks (discrete vibration) in terms of amplitude and the frequenciesat which they occur. Simultaneously, the overall vibration can becalculated, which is basically the square root of the sum of thesquare (SRSS) of each individual discrete vibration amplitudewithin the frequency span previously selected. During predictivemaintenance and most diagnostic procedures, the amplitude ofthese discrete peaks as well as the overall vibration are comparedwith specification limits that have been developed by the OEMsand/or end users for guideline purpose. These limits establish thelevel when the pump or the driver has reached the condition thatcan cause damage to their internal components. The objective ofvibration specifications is to protect the equipment, and to providea standard against which the end user, the OEM, and consultingcompanies can define reasonable acceptance criteria. Acceptancelimits that are too loose could result in damaged machinery, whilelimits that are too tight are unnecessarily costly to implement sincethey suggest the need to modify or replace components when thisis not necessary.
Figure 1. Vibration Waveform Signal (g’s Versus Time).
The vibration amplitude output directly available fromaccelerometers is in g’s peak or rms. End users in the Americas aremore familiar with velocity units in in/s peak. The relationshipbetween rms, peak, and peak-to-peak amplitude is shown inFigure 2.
Figure 2. Vibration Sine Wave Relationships.
The scale of the amplitude can be presented in linear scale andin logarithmic scale. The linear amplitude scale is used by mostvibration analysts, where the discrete vibration peaks are shownisolated with typically flat floor-noise across the frequency span(Figure 3). Often, a logarithmic scale would “inflate” thebroadband floor-noise indicating key information that could bevery important when performing troubleshooting, such as forexample the structural natural frequencies. Figure 4 shows thesame FFT plot as Figure 3, but in logarithmic scale, and throughthis is able to indicate the structural natural frequencies, as shown.This additional information can be curve-fit by the analyst todetermine the amplification factor of the natural frequency, and tocalculate the separation margin from excitation sources of thepump such as 1× fundamental harmonic of running speed, 2× rpm,vane pass frequency, etc.
Figure 3. Vibration Spectrum in Linear Scale.
Figure 4. Vibration Spectrum in Logarithmic Scale.
Besides the FFT spectra, there are other plots sometimes usedfor troubleshooting purposes such as waterfall plots, which arethree-dimensional (3D) plots displaying a “family” of FFT spectraalong a third axis of time or in some cases versus the speed change(Figure 5). The trend plot is basically the vibration amplitude at anygiven frequency, or can be the overall vibration, in either caseplotted along the time axis. Another type of useful plot, the orbit
87SOLVING STRUCTURAL VIBRATION PROBLEMSUSING OPERATING DEFLECTION SHAPE AND FINITE ELEMENT ANALYSIS

plot, is created based on vibration readings from a pair ofproximity probes installed on the bearing housing, monitoring theshaft and positioned in two orthogonal directions such that thepolar cross-plot in time can describe the motion of the shaft center(Figure 6).
Figure 5. Waterfall Plot.
Figure 6. Orbit Plot.
VIBRATION TESTING PRACTICE
Determining a suitable solution to chronic vibration problemshas most often been performed by end users through trial anderror methods, such as attempting structural fixes or progressivelytightening balance tolerances on the rotors. This can be timeconsuming, cumulatively costly, and does not always achieve thelong-term trouble-free operation that is sought. In order to achievea high level of success in resolving vibration issues, a detailedanalysis of the mechanism of the vibration problem is needed. Thiscan be obtained by developing a finite element analysis model ofthe pump system, best calibrated with operating deflection shapeand experimental modal analysis field vibration data, as will beshown. This combined analysis and testing approach can provide arobust platform to identify and verify the suitability of potentialmodifications. The identification of the root cause by thismethod provides a high degree of confidence that any prescribedmodifications will alleviate the primary problem without creatingnew problems. The following section will describe the ODS andEMA vibration testing.
Operating Deflection Shape Vibration Testing
The ODS is a thorough “natural excitation signature” vibrationtest performed on the entire unit structure that usually includes datacollection on both the driver and the driven machinery, the associatednozzles/piping, the mounting baseplate, the foundation, and thesurrounding floor (concrete) while the unit is operating under itsworse-case dynamic condition (within typical operating range
condition), in order to capture the overall motion at any givenfrequency. In this process, it is important to gather vibration databetween attachments of assembly components to capture anyseparation between parts (looseness, soft-foot, etc.).To perform an ODS test, several roving accelerometers
(typically tri-axis accelerometers) are used to measure thevibration signal in three orthogonal directions at a large number ofrepresentative key locations (as many as 300 to 400 measurementpoint/direction combinations are eventually observed, dependingon the nature of the problem) along all accessible relevant structuralportions of the pump and system, and often parts of any exposedor permanently instrumented shafting. Limited measurement dueto access or safety reasons can be supplemented later by atest-calibrated FEA model. Figure 7 shows a typical verticalturbine pump along with data-points taken for the ODS testing. Forcollecting shaft vibration data, it is common to use proximityprobes or temporary shaft-rider sticks equipped with mountedaccelerometers to observe the shaft orbital motions (axial andtorsional motions can also be detected, by special techniques). Allthese vibration data are recorded as amplitude versus frequency(FFT spectra), and the same data are digitally recorded versus timefor a reasonable time interval (approximately one minute permeasurement). The frequency span is selected depending on thenature of the problem, and it is recommended to record at leastsome key data at higher frequency so that it can be played-back ifnecessary for further investigation at various frequency ranges. Thecomplete vibration data are taken such that one of the singleaccelerometer channels of the FFT signal analyzer is always kept atthe same location and direction on the unit as a phase reference foreach roving accelerometer, proximity probe, or other transducer(e.g., dynamic pressure transducer, microphone, or motor currenttransducers). The single axis reference accelerometer is usuallyplaced where a relatively high vibration is present in the pumpsystem across the frequency range of interest, in order to obtain astrong signal for phase angle reference.
Figure 7. Pump 3D CAD Model and Vibration Data-Points fromODS Testing.
Due to the large number of vibration data-points required, it isextremely important to accurately document each measurement,identifying the location and orientation of each roving accelerometer(single and triax accelerometers), and also create a detaileddrawing with the actual dimensions of the pump system to becompared with the OEM and construction drawings (if available).The field-taken dimensional sketch drawing will be used to createthe 3D computer aided drafting (CAD) model for animation andtroubleshooting purposes.Each measurement is exported to the ODS database computer
program. The database is arranged according to point number (laterconnected to a location/direction) versus frequency, amplitude, andphase angle with respect to the reference accelerometer for eachdata-point. In this program, each vibration data-point collected
PROCEEDINGS OF THE TWENTY-FIFTH INTERNATIONAL PUMP USERS SYMPOSIUM • 200988

onsite is stored in a database called the data block, then this datablock is assigned to the 3D model (e.g., CAD model) of the pumpsystem tested, maintaining the same data-point location andorientation (horizontal-vertical-axial). The global CAD model isconstructed by laying out various substructures within the systemsuch as the motor, pump bearing housings, pump casing, baseplate(and for vertical turbine pumps, discharge head and column pipe),foundation, floor, etc. Each substructure is created from singlepoints, lines, and surfaces. Once the field information is assigned,each substructure or group of substructures is selected to applyinterpolation equations to assign relative motion to those pointsthat do not have actual vibration data. In this way, each componentor substructure in the model will have an independent self-definedmotion when measurement between independent parts has beengathered to observe potential looseness or separation between parts.Once the measurement assignment and interpolation equations
are applied to each substructure, the model can be evaluated at anygiven frequency. From the field testing, the highest discretevibration amplitude has already been detected at key frequencies,which are usually the excitation sources such as 1× rpm (typicallyfor imbalance), 2× rpm (typically for misalignment), impeller vanepass frequency (VPF), diffuser vane pass frequency, gear meshfrequency (GMF, when gears are present), subsynchronous peaks(e.g., for shaft rubbing, or rotating stall), etc. It is typically best toevaluate first the ODS model at the running speed of the pump.The resulting vibration animation describes in exaggeratedmotion/deformation (but consistently scaled) the pump vibrationalmotion at the selected frequency in order to easily identify forexample the “weakest” location of the pump, which in the examplein Figure 8 experiences vibration levels above specifications.
Figure 8. Pump ODS at the Running Speed Rocking in the ParallelDirection to the Discharge Pipe.
If the excitation frequency source is close to a natural frequency,the ODS animation at this natural frequency would describe anapproximate mode shape of the natural frequency. Modes thathistorically have been clearly evident from their shapes includefirst, second, and third bending modes of long cantilever structures,horizontal and axial rocking rigid body modes, vertical bouncingmodes, torsional modes, etc. In order to increase the separation margin between the excitation
source and the structural natural frequency, there are typically twoalternatives, depending on the case, to shift the natural frequency.One is increasing or decreasing the stiffness of the system to shiftupward or downward the natural frequency. The other one is addingmass to shift downward the offending natural frequency. In order toavoid “trial and error” process to detune a natural frequency in thismanner, the FEA analysis approach, described later, is considereda very good additional tool.
Experimental Modal Analysis
Similar in some respects to ODS testing at nonsynchronousfrequencies, EMA is a type of “impulse-response” test todetermine the structural natural frequencies and the mode shapesof the pump system by using an instrumented hammer instead ofthe natural excitation of the pump. Therefore, the response of themachinery is measured through the accelerometers from a knowninput excitation source (e.g., instrumented hammer for abroadband-excitation impact). An engineered impact hammer isprovided with different materials to be placed at its tip (i.e., varioushardness of rubber material, or even metals such as bronze)depending on the frequency response that is required (harder tipsexcite higher frequencies). It is known that the response of thehammer will decay (roll-off) for response at higher frequency;therefore the tip should be selected such that the natural frequencyof interest would fall within frequency span before first roll-off.For each measurement/accelerometer location, a number ofimpacts should be applied until the average of frequency responsespectra becomes steady. Typically, if the machine is not operating,the impact number per test is about 10 to 15.Since the natural frequencies are usually inline with the principal
axes of the pump, this EMA test is performed in three orthogonaldirections (horizontal, vertical, and axial direction) by impactingthe pump component near where the highest vibration was detectedduring natural excitation test. Modal testing is typically performedby plants and OEMs when the pump is not operating. However,whenever practical it is recommended to perform this test by usinga method such as a modal analysis technique that can effectivelydetermine critical speeds and structural natural frequencies of allrotating machinery under operating conditions, such that “bumptesting” is performed without shutting down the equipment. Thistechnique is especially useful in multistage high energy variablespeed pumps whose rotordynamic characteristics are stronglyspeed and load dependent. This test takes into account the addedmass effect of pumped fluid entrapped in the pump casing, theenergized bearing and Lomakin Effect seal stiffnesses, and thegyroscopic effect due to the rotational speed of the rotor. Therefore,it properly accounts for the boundary conditions established by theoperating condition. Also, it is able to identify any naturalfrequency related problems without any downtime of the testedpump or nearby equipment, which can be important in manyapplications and industries.This technique incorporates time averaging statistics to rapidly
improve the signal-to-noise ratio under operating conditions. Timeaveraging reduces the amplitude ratio of the random naturallyexcited vibration versus the impact-coherent vibration during thesignal processing to greatly emphasize the effect of the “bump”while the machine continues its normal operation. Since the naturalexcitation from the pump is present, this technique requires a largeamount of impacts in order to average-out and cancel the main andoften strong excitation sources such as 1× rpm, 2× rpm, 1× VPF,2× VPF, etc.
FINITE ELEMENT ANALYSIS
Once the ODS and the EMA animations are created andanalyzed at particular frequencies, an FEA model is constructedand calibrated to match the problematic frequencies and modeshapes uncovered in the vibration test data. The FEA modelincorporates the actual dimensions of the pump parts and istypically constructed and assembled from two-dimensional (2D)drawings or physical measurements using a computer-generated(CG) solid-modeler. Each part in the model is assigned appropriatematerial properties taking into account any water mass effects,including external added mass effects due to submerged columnssuch as found in vertical turbine pumps. The model includes theappropriate foundation and nozzle constraints, shafting geometry,impeller inertia properties, and a motor representation based on itsweight, CG, and manufacturer-supplied reed frequency. Once the
89SOLVING STRUCTURAL VIBRATION PROBLEMSUSING OPERATING DEFLECTION SHAPE AND FINITE ELEMENT ANALYSIS

model has been calibrated to the data, proposed virtual fixes suchas adding ribs or weight or removing material can be simulatedusing the FEA model to determine the best course of action torectify or mitigate the vibration problem. Typically, as a minimum,an increase in separation margin of at least (10 percent to 15percent) is desired and can normally be achieved with a highdegree of confidence using field test data and a well calibratedfinite element model.
FEA Fundamentals
The detailed numerical concepts concerning the finite elementtechnique are beyond the scope of this tutorial, and the reader isadvised to refer to the literature, which contains numerous books,articles, and papers on the subject. Nevertheless, some mention ofthe basic finite element concepts will be discussed to give thereader some background to the method. Essentially, the finiteelement method attempts to simulate the behavior of a structure byrepresenting it with many smaller well understood components orelements. The stiffness matrix of a small rectangular element withfour corner nodes in the case of a 2D shell element or eight cornernodes in a 3D brick element is well understood mathematically.The process of breaking down a structure into typically thousandsof these well-understood elements is called the meshing processand is often done automatically by present day finite elementcodes. The assembly of these elements at the node points allows foran overall stiffness matrix, and in the case of a modal analysis amass matrix as well to be created that represents the entirestructure. The finer the breakup of the structure, the more precisethe results will be. In addition to 3D solid elements, shell elementsthat have a thickness input are often used to model large diameter,thin walled structures such as pump columns and discharge heads.Beam elements, where cross sectional properties are input, can beused for shafts, piping, or struts, and mass and spring elements,which are often used to model impellers and bearing stiffnesses,respectively. They are also widely used in finite element models tosimulate portions of the actual pump. The solution to these largeassembled matrices of finite elements, which involves numericalmethod calculations of inverted matrices, is performed transparentlyto the user. In case of the modal analysis, the output will be a listof natural frequencies along with the corresponding mode shapesof each determined frequency.
CASE HISTORY 1
A barrel type pump in charge service at a nuclear power plantfacility had been exhibiting elevated vibrations that were highlyerratic in amplitude and phase angle (relative to shaft position)during normal monitoring. It was speculated by plant personnel thatthis behavior could have been attributed to a possible crack, whichmight have developed in the shaft due to an event experienced in theprevious year. During that event, normal electrical power was lost,and the motor was suddenly restarted when the plant’s dieselgenerator came online. To prevent a potential failure or interventionby the Nuclear Regulatory Commission (NRC) leading to costlydowntime, the personnel had planed a complete teardown of thepump in order to perform a visual inspection of the shaft. However,it was later decided that the pump should undergo extensive fieldvibration testing rather than a costly internal inspection todetermine if a cracked shaft was responsible for the erraticvibration behavior.
Field Vibration Testing
The maximum vibration amplitude of approximately 0.22 in/s(5.59 mm/s) peak was detected in the horizontal direction on theoutboard bearing housing at 1× pump operating speed of 4812 rpm(80.2 Hz), as shown in Figure 9. However, the sister pump had asimilar deflection shape at the running speed, but the maximumhorizontal vibration level on the outboard bearing housingmeasured was only 0.054 in/s (1.37 mm/s) peak.
Figure 9. FFT Plot of the Outboard Bearing in the HorizontalDirection (0.2 g’s or 0.22 in/s peak at 80.2 Hz).
The operating deflection shape showed that the pump wasrocking from side to side, and most importantly, that one of theoutboard pump feet had a loose connection to the pedestal (“softfoot”) as shown in Figure 10. Experimental modal analysisperformed on the pump while stationary indicated a strong naturalfrequency at 93 Hz (Figure 11) in the horizontal direction, whichwas considered adequate (16 percent of separation margin abovethe running speed). However, when the EMA test was performedusing and experimental modal analysis technique during pumpoperation, the actual natural frequency was detected at 76.2 Hz,which had only 5 percent separation margin from the running speedamplifying the vibration in the horizontal direction (Figure 12).
Figure 10. Barrel Pump ODS at the Running Speed.
Figure 11. Frequency Response Spectrum from EMA Testing Whilethe Pump Was Not Operating.
PROCEEDINGS OF THE TWENTY-FIFTH INTERNATIONAL PUMP USERS SYMPOSIUM • 200990

Figure 12. Frequency Response Spectrum from EMA Testing Whilethe Pump Was Operating.
FEA Analysis and Results
At the plant management’s request, before any correctiveaction by the plant, the authors performed a finite elementanalysis (Figure 13) to simulate the structural behavior of thepump on its pedestal for conditions with and without the soft foot.The analysis with all four feet securely connected to the pedestalspredicted a natural frequency similar to that observed in thestationary modal test. The analysis was fine-tuned to accuratelymatch the 93 Hz structural natural frequency and mode shape ofthe pump as determined through impact modal testing (Figure14). The same model was analyzed with the “soft foot” condition,which showed that the same natural frequency shifted lower to78 Hz (Figure 15) close to the running speed of 80.2 Hz. Thiscalculated natural frequency was also very close to the naturalfrequency detected experimentally (approximately 2 percentdifference). Therefore, the FEA model was considered calibratedwith the field test data.
Figure 13. FEA Model for the Barrel Pump, Using Large butAccurate “Polynomial” Elements.
Figure 14. FEA Calculated Mode Shape of the Pump (92.1 Hz)with All Bolted Foot Connections Secure.
Figure 15. FEA Calculated Mode Shape of the Pump (77.8 Hz)with the Simulated “Soft Foot” on One Outboard Foot.
This structural natural frequency at approximately 76.2 Hz waschanging somewhat from start to start and also during steadyoperation depending upon the stiffness of the bolted connection.This shift resulted in the pump tuning in slightly better or worsewith the natural frequency, which affected the amplification and thephase angle of the vibration. Correcting the “soft foot” conditioneliminated the variations in amplitude and phase measured on theoutboard bearing housing. In addition, there was no evidence ofshaft cracking in further vibration analysis. The considerable cost ofan extensive maintenance repair operation was avoided.
Conclusions and Recommendations
• The ODS of the pump at 80.2 Hz showed a rocking motion ofthe pump and clearly indicated that there was motion of one of theoutboard pump feet (on the left side when viewed from thenondrive-end of the pump) relative to the pedestal on which it wasmounted. This relative motion was indicative of a loose connectionor “soft foot” on the pump.
• The stiffness of the pump support connection was varying fromstart to start as well as during steady operation, thereby causing thenatural frequency to shift. Therefore, the variations in vibrationamplitude and phase were a result of this natural frequency tuningin and out of the pump running speed. This shift in naturalfrequency and its effects was confirmed with finite elementanalyses of the pump with and without the soft foot.
• In situations such as this, the bolted connections of the pumpcasing to the baseplate pedestals should be inspected for soft footcondition and corrected as necessary. The torque value for the bolton the soft foot should be recorded in its “as-found” conditionas well as after being properly tightened to the manufacturer’sspecifications. Prior to loosening the hold down bolt, dial indicatorsshould be placed on the foot, and the displacement of the footrecorded as the bolt is loosened. If necessary, shims could be usedto take up any gaps between the pump foot and the pedestal.
CASE HISTORY 2
Two circulation vertical turbine pumps with 45 ft (13.72 m) longcolumn assembly installed in a nuclear facility were presentingpremature wearing of the line shaft bearings and shaft sleevesleading to frequent and costly repairs. Vibration amplitude wasreported to be variable depending on the level of the lake where thepumps were installed.
Field Vibration Testing
During the vibration testing performed, the maximum vibrationabove-ground was measured to be approximately 0.39 in/s (9.91mm/s) peak at the running speed of 14.9 Hz (894 rpm) in the directionperpendicular to the discharge pipe (Figure 16). A below-groundaccelerometer located above the suction bell flange, in the samedirection, was indicating 0.74 in/s (18.8 mm/s) peak at the samefrequency (Figure 17).
91SOLVING STRUCTURAL VIBRATION PROBLEMSUSING OPERATING DEFLECTION SHAPE AND FINITE ELEMENT ANALYSIS

Figure 16. Vibration Spectrum (FFT) Measured at the Top theMotor in the Perpendicular Direction to the Discharge Piping.
Figure 17. Vibration Spectrum (FFT) Measured at the ColumnBelow-Ground in the Perpendicular Direction to the Discharge Piping.
From these vibration spectra, with the amplitude plotted withlogarithmic scale the natural frequencies were able to be identifiedby their wide peaks within the broadband noise-floor. Therefore,based on above- and below-ground measurements, the mainnatural frequencies were able to be identified as shown inTable 1. From the below-ground measurement the same naturalfrequencies were detected as were obtained on the motor (muchmore weakly on the motor for the first mode) with the additionof a natural frequency at 0.75 Hz. Therefore, the closest naturalfrequency to the running speed had less than 7.0 percentseparation margin (15.9 Hz versus 14.9 Hz), while typicalseparation margin required is between 10 percent to 15 percent,especially with respect to a 1× running speed excitation source.The natural frequencies in the parallel direction to the dischargepiping were the same or higher as expected, due to the stiffnessprovided by the piping in this direction.
Table 1. Structural Natural Frequencies and Mode Shapes fromODS Testing.
Experimental modal analysis performed while the pump was notoperating indicated that the natural frequencies shifted upwardbecause the added water mass effect inside the column pipe anddischarge head was not present. Table 2 summarizes the naturalfrequencies and their mode shapes.
Table 2. Structural Natural Frequencies and Mode Shapes fromNonoperating EMA Testing.
Since the below-ground structure was only instrumented withone pair of submersible accelerometers at the suction bell flange(in orthogonal direction), it would be difficult to identify the modeshapes based on test alone. However, a combination of the ODSanimations, authors’ experience, and FEA analysis results enabledthe mode shapes to be accurately characterized. The animationscreated from the ODS testing clearly revealed that the first bendingbelow-ground (primarily) natural frequency was at 0.75 Hz (Figure18), and the above-ground mode (primarily motor cantilever) wasidentified at approximately 18.6 Hz (Figure 19). In theory, forcantilever beams, the second and the third bending natural frequenciesare expected to be approximately 6.3 and 17.5 times, respectively,of the first bending frequency (for uniform area moment of inertiaalong the beam structure). Therefore, the second and third modeswere expected to be correspondent with measured natural frequenciesat 5.75 Hz and 16.0 Hz, respectively, approximately similar to thetest results. These natural frequencies were confirmed later withthe FEA analysis.
Figure 18. ODS at 0.75 Hz Showing the First Bending Below-Ground.
Figure 19. ODS at 18.6 Hz Showing the First Bending Above-Ground.
PROCEEDINGS OF THE TWENTY-FIFTH INTERNATIONAL PUMP USERS SYMPOSIUM • 200992

FEA Analysis and Results
A detailed FEA model created of the pump assembly wascalibrated with the field test results of natural frequenciesabove- and below-ground. This calibration was carried out by,first, tuning the motor with its reed frequency (fixed at themounting flange) along with the actual mass and the CGprovided by the motor manufacturer. The second step involvedchanging the pump components’ density by taking into accountthe added water mass inside the column pipe and discharge headas well as the water level outside the pump. The third stepinvolved including part of the concrete foundation to take intoaccount its flexibility as well as the stiffness of the mountingsupport or the soleplate. Figure 20 shows the solids and FEAmodel of the pump assembly.
Figure 20. Solids and FEA Model for the Two-Stage VTP.
From the FEA results, by calibrating the first bending modes(above- and below-ground), the second and third bendingbelow-ground were predicted to be at 5.9 Hz and 16.7 Hz,which were close to the measured natural frequencies at 5.75Hz and 16.0 Hz (3 percent to 4 percent difference). Figures 21through 24 show the FEA results for each natural frequencyregistered in the field testing. The FEA model was also usedto verify that natural frequency of the third bending modeshifted downward (closer to the running speed) when the waterlevel increases.
Figure 21. FEA Predicted First Below-Ground Bending ModeShape at 0.75 Hz.
Figure 22. FEA Predicted Second Below-Ground Bending ModeShape at 5.9 Hz.
Figure 23. FEA Predicted Third Below-Ground Bending ModeShape at 16.7 Hz.
Figure 24. FEA Predicted First Above-Ground Bending ModeShape at 18.3 Hz.
Once the authors confirmed the mode shape of each naturalfrequency, the ODS model was able to be modified by includingadditional vibration data for the below-ground structure at severalelevations of the column pipe with amplitudes and phase anglesbased on the actual measurement in order to reproduce the third
93SOLVING STRUCTURAL VIBRATION PROBLEMSUSING OPERATING DEFLECTION SHAPE AND FINITE ELEMENT ANALYSIS

bending mode and the ODS motion at the running speed. Theshape of the 1× ODS was expected to be similar to the naturalfrequency as shown in Figures 25 and 26, respectively, due to theirproximity to each other.
Figure 25. ODS at 15.9 Hz Showing the Third Bending Below-Ground.
Figure 26. ODS at the Running Speed of the Pump (14.9 Hz).
Conclusions and Recommendations
• The third bending mode structural natural frequency of thecolumn pipe was detected at approximately 7 percent above therunning speed of the pumps and was the cause of the increasedvibration at 1× running speed. This natural frequency was expectedto get even closer to the running speed following any increment inthe level in the lake adding more external mass on the wet columnpipe section.
• Recommendations to improve the vibration levels of theabove- and below-ground structure included welding 1.0 inchthick ribs along the upper portion of the column pipe. This wouldshift the third bending mode approximately 16 percent. Figure 27shows the expected natural frequency (19.3 Hz) and themode shape.
• The second option consisted of removing a section of columnpipe (this was hydraulically acceptable). This modification wouldshift upward the third bending mode structural natural frequencyof the column pipe approximately 48 percent. Figure 28shows the expected new natural frequency (24.7 Hz) and themode shape.
Figure 27. FEA Predicted Third Below-Ground Bending ModeShape at 19.3 Hz by Adding Ribs at the Midsection of the ColumnPipe Assembly.
Figure 28. FEA Predicted Third Below-Ground Bending Mode Shapeat 24.7 Hz by Removing a Section of the Column Pipe Assembly.
CASE HISTORY 3
Two vertical turbine can-style condensate pumps were undergoingroutine maintenance in a fossil power plant. Upon returning one ofthe pumps to service, high vibrations were being measured at thetop of the motor, while the sister pump, which had not undergonemaintenance, was not experiencing the high vibrations. The pumpshad been in service for over 40 years, but the monitoring of themotor vibrations had only recently begun as part of the plant’soverall maintenance program. The motors were supported by astand that consisted of six vertical angle iron beams that allowedaccess to the coupling from many points around the support. Figure29 shows a picture of the pump.
Figure 29. Vertical Turbine Canned Pump Motor Supported onthe Stand.
PROCEEDINGS OF THE TWENTY-FIFTH INTERNATIONAL PUMP USERS SYMPOSIUM • 200994
Field Vibration Testing
Accelerometer data taken at the top of the motor of therefurbished pump indicated a strong response at 1× running speedas shown in the spectrum in Figure 30. The vibration was nearly 1.1in/s (27.9 mm/s) peak, and a natural frequency at running speedwas the likely source of the high vibration due to the width ofthe peak. The modal tests confirmed that the first above-groundstructural natural frequency was indeed equal to 1× running speedof 1185 rpm (19.75 Hz), and the EMA frequency responsespectrum is shown in Figure 31, indicating a strong resonantcondition. ODS plot at the running speed is shown in Figure 32.The shape of this ODS demonstrated that the motor stand wasconsiderably more flexible than the pump can.
Figure 30. Vibration Spectrum (FFT) Measured at the Top theMotor in the Perpendicular Direction to the Discharge Piping.
Figure 31. Frequency Response Spectrum from EMA Testing Whilethe Pump Was Not Operating Measured at the Top of the Motor inthe Perpendicular Direction to the Discharge Piping.
Figure 32. ODS at 1× RPM of the Pump Showing the First BendingAbove-Ground.
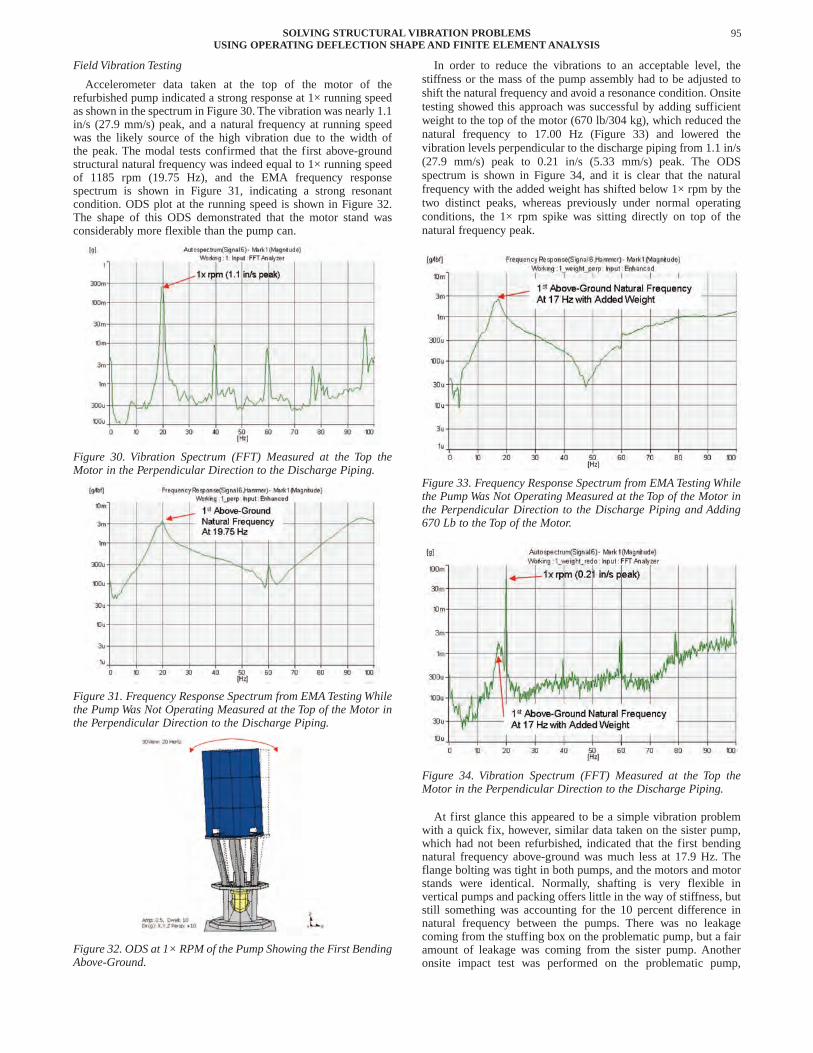
In order to reduce the vibrations to an acceptable level, thestiffness or the mass of the pump assembly had to be adjusted toshift the natural frequency and avoid a resonance condition. Onsitetesting showed this approach was successful by adding sufficientweight to the top of the motor (670 lb/304 kg), which reduced thenatural frequency to 17.00 Hz (Figure 33) and lowered thevibration levels perpendicular to the discharge piping from 1.1 in/s(27.9 mm/s) peak to 0.21 in/s (5.33 mm/s) peak. The ODSspectrum is shown in Figure 34, and it is clear that the naturalfrequency with the added weight has shifted below 1× rpm by thetwo distinct peaks, whereas previously under normal operatingconditions, the 1× rpm spike was sitting directly on top of thenatural frequency peak.
Figure 33. Frequency Response Spectrum from EMA Testing Whilethe Pump Was Not Operating Measured at the Top of the Motor inthe Perpendicular Direction to the Discharge Piping and Adding670 Lb to the Top of the Motor.
Figure 34. Vibration Spectrum (FFT) Measured at the Top theMotor in the Perpendicular Direction to the Discharge Piping.
At first glance this appeared to be a simple vibration problemwith a quick fix, however, similar data taken on the sister pump,which had not been refurbished, indicated that the first bendingnatural frequency above-ground was much less at 17.9 Hz. Theflange bolting was tight in both pumps, and the motors and motorstands were identical. Normally, shafting is very flexible invertical pumps and packing offers little in the way of stiffness, butstill something was accounting for the 10 percent difference innatural frequency between the pumps. There was no leakagecoming from the stuffing box on the problematic pump, but a fairamount of leakage was coming from the sister pump. Anotheronsite impact test was performed on the problematic pump,
95SOLVING STRUCTURAL VIBRATION PROBLEMSUSING OPERATING DEFLECTION SHAPE AND FINITE ELEMENT ANALYSIS

uncoupled from the motor, and surprisingly the natural frequencydropped from 19.75 Hz to 18.4 Hz. Clearly, the shafting andpacking were having an effect on the natural frequency in thesepumps, which is highly unusual. This is not normally seen on morestandard vertical pumps with cylindrical discharge heads withlimited expanse access windows. The natural frequencies of themotor/discharge head are not affected by the shafting with thistype of motor support. Although adding weight reduced thenatural frequency and vibration levels, it was used only as adiagnostic tool and not a permanent solution, so a detailedFEA analysis was conducted to evaluate effective structuralmodifications to resolve the natural frequency issue with a highdegree of confidence for success.
FEA Analysis and Results
The computer solid modeling was done with a commerciallyavailable solids modeler, and the modal FEA was completed usingan integrated finite element code associated with the modeler.Solid models of the motor, supports, portions of the pump can,shaft, and stuffing box were created according to measurementstaken onsite and from discussions with plant personnel. The modalproperties of the pump assembly were matched to the test results atthree conditions—full assembly, with the shaft disconnected, andwith additional weight on top of the motor. This ensured the FEAmodel was accurately representing the pump as installed onsite,so that the analysis could confidently predict the effects of aproposed solution. The solid model of the pump assembly needed to perform the
FEA of the structure is shown in Figure 35. The first step was tomatch the properties of the motor model to common values for areed frequency and center of gravity location. Then the motor wasadded to the discharge head supports and the section of the pumpcan that was above ground so the FEA natural frequency could bechecked without any effects of the shaft and stuffing box. Theresulting natural frequency of 18.4 Hz closely matched the testdata, and the FEA mode shape is shown in Figure 36 (motoruncoupled). Next, the model was run with the shaft and stuffingbox connected to correctly identify the stiffness contribution ofthese parts. The mode shape is shown in Figure 37, and thefrequency of 19.8 Hz matched the test data. After the model wasmatched at these two conditions, the 670 lb (304 kg) plates wereadded to the top of the motor. The resulting FEA frequency was17.2 Hz, matching the field test results, and is shown in Figure 38.These three steps proved that the FEA model was an accuraterepresentation of the pump assembly as installed in the field. Thiswas important so that the effects of any proposed solution could beaccurately quantified.
Figure 35. Solids and FEA Model for the Canned VTP.
Figure 36. FEA Predicted First Above-Ground Bending ModeShape at 18.4 Hz by Uncoupling the Motor (without Shaft Effect).
Figure 37. FEA Predicted First Above-Ground Bending ModeShape at 19.8 Hz by Coupling the Motor (with Shaft and StuffingBox Effect).
Figure 38. FEA Predicted First Above-Ground Bending ModeShape at 17.2 Hz by Adding 670 Lb of Weight on Top of the Motor.
After discussions with the plant, a proposed solution toincrease the stiffness of the discharge head supports (but one thatwould still allow for routine maintenance) was evaluated usingthe FEA model. The solution was to wrap a curved plate aroundthe existing vertical beams with sufficient sized cutouts for accessto the coupling. The additional structural supports were thenmodeled and added to the FEA assembly to determine theresulting natural frequency increase. The FEA model with a ½inch (12.7 mm) wall thickness plate around the motor stand isshown in Figure 39. A modal analysis was completed, and thenatural frequency increased to 26.6 Hz, or 35 percent separationmargin from the running speed, and the resultant mode shape isshown in Figure 40. The analysis was rerun with varying valuesfor the stiffness of the packing within the stuffing box because asthis clearance grows (i.e., packing wears over time) the reducedstiffness will lower the natural frequency closer to running speedand risk resonance. The analysis indicated that the proposedsolution was successful in maintaining a minimum 24.7 percentseparation margin from running speed in either direction, evenwhen the stuffing box is not providing any stiffness to thesystem. This alleviated any concerns that the effectiveness of theadditional supports would decrease as the stuffing box packing
PROCEEDINGS OF THE TWENTY-FIFTH INTERNATIONAL PUMP USERS SYMPOSIUM • 200996

wears. The proposed solution was also evaluated with a wallthickness of ¾ inch (19 mm), and the natural frequency increasedonly an additional 4.2 percent in the worst case scenario of thestuffing box providing no stiffness. A surprising result given the50 percent increase in the thickness of the plate. Therefore, it wasrecommended that the ½ inch (12.7 mm) thick plate be usedbecause of diminishing returns with increased wall thickness.This also underscores the usefulness of the FEA to guide theengineers to a practical cost-effective solution.
Figure 39. FEA Model for the Canned VTP with ½ Inch (12.7 MM)Thick Plate.
Figure 40. FEA Predicted First Above-Ground Bending ModeShape at 26.6 Hz by Welding ½ Inch (12.7 MM) Plate Around theMotor Stand.
Conclusions and Recommendations
• There was a natural frequency of the motor and motor supportstructure on the above-ground structure of the pump at 19.75 Hz inthe direction perpendicular to the discharge piping, which was inresonance with the 1× running speed of the unit.
• When the pump was uncoupled from the pump, impact testingindicated the natural frequency of the pump dropped to 18.25 Hz.This implied that the stuffing box was providing stiffness alongwith the shaft. FEA results also confirmed this behavior.Furthermore, the natural frequency of the sister pump wasdetermined from impact testing to be 17.9 Hz, and was exhibitingmuch more leakage through the stuffing box packing, whichwas an indication that the stuffing box most likely was notproviding the same stiffness as the problematic pump, which wasrecently refurbished.
• Incorporating the additional ½ inch (12.7 mm) thick platearound the motor stand would increase the structural naturalfrequency beyond 15 percent above 1× running speed even if thestiffness due to the packing were to diminish over time.
CASE HISTORY 4
Three newly installed vertically mounted sewage pumps withtwo-vaned impellers were driven by long drive shafts with U-joints.They were experiencing very high pump bearing tower vibrationsat vane pass frequency, nearly over the entire speed range of theunits. The pumps were operating between 1200 rpm (20 Hz) and1800 rpm (30 Hz) via a variable frequency drive (VFD) controlledmotor located on a separate floor above the pumps. The singlecutwater volute pump casings were supported by individualfabricated steel stands that were anchored to the floor at four holddown locations. Figure 41 shows a photo of the pump arrangement.
Figure 41. Sewage Pumps Mounted on Fabricated Stands.
As with the previous case study, field testing of the pumpsconsisted of a combination of impact modal testing as well asoperating forced response testing. Data for each of these tests wereacquired at numerous locations on the motor, motor stand, pump,pump stand, foundation, and piping for all the pumps. Impactmodal testing was used to determine the natural frequencies of themotors, drive shafts, and pump casing/pump stand. The operatingforced response test data were used to produce the operatingdeflection shape of the pumps to help visualize the mode shapes ofthe problematic frequencies.
Field Vibration Testing
Accelerometer data taken at the top of the motors indicatedthat the motors did have natural frequencies around 30 Hz thatwere resulting in elevated 1× running speed vibrations at themaximum speed of 1800 rpm; however, these vibrations wereeasily reduced by simply stiffening the motor support stand. FEAof the motor and stand provided a quick and effective solution tothe motor vibration problems so they will not be discussed. Thefocus of this case study will now turn to the pumps, which wereexperiencing much greater and more complex vibration issues.Since all three pumps were experiencing approximately the samelevels of vibrations, this discussion will only concentrate on oneof the pumps as the solution that was eventually conceived wasapplied to all three. Accelerometer data taken on the pumpbearing tower in the parallel and perpendicular direction aredisplayed in Figures 42 and 43 while the pump was operating atthe maximum speed. The vibration amplitude at the runningspeed (1× rpm) was well within specification; however, thesecond harmonic or vane pass frequency discrete vibration wasexcessive (1.75 in/s [44.5 mm/s] peak and 1.16 in/s [29.5 mm/s]peak) in the parallel and perpendicular directions to the dischargepiping, respectively. From the FFT spectra plots some naturalfrequencies were easily identified at 39.5 Hz, 47.3 Hz, and 50.4Hz. However, there was no clear evidence of a resonancecondition at 2× running speed frequency.
97SOLVING STRUCTURAL VIBRATION PROBLEMSUSING OPERATING DEFLECTION SHAPE AND FINITE ELEMENT ANALYSIS

Figure 42. Vibration Spectrum (FFT) Measured at the Top of theBearing Tower in the Parallel Direction to the Discharge Piping.
Figure 43. Vibration Spectrum (FFT) Measured at the Top of theBearing Tower in the Perpendicular Direction to the Discharge Piping.
In order to determine if there was a natural frequency around 2×running speed, a modal impact test was performed while the pumpswere not operating. The frequency response spectra are shown inFigures 44 and 45. From these plots, the natural frequencies weredetected at 41 Hz and 49.8 Hz similar to those detected from thenatural excitation signature plots. Additional natural frequencieswere also registered at 59.3 Hz, 60.3 Hz, and 61.6 Hz, whichcoincides directly with vane pass frequency at 2× maximumrunning speed. It is important to mention that the lower modes didbecome excited when the pump operated at lower speeds, but thevibration levels were significantly lower.
Figure 44. Frequency Response Spectrum from EMA Testing Whilethe Pump Was Not Operating Measured at the Top of the BearingHousing in the Parallel Direction to the Discharge Piping.
Figure 45. Frequency Response Spectrum from EMA Testing Whilethe Pump Was Not Operating Measured at the Top of the BearingHousing in the Perpendicular Direction to the Discharge Piping.
The mode shapes at these frequencies were determined from theanimations of the ODS models. At 40.0 Hz the entire pumpstructure was rocking side to side perpendicular to the dischargepipe, as shown in Figure 46. The next main structural naturalfrequency was identified at 47.4 Hz, which represents the globalrocking mode in the parallel direction to the discharge pipe asshown in Figure 47. As can be seen, there is a slight drop in bothfrequencies when the pump is operating due to minor changes thatoccur between connecting parts (separation between the pedestaland the foundation or between the pump volute and the pedestal).ODS animation at 2× rpm indicated excessive flexibility at thebearing tower mounting bracket as shown in Figure 48.
Figure 46. ODS at 40 Hz Natural Frequency of the Pump Showingthe Rocking Mode in the Perpendicular Direction.
Figure 47. ODS at 47.4 Hz Natural Frequency of the PumpShowing the Rocking Mode in the Parallel Direction.
PROCEEDINGS OF THE TWENTY-FIFTH INTERNATIONAL PUMP USERS SYMPOSIUM • 200998

Figure 48. ODS at 2× RPM of the Pump Showing the ExcessiveFlexibility at the Bearing Tower Mounting Bracket.
Once the offending natural frequencies of the pump structurewere identified, the next step was to determine a solution to addressnot only the bearing tower mode at approximately 60 Hz, but alsothe two structural rocking modes at 40 Hz and 47.4 Hz that wouldstill become excited at lower speeds in the operating range. At thispoint in time, it was not clear if the 60 Hz mode was simply abearing tower structural mode or a more complex pump shaftlateral mode. Rather than implementing a trial and error method toshift all of these natural frequencies outside the 2× running speedrange, a detailed FEA model of the pump and drive shaft wascreated and calibrated to match these frequencies.
FEA Analysis and Results
The FEA model of the pump assembly including the suction anddischarge piping as well as the drive shaft is shown in Figure 49.Detailed solids models of all the pump components were createdfrom 2D drawings supplied by the pump manufacturer. The pumpcasing density was adjusted to account for the added mass effectdue to the entrapped water in the casing as well as added watermass effects for the impeller. In order to achieve a good correlationof the natural frequencies to the field test data, the pump pedestalhad to be constrained at the bolt holes rather than along the entiremounting frame, indicating that the pump was not properly grouted.
Figure 49. FEA Model for the Pump Assembly with the Suction andDischarge Piping, and the Drive Shaft.
Figure 50 shows the mode shape of the pump predicted at 40 Hzwith the same horizontal rocking motion in the perpendiculardirection to the discharge pipe that was demonstrated by the ODS
animation. Similarly, Figure 51 shows the mode shape of the pumppredicted at 47.8 Hz with the rocking motion in the paralleldirection to the discharge pipe.
Figure 50. FEA Result Showing Horizontal Rocking Mode at 40 Hzin the Perpendicular Direction.
Figure 51. FEA Result Showing Horizontal Rocking Mode at 47.8Hz in the Parallel Direction.
Figures 52 and 53 show plots of the mode shapes at 59 Hz and61 Hz, which clearly represent the pump shaft lateral modes in theperpendicular and parallel direction, respectively. The bearingtower also shows some deflection as captured in the ODS, but themajority of the motion takes place at the impeller.
Figure 52. FEA Result Showing the Rotor Lateral Mode at 59 Hzin the Perpendicular Direction. The Contour Plot on the Left Showsthe Pump Structure without the Shaft Displayed. The BearingTower Moves as Shown in the ODS. The Contour Plot on the RightShows the Pump without the Casing to Help Visualize the ShaftMode Where the Majority of the Motion Is Taking Place.
99SOLVING STRUCTURAL VIBRATION PROBLEMSUSING OPERATING DEFLECTION SHAPE AND FINITE ELEMENT ANALYSIS

Figure 53. FEA Result Showing the Rotor Lateral Mode at 61.1 Hzin the Parallel Direction. The Contour Plot on the Left Shows thePump Structure without the Shaft Displayed. The Bearing TowerMoves as Shown in the ODS. The Contour Plot on the Right Showsthe Pump without the Casing to Help Visualize the Shaft ModeWhere the Majority of the Motion Is Taking Place.
With the FEA model matching the field test data quite accurately,potential fixes were evaluated using the FEA model. While bracescould address the structural rocking modes of the pump assemblyat 40 Hz and 47.4 Hz, the pump shaft lateral modes would not besignificantly affected by these braces and would require changes tothe shafting geometry. The FEA demonstrated that this was thecase. In order to shift the structural natural frequencies beyond 2×rpm excitation source, the lowest natural frequency (40 Hz) shouldbe located at least 10 percent above 60 Hz (maximum 2× rpm),which represents approximately a 65 percent increase in frequency,requiring nearly a threefold increase in stiffness. The mode at 47.4Hz would also be shifted similarly. Since a large increase instiffness was required, this was not going to be obtained by simplestructural modifications to the pump. Therefore, it was decided thatlarge external braces running from the base of the bearing tower tothe concrete foundation would be needed to shift the offendingnatural frequencies higher. In addition, the pump pedestal was alsomodified by adding cross-braces between the accessible legs. Sincethe base of the pedestal structure was not behaving as fully-groutedas intended, it was further recommended that an additional fouranchor bolts be installed midspan between the existing corner holddown bolts and the pedestal be regrouted. Figure 54 shows thesolids model of the proposed bracing modification.
Figure 54. Solids Model of the Pump Assembly Showing theExternal Braces.
In order to address the pump shaft lateral mode at approximately60 Hz, attempts were made to stiffen the bearing tower locally withstruts, but the analysis showed that this was ineffective. It was clear
that to raise the natural frequency of the rotor mode, the shaftdiameter between the bearings would have to be increased. Inaddition, the upper pump bearing was replaced with a bearing thathad a substantial increase in radial stiffness. Considerations werealso given to changing the material of the bearing tower fromcast-iron to steel to gain approximately twice the stiffness, but thetime required to accomplish this made it prohibitive. Based on theanalysis results with these modifications, no structural modeswere obtained below 100 Hz, which is well beyond the maximum2× rpm excitation (60 Hz). Figure 55 shows the FEA results ofthe rotor lateral modes shifting to 65.4 Hz and 69.5 Hz in theperpendicular and parallel directions, respectively. Originally thesefrequencies were computed to be a few percent higher due to thefact that the base of the pedestal was to be fully grouted as wasexpected, and as a result, would be fully constrained, rather thanjust held at the bolt holes only. Unfortunately, after implementingall the modifications, the base of the pedestal was not regrouted, sothe above-mentioned frequency numbers were rerun, and theyrepresent the results of the actual installed case, which did notachieve the full 10 percent separation margin that was sought.Figure 56 shows a photo of the final arrangement of the pump afterimplementing the modifications.
Figure 55. FEA Result after Modifications Showing the RotorLateral Mode at 65.4 Hz and 69.5 Hz in the Perpendicular andParallel Directions, Respectively.
Figure 56. Photo of the Pump Assembly with the Braces.
Follow up test data revealed that the vibration at the runningspeed (measured at the top of the bearing tower) was reduced 2.5times to 0.04 in/s (1.02 mm/s) peak, and at 2× rpm, the vibration
PROCEEDINGS OF THE TWENTY-FIFTH INTERNATIONAL PUMP USERS SYMPOSIUM • 2009100

amplitude was reduced 5.8 times to 0.3 in/s (7.62 mm/s) peak.Figures 57 and 58 show the FFT spectra measured at the top ofthe bearing housing in the perpendicular and parallel direction,respectively. It is clear that the shaft modes shifted up to 64.3 and66.3 Hz very close to the frequencies predicted by the FEAanalysis. Finally, a modal impact test shown in Figure 59 indicatedthat no natural frequencies were within the 2× running speed range,and the rotor mode had moved up to 66.5 Hz. It is important tomention that a pronounced natural frequency was present at 50 Hz,which was later determined to be a discharge pipe modedownstream from the check valve.
Figure 57. Vibration Spectrum (FFT) Measured at the Top of theBearing Tower in the Perpendicular Direction to the DischargePiping after Modifications.
Figure 58. Vibration Spectrum (FFT) Measured at the Top of theBearing Tower in the Parallel Direction to the Discharge Pipingafter Modifications.
Figure 59. Frequency Response Spectrum from EMA Testing afterModifications While the Pump Was Not Operating Measured at theTop of the Bearing Housing in the Parallel Direction to theDischarge Piping.
Conclusions and Recommendations
• There were several natural frequencies of the pump structurethat fell within the 2× running speed range, which were beingexcited by vane pass frequency pressure pulsations. In addition, apump shaft lateral mode coincided with the maximum 2× rpm atapproximately 60 Hz, which resulted in much higher vibrationresponse than the structural resonances.
• The combination of the field testing (ODS and EMA) and theFEA were able to uncover the root cause of the resonance conditionand allowed for virtual fixes to be evaluated with the FEA modelprior to actual installation.
• While the external modifications to the pump support andbearing tower would have shifted the structural natural frequenciesoutside the 2× running speed range, they would not have providedenough stiffness change to affect the pump shaft lateral modes.Only the FEA analysis allowed for shaft geometry changes andbearing stiffnesses to be evaluated, which provided enoughconfidence that the internal geometry changes would achieve thedesired results.
CONCLUSIONS
• The ODS is a powerful troubleshooting tool to facilitate andvisually understand most vibration problems in any type ofturbomachine. Animations created from the ODS test data showexaggerated motion (but consistently scaled) of operatingmachinery at any given frequency. In most of the cases, the ODSanalysis provides enough diagnostic information to identify andsolve the problem. Combined with modal “bump” testing duringoperation, ODS becomes even more powerful.
• Detailed vibration data should be taken when performing anODS, capturing all flange-to-flange interface areas betweenassembly parts, flexible components, supports, concrete foundation,etc., as well as the pump casing itself.
• Testing combined with FEA analysis results is an excellenttoolset, particularly valuable when good engineering judgmentand experience alone have not been successful in diagnosing andfixing vibration problems in centrifugal pumps and other typesof turbomachinery.
• Typical vibration field analysis as applied to pursuing trial anderror correction methods can be time consuming, cumulativelycostly, and will not always achieve the long-term trouble-freeoperation that is sought. The ODS and FEA toolset, when properlyexercised, has an outstanding track record of resulting in rapidproblem diagnosis and solution.
BIBLIOGRAPHY
Adams, M. L., 2001, Rotating Machinery Vibration, New York,New York: Marcel Dekker, Inc.
Au-yang, M. K., 1937, Flow-Induced Vibration of Power andProcess Plant Components: A Practical Workbook, ReprintEdition 2001, New York, New York: ASME Press.
Boyadjis, P. A., 2004, June, “Detecting a Hidden Lateral RotorNatural Frequency in a Sewage Pump,” Pumps and SystemsMagazine, pp. 38-45.
Bowman, D. G., Marscher, W. D., and Reid, S. R., 1990, “PumpRotor Critical Speeds Diagnosis and Solutions,” Proceedingsof the Seventh International Pump Users Symposium,Turbomachinery Laboratory, Texas A&M University, CollegeStation, Texas, pp. 73-80.
Blevins, Robert D., 1979, Formulas for Natural Frequency andMode Shape, Reprint Edition 2001, New York, New York: VanNostrand Reinhold Company, Inc.
101SOLVING STRUCTURAL VIBRATION PROBLEMSUSING OPERATING DEFLECTION SHAPE AND FINITE ELEMENT ANALYSIS

De Silva, C. W., 2000, Vibration: Fundamentals and Practice,Boca Raton, Florida: CRC Press LLC.
Ewins, D. J. 1984, Modal Testing: Theory and Practice, Taunton,Somerset, England: Research Studies Press Ltd.
Jen, C-W. and Marscher, W. D, 1990, “Experimental ModalAnalysis of Turbomachinery Rotors Using Time-Averaging,”Proceedings International Modal Analysis Conference,Orlando, Florida.
McMillan, R. B., 2004, Rotating Machinery: Practical Solutions toUnbalance and Misalignment, Lilburn, Georgia: FairmontPress, Inc.
Lienau, W. and Lagas, N., 2008, “Evaluation of RotordynamicCriteria for Multistage Pump Shafts,” Proceedings of theTwenty-Fourth International Pump Users Symposium,Turbomachinery Laboratory, Texas A&M University, CollegeStation, Texas, pp. 35-44.
Marscher, W. D., 1986, “Determination of Pump Rotor CriticalSpeeds During Operation Through Use of Modal Analysis,”Proceedings of ASME WAM Symposium on TroubleshootingMethods and Technology, Anaheim, California.
Marscher, W. D., 1989, “Analysis and Test of Multistage Pump WetCritical Speeds,” ASLE/ASME Joint Tribology Conference,Ft. Lauderdale, Florida.
Marscher, W. D., 1991, “How to Use Impact Testing to Solve PumpVibration Problems,” Proceedings EPRI Power Plant PumpsSymposium, Tampa, Florida.
Marscher, W. D., 1997, “Rotating Machinery Vibration andCondition Monitoring,” Chapter of Tribology Data Handbook,Boca Raton, Florida: CRC Press, pp. 944-955.
Marscher, W. D., 1999, “The Determination of Rotor CriticalSpeeds While Machinery Remains Operating through Use ofImpact Testing,” IMAC Conference, Orlando, Florida.
Marscher, W. D. and Jen, C-W, 1990, “Using Time-AveragedModal Excitation to Determine the Rotor Dynamic BearingCoefficients of Centrifugal Pumps,” Proceedings 8thInternational Modal Analysis Conference, Kissimmee, Florida.
Marscher, W. D., Boyadjis, P. A, Onari, M. M., Cronin, R. J., Kelly,W. J., Olson, E. J., and Gaydon, M. A., 2008, “CentrifugalPump Mechanical Behavior and Vibration,” Chapter of PumpHandbook, Fourth Edition, I. Karassik, J. Messina, P. Cooper,and C. Heald, Editors, New York, New York: McGraw-Hill.
McConnell, K. G., 1995, Vibration Testing Theory and Practice,New York, New York: John Wiley & Sons, Inc.
Onari, M. M and Gaydon, M. A., 2007, “Solving Vertical PumpSynchronous and Subsynchronous Vibration Problems,” CaseStudies of the Twenty-Third International Pump UsersSymposium, Turbomachinery Laboratory, Texas A&M University.
Onari, M. M. and Hurrell, C. C., 2008, January/February,“Vibration Failure,” Turbomachinery International Magazine,49, (1), pp. 40-42.
Olson, E. J. and Onari, M. M., 2008, “Solving Structural VibrationProblems Using Operating Deflection Shape (ODS) Analysis,”Case Studies of the Thirty-Seventh Turbomachinery Symposium,Turbomachinery Laboratory, Texas A&M University.
Stavale, A. E., 2008, “Reducing Reliability Incidents andImproving Meantime Between Repair,” Proceedings of theTwenty-Fourth International Pump Users Symposium,Turbomachinery Laboratory, Texas A&M University, CollegeStation, Texas, pp. 1-10.
Thomson, W. T. and Dahleh, M. D., 1993, Theory of Vibration withApplications, Fifth Edition, Upper Saddle River, New Jersey:Prentice-Hall, Inc.
PROCEEDINGS OF THE TWENTY-FIFTH INTERNATIONAL PUMP USERS SYMPOSIUM • 2009102