solving real-life problems 3.4
TRANSCRIPT
126 Chapter 3 Writing Linear Equations and Linear Systems
Solving Real-Life Problems3.4
How can you use a linear
equation in two variables to model and solve a real-life problem?
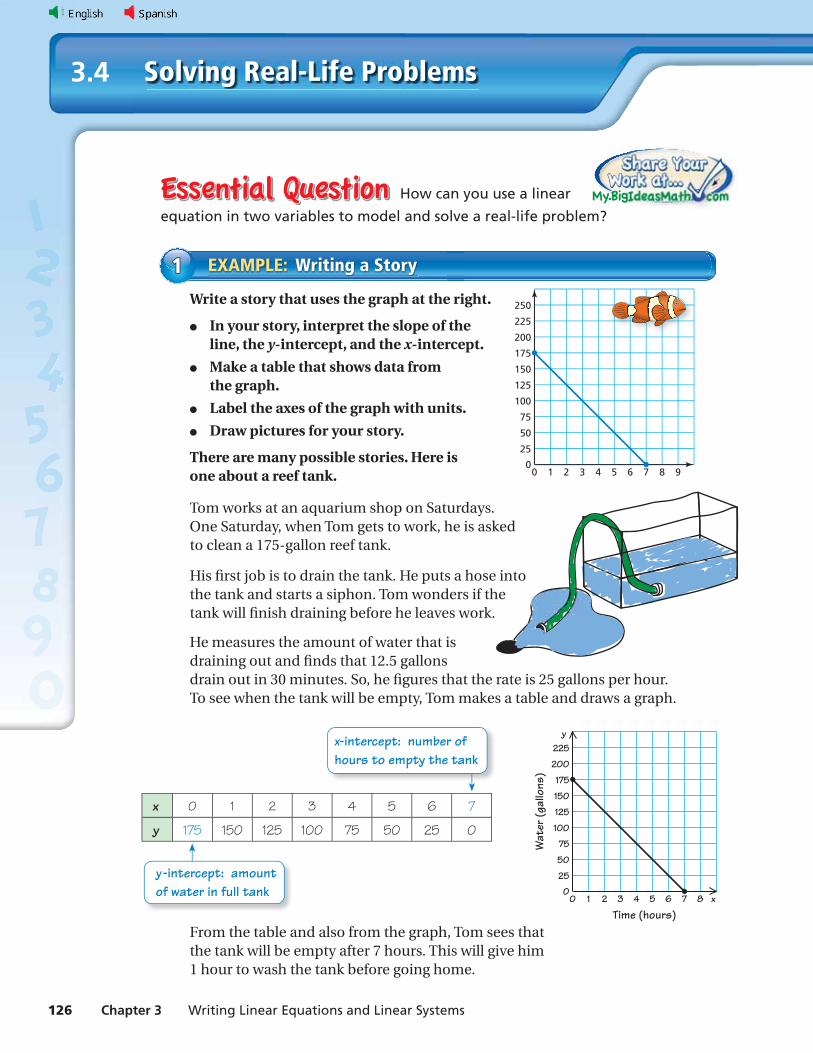
Write a story that uses the graph at the right.
● In your story, interpret the slope of the line, the y-intercept, and the x-intercept.
● Make a table that shows data from the graph.
● Label the axes of the graph with units.
● Draw pictures for your story.
There are many possible stories. Here is one about a reef tank.
Tom works at an aquarium shop on Saturdays. One Saturday, when Tom gets to work, he is asked to clean a 175-gallon reef tank.
His fi rst job is to drain the tank. He puts a hose into the tank and starts a siphon. Tom wonders if the tank will fi nish draining before he leaves work.
He measures the amount of water that is draining out and fi nds that 12.5 gallons drain out in 30 minutes. So, he fi gures that the rate is 25 gallons per hour. To see when the tank will be empty, Tom makes a table and draws a graph.
From the table and also from the graph, Tom sees that the tank will be empty after 7 hours. This will give him 1 hour to wash the tank before going home.
EXAMPLE: Writing a Story11
x 0 1 2 3 4 5 6 7
y 175 150 125 100 75 50 25 0
x-intercept: number of hours to empty the tank
y -intercept: amount of water in full tank
2 4 60 1 3 5 7 8 9
25
50
75
100
125
150
175
200
225
250
0
2 4 60 1 3 5 7 8 x
25
50
75
100
125
150
175
200
225
0
Time (hours)
Wat
er (g
allo
ns)
y
Section 3.4 Solving Real-Life Problems 127
Work with a partner. Write a story that uses the graph of a line.
● In your story, interpret the slope of the line, the y-intercept, and the x-intercept.
● Make a table that shows data from the graph.
● Label the axes of the graph with units.
● Draw pictures for your story.
ACTIVITY: Writing a Story22
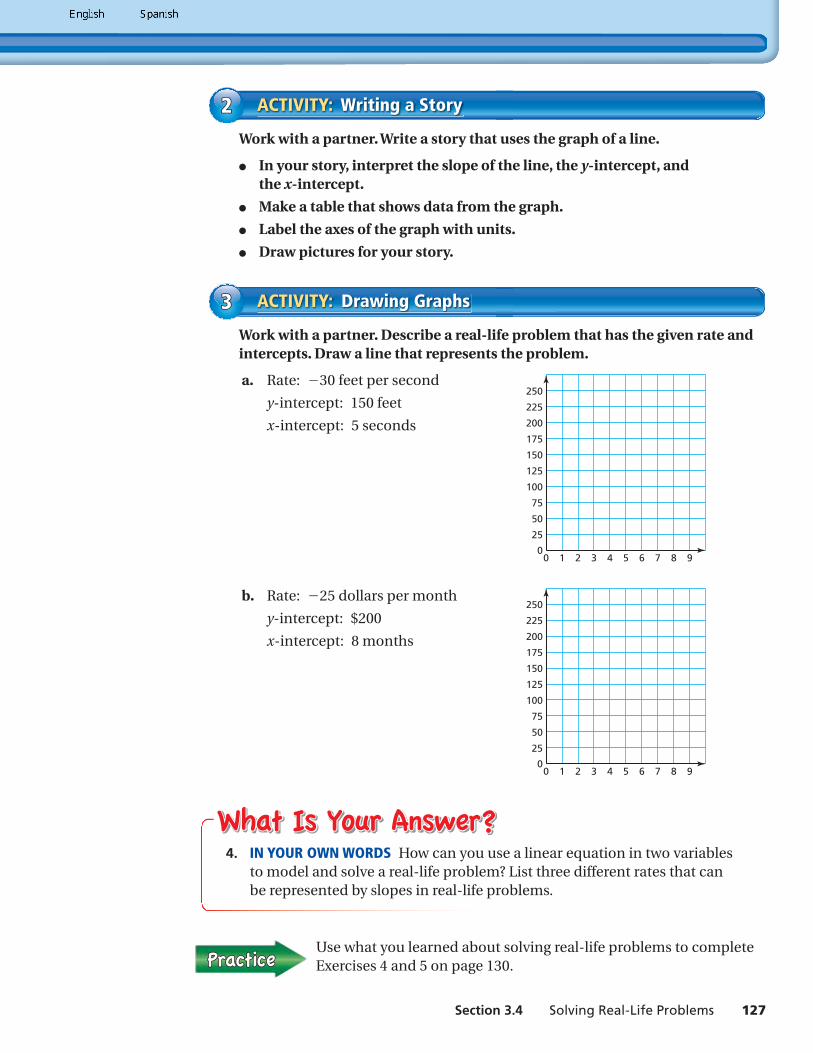
Work with a partner. Describe a real-life problem that has the given rate and intercepts. Draw a line that represents the problem.
a. Rate: −30 feet per second
2 4 60 1 3 5 7 8 9
25
50
75
100
125
150
175
200
225
250
0
y-intercept: 150 feet
x-intercept: 5 seconds
b. Rate: −25 dollars per month
2 4 60 1 3 5 7 8 9
25
50
75
100
125
150
175
200
225
250
0
y-intercept: $200
x-intercept: 8 months
ACTIVITY: Drawing Graphs33
Use what you learned about solving real-life problems to complete Exercises 4 and 5 on page 130.
4. IN YOUR OWN WORDS How can you use a linear equation in two variables to model and solve a real-life problem? List three different rates that can be represented by slopes in real-life problems.
75% Remaining
128 Chapter 3 Writing Linear Equations and Linear Systems
Lesson3.4Lesson Tutorials
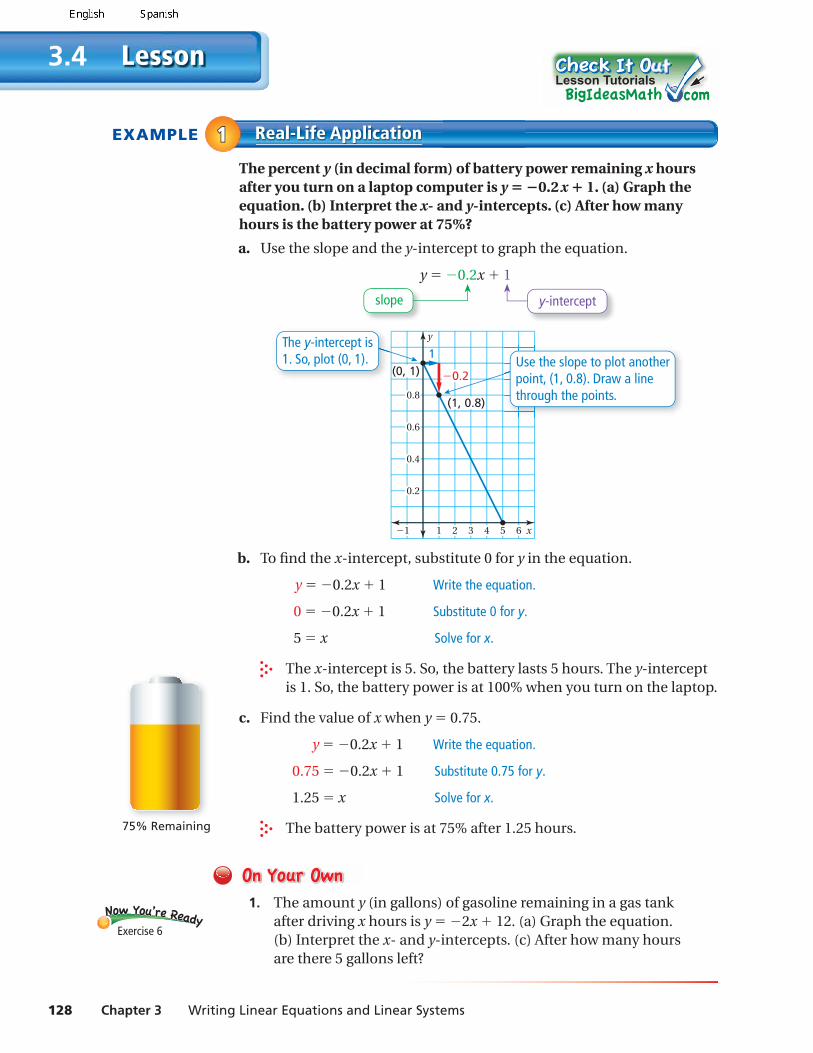
EXAMPLE Real-Life Application11The percent y (in decimal form) of battery power remaining x hours after you turn on a laptop computer is y = −0.2 x + 1. (a) Graph the equation. (b) Interpret the x- and y-intercepts. (c) After how many hours is the battery power at 75%?
a. Use the slope and the y-intercept to graph the equation.
y = −0.2x + 1
x
y
−1
0.2
0.4
0.6
0.8(1, 0.8)
(0, 1)Use the slope to plot anotherpoint, (1, 0.8). Draw a linethrough the points.
1 2 3 4 5 6
The y-intercept is1. So, plot (0, 1). 1
−0.2
b. To fi nd the x-intercept, substitute 0 for y in the equation.
y = −0.2x + 1 Write the equation.
0 = −0.2x + 1 Substitute 0 for y.
5 = x Solve for x.
The x-intercept is 5. So, the battery lasts 5 hours. The y-intercept is 1. So, the battery power is at 100% when you turn on the laptop.
c. Find the value of x when y = 0.75.
y = −0.2x + 1 Write the equation.
0.75 = −0.2x + 1 Substitute 0.75 for y.
1.25 = x Solve for x.
The battery power is at 75% after 1.25 hours.
1. The amount y (in gallons) of gasoline remaining in a gas tank after driving x hours is y = −2x + 12. (a) Graph the equation. (b) Interpret the x- and y-intercepts. (c) After how many hours are there 5 gallons left?
slope y-intercept
Exercise 6
Section 3.4 Solving Real-Life Problems 129
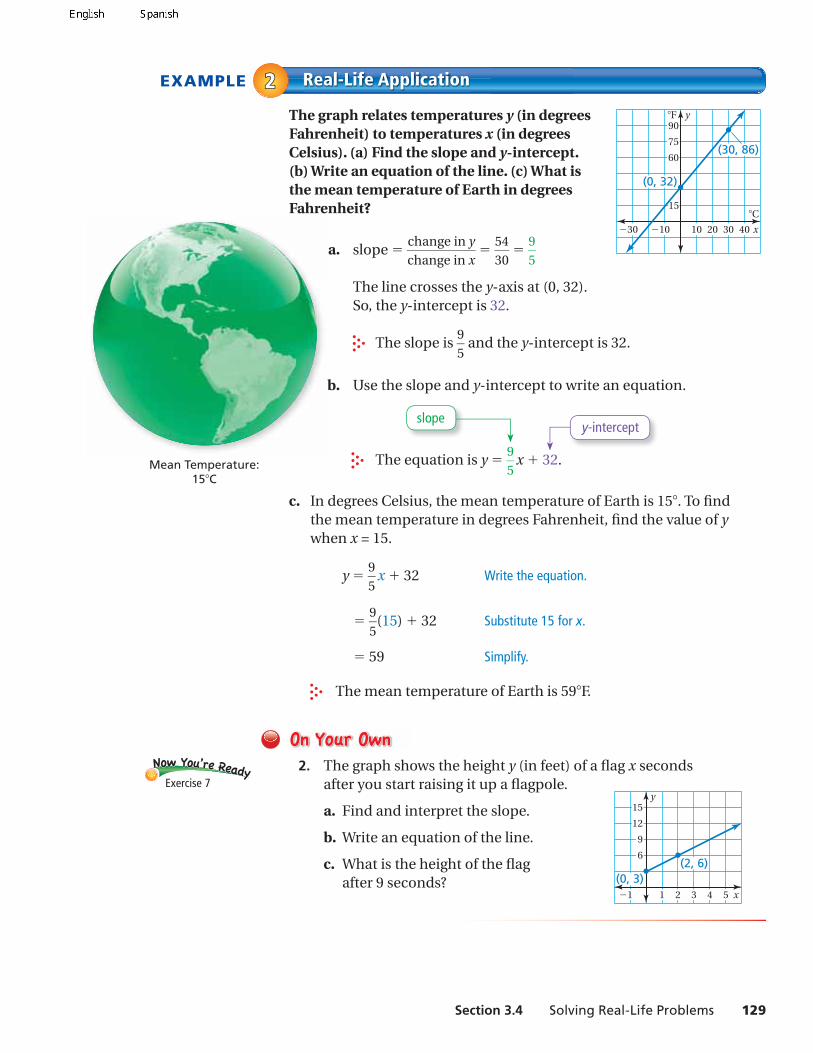
EXAMPLE Real-Life Application22The graph relates temperatures y (in degrees Fahrenheit) to temperatures x (in degrees Celsius). (a) Find the slope and y-intercept. (b) Write an equation of the line. (c) What is the mean temperature of Earth in degrees Fahrenheit?
a. slope = change in y
— change in x
= 54
— 30
= 9
— 5
The line crosses the y-axis at (0, 32). So, the y-intercept is 32.
The slope is 9
— 5
and the y-intercept is 32.
b. Use the slope and y-intercept to write an equation.
The equation is y = 9
— 5
x + 32.
c. In degrees Celsius, the mean temperature of Earth is 15°. To fi nd the mean temperature in degrees Fahrenheit, fi nd the value of y when x = 15.
y = 9
— 5
x + 32 Write the equation.
= 9
— 5
(15) + 32 Substitute 15 for x.
= 59 Simplify.
The mean temperature of Earth is 59°F.
2. The graph shows the height y (in feet) of a fl ag x seconds after you start raising it up a fl agpole.
a. Find and interpret the slope.
b. Write an equation of the line.
c. What is the height of the fl ag after 9 seconds?
slopey-intercept
Exercise 7
30 4010 20 x
°C
y°F
−10−30
15
60
75
90
(0, 32)
(30, 86)
2 3 4 51 x
y
−1
6
9
12
15
(2, 6)(0, 3)
Mean Temperature:15 C
Exercises3.4
9+(-6)=3
3+(-3)=
4+(-9)=
9+(-1)=
130 Chapter 3 Writing Linear Equations and Linear Systems
1. REASONING Explain how to fi nd the slope, y-intercept, and x-intercept of the line shown.
2. OPEN-ENDED Describe a real-life situation that uses a negative slope.
3. REASONING In a real-life situation, what does the slope of a line represent?
Describe a real-life problem that has the given rate and intercepts. Draw a line that represents the problem.
4. Rate: −1.6 gallons per hour 5. Rate: −45 pesos per week
y-intercept: 16 gallons y-intercept: 180 pesos
x-intercept: 10 hours x-intercept: 4 weeks
6. DOWNLOAD You are downloading a song. The percent y (in decimal form) of megabytes remaining to download after x seconds is y = −0.1x + 1.
a. Graph the equation.
b. Interpret the x- and y-intercepts.
c. After how many seconds is the download 50% complete?
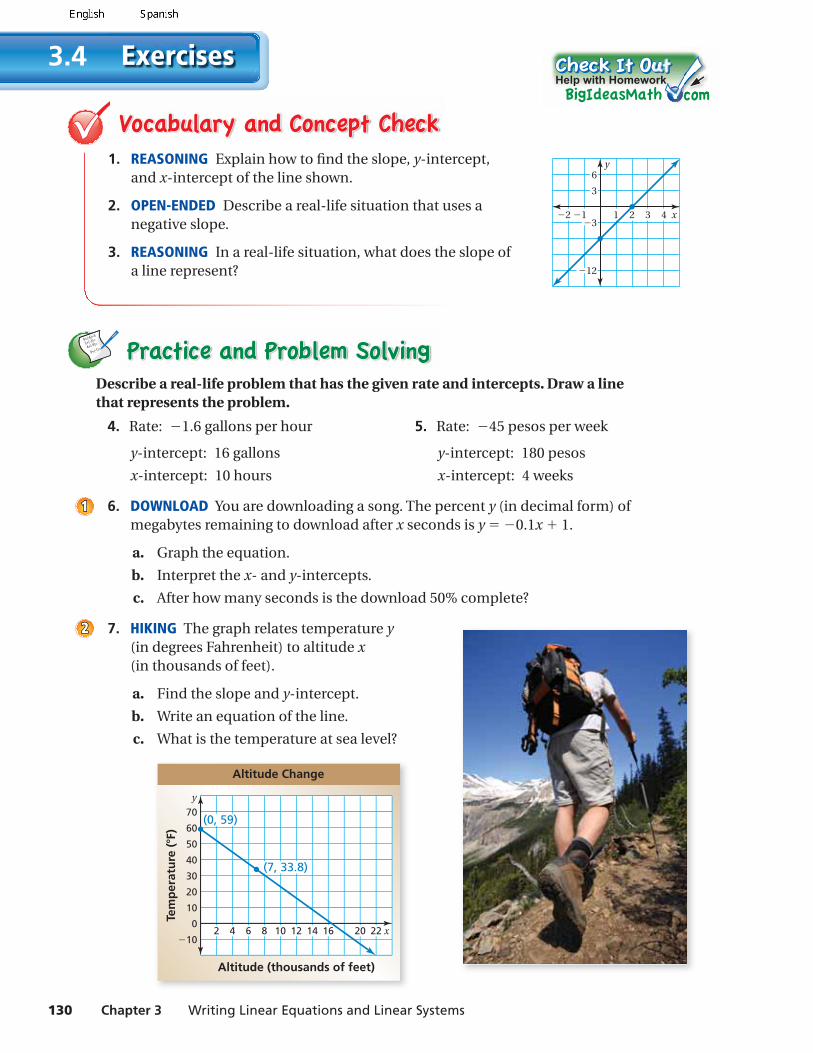
7. HIKING The graph relates temperature y (in degrees Fahrenheit) to altitude x (in thousands of feet).
a. Find the slope and y-intercept.
b. Write an equation of the line.
c. What is the temperature at sea level?
Help with Homework
11
22
4 8 122 6 10 14 16 20 22 x
20
40
60
70
0
10
30
50
−10
Altitude (thousands of feet)
Altitude Change
Tem
per
atu
re (
°F)
y
(0, 59)
(7, 33.8)
2 3 41 x
y
−1−2
6
3
−12
−3
Section 3.4 Solving Real-Life Problems 131
Tell whether the system has one solution, no solution, or infi nitely many solutions. (Section 2.5 and Section 2.6)
11. y = −x + 6 12. y = 3x − 2 13. −9x + 3y = 12
−4(x + y) = −24 −x + 2y = 11 y = 3x − 2
14. MULTIPLE CHOICE Which equation is the slope-intercept form of 24x − 8y = 56?(Section 2.3)
○A y = −3x + 7 ○B y = 3x − 7 ○C y = −3x − 7 ○D y = 3x + 7
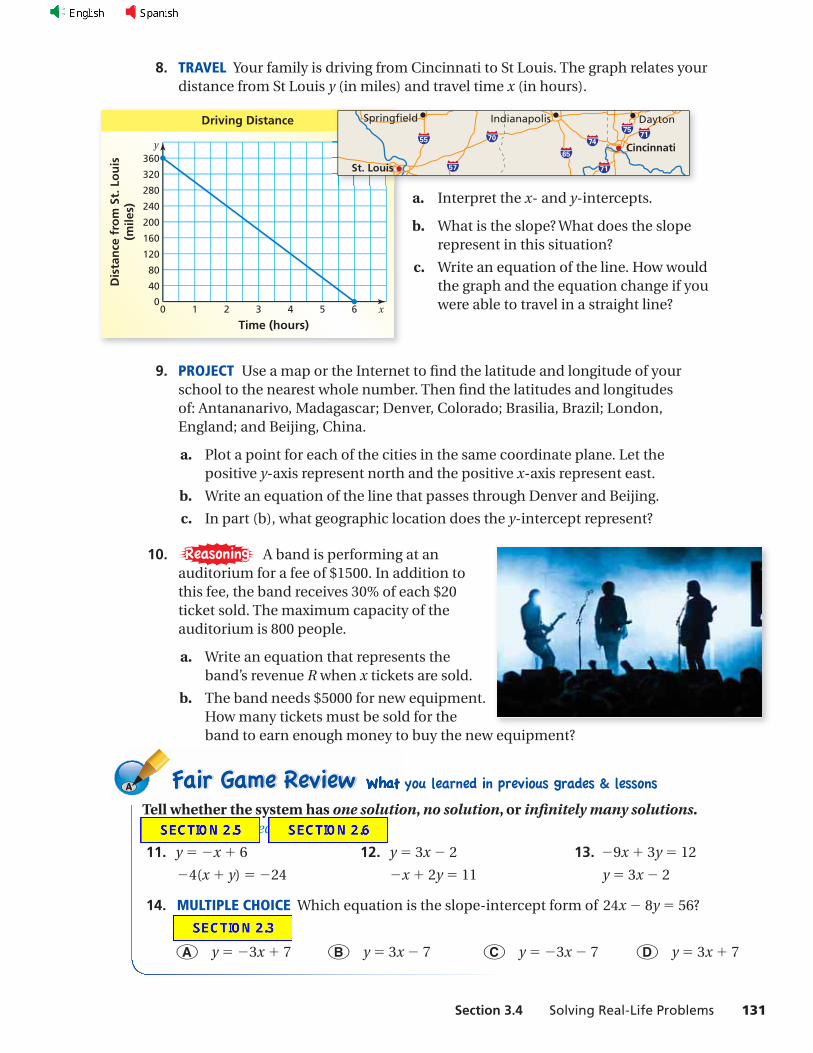
8. TRAVEL Your family is driving from Cincinnati to St Louis. The graph relates your distance from St Louis y (in miles) and travel time x (in hours).
a. Interpret the x- and y-intercepts.
b. What is the slope? What does the slope represent in this situation?
c. Write an equation of the line. How would the graph and the equation change if you were able to travel in a straight line?
9. PROJECT Use a map or the Internet to fi nd the latitude and longitude of your school to the nearest whole number. Then fi nd the latitudes and longitudes of: Antananarivo, Madagascar; Denver, Colorado; Brasilia, Brazil; London, England; and Beijing, China.
a. Plot a point for each of the cities in the same coordinate plane. Let the positive y-axis represent north and the positive x-axis represent east.
b. Write an equation of the line that passes through Denver and Beijing.
c. In part (b), what geographic location does the y-intercept represent?
10. A band is performing at an auditorium for a fee of $1500. In addition to this fee, the band receives 30% of each $20 ticket sold. The maximum capacity of the auditorium is 800 people.
a. Write an equation that represents the band’s revenue R when x tickets are sold.
b. The band needs $5000 for new equipment. How many tickets must be sold for the band to earn enough money to buy the new equipment?
1 2 30 4 5 6 x
40
80
120
160
200
240
280
320
360
0
Time (hours)
Dis
tan
ce f
rom
St.
Lo
uis
(mile
s)y
Driving Distance
Cincinnati
Indianapolis DaytonSpringfield
St. Louis
74
7571
71
70
65
57
55