solute transport in porous media with sorption-site heterogeneity
TRANSCRIPT
Environ. Sci. Technol. 1995, 29, 2725-2734
Solute Transpott in Porous Media with Sorption-Site Heterogeneity W E N L I N C H E N ' A N D R O B E R T J . W A G E N E T * Department of Soil, Crop, and Atmospheric Sciences, Cornell University, Ithaca, New York 14853
A model for describing solute nonequilibrium transport influ en ced by so rption-site heterogeneity in porous media was proposed and analyzed in terms of its time moments. The sorption-site heterogeneity was conceptualized as variable sorbing fractions/ compartments that are grouped into classes according to a probability density function (pdf) for both equi- librium (linear partitioning, KD) and rate (first-order sorption time, &) parameters. Two typical pdfs, a simple two-site (TS) and a general y site (GS), were employed for comparison. The correlation between KD and T, was considered in two extreme cases: perfectly correlated as the linear free-energy relationship (LFER, linear log & - log KO) holds or completely independent. As the LFER holds, the impact of sorption rate statistics presents on all moments (except the zeroth) of a solute breakthrough curve (btc), resulting in simultaneous enhanced peakedness and long time scale tailing on the btc. When KD and T, are uncor- related, equivalency between the simple TS and the more general GS models can be established up to the third btc moment. However, higher moments im- mediately become highly sensitive to the rate sorption statistics, rendering a substantial deviation between TS and GS in the description of the long time scale behavior. The model deviation can be enhanced in the existence of the LFER since the ultimate equivalence of the btc moments in this case can only be achieved up to the second. It is indicative in either case, therefore, that when sorption heterogeneity exists, simple distributions such as TS is inherently not sufficient to represent a more generally distributed sorption process (e.!., GS), which can even become more stringent as the time scale increases.
Introduction The movement of contaminants in natural porous media (soilslaquifers), subject to rate limitation of mass transfer between the mobile fluid and the regions of immobilization
* Corresponding author e-mail address: [email protected]. t Present address: AgrEvo Research Center, 703 NOR-AM Rd., P.O.
Box 538, Pikeville, NC 27863.
(sorbing solid phases and/or stagnant fluid in intra- aggregate/ particle pores), is increasingly the focus of research. Conventional approaches to deal with the rate- limited transport problem often assume that natural porous media are homogeneous or can be represented as an equivalent homogeneous medium so that every rate- limiting process can be described in a deterministic manner. However, it is evident that th is assumption is not always valid. First, physicallchemical properties of a soillaquifer material can vary at scales ranging from microscopic solid grainslinterstitial pores to macroscopic fieldslwatersheds ( 1 ) . Second, althoughan equivalent homogeneous medium can sometimes be defined as, for example, uniform spheres having a single radius averaged over a bulk sample (21, the impact of variations in the sorbent microscopic charac- teristics (e.g., sorbent structure and composition) on the rate-limiting process and transport can be significant, especially at both ends of the time scales experienced (early and prolonged stages) (3, 4).
Heterogeneity at large scales (field and regional) has been investigated by correlating the equilibrium or rate sorption properties with the random hydraulic conductivity field. Jury (5) used a stochastic convective approach to investigate the influence of linear equilibrium sorption on transport by correlating the partition coefficient with the random velocity field. A similar approach was used by van der Zee and van Riemsdijk (a, who assumed sorption to be a nonlinear equilibrium process. More recently, this approach was further extended to rate-limiting cases ( 7 ) . Although the equilibrium or rate parameters in these large- scale studies were correlated with the spatially variable hydraulic conductivity field, heterogeneity deriving from variable sorbent microscopic structure and composition was not considered.
Heterogeneityat the sorbent grain scale has been amajor topic in most laboratory batch and column studies, pri- marily motivated by the observation that the entire con- centration-time profile (sorptionldesorption or break- through curves, btc) cannot be sufficiently described by a model assuming a single uniform equilibrium or rate pro- cess (one site/compartment). A simple heterogeneous sorption model, the two-site approach, was subsequently proposed and found to be in better agreement with ex- perimental observations (8-10). In this approach, two distinct sorbing fractions, equilibrium (instantaneous) and rate-limiting (time-dependent), were assumed to coexist in the soillaquifer material. While the instantaneous frac- tion commonly has been assumed to represent the equi- librium sorption onto the sorbing solid, quite different mechanisms have been proposed for the time-dependent fraction. Early versions of t h i s approach represented time- dependent sorption as first-order kinetics ( 1 11, The physical significance ofthe first-order kinetics assumption was ques- tioned later by Wu and Gschwend (12), who proposed that the time-dependent process was controlled by pore dif- fusion (intrasorbent) within microporous particles retarded instantaneously by pore-wall sorption. The assumption of retarded intrasorbent diffusion was applied by Ball and Roberts (13) to the time-dependent fraction. An alternative description of the time-dependent fraction invoking the
0013-936X/95/0929-2725$09.00/0 0 1995 American Chemical Society VOL. 29, NO. 11. 1995 / ENVIRONMENTAL SCIENCE & TECHNOLOGY 12725
/
Pore water (e)
H
K
Flow
P S O
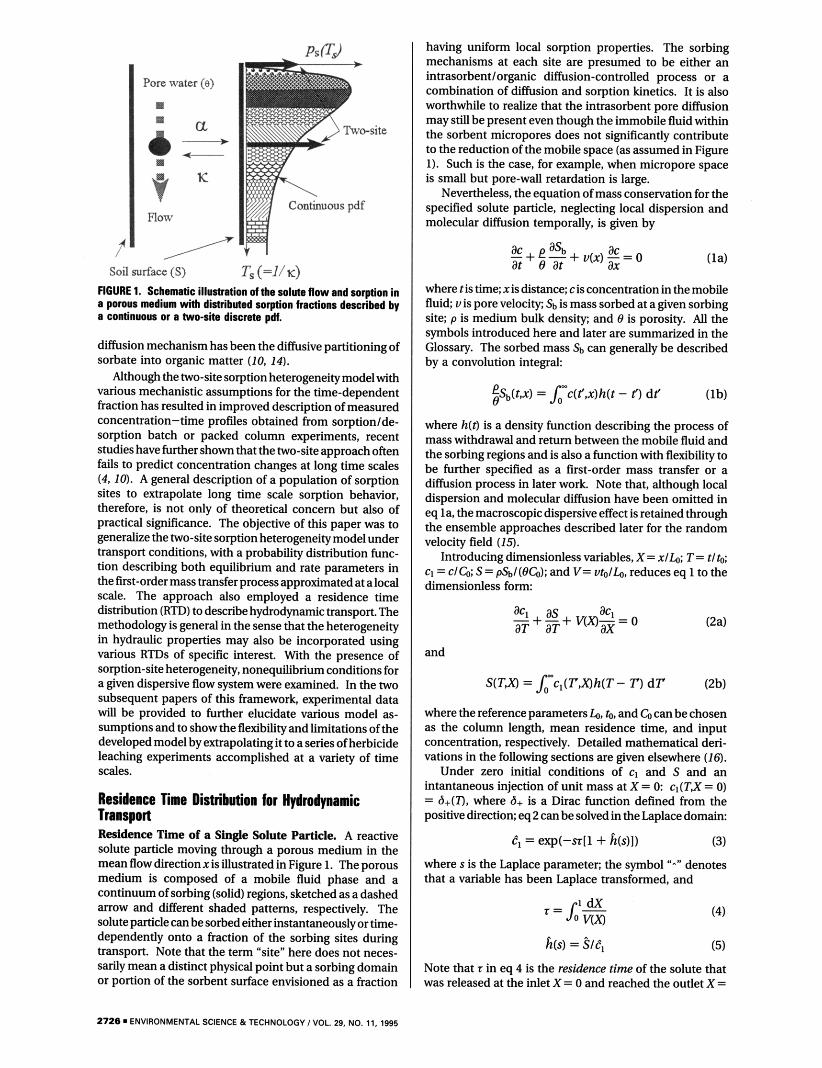
Soil surface (S) Ts (=I/K) FIGURE 1. Schematic illusuatiom d tLn solute flow and sorption in a porou8 medium witl, distributed sorpion hadions described br a continuous or a two-site discrete pdf.
diffusion mechanism has been the diffusive partitioning of sorbate into organic matter (IO, 14).
Althoughthetwo-sitesorption heterogeneity model with various mechanistic assumptions for the time-dependent fraction has resulted in improved description of measured concentration-time profiles obtained from sorption/de- sorption batch or packed column experiments. recent studies have furthershown that thetwo-siteapproachoften fails to predict concentration changes at long time scales (4. IO). A general description of a population of sorption sites to extrapolate long time scale sorption behavior, therefore. is not only of theoretical concern but also of practical significance. The objective of this paper was to generalize the two-sitesorption heterogeneity model under transport conditions. with a probability distribution func- tion describing both equilibrium and rate parameters in the first-order massa;lnsferprocessapproldmated atalocal scale. The approach also employed a residence time distribution (RTD) to describe hydrodynamic transport. The methodology is general in the sense that the heterogeneity in hydraulic properties may also be incorporated using various RTDs of specific interest. With the presence of sorption-site heterogeneity. nonequilibrium conditions for a given dispersive flow system were examined. In the two subsequent papers of this framework. experimental data will be provided to further elucidate various model as- sumptions and to show the flexibility and limitations of the developed model by exuapolatingit toaseriesofherbicide leaching experiments accomplished at a variety of time scales.
Residence lime bistributioa for Hfllndpamic Transport Residence Time of a Single Solute Particle. A reactive solute particle moving through a porous medium in the meanflowdirectionxisillustrated in Figure 1. The porous medium is composed of a mobile fluid phase and a continuum of sorbing (solid) regions, sketched as a dashed arrow and different shaded patterns, respectively. The solute particlecan besorbed either instantaneouslyortime- dependently onto a fraction of the sorbing sites during transport. Note that the term “site” here does not neces- sarily mean a distinct physical point but a sorbing domain or portion of the sorbent surface envisioned as a fraction
having uniform local sorption properties. The sorbing mechanisms at each site are presumed to be either an intrasorbent/organic diffusion-controlled process or a combination of diffusion and sorption kinetics. It is also worthwhile to realize that the intrasorbent pore diffusion may still be present even though the immobile fluid within the sorbent micropores does not significantly contribute to the reduction of the mobile space (as assumed in Figure 1). Such is the case, for example, when micropore space is small but pore-wall retardation is large.
Nevertheless, the equation of mass conservation for the specified solute particle, neglecting local dispersion and molecular diffusion temporally, is given by
(la) ac pa% ac at e at ax -+ - + u ( x ) - = o
where cis time: x is distance; cis concentration in the mobile fluid u is pore velocity; sb is mass sorbed at a given sorbing site: p is medium bulk density; and 0 is porosity. All the symbols introduced here and later are summarized in the Glossary. The sorbed mass s b can generally be described by a convolution integral:
where h(t) is a density function describing the process of mass withdrawal and return between the mobile fluid and the sorbing regions and is also a function with flexibility to be further specified as a first-order mass transfer or a diffusion process in later work. Note that, although local dispersion and molecular diffusion have been omitted in eq la, the macroscopic dispersive effect is retained through the ensemble approaches described later for the random velocity field (13.
Introducing dimensionless variables, X= x / b ; T= t /& CI = c/G; S = psb/(eG); and V = vfolb, reduces eq 1 to the dimensionless form:
as -+ -+ v(x)-= 0 aT aT ax and
S(TX) = f i , ( T X ) h ( T - r) dT (2b)
wherethereference p a e t e r s b , h,andGcanbechosen as the column length, mean residence time, and input concentration, respectively. Detailed mathematical deri- vations in the following sections are given elsewhere (16).
Under zero initial conditions of c, and S and an intantaneous injection of unit mass at X = 0 cl(TJ = 0) = d+(n, where d+ is a Dirac function defined from the positivedirection;eq2canbesolvedintheLaplacedomain:
(3)
where s is the Laplace parameter: the symbol “1” denotes that a variable has been Laplace transformed, and
tl = exp(-st[l + h(s)l)
I d X “.LE (4)
h(s) = 516, (5)
Note that r in eq 4 is the residence time of the solute that was released at the inlet X = 0 and reached the outlet X =
2726. ENVIRONMENTAL SCIENCE 8 TECHNOLOGY I VOL. 23. NO. 11.1995
1 with microscopic pore velocity Vunder no influence of any rate-limiting processes. The pore velocity V may be envisioned here, in the microscopic point ofview, as a mean projection of the three-dimensionally oriented velocity along the particle trajectory onto the Xcoordinate (71. h(s) in eq 5 is also called the transferfunction for the rate- limiting processes ( 1 7 ) . Detailed forms of h(s) will be discussed and specified in later sections.
Statistical Ensemble Approach. Consider now a large number of solute particles that are uniformly and simul- taneously applied to the inlet surface at X = 0. Due to the geometric irregularity of the pores composing the mobile phase, the microscopic velocitywith which each individual solute particle travels is variable. The velocity for a given solute particle may also change in a random manner during the trip from inlet to outlet due to the lateral shifting among different velocities on the plane normal to the mean flow direction X. As a result, the residence time of each solute in the porous medium, defined in eq 4, becomes a random variable. An extensive discussion of the residence time (or equivalently velocity) statistics and its mechanistic impli- cations are not a subject of the current work, but are given by Beran (18). Here, we simply adopt the asymptotic behavior of the solute transport in the porous medium based on the central limit theorem. That is, all solute transport in the porous medium will eventually approach a Gaussian distribution in space whenever the transport scale is much longer than that of the velocity correlation length (18). With this condition, the probability density function ( p a for the residence time t is inverse Gaussian ( 1 5 ) ; a pdf for positive-valued variates (19):
where 6, is the coefficient of variation (0 of the residence time, t, and p,(t; X = 1) d t is the probability for a particle to have residence time between z and d t before exiting the system at X = 1. Note that the mean residence time in dimensionless form is always unit.
By knowing the RTD, p,(t; X), the expected output concentration can be calculated through eq3 in the Laplace domain:
where denotes the ensemble mean of CI in the Laplace domain. By substituting eqs 3 and 6 into eq 7, the final result is
Note that the inverse transform of eq 8 provides an expected concentration output across the exit plane at X = 1 under the corresponding Dirac (impulse) input boundary condi- tions in a porous system, which is an equivalent btc in column studies. In particular, it can be shown that the relationship between the CV (eT) and the column Peclet number (PI is P = 2/€,2, rendering the inverse Gaussian RTD approach identical to the conventional convection- dispersion equation (15,167. The inverse Laplace transform in this workwas all performed numericallywith the Fortran
codes provided by Jury and Roth (20). The program is available upon request from the authors.
Distributed Rate-Limiting Process In the previous section, a convolution integral (eq 2b) was used to represent a general rate-limiting process, and the corresponding transfer function, hb), remained undeter- mined. Realizing that mechanisms governing rate-limiting can be diffusive (retarded intrasorbentIintra-organic) or a combination of diffusive and kinetic for polarlweakly polar compounds, we here adopt the commonly used first-order mass transfer approximation at the local scale (a single sorption siteIregion). This simplifies the complications of sorbent geometric specification required in the diffusion formulation. The rate coefficient in the first-order formu- lation, therefore, inherently lumps all the local geometric influence as if a diffusive'mechanism prevails (21). The first-order equation is written as
where Kis the dimensionless rate coefficient, defined as K = K ~ O , K is the rate coefficient; and KD is the dimensionless linear partition coefficient between fluid and solid at sorption equilibrium, defined as KD = &pIO. Taking the Laplace transform of eq 9 gives
(10)
where T, = 1 IKis the dimensionless sorption characteristic time. Defining T, as a reciprocal of K has the advantages of converting the large magnitudes of K to small values, giving a convenient representation of instantaneous reac- tions (i.e., Kat infinity corresponds to T, = 0). It should be noted that, although the transfer function (eq 10) of the rate-limiting process is derived from the local concentration cl, it remains the same at the ensemble concentration level (Le., eq 8) since the rate-limiting process is not treated as correlated to the random velocity field.
While soillaquifer materials may be considered chemi- cally homogeneous on the basis of conventional macro- scopic properties, it is also true that heterogeneity in soil physical and chemical properties that are related to rate- limitingprocesses are variable at almost every microscopic scale (22). When intrasorbent/organic diffusion dominates as the rate-limiting process, any variations in the sorbent microgeometry (size and shape) can have a crucial impact on the sorption process over a wide range of time scales. Variations in sorbing components, the organic matter distribution among various particle-size fractions, and even the variations within the soil aggregatedaquifer grains of the same size fraction may cause considerable fluctuations of the local rate process as the sorbate diffuses through the microporeslorganic matrices and/or sorbs onto the mi- cropore walls. In the proposed first-order approach, these variations are lumped into the two parameters: equilibrium partitioning coefficient (KD) and sorption time constant (Ts). It is reasonable, therefore, to treat both KD and T, as randomly distributed variables. As a result, the transfer function of eq 10 is evaluated by taking a mathematical expectation as follows:
VOL. 29, NO. 11,1995 /ENVIRONMENTAL SCIENCE &TECHNOLOGY 2727
where H(s) is the mean transfer function for the distributed first-order mass transfer; and pks is the joint pdffor KD and
Since a linear correlation (linear free-energy relationship, LFER) is often found between the two log-transformed parameters, In KO and In K (231, the LFER in terms of Ts on linear scale is then likely
Ts
(12)
where a and b are two positive constants (because In KD and In K are often negatively correlated). Interestingly, two extreme cases of correlation are represented by eq 12 as b takes zero or nonzero values. That is, if b = 0, a completely independent relationship exists between KD and 7', (in this case KD = a, and a is then distributed as pk); whereas, any non-zero value of b gives a perfect correlation between KD and T, (Le., given the value of T,, KD is completely determined by eq 12). Perfect correlation would simplify the bivariate pdf (pk,) to univariate (I, 24) and reduce eq 11 to a single integral. The resulting univariate pdf can be represented either by the pdf of KD (pk) or by the pdf of T, (p , ) , In the case b = 0, however, the bivariate pdf pks simply becomes equal to the product of the two marginal pdfs of KD and T,, denoted also as f i and p, , respectively. In this case, the first integral on KD in eq 11 would simply be equal to the mean of KD, thus rendering it identical to the assumption that KD is constant at all sorption sites. In either case, therefore, eq 11 is reduced to
b KD = UT,
(13)
where ps is the pdf of Ts (or marginal pdf of Ts when b = 0) *
Discrete pdf. SoUaquifer materials are ofen assumed to consist of m different sized and shaped sorbent particle classes or of a number of sorbing components. In the lumped first-order approximation, we envision this as m distinct classes of sorption sites. The pdf of Ts (p , ) is then discrete and is written as
1 m
(14)
wherefi is the probability of a solute molecule being sorbed onto site i with characteristic time T,i; and 6+ (5) is a Dirac function of 5, as defined before. Substituting eq 14 into eq 13 gives a simple algebraic sum for H(s):
(15)
Equation 15 is a multisite sorption model with two sorption parameters for each site, the fraction of the site 61, and the characteristic time (Tsj). The KD value at each site is correlated through eq 12. The well-known two-site (TS) sorption model, therfore, corresponds to m = 2 and b = 0 in eq 15, in which one site is T,I = 0 (equilibrium) and another site is Ts2 =- 0 (time dependent). It should be noted that in this case, we operationally represent Tslb =
ou=u = 1 in eq 15 to retain the equilibrium site(s). Moreover, fi and& serve as the fractions of both sites, andfi = 1 -
Continuous pdf. The discrete multisite model creates two parameters and T,i) for each individual type of sorption sites. When there are more than two types of sorption sites, eq 15 becomes less practical because of too many estimated parameters. A pragmatic approach would be a continuous pdf of T, since continuous distributions usually need only two parameters (e.g., the mean and the variance). A candidate for such a continuous pdf for T, is the generalized y distribution:
A.
where T(n) is the y function:
r(n) = LEn-' exp(-E) d t (17)
,9 and n are scale and shape parameters determining the mean and variance of the distribution, respectively, as
n - n T, = -and 4 = - P P2
(18)
The y function is well-known for its flexibility in describing a wide range of skewed as well as very symmetric distribu- tions. It has been used by Connaughton et al. (25) and Pedit and Miller (I) to represent sorption rate variability. It should be noted, however, that other pdfs are also available, but differentiation between different continuous pdfs was not the primary interest of this work.
Given the y pdf of T, as eq 16, the mean transfer function H(s) is then derived by substituting eq 16 into eq 13 and integrating (16):
(19)
where T(&zl is the incomplete y function ofzwith parameter 5 (26'). Equation 19 will be referred to as a y sorption (GS) model.
Equations 15 (case m = 2) and 19 reveal that both TS and GS models include four parameters: two common constants, a and b two specific, fi and Ts2 for TS, ,9 and n for GS. The four parameters, however, may be reduced to three after subjecting the constraint of the sample-averaged KO, which is apotentially measurable parameter as pointed out by Pedit and Miller (1). That is, from eq 12, the expectation of KD is
E[KD] = RD = &[ r,b] (20)
where E[TSb] is the bth moment (potentially fractional). For TS
E[7',bI = (1 - fi)T,2b (21)
and for GS
(22)
Substituting eq 21 or eq 22 into eq 20, therefore, results in
2728 ENVIRONMENTAL SCIENCE & TECHNOLOGY / VOL. 29, NO. 11.1995
four parameters that are all constrained to the hown value of E[KDI. This means that whenever three of them are chosen, the fourth is automatically determined by eq 20.
EActs of Sorption-Si Heterogeneity on Transport To quantitatively evaluate the effect of sorption hetero- geneities in both equilibrium and rate properties on transport and to understand the implications, the time moment methodisutikedas describedindetail byvalocchi (27). For example, time moments serve as descriptors of a concentration btc. The first four moments indicate the mean breakthrough time, the degree of spreading, the asymmetry, and the peakedness of the curve, respectively. It is expected therefore, that each higher time moment would reveal more information of the influence of rate- limiting processes that are embedded in the btc.
The ith absolute moment of a btc generated by eq 8 is calculated as (27)
0.8
Given the absolute moments calculated as eq 23, the corresponding central moments can be obtained according to Abramowitz and Stegun (26). The iirst four central moments of eq 8 with substitution of eq 13 are calculated as (16)
mbtc = 1 + aE[T,q = R
.‘b, = R%: + 2aE[T,”’]
p3 = 3 d 6 : + ~U(~:RE[T~”~I + E[T,”‘I)
(24)
(25)
(26)
:: i j - . . . ,
: . . :, a=2.36, b = O . 1 - a=1.53. b = O : :
. . . . . .
p4 = 3de:(1+ 56:) + 12a(R%:(1+ ~E:)E[T~”~I + a(i + E:)(E[T,”~IY + ~ E : R E [ T ~ + ZE[T~”~I) (27)
where mbtc and are the btc mean and variance; p3 and p4 are the btctbird and fourth central moments, respectively; R is a modified retardation factor, which reduces to the regular value R as b = 0 in eq 24; and E[TA (i = b + i, i = 0,1,2, ... ) is thejth absolute moment of Ts, determined by eq 21 for TS or by eq 22 for GS.
Two interesting results are now demonstrated in the expressions of the first four moments for a given dispersive system he., er is given). First, when an LFER holds, i.e., KO and T, are perfectly correlated (b > 0). all btc moments becomedependent uponthe sorptiontime statistics (EITA). Second, when an LFER is not valid, i.e., KO and T, are completelyindependent (b= 01, the first btcmoment (mean breakthrough time, m d becomes solely determined by the equilibrium properties (= retardation factor R). but higher moments describing btc spreading and tailing are all influenced by both equilibrium and rate sorption statistics.
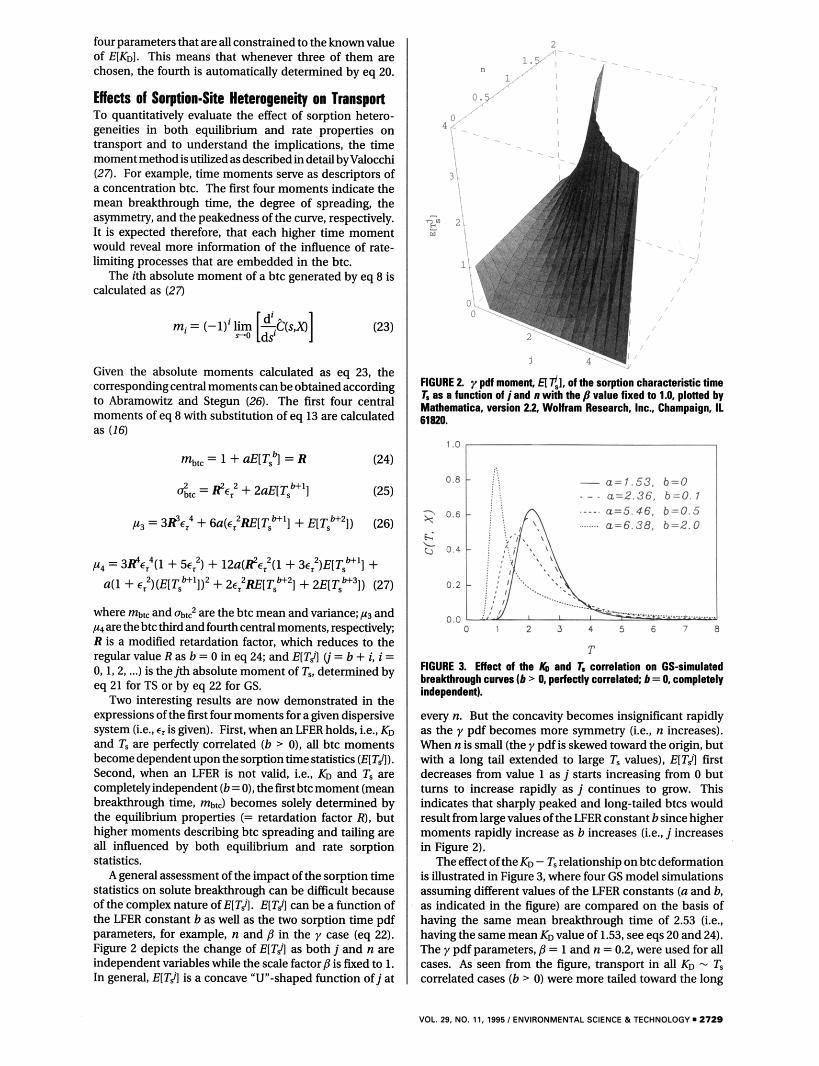
A general assessment of the impact of the sorption time statistics on solute breakthrough can be difficult because of the complex nature of EITJ. E[TA can be a function of the LFER constant bas well as the two sorption time pdf parameters, for example, n and ,9 in the y case (eq 22). Figure 2 depicts the change of EITJ as both j and n are independent variables while the scale factorb is fixed to 1. In general, EITJ is a concave “U-shaped function of j at
/ /
FIGURE 2 y pdf momin H t l , ofthe sorption characteristic time 1. a t a function of jand a WW the fl value fixed to 1.0. platted by Mathematica. version 22 Wolfram Research, Inc., Champaign, I1 61820.
VOL. 29. NO. 11.1995 I ENVIRONMENTAL SCIENCE &TECHNOLOGY. 272s
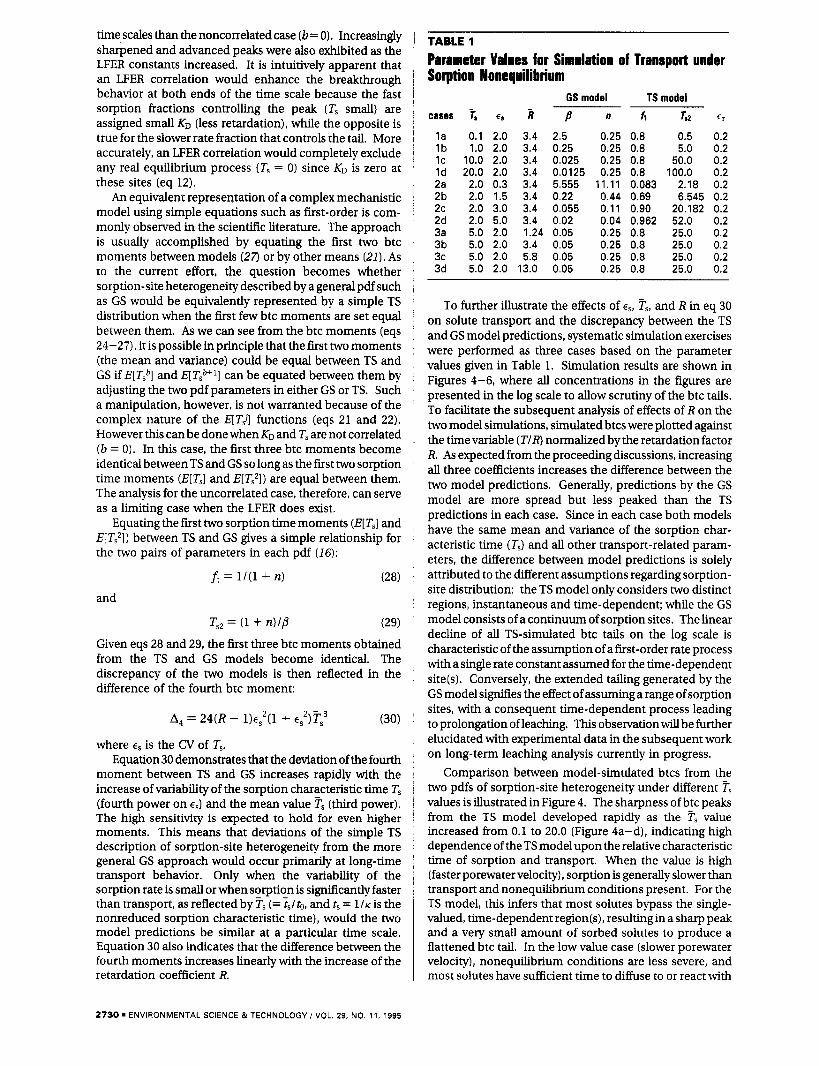
time scales than the noncorrelated case (b = 0). Increasingly sharpened and advanced peaks were also exhibited as the LFER constants increased. It is intuitively apparent that an LFER correlation would enhance the breakthrough behavior at both ends of the time scale because the fast sorption fractions controlling the peak (T, small) are assigned small KD (less retardation), while the opposite is true for the slower rate fraction that controls the tail. More accurately, an LFER correlation would completely exclude any real equilibrium process (T, = 0) since KD is zero at these sites (eq 12).
An equivalent representation of a complex mechanistic model using simple equations such as first-order is com- monly observed in the scientific literature. The approach is usually accomplished by equating the first two btc moments between models (27) or by other means (21). As to the current effort, the question becomes whether sorption-site heterogeneity described by a general pdf such as GS would be equivalently represented by a simple TS distribution when the first few btc moments are set equal between them. As we can see from the btc moments (eqs 24-27), it is possible in principle that the first two moments (the mean and variance) could be equal between TS and GS if E[Tsb] and E[TSb+’] can be equated between them by adjusting the two pdf parameters in either GS or TS. Such a manipulation, however, is not warranted because of the complex nature of the E[TJI functions (eqs 21 and 22). However this can be done when KD and Ts are not correlated (b = 0). In this case, the first three btc moments become identical between TS and GS so long as the first two sorption time moments (E[T,] and E[Ts21) are equal between them. The analysis for the uncorrelated case, therefore, can serve as a limiting case when the LFER does exist.
Equating the first two sorption time moments (E[T,I and E[ T?]) between TS and GS gives a simple relationship for the two pairs of parameters in each pdf (16):
fi = 1/(1 + n) (28) and
Ts2 = (1 + n, /g (29) Given eqs 28 and 29, the first three btc moments obtained from the TS and GS models become identical. The discrepancy of the two models is then reflected in the difference of the fourth btc moment:
A4 = 24(R - 1)~:(1 + E:)T: (30)
where E , is the CV of Ts. Equation 30 demonstrates that the deviation of the fourth
moment between TS and GS increases rapidly with the increase of variability of the sorption characteristic time T, (fourth power on E , ) and the mean value ?, (third power). The high sensitivity is expected to hold for even higher moments. This means that deviations of the simple TS description of sorption-site heterogeneity from the more general GS approach would occur primarily at long-time transport behavior. Only when the variability of the sorption rate is small or when sorption is significantly faster than transport, as reflected by ?; (=?,/to, and ts = 1 / ~ is the nonreduced sorption characteristic time), would the two model predictions be similar at a particular time scale. Equation 30 also indicates that the difference between the fourth moments increases linearly with the increase of the retardation coefficient R.
TABLE 1
Parameter Values for Simulation of Transport under Sorption Nonequilibrium
GS model TS model
cases 7, cS 1 /3 n fi T s ~ cr
la 0.1 2.0 3.4 2.5 0.25 0.8 0.5 0.2 5.0 0.2 Ib 1.0 2.0 3.4 0.25 0.25 0.8
IC 10.0 2.0 3.4 0.025 0.25 0.8 50.0 0.2 Id 20.0 2.0 3.4 0.0125 0.25 0.8 100.0 0.2 2a 2.0 0.3 3.4 5.555 11.11 0.083 2.18 0.2 2b 2.0 1.5 3.4 0.22 0.44 0.69 6.545 0.2 2c 2.0 3.0 3.4 0.055 0.11 0.90 20.182 0.2 2d 2.0 5.0 3.4 0.02 0.04 0.962 52.0 0.2 3a 5.0 2.0 1.24 0.05 0.25 0.8 25.0 0.2 3b 5.0 2.0 3.4 0.05 0.25 0.8 25.0 0.2 3c 5.0 2.0 5.8 0.05 0.25 0.8 25.0 0.2 3d 5.0 2.0 13.0 0.05 0.25 0.8 25.0 0.2
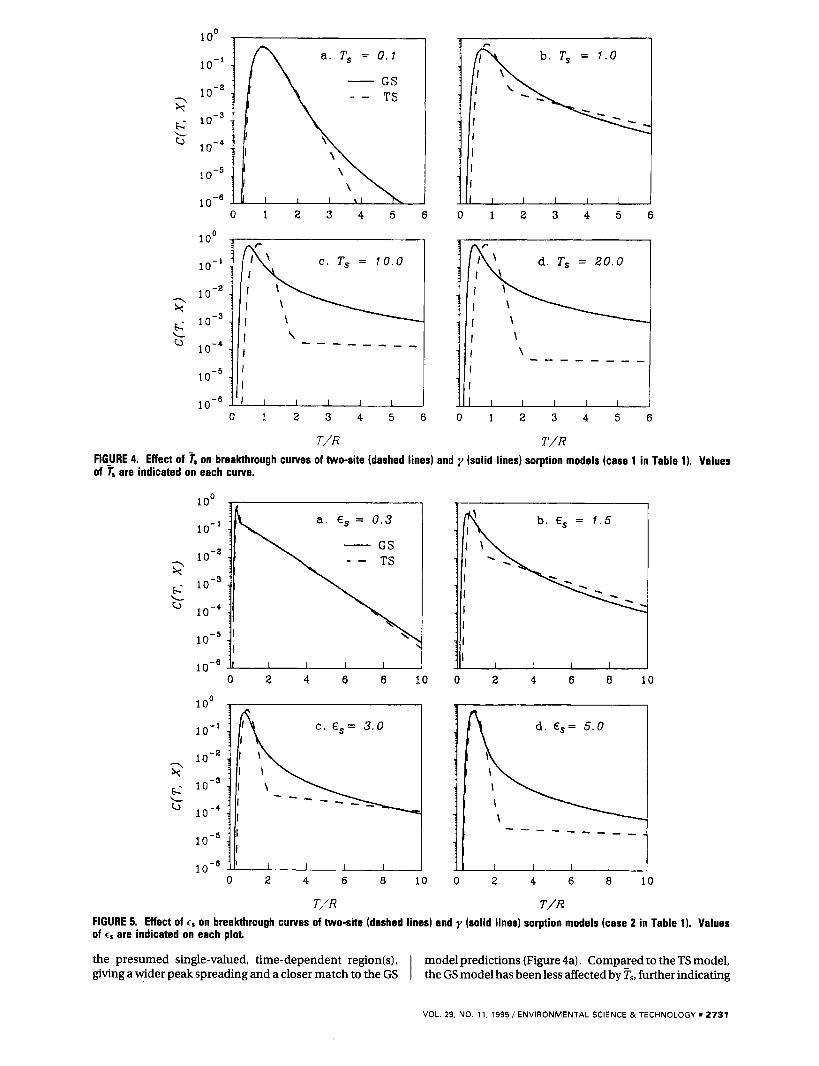
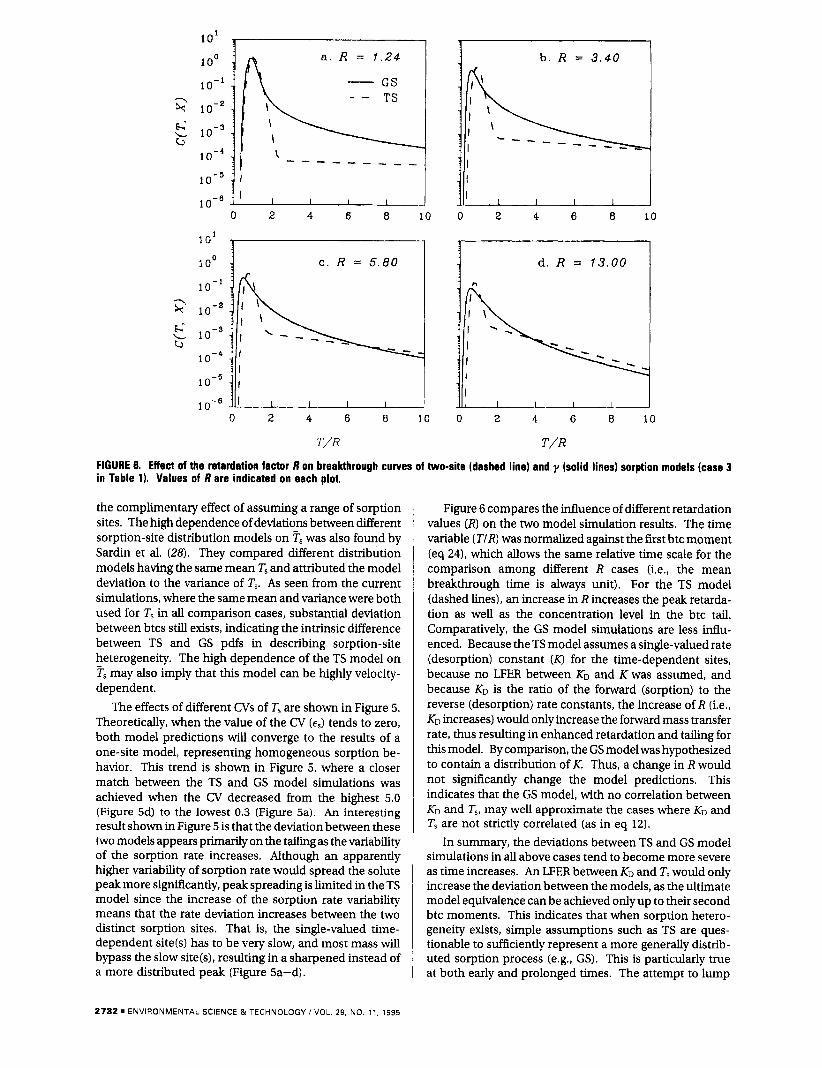
To further illustrate the effects of E , , T,, and R in eq 30 on solute transport and the discrepancy between the TS and GS model predictions, systematic simulation exercises were performed as three cases based on the parameter values given in Table 1. Simulation results are shown in Figures 4-6, where all concentrations in the figures are presented in the log scale to allow scrutiny of the btc tails. To facilitate the subsequent analysis of effects of R on the two model simulations, simulated btcs were plotted against the time variable (TIR) normalized by the retardation factor R. As expected from the proceeding discussions, increasing all three coefficients increases the difference between the two model predictions. Generally, predictions by the GS model are more spread but less peaked than the TS predictions in each case. Since in each case both models have the same mean and variance of the sorption char- acteristic time (T,) and all other transport-related param- eters, the difference between model predictions is solely attributed to the different assumptions regarding sorption- site distribution: the TS model only considers two distinct regions, instantaneous and time-dependent; while the GS model consists of a continuum of sorption sites. The linear decline of all TS-simulated btc tails on the log scale is characteristic of the assumption of a first-order rate process with a single rate constant assumed for the time-dependent site(s). Conversely, the extended tailing generated by the GS model signifies the effect of assuming a range of sorption sites, with a consequent time-dependent process leading to prolongation of leaching. This observation will be further elucidated with experimental data in the subsequent work on long-term leaching analysis currently in progress.
Comparison between model-simulated btcs from the two pdfs of sorption-site heterogeneity under different ?, values is illustrated in Figure 4. The sharpness of btc peaks from the TS model developed rapidly as the Ts value increased from 0.1 to 20.0 (Figure 4a-d), indicating high dependence of the TS model upon the relative characteristic time of sorption and transport. When the value is high (faster porewater velocity), sorption is generally slower than transport and nonequilibrium conditions present. For the TS model, this infers that most solutes bypass the single- valued, time-dependent region(s), resulting in a sharp peak and a very small amount of sorbed solutes to produce a flattened btc tail. In the low value case (slower porewater velocity), nonequilibrium conditions are less severe, and most solutes have sufficient time to diffuse to or react with
2730 ENVIRONMENTAL SCIENCE &TECHNOLOGY / VOL. 29, NO. 11, 1995
5;' F; L c,
I I I I I I
1 oo
lo- '
1 o - ~
1 o - ~
1 o-8 0 1 2 3 4 5 6
1 oo
lo-'
1 o - ~
0 1 2 3 4 5 6
0 1 2 3 4 5 6
T/R
0 1 2 3 4 5 6
T/R FIGURE 4. Effect of % on breakthrough curves of two-site (dashed lines) and y (solid lines) sorption models (case 1 in Table 1). Values of T, are indicated on each curve.
a . E, = 0.3
I
.I 91 0 2 4 6 8 10
1 oo
l o - '
1 o - ~
0 2 4 6 8 10
T/R
0 2 4 6 e io
0 2 4 6 8 10
T/R FIGURE 5. Effect of cS on breakthrough curves of two-site (dashed lines) and y (solid lines) sorption models (case 2 in Table 1). Values of cS are indicated on each plot.
the presumed single-valued, time-dependent region(s), model predictions (Figure 4a). Compared to the TS model, giving a wider peak spreading and a closer match to the GS I the GS model has been less affected by ps, further indicating
VOL. 29, NO. 11. 1995 / ENVIRONMENTAL SCIENCE & TECHNOLOGY 2731
a. R = 1 . 2 4
GS -
- - - - - _ _ _ _ I I
I I I I
0 2 4 6 8 10
l o o 1 c . R = 5.80 I
0 2 4 6 8 10
T / R
1 b. R = 3.40
0 2 4 6 8 10
d . R = 13.00
0 2 4 6 8 10
T / R
FIGURE 8. Effect of the retardation factor R on breakthrough curves of two-site (dashed line) and y (solid lines) sorption models (case 3 in Table 1). Values of R are indicated on each plot.
the complimentary effect of assuming a range of sorption sites. The high dependence of deviations between different sorption-site distribution models on Fs was also found by Sardin et al. (28). They compared different distribution models having the same mean T, and attributed the model deviation to the variance of T,. As seen from the current simulations, where the same mean and variance were both used for T, in all comparison cases, substantial deviation between btcs still exists, indicating the intrinsic difference between TS and GS pdfs in describing sorption-site heterogeneity. The high dependence of the TS model on ?', may also imply that this model can be highly velocity- dependent.
The effects of different CVs of T, are shown in Figure 5. Theoretically, when the value of the CV tends to zero, both model predictions will converge to the results of a one-site model, representing homogeneous sorption be- havior. This trend is shown in Figure 5, where a closer match between the TS and GS model simulations was achieved when the CV decreased from the highest 5.0 (Figure 5d) to the lowest 0.3 (Figure 5a). An interesting result shown in Figure 5 is that the deviation between these two models appears primarily on the tailing as the variability of the sorption rate increases. Although an apparently higher variability of sorption rate would spread the solute peak more significantly, peak spreading is limited in the TS model since the increase of the sorption rate variability means that the rate deviation increases between the two distinct sorption sites. That is, the single-valued time- dependent site(s1 has to be very slow, and most mass will bypass the slow site(s1, resulting in a sharpened instead of a more distributed peak (Figure 5a-d).
Figure 6 compares the influence of different retardation values (R) on the two model simulation results. The time variable (TIR) was normalized against the first btc moment (eq 241, which allows the same relative time scale for the comparison among different R cases (Le., the mean breakthrough time is always unit). For the TS model (dashed lines), an increase in R increases the peak retarda- tion as well as the concentration level in the btc tail. Comparatively, the GS model simulations are less influ- enced. Because the TS model assumes a single-valued rate (desorption) constant ( K ) for the time-dependent sites, because no LFER between KO and Kwas assumed, and because KD is the ratio of the forward (sorption) to the reverse (desorption) rate constants, the increase of R (Le,, KD increases) would only increase the forward mass transfer rate, thus resulting in enhanced retardation and tailing for this model. By comparison, the GS model was hypothesized to contain a distribution of K. Thus, a change in R would not significantly change the model predictions. This indicates that the GS model, with no correlation between KD and T,, may well approximate the cases where KD and T, are not strictly correlated (as in eq 12).
In summary, the deviations between TS and GS model simulations in all above cases tend to become more severe as time increases. An LFER between KD and T, would only increase the deviation between the models, as the ultimate model equivalence can be achieved onlyup to their second btc moments. This indicates that when sorption hetero- geneity exists, simple assumptions such as TS are ques- tionable to sufficiently represent a more generally distrib- uted sorption process (e.g., GS). This is particularly true at both early and prolonged times. The attempt to lump
2732 a ENVIRONMENTAL SCIENCE & TECHNOLOGY / VOL. 29, NO. 11. 1995
the effect of nonequilibrium processes into an “effective dispersion coefficient” or to fmd a simple equivalent representation for a more complex mechanistic model (27) may be effective for homogeneous systems having uniform equilibrium/rate sorptionproperties and for processes over a relatively short time scale. However, it becomes risky, as shown in the current work, when sorption-site heteroge- neity and long-time behavior are of concern. Comparisons between TS and GS model capability to extrapolate experimental results obtained over a variety of time scales is the next step in this framework.
Acknowledgments The authors would like to thank the two anonymous reviewers for their insight and valuable comments on this work. Thanks are also expressed to Drs. L. W. Lion and J. R. Stedinger of Cornell University for their reviews on the original version. This research was funded by the U.S. Geological Survey (Contract 14/08/0001/G1906).
Glossary empirical constant in the LFER between KD and T, empirical constant in the LFER between KD and T, local solute concentration, M/L3 = c/ Co, dimensionless local concentration input concentration, MIL3 ensemble mean concentration, dimensionless expectation operator fraction at sorption site i, dimensionless mean transfer function of an ensemble of rate-
transfer function of a rate-limiting process = KtO, dimensionless first-order rate coefficient = & ple , dimensionless sorption partitioning
sorption partitioning coefficient, L3/M spatial reference length (column length), L ith absolute moment the first moment of a breakthrough curve shape factor in the y pdf = 2/62, Peclet number joint pdf of variates, KO and Ts marginal pdf of KD marginal pdf of Ts = 1 +E[%], mean retardation factor, dimensionless = 1 + uE[ GI, modifled retardation factor, dimen-
= Sbp/ (Oca), dimensionless sorbed concentration Laplace parameter sorbed concentration, MIM = 1/K, dimensionless sorption characteristic time = 1/K, dimensionless sorption characteristic time
time, T mean residence time, T = 1 / ~ , sorption characteristic time, T local porewater velocity, L/T = vto/Lo, dimensionless local porewater velocity spatial coordinate, L
limiting process
coefficient
sionless
at sorption site i
= x/L,,, dimensionless spatial coordinate dummy variable forward first-order mass transfer rate coefficient,
scale factor in the y pdf the fourth btc moment difference between the TS
y function the coefficient ofvariance of sorption characteristic
time T, the coefficient of variance of residence time t reverse first-order mass transfer rate coefficient,
the third central btc moment the fourth central btc moment bulk density, M/L3 btc variance variance of sorption characteristic time Ts dimensionless residence time porosity, L3/L3 dummy variable Laplace transform operator
T-1
and GS models
T-1
Literature Cited (1) Pedit, J. A.; Miller, C. T. Enuiron. Sci. Technol. 1994, 28, 2094-
(2) Rao, P. S. C.; Jessup, R. E.; Addiscott, T. M. Soil Sci. 1982, 133,
(3) Ruthven, D. M.; Loughlin, K. F. Chem. Eng. Sci. 1971,26, 577-
(4) Rasmuson, A. Chem. Eng. Sci. 1985, 40, 621-629. (5) Jury, W. A. In Chemical mobility and reactivity in soil systems;
Nelson, D. W., Elrick, D. E., Tanji, K. K., Eds.; Soil Science Society of America: Madison, WI, 1983; pp 49-64.
(6) van der Zee, S. E. A. T. M.; van Riemsdijk, W. H. Water Resour. Res. 1987, 23, 2059-2069.
(7) Cvetkovic, V. D.; Shapiro, A. M. Water Resour. Res. 1990, 26,
(8) Gamerdinger, A. P.; Wagenet, R. J.; van Genuchten, M. Th. Soil
(9) Brusseau, M. L.; Jessup, R. E.; Rao, P. S. C. Water Resour. Res.
(10) Pignatello, J. J.; Ferrandino, F. J.; Huang, L. Q. Enuiron. Sci. Technol. 1993, 27, 1563-1571.
(11) Cameron, D. A.; Klute, A. WaterResour. Res. 1977,13, 183-188. (12) Wu, S., Gschwend, P. M. Environ. Sci. Technol. 1986, 20, 717-
725. (13) Ball, W. P., Roberts, P. V. Enuiron. Sci. Technol. 1991,25, 1237-
1249. (14) Brusseau, M. L.; Jessup, R. E.; Rao, P. S. C. Enuiron. Sci. Technol.
1991, 25, 134-142. (15) Simmons, C. S. Water Resour. Res. 1982, 18, 1191-1214. (16) Chen, W. Ph.D. Dissertation, Cornell University, 1994. (17) Villermaux, J. 1. Chromatogr. 1987, 406, 11-26. (18) Beran, M. J. Statistical Continuum Theories; Wiley Interscience:
New York, 1968. (19) Johnson, N. L.; Kotz, S. Distribution In Statistics: Continuous
Univariate distributions-1; John Wiley & Sons: New York, 1970;
(20) Jury, W. A.; Roth, K. Transfer functions and Solute Movement through Soil: TheoryandApplication; Birkhauser Verlag: Basel, 1990.
(21) van Genuchten, M. Th.; Dalton, F. N. Geoderma 1986,38, 165- 183.
(22) Weber, W. J.; McGinley, P. M., Jr.; Katz, L. E. Enuiron. Sci. Technol. 1992, 26, 1955-1962.
(23) Brusseau, M. L.; Rao, P. S. C. Geochemosphere 1989, 18, 1691- 1706.
(24) Meyer, P. L. IntroductoryProbabilityandStatisticalApplications; Addison-Wesley Publishing Company: Reading, 1970; pp 93- 114.
2194.
342-394.
584.
2057-2067.
Sci. SOC. Am. J. 1990, 54, 957-963.
1989, 25, 1971-1988.
pp 137-153.
VOL. 29, NO. 11, 1995 / ENVIRONMENTAL SCIENCE & TECHNOLOGY 2733

(25) Connauahton, D. F.; Stedinaer, J. R.; Lion, L. W.: Shuler, M. L. I Received for review Sevtember 29, 1994. Revised manuscrivt
Functions with Form&, Graphs, and Mathematical Tables; Dover Publications, Inc.: New York, 1972; p 260.
(27) Valocchi, A. J. Water Resour. Res. 1986, 22, 399-407. (28) Sardin, M.; Schweich, D.; Leij, F. J.; van Genuchten, M. Th. Water
Resour. Res. 1991, 27, 2287-2307.
Enuiron:ScL Technol. 1993r27, 2397-2403. I received April 3, 1995. Accepted April 6, 1995.@ (26) Abramowitz, M.; Stenun, I. A. Handbook of Mathematical
ES940611p
@ Abstract published in Aduance ACS Abstracts, October 15, 1995.
2734 1 ENVIRONMENTAL SCIENCE & TECHNOLOGY / VOL. 29, NO. 11,1995