solar pv jobs & value added in europe - ey€¦ · break-out of the value chain the main...
TRANSCRIPT

Solar PV Jobs & Value Added in Europe | 1
Solar PVJobs & Value Added in EuropeNovember 2017
Solar PV Jobs & Value Added in Europe2 |
The report was conducted on behalf of SolarPower Europe, who thank the following organisations for their committment.
List of photo credits
Photo 1. Front page. Credit: Hanau EnergiesPhoto 2: Wacker Chemie AGPhoto 3: SMA Solar TechnologyPhoto 4: SMA Solar TechnologyPhoto 5 : REC Group Photo 6 : ENEL Photo 7 : Trina SolarPhoto 8: LightsourcePhoto 9: EYPhoto 10: V. FournierPhoto 11: Ideematec

Solar PV Jobs & Value Added in Europe | 3
1. Introduction 4
2. Key Findings 8
3. Total job creation 10
4. Forces shaping the socio-economic effects of the Photovoltaics industry 14
5. Rooftop and ground-mounted Photovoltaics systems 18
6. Socio-economic impact per segment of the value chain 22
7. The impact of a higher Renewable Energy target on the European solar industry
28
8. The impact of Trade Defence Measures for Modules and Cells on the European Solar industry
32
Annex - Main sources and assumptions 36

Solar PV Jobs & Value Added in Europe4 |
1. Introduction
Solar PV Jobs & Value Added in Europe | 5
Objective of the study
Solar Photovoltaics (PV) are a booming source of Renewable Energy within the European Union (EU). The technology is praised for its ability to address a number of important energy challenges for policymakers and society. It is also recognized as an important contributor to economic growth and job creation. Incorporating its socio-economic impacts unveils the full potential of Solar PV in the EU. In November 2015, the first edition of this study was published. Its purpose was, and still is, to capture the socio-economic contribution of the solar PV industry, by assessing its direct and indirect impact on job creation and Gross Value Added (GVA) in the EU – at aggregated level and for each Member State. The analysis is split according to the solar PV value chain - upstream and downstream.
The current study offers an update of the 2015 research, taking into account recent evolutions in the Solar PV sector. It aims at contributing to the policy process by making credible data at European level more available.
One key issue that impacts the EU solar sector relates to the targets for Renewable Energy set by the European Commission. The impact of a higher target (35%) versus the current envisaged target (27%) is analysed in this study in a targeted way, through modelling and comparing to an alternative scenario, based on a forecast from the Global Market Outlook for Solar PV 2016-2020 published by SolarPower Europe in 2016.
This study also assesses the impacts of the anti-dumping measures (minimum import prices and annual import quotas) set by the European Commission on the import of solar modules and cells. It does so by modelling and comparing an alternative scenario (without measures) to the baseline scenario (with measures) for 2 countries (Germany and Italy).

Solar PV Jobs & Value Added in Europe6 |
Methodology
The Input-Output model developed by EY facilitates the assessment of the socio-economic contribution of Renewable Energy Sources (RES) with regards to direct and indirect jobs and Gross Value Added (GVA) creation. It is based on several input data like capital and operational expenditures (CAPEX and OPEX) required to build and operate Solar PV equipment. Additionally, annual and cumulative installed capacities, load factors as well as domestic shares are taken into account.
Data is separated for each step of the solar PV value chain, as well as for rooftop (which includes residential, commercial and some industrial systems) and ground-mounted solar PV market segments. Indirect impacts are those occurring in the PV value chain due to the activity of suppliers and service providers selling products or services to companies.
Indirect impacts in each segment of the value chain are calculated using national input-output tables, sourced from Eurostat, which represent the structure of national economies. Each of the CAPEX and OPEX segments of the PV value chain are mapped to the best fitting sector. The expenditure in each segment of the value chain is thereby “injected” into the input-output table, which then enables measuring, on average, the rippling effect throughout the suppliers and service providers of the PV industry.
All assumptions used in the model are set in a conservative way. A list of assumptions and main sources used in the model are detailed in the annex and discussed throughout the report.
Main changes compared to the previous study
This 2017 update of the 2015 study relies upon the very same methodology. Input data for the years 2008-2013 are the same as in the 2015 study, except for domestic shares and new installed capacities which have been updated to rely on more accurate figures.
The components of the solar PV value chain which are produced in the countries in the scope, are reflected through the domestic shares of production. Naturally, these shares impact the output of the modelling. They have mainly been collected through estimations based on amount of producers, the EU-wide markets shares and validation from national sector associations. Upon comparing this study and the study of 2015, one should take into consideration that some domestic shares have changed based on new information provided. This is the case for:• the Modules and Cells part of the value chain for
Germany, France and Italy • the Installation of Ground-Mounted systems in all
countries in scope
Annual installed capacities are based on the same sources as in 2015. Most notable changes compared to those provided in the previous study are for Spain, Germany and France as well as (2014 onwards) for Belgium, UK and Greece. EU28 figures are in the same line and cumulated installed capacities have not changed for 2008 until 2016.
Load factors for the 2014-2021 period are based on IEA data and are slightly higher than those in the previous study.
Unit costs of the solar panel components have been updated to reflect the continuous decrease of prices.
All input data for the years 2014-2021 has been updated.

Solar PV Jobs & Value Added in Europe | 7
Scope
Data is specifically gathered for the key Solar PV markets in the EU: Germany, France, Spain, Italy, Belgium, UK, Greece, the Netherlands, Poland and Romania. Results for other EU countries are obtained by extrapolation. The Netherlands, Poland and Romania have been added to this scope.
Analyses include crystalline-silicon (c-Si) and Thin-film (TF) technologies, which account for the largest share of the global PV market today.
The timeframe for the analysis is 2008 to 2021. 2021 is taken as an end-point for the forecasting, as too many uncertainties exist after that. Productivity gains by 2021 are reflected in unit costs.
Break-out of the value chain
The main products and services of the PV ‘lifecycle’ are captured in the value chain resorted to in this model. The value chain for solar PV systems can be split between upstream and downstream activities:
• Upstream activities are the processing of raw materials: manufacturing of polysilicon, wafers, cells, modules, inverters and other Balance of Systems (batteries, distributors, charge controllers, mounting and tracking systems and miscellaneous electrical components).
• Downstream activities are services provided within the PV industry such as engineering, administration, installation, operations & maintenance, power sales and decommissioning & recycling. Compared to the previous study, the latter has been added because of its increasing relevance.

Solar PV Jobs & Value Added in Europe8 |
2. A Summary of Key Findings

Solar PV Jobs & Value Added in Europe | 9
• Although the European Photovoltaic sector has been severely challenged in terms of installed capacities and turnover since 2011-2012, the sector continues to prove its socio-economic value in Europe, both in terms of job creation and Gross Value Added (GVA).
• In 2016, the PV sector in the EU28 represented more than 81,000 full-time Equivalents (FTEs) and more than €4,600M GVA created.
• By 2021 it is expected to sustain nearly 175,000 FTEs and to generate nearly €9,500M GVA on a European level.
• Yearly installed capacities in the European countries clearly have a significant impact on job and GVA creation, as there is a direct impact on manufacturing and services needed. Only three countries (France, the Netherlands and the UK) had significantly higher annual installed capacity in 2016 compared to 2008.
• The average PV system price in Europe has decreased by 23% in 2016 compared to 2014.
• In 2016, rooftop PV installations support almost 3 times as many jobs and GVA than ground-mounted installations. This can be explained by their installed capacities and labor needs for installation, maintenance and operations.
• Respectively 75% and 73% of the share of jobs and GVA in 2016 is linked to the downstream activities of the PV value chain. Downstream activities of the PV value chain are more labor intensive than upstream activities.
• The manufacturing of Balance of Systems (BoS) represent nearly half of the upstream share of jobs and GVA creation in 2016.
• Downstream, a strong growth by 2021 is expected in the share of ‘Installation’ in both jobs and GVA supported.
1. Despite recent reductions in job and added value creation by the PV industry in Europe, this trend is set to be reversed, with increased job creation and GVA in the coming years.
2. With a RES target of 35% in the Renewable Energy Directive, instead of the current 27%, job provision would increase by 56% in the solar industry alone.
3. The removal of the anti-dumping measures that are currently in place would have a positive effect on employment throughout the value chain in Europe. In such a scenario, 45,500 additional (direct and indirect) jobs would be created in the EU28.

Solar PV Jobs & Value Added in Europe10 |
3. Total job creation
Solar PV Jobs & Value Added in Europe | 11
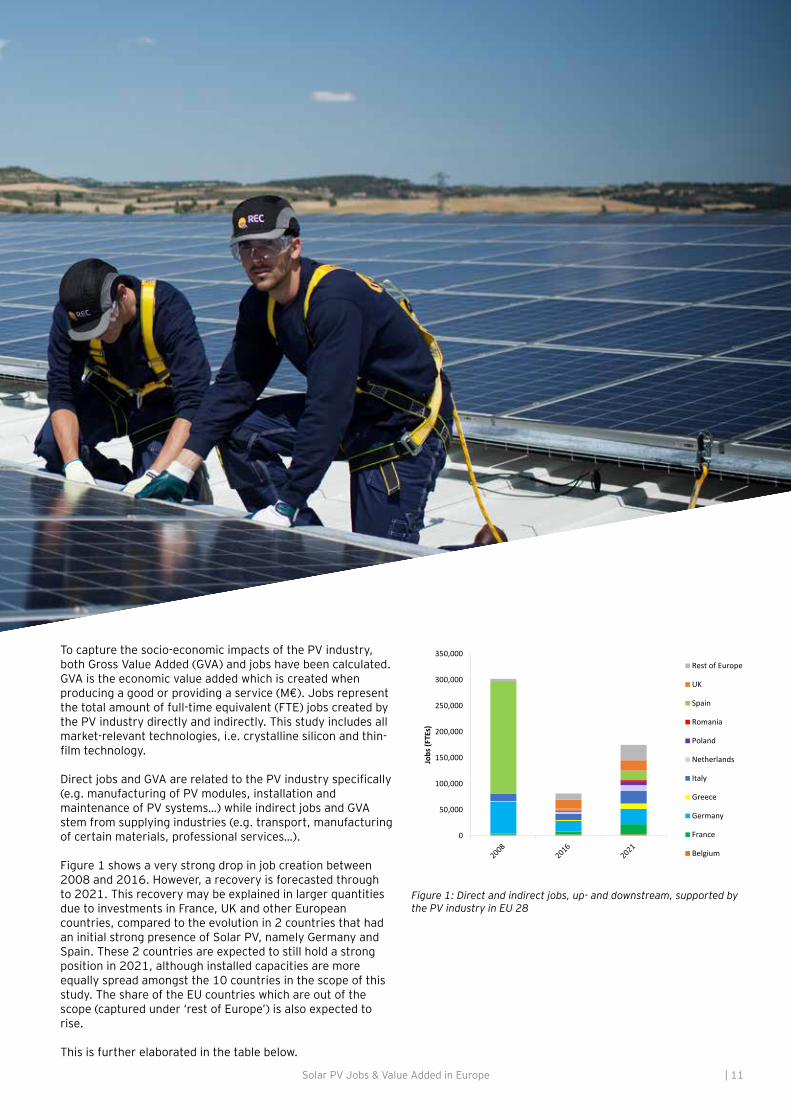
To capture the socio-economic impacts of the PV industry, both Gross Value Added (GVA) and jobs have been calculated. GVA is the economic value added which is created when producing a good or providing a service (M€). Jobs represent the total amount of full-time equivalent (FTE) jobs created by the PV industry directly and indirectly. This study includes all market-relevant technologies, i.e. crystalline silicon and thin-film technology.
Direct jobs and GVA are related to the PV industry specifically (e.g. manufacturing of PV modules, installation and maintenance of PV systems…) while indirect jobs and GVA stem from supplying industries (e.g. transport, manufacturing of certain materials, professional services…).
Figure 1 shows a very strong drop in job creation between 2008 and 2016. However, a recovery is forecasted through to 2021. This recovery may be explained in larger quantities due to investments in France, UK and other European countries, compared to the evolution in 2 countries that had an initial strong presence of Solar PV, namely Germany and Spain. These 2 countries are expected to still hold a strong position in 2021, although installed capacities are more equally spread amongst the 10 countries in the scope of this study. The share of the EU countries which are out of the scope (captured under ‘rest of Europe’) is also expected to rise.
This is further elaborated in the table below.
Figure 1: Direct and indirect jobs, up- and downstream, supported by the PV industry in EU 28
0
50,000
100,000
150,000
200,000
250,000
300,000
350,000
Jobs
(FTE
s)
Rest of Europe
UK
Spain
Romania
Poland
Netherlands
Italy
Greece
Germany
France
Belgium
Solar PV Jobs & Value Added in Europe12 |
Total jobs per year (FTE)
EU 28 Belgium France Germany Greece Italy Netherlands Poland Romania Spain UK Rest of EU
2008 301.779 2,068 1,974 61,748 1,022 14,361 * * * 216.350 149 4.106
2016 81,319 2,338 5,778 20,176 2,008 11,534 4,534 1,308 1,468 3,184 17,147 12,022
2021 174,682 2,687 19,878 29,401 10,094 24,683 10,617 6,290 3,382 18,176 19,976 29,498
*Separate figures are not available for those countries for 2008, These countries are included in the rest of EU figures,
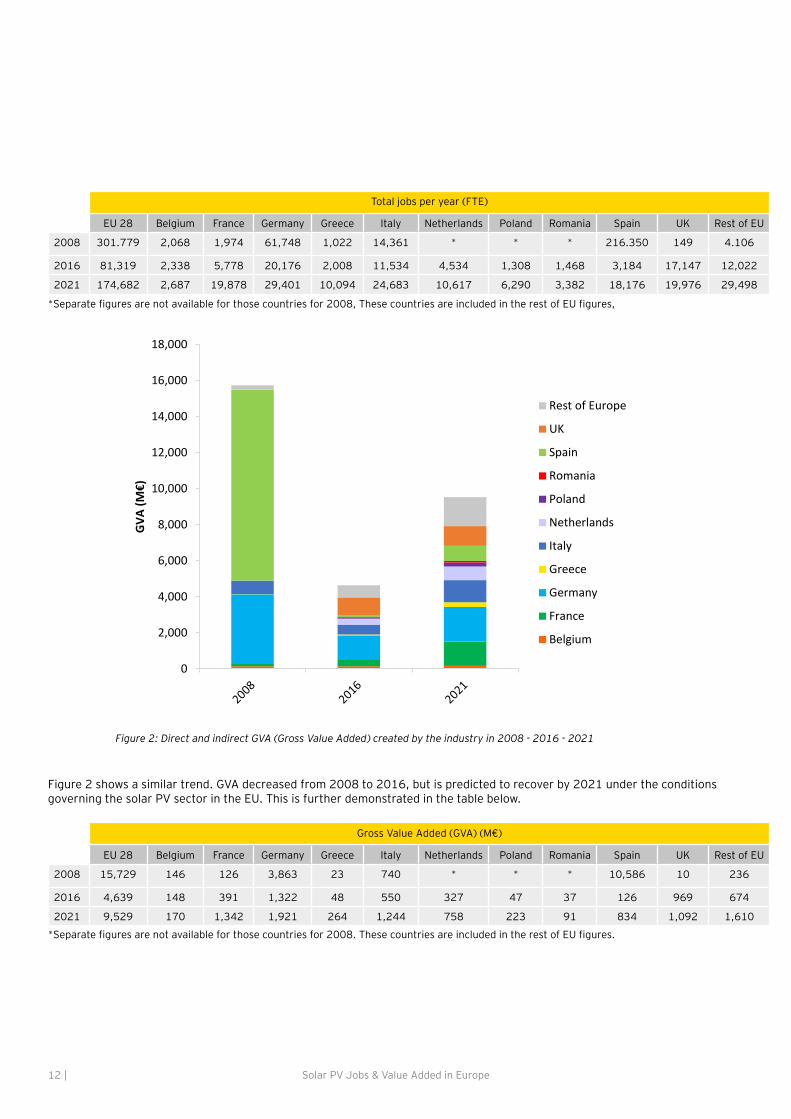
Figure 2: Direct and indirect GVA (Gross Value Added) created by the industry in 2008 - 2016 - 2021
Figure 2 shows a similar trend. GVA decreased from 2008 to 2016, but is predicted to recover by 2021 under the conditions governing the solar PV sector in the EU. This is further demonstrated in the table below.
Gross Value Added (GVA) (M€)
EU 28 Belgium France Germany Greece Italy Netherlands Poland Romania Spain UK Rest of EU
2008 15,729 146 126 3,863 23 740 * * * 10,586 10 236
2016 4,639 148 391 1,322 48 550 327 47 37 126 969 674
2021 9,529 170 1,342 1,921 264 1,244 758 223 91 834 1,092 1,610
*Separate figures are not available for those countries for 2008. These countries are included in the rest of EU figures.
0
2,000
4,000
6,000
8,000
10,000
12,000
14,000
16,000
18,000
GVA
(M€)
Rest of Europe
UK
Spain
Romania
Poland
Netherlands
Italy
Greece
Germany
France
Belgium
Solar PV Jobs & Value Added in Europe | 13
EU level
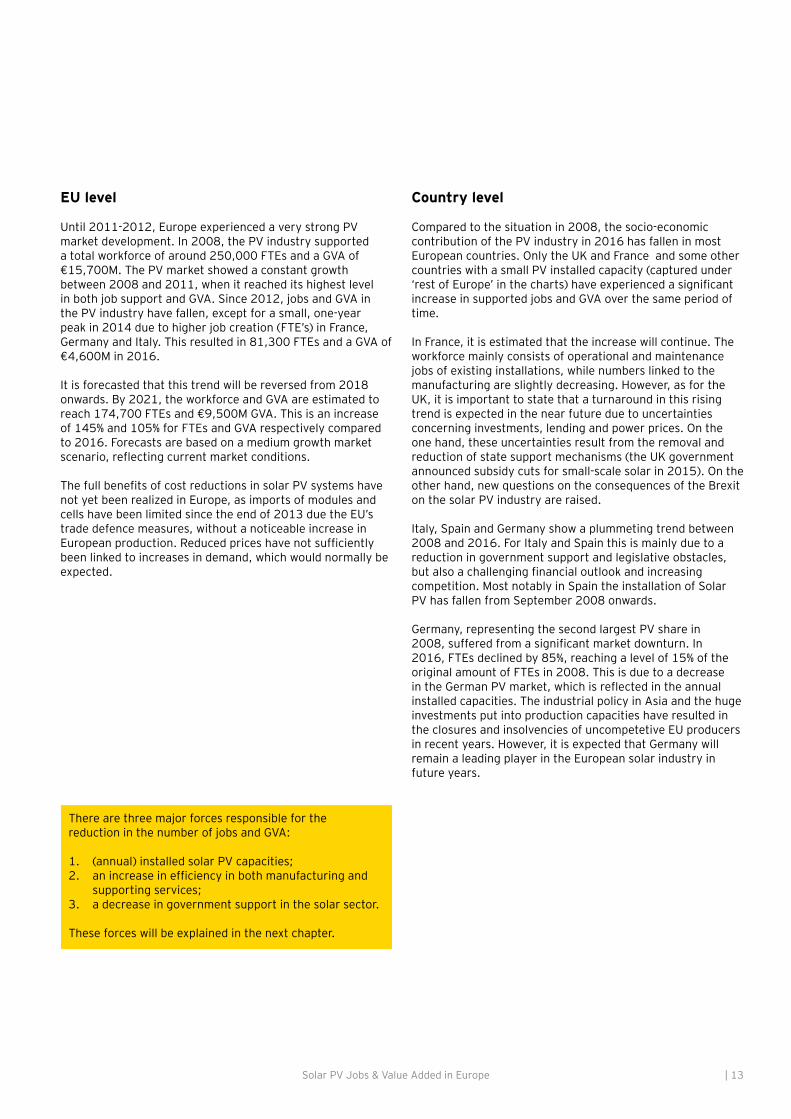
Until 2011-2012, Europe experienced a very strong PV market development. In 2008, the PV industry supported a total workforce of around 250,000 FTEs and a GVA of €15,700M. The PV market showed a constant growth between 2008 and 2011, when it reached its highest level in both job support and GVA. Since 2012, jobs and GVA in the PV industry have fallen, except for a small, one-year peak in 2014 due to higher job creation (FTE’s) in France, Germany and Italy. This resulted in 81,300 FTEs and a GVA of €4,600M in 2016.
It is forecasted that this trend will be reversed from 2018 onwards. By 2021, the workforce and GVA are estimated to reach 174,700 FTEs and €9,500M GVA. This is an increase of 145% and 105% for FTEs and GVA respectively compared to 2016. Forecasts are based on a medium growth market scenario, reflecting current market conditions.
The full benefits of cost reductions in solar PV systems have not yet been realized in Europe, as imports of modules and cells have been limited since the end of 2013 due the EU’s trade defence measures, without a noticeable increase in European production. Reduced prices have not sufficiently been linked to increases in demand, which would normally be expected.
Country level
Compared to the situation in 2008, the socio-economic contribution of the PV industry in 2016 has fallen in most European countries. Only the UK and France and some other countries with a small PV installed capacity (captured under ‘rest of Europe’ in the charts) have experienced a significant increase in supported jobs and GVA over the same period of time.
In France, it is estimated that the increase will continue. The workforce mainly consists of operational and maintenance jobs of existing installations, while numbers linked to the manufacturing are slightly decreasing. However, as for the UK, it is important to state that a turnaround in this rising trend is expected in the near future due to uncertainties concerning investments, lending and power prices. On the one hand, these uncertainties result from the removal and reduction of state support mechanisms (the UK government announced subsidy cuts for small-scale solar in 2015). On the other hand, new questions on the consequences of the Brexit on the solar PV industry are raised.
Italy, Spain and Germany show a plummeting trend between 2008 and 2016. For Italy and Spain this is mainly due to a reduction in government support and legislative obstacles, but also a challenging financial outlook and increasing competition. Most notably in Spain the installation of Solar PV has fallen from September 2008 onwards.
Germany, representing the second largest PV share in 2008, suffered from a significant market downturn. In 2016, FTEs declined by 85%, reaching a level of 15% of the original amount of FTEs in 2008. This is due to a decrease in the German PV market, which is reflected in the annual installed capacities. The industrial policy in Asia and the huge investments put into production capacities have resulted in the closures and insolvencies of uncompetetive EU producers in recent years. However, it is expected that Germany will remain a leading player in the European solar industry in future years.
There are three major forces responsible for thereduction in the number of jobs and GVA:
1. (annual) installed solar PV capacities;2. an increase in efficiency in both manufacturing and
supporting services; 3. a decrease in government support in the solar sector.
These forces will be explained in the next chapter.
Solar PV Jobs & Value Added in Europe14 |
4. Forces shaping the socio-economic effects of the Photovoltaics industry

Solar PV Jobs & Value Added in Europe | 15
Several forces define the socio-economic impacts of the PV industry. We estimate that the most significant impacts on both job creation and GVA are: annual installed capacity, efficiency gains in manufacturing and services and the decline of incentive schemes for installations in Europe.
Solar PV Jobs & Value Added in Europe16 |
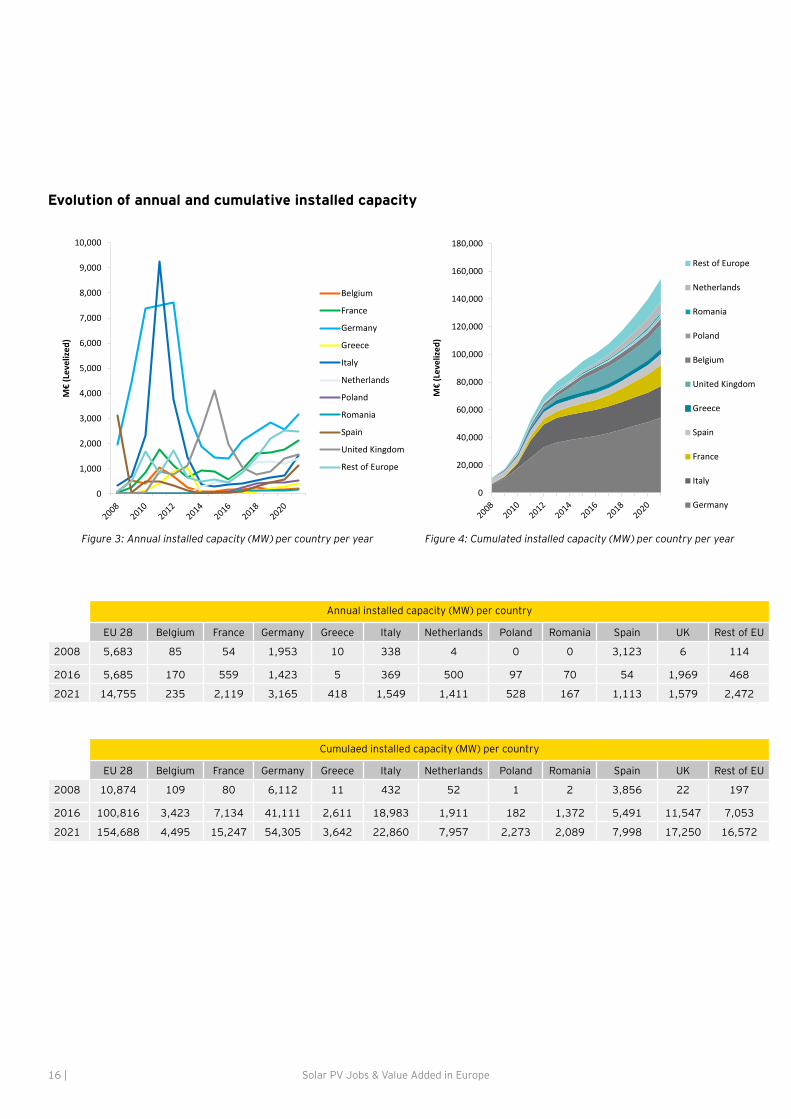
Figure 4: Cumulated installed capacity (MW) per country per yearFigure 3: Annual installed capacity (MW) per country per year
Evolution of annual and cumulative installed capacity
Annual installed capacity (MW) per country
EU 28 Belgium France Germany Greece Italy Netherlands Poland Romania Spain UK Rest of EU
2008 5,683 85 54 1,953 10 338 4 0 0 3,123 6 114
2016 5,685 170 559 1,423 5 369 500 97 70 54 1,969 468
2021 14,755 235 2,119 3,165 418 1,549 1,411 528 167 1,113 1,579 2,472
Cumulaed installed capacity (MW) per country
EU 28 Belgium France Germany Greece Italy Netherlands Poland Romania Spain UK Rest of EU
2008 10,874 109 80 6,112 11 432 52 1 2 3,856 22 197
2016 100,816 3,423 7,134 41,111 2,611 18,983 1,911 182 1,372 5,491 11,547 7,053
2021 154,688 4,495 15,247 54,305 3,642 22,860 7,957 2,273 2,089 7,998 17,250 16,572
0
1,000
2,000
3,000
4,000
5,000
6,000
7,000
8,000
9,000
10,000
M€
(Lev
eliz
ed)
Belgium
France
Germany
Greece
Italy
Netherlands
Poland
Romania
Spain
United Kingdom
Rest of Europe
0
20,000
40,000
60,000
80,000
100,000
120,000
140,000
160,000
180,000
M€
(Lev
eliz
ed)
Rest of Europe
Netherlands
Romania
Poland
Belgium
United Kingdom
Greece
Spain
France
Italy
Germany

Solar PV Jobs & Value Added in Europe | 17
As Figure 3 shows, the European solar market progressed rapidly between 2008 and 2011: total installed capacity was 5 times higher in 2011 compared to 2008, which means that 42,200MW were installed over these three years. The solar market suffered from a considerable slowdown in 2012-2013. Figure 4 demonstrates that, as a result, cumulated capacity grew by 90% (47,700MW) between 2011 and 2016. This means only 5,600MW more was installed over a longer timespan compared to 2008-2011. In 2016, the annual installed capacity was four times lower than that of 2011.
This decline is largely caused by regulatory changes in several countries (e.g. Germany, Spain and Belgium) where public policy has evolved to limit prosumers. This was often due to grid fees and the reduction/termination of incentive schemes. Home owners are therefore more cautious and have refrained from investing in PV on a large scale in recent years.
In Spain, for example, which had the second highest cumulated capacity in 2008, retroactive changes, solar taxes and fines for non-declared prosumers have considerably reduced solar installations. Moreover, in 2015, the Spanish government introduced a ‘sun tax’ which involves taxing self-consumption PV installations even for the electricity produced for one’s own use and hence not fed into the grid.As a result, Spain is now lagging behind compared to other EU countries in 2016 and will only slightly recover by 2021 in comparison to 2008. Germany, Europe’s largest PV industry, saw its annual installed capacity decrease due to the negative relationship between feed-in tariff (FiT) and capacity installation. The more capacity was installed, the lower the FiTs granted. However, the limits were too low and the decrease of the FiT’s was too high so that FiT declined faster than solar prices. These reduced incentives have created market uncertainty.
Greece experienced a 50% downfall in yearly installed capacities between 2008 and 2016. Most of its capacity was installed over the years 2012 and 2013. Greece had implemented a solar energy policy which remunerated PV systems with high feed in tariffs leading to projects with very high internal rates of return. This PV subsidy bubble created a deficit leading to retroactive cuts in 2014. The country now aims to become the EU’s largest exporter of renewable energy by 2050. A strong development of the solar sector is an important means for Greece to reach this target.
Only three countries (France, the Netherlands and the UK) had significantly higher annually installed capacity in 2016 compared to 2008. • France continues to have a relatively small cumulative
installed capacity compared to the other EU countries and yearly installed capacities have dropped back to pre-2010 levels. Moreover, job support and GVA have decreased since 2014 support schemes.
• The yearly installed capacity in the Netherlands has significantly increased between 2008 and 2016. The Netherlands is one of the few countries in Europe for which clear objectives have been formulated as part of an innovation agenda for the development of Solar PV
technology, for the application of PV systems and for the development of the Dutch PV sector in general. This resulted in Dutch companies being able to continue to be in a good competitive position regarding the expected growth in the European PV sector as well as also making a significant contribution to the energy transition in the Netherlands.
• The UK market has grown exponentially since 2011 mainly due to the introduction of a feed-in tariff scheme in April 2010. It resulted in 869 MW installed capacity in 2011, almost 13 times higher than that of 2010.The UK has consequently become one of the main drivers of the European solar Market, along with Germany and Italy. While this is the case today, economic uncertainties need to be taken into consideration when making future assumptions.
Figures for Romania reflect trends in Eastern European countries and continue to show very limited market shares compared to the rest of Europe, which are home to oversupplied electricity markets. These countries are not expected to reintroduce incentive programs for large-scale PV development in future.
The drop in the solar PV market results in less upstream and downstream activity (reduction of more than 50% between 2008 and 2016) and consequently, a decrease of jobs created and GVA for EU28.
The only segment of the value chain that experienced growth is operations and maintenance. The demand for professional services for both new and existing PV installations has increased, since operation and maintenance activities are based on cumulated capacity rather than annually installed capacity.
The effects of productivity gains on system prices
The average solar PV system price in Europe has decreased by 23% in 2016 compared to 2014. In 2016, the average price for rooftop systems and for ground-mounted systems was 1,6€/W and 0.9€/W respectively. This is a decrease compared to 2014 (1,9€/W on average for rooftop and 1,3€/W for ground-mounted). This results in an average annual price decrease of 12% over the 2014-2016 period.
The price decline of solar products is mainly caused by increased efficiency and experience in the PV industry. These cost reductions are partly the effect of more competition and of a more globalized production chain.
Although a lower unit cost and increased efficiency of modules makes solar PV systems more attractive, it also means less material and therefore labour for the same installed capacity. In addition, GVA decreases due to a lower unit cost which can mean lower revenues per MW installed. This could have been offset with more installations in Europe. However, the installed capacity did not increase and productivity gains amplified the drop in jobs and GVA.

Solar PV Jobs & Value Added in Europe18 |
5. Rooftop and Ground-Mounted Photovoltaics systems
Solar PV Jobs & Value Added in Europe | 19
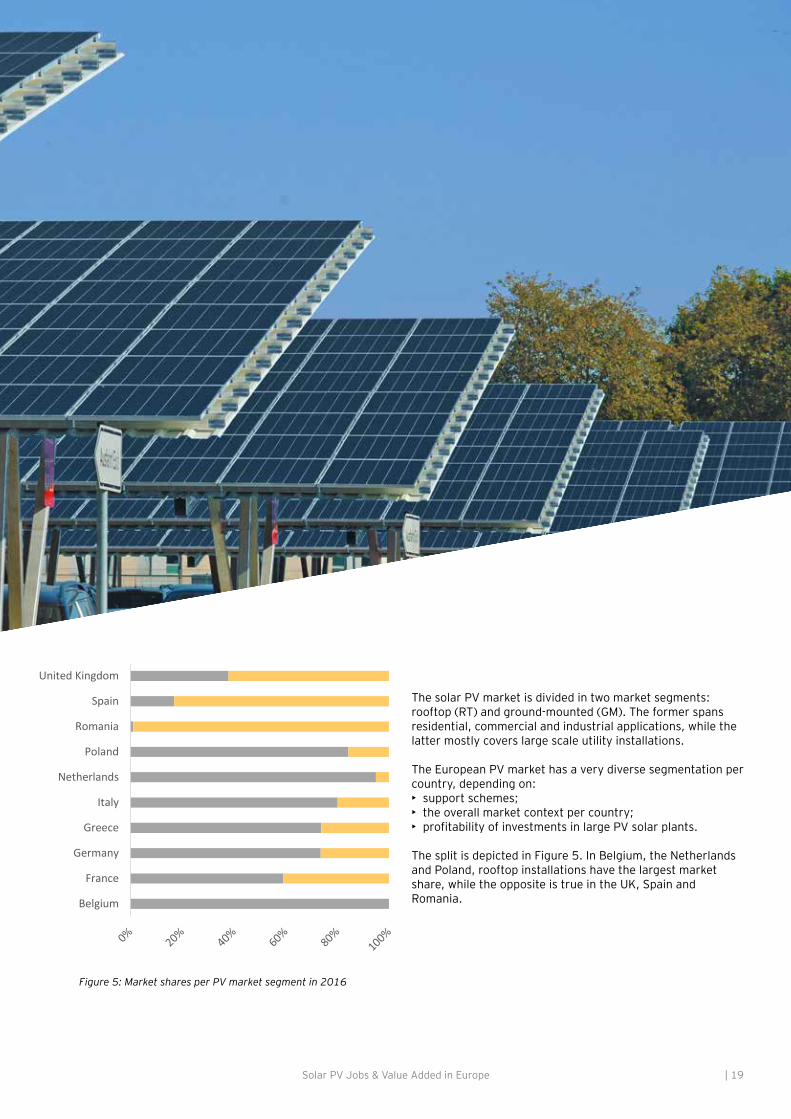
Figure 5: Market shares per PV market segment in 2016
The solar PV market is divided in two market segments: rooftop (RT) and ground-mounted (GM). The former spans residential, commercial and industrial applications, while the latter mostly covers large scale utility installations.
The European PV market has a very diverse segmentation per country, depending on:• support schemes;• the overall market context per country;• profitability of investments in large PV solar plants. The split is depicted in Figure 5. In Belgium, the Netherlands and Poland, rooftop installations have the largest market share, while the opposite is true in the UK, Spain and Romania. Belgium
France
Germany
Greece
Italy
Netherlands
Poland
Romania
Spain
United Kingdom
Rooftop systems Ground-mounted systems
Solar PV Jobs & Value Added in Europe20 |
Initially, the UK solar installations mainly consisted of rooftop panels. However, 2014 represented a tipping point and ground-mounted installations overcame rooftop ones. This is due to recent developments in the renewable obligation certificate (ROC) system. ROCs are aimed at larger projects enabling owners to receive payment for the electricity they produce. There have been gradual cuts since 2014 and even a closure of the system in 2016. This triggered a big rush of installations during the last few years and especially during the first quarter of 2016.
In Spain, high feed-in tariffs and high levels of sun irradiance (in the south of Spain it reaches levels twice as high as those of central Europe) made investments in grid connected large scale solar PV systems very profitable, which resulted in a sharp growth of ground-mounted solar PV installations in 2007-2008. The share of ground-mounted systems in the 2008 installed capacity was almost 90%. However, due to a decrease in feed-in tariffs and a limitation on installed capacity, the share of the ground-mounted segment decreased to around 85% in 2014 before remaining stable until 2016.
In Romania, 99% of solar panels are ground-mounted. This is mainly due to the lack of support mechanisms for households to install rooftop systems as well as low and regulated electricity prices for households. A change could be in view with the 2017 EBRD (European Bank for Reconstruction and Development) decision to launch a loan scheme aiming for Romanian households to invest in renewable energy. Another factor limiting the development of rooftop PV in Romania is the fact that the country does not have any net metering or self-consumption scheme in place. As a result, any excess energy generated by the PV systems cannot be injected into the grid. The generated electricity can only be used for self-consumption. This phenomenon does not stimulate investment in rooftop PV.
Poland does not have stable, attractive support mechanisms in place. Therefore large scale systems are not prioritized in the country and small scale residential rooftop systems represent the biggest share in PV installations. In the near future the growth rate of larger projects is expected to overcome the residential systems’ growth rate. The growth of the latter is expected to remain stable. This is due to a new auction mechanism that was introduced in mid-2016 for larger PV installation of more than 40 kW.
In the Netherlands, the residential market has the biggest share in PV installation, resulting in a 95% share of rooftop PV systems. Large-scale renewables are incentivized in the Netherlands under its biannually awarded SDE+ subsidy program (‘Stimulering Duurzame Energieproductie/Encouraging Sustainable Energy production’). It has awarded new projects over the past year, resulting in a rise of utility scale PV installations which now represent 5% of total installation, compared to only 1% in 2014.
Financial incentives in Italy, such as the introduction of residential tax relief measures, help the development of the rooftop sector. This small-scale sector performs better than the medium and large sectors.
In Greece, two third of the PV market consists of rooftop installations. There have been no changes since 2014 as the cumulated capacity in this country remained more or less the same until 2016.
The important share of rooftop PV in Germany (74%) is mainly due to advanced supporting mechanisms established in the past, such as grants and loans for roof programs. Feed-in tariffs are fixed for the duration of 20 years and are higher for rooftop systems than for ground-mounted ones.
France shows a relatively distributed trend between rooftop and ground-mounted systems in 2016. However before 2012, ground-mounted solar PV installations were only a niche market, showing low competitiveness. Mainly individual PV systems were more attractive than industrial scale installations thanks to high feed-in tariffs. In recent years, this trend progressively reversed as a consequence of the significant decrease of PV panel costs and the perspective of a change in the remuneration of small scale green electricity producers. French authorities continue to encourage ground-mounted installation development in order to achieve the 2019 and 2023 objectives of the Multiannual Energy Plan published in November 2016. Large installations (> 100 kWp are supported with feed-in tariffs up to 500 kWp and with a market-based complementary remuneration beyond.
In Belgium, the ground-mounted market is almost non-existent, as PV installations above 250kW are not efficiently promoted and the purchase price of injected electricity is not high enough to make investments in large solar plants profitable. Solar PV installations below 250kW are supported with ‘green certificates’ and support schemes (e.g. tax incentives and VAT reduction), which explains the high level of residential solar rooftop installations.

Solar PV Jobs & Value Added in Europe | 21
Figure 6: (Direct and indirect) jobs supported by the PV industry in EU28, by market segment (rooftop and ground-mounted)
Figure 7: Gross Added Value (GVA) created by the PV industry in EU28, by market segment (rooftop and ground-mounted)
Figure 6 outlines the split in jobs between the two segments in the EU, with the ground-mounted segment historically supporting more jobs than the rooftop. This result is driven by the installation of around 3 000 MW of ground mounted systems in Spain in 2008. This trend has however reversed and in 2016 rooftop systems are supporting the majority of jobs. Figure 7 shows a similar representation for GVA.
As demonstrated, rooftop PV installations support almost three times as many jobs and GVA than ground-mounted ones in 2016. This can be explained by their installed capacities.
When comparing the annually installed capacity (in MW) for 2016, the capacity of rooftop PV installations was twice as high as ground-mounted ones for the countries included in this study. The most remarkable difference between rooftop and ground-mounted PV installations can be found in Germany, where the installed capacity for rooftop systems is almost 3 times bigger than for ground-mounted systems; which means a difference of more than 19.400MW. In Belgium, practically all PV installations are rooftop systems. In Romania, Spain and Greece, on the other hand, installed capacities for ground-mounted systems were 3.700MW higher than those of rooftop PV systems.
Another important factor is that ground-mounted systems are almost half the price of rooftop systems per MW. Ground-mounted systems, in general, have more MW per installation, which offers the advantage of economies of scale, lowering the unit cost. As installation and maintenance & operations are easier and less time-consuming for ground-mounted systems, these activities have a lower cost per MW. This means that fewer jobs are supported per MW compared to rooftop PV systems.
Unlike PV modules, inverters and Balance of System components (which can be traded on global markets), installation and operations & maintenance activities are entirely sourced locally. Economies of scale, easier installation, improved maintenance and operation directly impact GVA and jobs.
*kWp stands for kW-peak: maximum nominal output of a photovoltaic device under full solar irradiation.
0
50,000
100,000
150,000
200,000
250,000
300,000
350,000
Jobs
(FTE
)
GM
RT
0
2,000
4,000
6,000
8,000
10,000
12,000
14,000
16,000
18,000
GVA
(M€)
GM
RT

Solar PV Jobs & Value Added in Europe22 |
6. Job impact and Gross Value Added per segment of the value chain

Solar PV Jobs & Value Added in Europe | 23
The value chain for PV systems can be split between upstream and downstream activities.
• Upstream activities are the processing of raw materials: manufacturing of polysilicon, wafers, cells, modules, inverters, mounting and tracking systems and electrical components (Balance of System).
• Downstream activities are services provided within the PV industry such as engineering/studies/ administration, installation, operations & maintenance and decommissioning.
In this chapter, firstly jobs and GVA for upstream and downstream activities are compared for 2008, 2016 and 2021. Secondly, a breakdown of upstream and downstream value chain activities for the EU28 is given with the relative shares (%) of total jobs and GVA for 2016. Thirdly, an overview per country is given with the absolute job support and GVA for 2016 and 2021.
There is a strong correlation between jobs created and GVA in the activities of the value chain. Job support and GVA have decreased since 2008 for both upstream and downstream activities, as demonstrated in Figures 8 and 9. However, forecasts indicate that both upstream and downstream job support and GVA will double by 2021 compared to 2016.
The effects on job support and GVA of the current market conditions are visible in downstream activities, where a decrease of more than 66% in GVA and job support is observed between 2008 and 2016. For upstream activities, the effects are of the same order of magnitude, with a decrease of 62% over the same period. This stems from economies of scale and the learning curve, which affect upstream (manufacturing) activities more than downstream (services) activities. On the other hand, downstream activities are more labor intensive.
When comparing the unit cost (€/W) for PV modules (upstream) and installation (downstream) in 2008 and 2016 for example, the relative reduction for PV modules is almost 3 times more important than that of installation. The increase of job support and GVA between 2016 and 2021 will be mainly driven by the acceleration of new installed capacities in most European countries.

Solar PV Jobs & Value Added in Europe24 |
As shown in Figures 10 and 11 FTEs per installed capacity vary between States. In the upstream sector, FTEs per installed capacity arise in particular from national shares of production. Greece, which has the highest ratio, shows an important national share in the manufacturing of BoS components. On the other hand, Poland, which has the lowest ratio, has very low national shares of production of all components of the solar PV panel (module, cell, wafer, BoS, etc…).
Job support and GVA creation upstream and downstream activities
Figure 8: Direct and indirect jobs supported by the PV industry in 2008-2016-2021, by value chain structure (upstream and downstream)
Figure 9: Gross Added Value (GVA) created by the PV industry in 2008-2016-2021, by value chain structure (upstream and downstream)
Figure 10: Number of jobs upstream per MW in 2021, direct & indirect, by country
Figure 11: Number of jobs downstream per MW in 2021, direct & indirect, by country
In the downstream sector, the ratio gives an indication on the workforce intensity of yearly jobs created by engineering and installation activities. For instance, Romania and Greece are characterized by a high downstream FTEs / MW ratio, whereas these activities are less labor intensive in the Netherlands, Germany and France.
0
50,000
100,000
150,000
200,000
250,000
300,000
Jobs
(FTE
)
Upstream
Downstream
0
2,000
4,000
6,000
8,000
10,000
12,000
14,000
GVA
(M€)
Upstream
Downstream
0
1
2
3
4
5
6
7
FTEs
/ M
W
Direct jobs/MW
Indirect jobs/MW
0
1
2
3
4
5
6
7
FTEs
/ M
W
Direct jobs/MW
Indirect jobs/MW
Solar PV Jobs & Value Added in Europe | 25
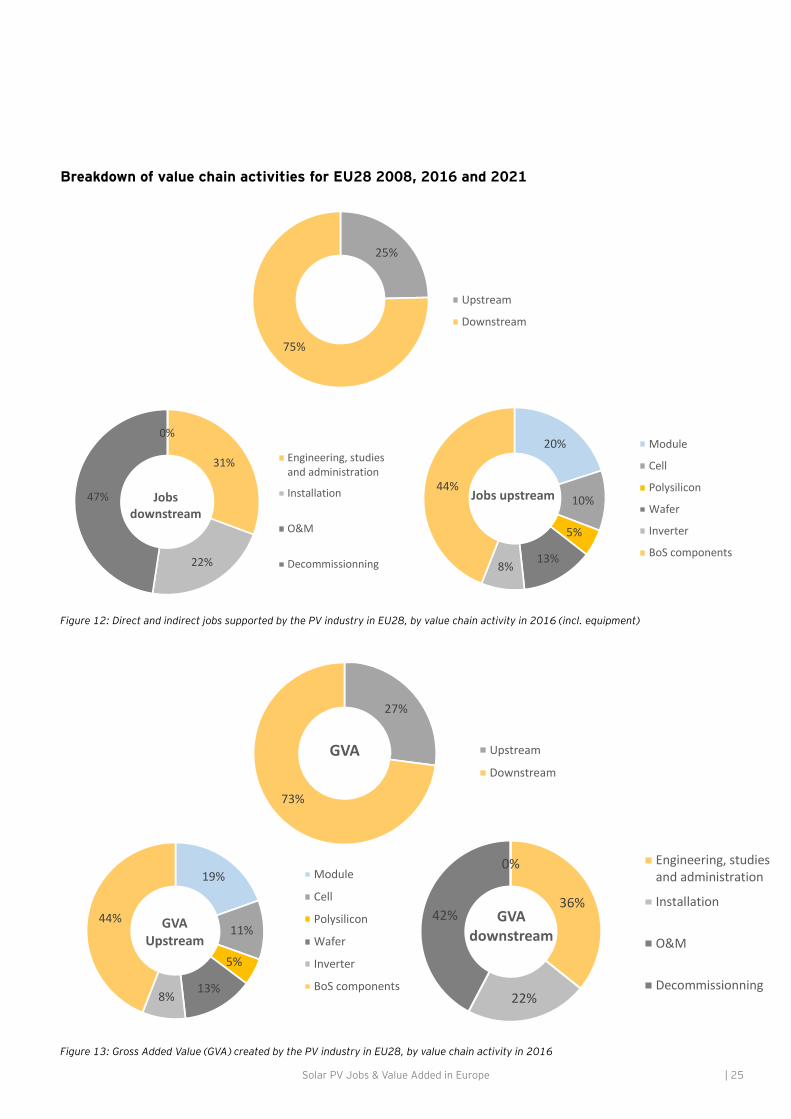
Breakdown of value chain activities for EU28 2008, 2016 and 2021
Figure 12: Direct and indirect jobs supported by the PV industry in EU28, by value chain activity in 2016 (incl. equipment)
Figure 13: Gross Added Value (GVA) created by the PV industry in EU28, by value chain activity in 2016
25%
75%
Upstream
Downstream
31%
22%
47%
0%
Jobs downstream
Engineering, studiesand administration
Installation
O&M
Decommissionning
19%
11%
5%
13%8%
44% GVA Upstream
Module
Cell
Polysilicon
Wafer
Inverter
BoS components
27%
73%
GVA Upstream
Downstream
36%
22%
42%
0%
GVA downstream
Engineering, studiesand administration
Installation
O&M
Decommissionning
20%
10%
5%
13%8%
44%Jobs upstream
Module
Cell
Polysilicon
Wafer
Inverter
BoS components

Solar PV Jobs & Value Added in Europe26 |
In the table below, the share of jobs supported and GVA for the different steps in the value chain are outlined per year.
Share of jobs support and Gross Added Value per step of the value chain per year for EU28
Jobs supported (% total FTE) GVA (% total M€)
2008 2016 2021 2008 2016 2021
Ups
trea
m
Polysilicon 3% 1% 1% 4% 1% 1%
Wafer 1% 3% 2% 2% 4% 2%
Cells 1% 3% 2% 1% 3% 2%
Modules 1% 5% 3% 2% 5% 4%
Inverters 4% 2% 2% 6% 2% 2%
BoS components
6% 11% 15% 8% 12% 16%
Dow
nstr
eam Engineering,
studies, admin.53% 23% 31% 54% 26% 32%
Installation 28% 16% 22% 22% 15% 21%
O&M 1% 36% 22% 1% 31% 20%
In the upstream segment, the majority of jobs and GVA creation will shift from PV modules and inverters to Balance of Systems (BoS) components over the 2016-2021 period. The manufacturing of electrical components (Balance of Systems components) creates 43% of total upstream jobs and GVA in 2016. The relatively high and constant share in job support and GVA can be explained by the lower learning curves for Balance of Systems manufacturing (around 10%) compared to other upstream activities (20%) and a high national share of production compared with the other upstream activities. The manufacturing of Balance of Systems components also holds an important share of total job support and GVA, which will increase as improved and standardized mounting systems shift the system assembly from the field to the factory, resulting in a more efficient installation.
In the downstream segment, engineering, studies and administration services provide the highest job support and GVA in 2008 and 2021, but the share in total job support and GVA creation has decreased compared with 2008. Although all downstream activities have a complete national share, engineering, studies and administration require in general a more specialized and skilled workforce (engineers, consultants, financial specialists,…) and is, as such, less labor-intensive than other downstream activities. The high contribution of engineering activities is then linked to new installed capacities.
The shares of jobs and GVA supported by the installation of solar panels decreased between 2008 and 2016. The growth between 2016 and 2021 is directly correlated with the acceleration of new installed capacities that are foreseen. The share of operations and maintenance for both job support and GVA had a strong growth between 2008 and 2016 and will represent 22% for job support and 20% for GVA creation for the total value chain in 2021. The unit
cost of maintenance and operation per kW is relatively low and remains constant. Job support and GVA is based on the cumulated installed capacity and not on new installed capacity as operation and maintenance services occur during the total life cycle of PV installations.
Jobs and GVA supported by decommissioning services are almost negligible over the 2008 – 2021 period. The PV market being relatively young and considering an average PV system lifetime of 25-30 years, the need for decommissioning, reuse and recycling PV systems is projected to occur around 2020 in Europe, with effect on job creation only visible from 2030 onwards. The unit cost of decommissioning per kW is relatively low but the development of refurbishing and recycling processes will require a more skilled workforce.
Job support and GVA per step of the value chain and per country is very heterogeneous, as installed capacity and production intensity differs from one country to the other. Job support and GVA in downstream activities is systematically higher than that of upstream activities.
As Figure 15 reveals, Germany has the highest number of upstream jobs, which is linked to relatively high national shares of production in Europe for upstream activities compared to other countries. This is one of the reasons why Germany has the highest jobs in 2016, although new installed capacity is more important in the UK (second highest level of jobs). Other countries, such as Belgium, Spain, Greece, Italy, Poland and Romania have low yearly new installed capacities and a low national share of production for upstream activities. This explains the limited number of jobs and GVA in these countries in 2016. Regarding downstream activities and as a consequence of their highest cumulative capacities, a large number of operation and maintenance jobs are supported in Germany and Italy.
Solar PV Jobs & Value Added in Europe | 27
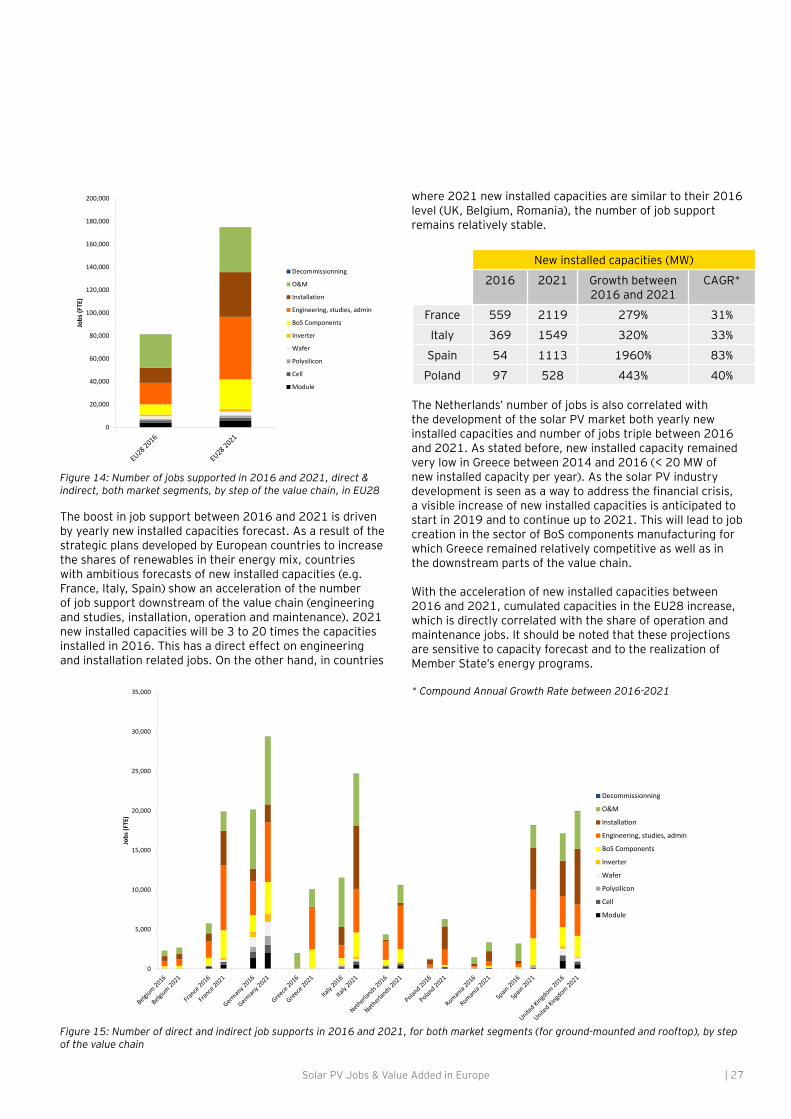
Figure 14: Number of jobs supported in 2016 and 2021, direct & indirect, both market segments, by step of the value chain, in EU28
Figure 15: Number of direct and indirect job supports in 2016 and 2021, for both market segments (for ground-mounted and rooftop), by step of the value chain
The boost in job support between 2016 and 2021 is driven by yearly new installed capacities forecast. As a result of the strategic plans developed by European countries to increase the shares of renewables in their energy mix, countries with ambitious forecasts of new installed capacities (e.g. France, Italy, Spain) show an acceleration of the number of job support downstream of the value chain (engineering and studies, installation, operation and maintenance). 2021 new installed capacities will be 3 to 20 times the capacities installed in 2016. This has a direct effect on engineering and installation related jobs. On the other hand, in countries
0
20,000
40,000
60,000
80,000
100,000
120,000
140,000
160,000
180,000
200,000
Jobs
(FTE
)
Decommissionning
O&M
Installation
Engineering, studies, admin
BoS Components
Inverter
Wafer
Polysilicon
Cell
Module
0
5,000
10,000
15,000
20,000
25,000
30,000
35,000
Jobs
(FTE
)
Decommissionning
O&M
Installation
Engineering, studies, admin
BoS Components
Inverter
Wafer
Polysilicon
Cell
Module
where 2021 new installed capacities are similar to their 2016 level (UK, Belgium, Romania), the number of job support remains relatively stable.
New installed capacities (MW)
2016 2021 Growth between 2016 and 2021
CAGR*
France 559 2119 279% 31%
Italy 369 1549 320% 33%
Spain 54 1113 1960% 83%
Poland 97 528 443% 40%
The Netherlands’ number of jobs is also correlated with the development of the solar PV market both yearly new installed capacities and number of jobs triple between 2016 and 2021. As stated before, new installed capacity remained very low in Greece between 2014 and 2016 (< 20 MW of new installed capacity per year). As the solar PV industry development is seen as a way to address the financial crisis, a visible increase of new installed capacities is anticipated to start in 2019 and to continue up to 2021. This will lead to job creation in the sector of BoS components manufacturing for which Greece remained relatively competitive as well as in the downstream parts of the value chain.
With the acceleration of new installed capacities between 2016 and 2021, cumulated capacities in the EU28 increase, which is directly correlated with the share of operation and maintenance jobs. It should be noted that these projections are sensitive to capacity forecast and to the realization of Member State’s energy programs.
* Compound Annual Growth Rate between 2016-2021

Solar PV Jobs & Value Added in Europe28 |
7. The impact of a higher Renewable Energy target on the European solar industry
Solar PV Jobs & Value Added in Europe | 29
EU countries have agreed on a new renewable energy (RE) target of at least 27% of gross final energy consumption in the EU as a whole by 2030. This is part of the EU’s energy and climate goals for 2030. This RE target is associated with a 30% energy efficiency (EE) objective by 2030. However, other scenarios and objectives are being investigated to enforce the commitments made during the COP21 and account for updated technology costs. This report evaluates in particular the potential number of jobs supported by the PV industry if a 35% share of renewable energy in the gross final energy demand of EU28 (associated with a 33% energy efficiency target) is achieved compared to the 27%.
Solar PV Jobs & Value Added in Europe30 |
Job support modeling in 2020 is based on the results of this study, while the two forecasts for 2030 are based on REF16 scenario data elaborated by the European Commission (DG ENER, CLIMA, MOVE) and the Joint Research Center (JRC). Hypotheses for the 35% RE target extrapolation are detailed in the main sources and assumptions chapter.
To reach the 27% RE target, thePV market would need to increase from 100 GW in 2016 to 210 GW in 2030. Thereby solar would contribute to about 7% of the electricity demand. Consequently, upstream and downstream jobs supported by the PV industry are expected to increase by 50% which will represent around 215,000 jobs.
In case a 35% RE target is set, 118 GW of additional capacities will be required (328 GW in total) such that solar energy would contribute about 10% of the electricity demand (source: SolarPower Europe low scenario). Job support will increase by 56% compared to 27% RE target scenario and by a factor of 1.6 compared to 2020 (around 335,000 jobs in total).
In both cases, the increase is linked to the installation of new capacities needed to achieve the objectives. Moreover, with the development of refurbishing and recycling activities (not included in the modeling), the growth of the downstream segment will be even more significant.
Taking a technology neutral perspective on the job effects of various RE and EE scenarios, Fraunhofer Institute finds that a 35% RE target along with a 45% GHG emission reduction would increase employment in the renewable energy sector by 2.1 million in 2030 when compared to 2011.
On the other hand, a 30% RE and 33.7% EE scenario, which Fraunhofer states to be very similar to a 27% RE and 27% EE target – being close to what is currently proposed – would lead to a job increase of only 1.6 million compared to 2011. As such, the difference of about 500,000 jobs in the study conducted by Fraunhofer confirms the results and the order of magnitude of the present study focused on the solar PV industry.
(Fraunhofer ISE “Employment and growth effects of sustainable energy in the European Union”, 2014).

Solar PV Jobs & Value Added in Europe | 31
Figure 16: Jobs supported in 2030 in EU28-renewables energy targets of 27% and 35%
Figure 17: GVA in 2030 in EU28 - renewables energy targets of 27% and 35%
0
50,000
100,000
150,000
200,000
250,000
300,000
350,000
2020 2030 - 27%RE target
2030 - 35%RE target
Jobs
(FTE
)
FTE downstream
FTE upstream
0
2,000
4,000
6,000
8,000
10,000
12,000
14,000
16,000
18,000
20,000
2020 2030 - 27%RE target
2030 - 35%RE target
GVA
(M€)
GVA downstream
GVA upstream

Solar PV Jobs & Value Added in Europe32 |
8. The impact of Trade Defence Measures for Modules and Cells on the European Solar industry
Solar PV Jobs & Value Added in Europe | 33
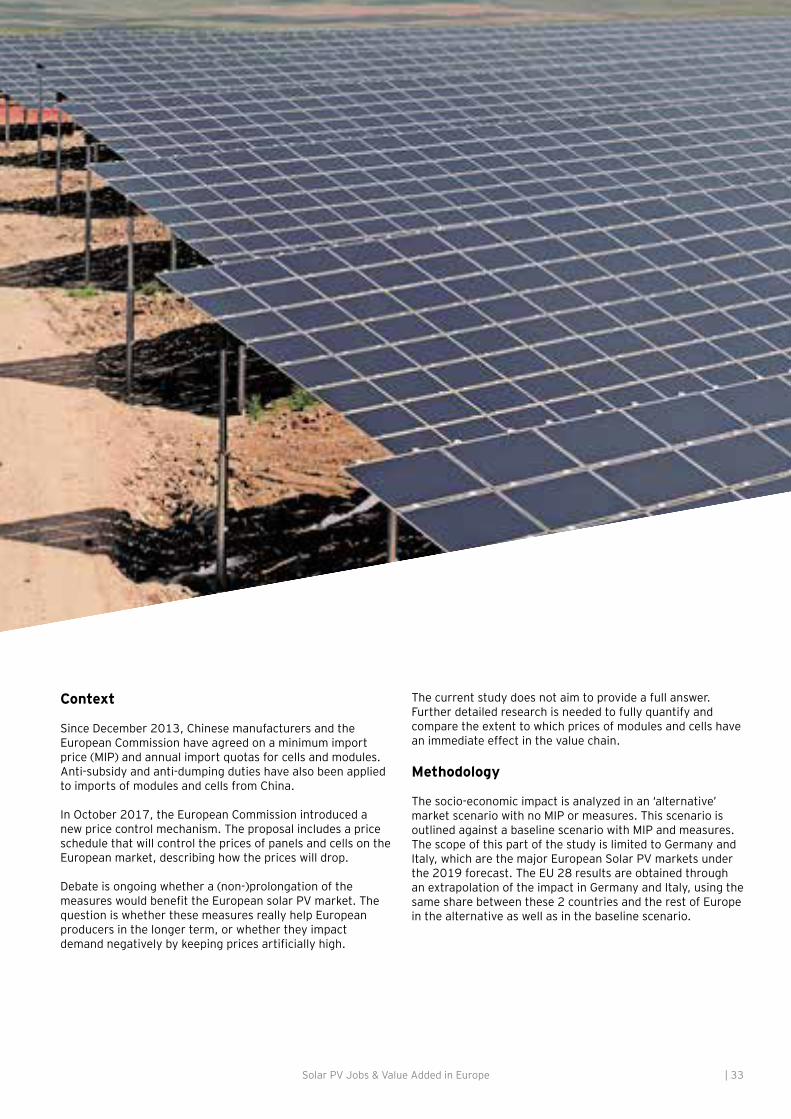
Context
Since December 2013, Chinese manufacturers and the European Commission have agreed on a minimum import price (MIP) and annual import quotas for cells and modules. Anti-subsidy and anti-dumping duties have also been applied to imports of modules and cells from China.
In October 2017, the European Commission introduced a new price control mechanism. The proposal includes a price schedule that will control the prices of panels and cells on the European market, describing how the prices will drop.
Debate is ongoing whether a (non-)prolongation of the measures would benefit the European solar PV market. The question is whether these measures really help European producers in the longer term, or whether they impact demand negatively by keeping prices artificially high.
The current study does not aim to provide a full answer. Further detailed research is needed to fully quantify and compare the extent to which prices of modules and cells have an immediate effect in the value chain.
Methodology
The socio-economic impact is analyzed in an ‘alternative’ market scenario with no MIP or measures. This scenario is outlined against a baseline scenario with MIP and measures. The scope of this part of the study is limited to Germany and Italy, which are the major European Solar PV markets under the 2019 forecast. The EU 28 results are obtained through an extrapolation of the impact in Germany and Italy, using the same share between these 2 countries and the rest of Europe in the alternative as well as in the baseline scenario.

Solar PV Jobs & Value Added in Europe34 |
More installed capacities, lower unit prices
The immediate estimated effect of the expiry of the measures is a linear increase in installed capacities from 2016 to 2019, back to the level they were prior to the implementation of the anti-dumping duties. This reflects the fact that price competition from Asia lowers the prices and makes solar PV economically more attractive. Unit costs for modules and cells are indeed expected to decrease, with unit costs for modules (-52%) falling more significantly than that of cells (-19%). These percentages are based on the average difference between the global market prices and the 2017 prices under the EU trade defence measures.
The extent to which price decreases of modules have an immediate effect on demand is however subject to specific factors:
• Firstly, price decreases are a natural market development brought about by cost reductions, higher efficiencies and economies of scale. They are thus expected in the future – regardless of protective market measures.
• Secondly, the European solar industry might choose not to pass on the price decreases of modules and cells in their sales prices because it is economically challenged, although there will be pressure to pass the savings on because the tenders under the European Commission State Aid Guidelines suggest prices will become even more important for installations in Europe.
• Thirdly, demand is stimulated not only by lower system costs for modules and cells, which have much more opportunity for price decreases, but also by cost decreases in other parts of the value chain – such as for Balance of System costs.
• Last but not least, demand proves also to be dependent on other factors, such as government support. The evolution of those support schemes is not taken into consideration in the current analysis. Also developments in electricity prices and changes in demand structures induced by increased electrification (for example due to electric driving) are not included in the analysis.
The alternative scenario also relies on a decrease of national shares of production, estimated at 5% for production of modules and cells 2019 in the alternative versus the baseline scenario.
Despite the decrease in domestic market shares for modules, results show that there is a positive impact on job creation throughout the value chain in 2019 if the trade defence measures are removed. In total 8,500 extra jobs would be created in Germany and nearly 14,000 extra jobs in Italy in 2019 in this market scenario, resulting in a total of more than 22.300 extra jobs for the two main European markets in Solar PV in 2019. This accounts for a total creation of 65,000 jobs for Germany and Italy in the alternative scenario
Alternative scenario without MIP - jobs created compared to the baseline scenario for Germany and Italy in 2019
Figure 18: Market scenario without MIP - jobs created in Germany and Italy in 2019
0
2,000
4,000
6,000
8,000
10,000
12,000
14,000
16,000
FTEs
Indirect jobs
Direct jobs

Solar PV Jobs & Value Added in Europe | 35
A breakdown of the direct and indirect job impacts – upstream, downstream and totals – cumulative for Germany and Italy in the alternative scenario:
Direct FTEs Indirect FTEs
Total jobs created upstream 2019
9,250 8,200
Total jobs created downstream 2019
30,500 17,000
Total jobs created in 2019
40,000 25,000
This evolution is most visible in the downstream phase and especially the Operations and Maintenance phase, as the downstream portion of the value chain is undertaken with local companies with higher intensity ratios per M€ spent than in the upstream phase. 6,600 jobs in Operations & Maintenance and 8,600 jobs in Engineering would be supported in 2019 in this scenario.
Alternative scenario without MIP - jobs created compared to the baseline scenario for EU 28 in 2019
The results for the EU28, although on a larger scale, follow the same logic as for its 2 major markets. A net total of 45,500 extra jobs would be created in the EU28 in this market scenario (no MIP / increased installed capacities / decreased unit costs and national share of production) compared to the baseline scenario in 2019. This accounts for a total job creation of 178,600 jobs in the alternative scenario.
75% of the additional job creation is in the downstream phase. Engineering accounts for the majority of the job creation: 30%. Operations and Maintenance account for 25% of the total job creation in the EU28.
A breakdown of the direct and indirect job impacts – upstream, downstream and totals – for the EU28 in the alternative scenario:
Direct Indirect
Total jobs created upstream 2019
23,600 20,300
Total jobs created downstream 2019
94,300 40,400
Total jobs created in 2019
117,900 60,700
Conclusion
Results from the 2 countries under analysis and the extrapolation to the EU28 show it is likely that the lower system prices resulting from the expiry of the MIP would result in more demand at consumer level and consequently more employment in the European solar PV market – throughout the value chain and especially downstream. The model shows that there are limited negative employment effects for EU manufacturers of modules and cells on the short term, but that these would be counterbalanced by the positive employment effects in the value chain, especially downstream. Removing the MIP would thus have a positive employment effect in the value chain resulting from higher demand.
Figure 19: Market scenario without MIP - jobs created in EU28 in 2019
05,000
10,00015,00020,00025,00030,00035,00040,00045,00050,00055,000
FTEs
Indirect jobs
Direct jobs

Solar PV Jobs & Value Added in Europe36 |
Annex - Main sources and assumptions used in the model

Solar PV Jobs & Value Added in Europe | 37
The Input-Output model used in this study is based on three categories of data: PV system prices - spending in national economies are used as job creation and Value Added vectors, installed PV capacities, and national shares of production.
This chapter details the key data sources and assumptions for the main parameters used in the model.

Solar PV Jobs & Value Added in Europe38 |
System prices:
• Value chain: 1. Aggregated system prices of modules, cells, polysilicon
and wafers are based on:• Own research of SolarPower Europe in 2013 and 2017• Cost Maps for Unsubsidised Photovoltaic Electricity’,
Joint research center’ for 2013-2014.• Data of ADEME ‘Marches et emplois lies a l’efficacité
énergétique et aux energies renouvelables’ for 2008-2014 (installation separately).
• GTM Research report on the Polysilicon Capacity Growth to Accelerate, Enabling 85GW of Solar Panel Production in 2016.
2. System prices of inverters are similar for all European countries and are based on:• European PV Technology and Innovation Platform
Steering Committee PV LCOE and Competitiveness Working Group, Final report 29.3.2017
3.Cost of BoS, Egineering/ studies/ administration,Installation:
• IRENA (2016), ‘The Power to Change: Solar and Wind Cost Reduction Potential to 2025’
4.Cost of Operation and maintenance:• ‘Cost Maps for Unsubsidised Photovoltaic Electricity’,
Joint research center’ for 2013-2014.• Data of ADEME ‘Marches et emplois lies a l’efficacitéata
of ADEME ‘Marches et emplois lies a l’efficacité énergétique et aux energies renouvelables’ for 2008-2014 (installation separately).
• G.Masson & C.Breyer, ‘True Competitiveness Of Solar PV - A European Case Study’ (May 2017)
• European PV Technology and Innovation Platform Steering Committee PV LCOE Competitiveness Working Group, Final report 29.3.2017
5.Cost of Decommissioning: • IRENA and IEA-PVPS (2016), “End-of-Life
Management: Solar Photovoltaic Panels,” • IRENA (2017), Renewable energy benefits: Leveraging
local capacity for solar PV• (Financial) lifetime of 25 years for solar systems is used. • Regression was used to forecast system prices over
the 2014-2021 period. Mostly exponential and power regressions were used. Choices of regression were based on best fit (R²) with existing data and prices with normal ‘levelling’ evolution for later years. For Greece: no system prices for ground-mounted were available, this information was therefore based on the ground-mounted/commercial proportion for Spain, Italy and France.
• Market shares for Residential, Commercial/industrial and Ground-Mounted are mostly based on IEA data (annual reports). By means of interview with local experts, missing data was estimated. For some countries 2008-2011 time series were not available, in these case data was completed using linear regression. Market shares for 2014-2021 are based on cumulative capacities provided by SolarPower Europe.
Capacities:
• Annual and cumulative capacities per country are based on SolarPower Europe’s GMO study 2017-2021.
• Load factors (measure of the functioning hours of Solar PV units/plants) are calculated for 2008-2015 by dividing the [energy (MWh)] with [cumulated installed capacity (MW)] * 8.760h per year. Data is based on BMI-research for installed capacity and generated power (2008-2015). Load factors for 2016-2021 are based on IEA - Projected Costs of Generating Electricity, 2015 edition.
National shares of production:
Some national shares of production were difficult to assess and have therefore been estimated based on: qualitative information gathered through interviews with experts in national sector associations and manufacturers.
Indirect jobs and GVA impacts:
Indirect impacts in each segment of the value chain are calculated using national input-output tables sourced from Eurostat. Each of the CAPEX and OPEX segments of the value chain is assimilated to one of the 65 sectors of the input-output tables. Module manufacturing is paired with “Electrical Equipment” (NACE code C27) as per Eurostat’s classification; Silicon manufacturing is paired with “Other non-metalic products” (NACE code C23); engineering services are paired with “Architectural and engineering services; technical testing and analysis services” (NACE code M71); operations and maintenance, installation and decommissioning are paired with “Repair and installation services of machinery and equipment” (NACE code C33).
Renewable Energy target:
Job support modeling in 2030 is based on the REF16 scenario elaborated by the European Commission (DG ENER, CLIMA, MOVE) and the JRC.• Modelling of job support in 2030 with 27% RE target: as
REF16 scenario of year 2040 anticipates that a 27.2% of RE in the EU gross final energy consumption is achieved (meaning that solar approximately contributes to 7% of the electricity demand), corresponding solar PV installed capacities are used.
• Modelling of job support in 2030 with 35% RE target: Solar PV installed capacities are derived by assuming a 10% share of solar PV in the electricity demand, in line with the low scenario of possible solar PV contribution to EU-28 electricity demand by 2030 (‘Global Market Outlook for Solar PV 2016-2020’ published by SolarPower Europe in 2016).

Solar PV Jobs & Value Added in Europe | 39
The report was conducted on behalf of SolarPower Europe, who thank the following organisations for their committment.
EY | Assurance | Tax | Transactions | Advisory
About EY
EY is a global leader in assurance, tax, transaction and advisory services. The insights and quality services we deliver help build trust and confidence in the capital markets and in economies the world over. We develop outstanding leaders who team to deliver on our promises to all of our stakeholders. In so doing, we play a critical role in building a better working world for our people, for our clients and for our communities.
EY refers to the global organization and/or one or more of the member firms of Ernst & Young Global Limited, each of which is a separate legal entity. Ernst & Young Global Limited, a UK company limited by guarantee, does not provide services to clients.
For more information about our organization, please visit ey.com.
© 2017 EYGM Limited.All Rights Reserved.
ey.com/be
EY Cleantech and Sustainability services
Climate change and sustainability and its environmental, social and economic impact continue to rise on the agendas of governments and organizations around the world. As cleantech enables the transformation of a variety of industries, old and new, to be part of a more resource-efficient and low-carbon economy, we see innovation in technology, business models, financing mechanisms, cross-industry partnerships and corporate adoption. EY Cleantech and Sustainability services offer a worldwide team of professionals who understand the business dynamics and are committed to helping you realize the potential and address the challenges of the many opportunities arising in this space. Our cleantech service identifies how your business can align with climate change and sustainability opportunities, by incorporate sustainable actions into business. Our global, multidisciplinary team combines our core experience in assurance, tax, transactions and advisory with climate change and sustainability skills and deep industry knowledge.
EY contacts:
Céline De [email protected]
Olivier [email protected]
Alexis [email protected]