solar energy markets || finance and venture capital
TRANSCRIPT
Solar Energy Markets. DOI: © 2014 Elsevier Inc. All rights reserved.2014
http://dx.doi.org/10.1016/B978-0-12-397174-6.00004-0
Finance and Venture Capital4Venture capital and other high-risk startup funding are important components for the development and deployment of all new technologies. From both global and US perspectives, IT remains the largest recipient of venture capital, however, renewable energy technologies have made incredible strides over the past 10 years. In 2001, US companies received a modest $458 million invested by venture capital firms, only 1.2% of all Venture Capital (VC) funding in that year. In 2011, by contrast, nearly $6.6 billion were invested in US firms, a startling rise to over 23% of the total VC investment in that year.1
However, the path has not been even and 2012 was a down year for venture capital generally, and particularly sour for renewable energy and solar technologies. From a high of nearly $6.6 billion in 2011, US renewable energy venture capital dropped more than 20% to just over $5 billion, still a large historical increase, and down to only 19% of all venture capital invested.2
The future for US venture capital may not be terribly bright in the short term, as investors seek investments with fewer risks or shorter life cycles. For many, the sting of Solyndra, Evergreen, and A-123 systems are all too near and the lack of an Amazon-sized or Google-sized blockbuster remains elusive.
Like any high-tech industry, finance and venture capital play an important role in research, development, and deployment of technologies. In the solar sector, however, finance trends also impact construction and implementation of solar energy systems. While interrelated, these different finance options have specific and unique trends, pressure points, and mechanisms. This chapter will address R&D funding first, fol-lowed by a summary of global project capital forecasts.
Research, Development, and Deployment
The United States remains a global leader in innovation and its experience with the IT/software industry has significantly impacted its prioritization of capital flows vis-à-vis the rest of the world. The two main sources of private investment are venture capital and private equity firms. These firms invest in small, growth companies and buffer their high failure rates with explosive returns on the winners. This high-risk, high-reward system has worked extraordinarily well in the consumer goods market as it responds to a persistent drive towards innovative new products.
Renewable energy and solar in particular have not performed as well as their IT counterparts for many private finance firms, which are having a downward impact on
2 CleanEdge 2013.
1 CleanEdge 2012.
Solar Energy Markets30
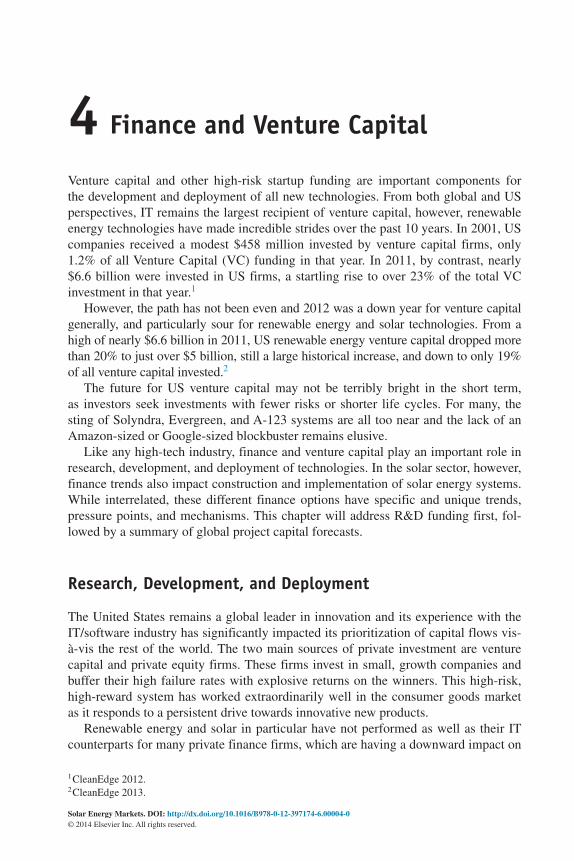
the innovation industry. A recent analysis by the NREL demonstrates the starkly dif-ferent philosophies in the United States, Europe, and China.3
2005 2006 2007 2008 2009 2010 2011*
6
5
Inve
sted
fund
s ($
bill
ion)
4
3
2
1
0China Europe
Solar manufacturing facilities*Through 9/7/11
Venture capital and private equity in solar
ROW UnitedStates
China Europe ROW Unitedstates
As can be seen in the figure above, the United States is significantly outpacing the rest of the world in R&D financing, but is way behind its competitors in investing in manufacturing (though declines in those nations suggest that the United States is coming closer to par).
Ultimately, the price curve and affordability of traditional photovoltaics are limit-ing the profit motive for investing in new technologies. With rapid declines in prices pushing the technology to near parity with fossil-fuel generated electricity, the jus-tification for developing costly new alternatives, while more efficient, might take years to be cost-competitive. In other words, it is becoming increasingly harder to find companies willing to fund the quest to build a better mousetrap.
At the same time, however, market leaders in noncrystalline (e.g., thin film) tech-nologies are ramping up their internal R&D spend, however, much of the focus is still on efficiency in the manufacturing process rather than development of new technologies.
2012 was the first year in a decade of declining global investment in renewables, down to $244 billion, or 12% lower than 2011 record ($279 billion invested).4 This is a figure still higher than 2010 by nearly 8%.
While the decline is interesting in its own right, the difference between 2011 and 2012 is more starkly evident when reviewing the shift of energy investment by tech-nology. For renewables overall, this was a marked shift from developed economies to developing ones. Specifically, investment in renewables was down 29% in 2012 in
3 http://www.nrel.gov/director/pdfs/anu_public_lecture_10312011.pdf.4 Frankfurt School, UNEP Collaborating Centre, and Bloomberg New Energy Finance. Global Trends in Renewable Energy Investment 2013. Available from http://www.unep.org/pdf/GTR-UNEP-FS-BNEF2.pdf.
Finance and Venture Capital 31
developed countries, while growing by 19% in developing ones.5 This trend was espe-cially stark in countries with policy uncertainty, such as the United States and Spain.6
Much of this shift was driven by China. After generally mirroring the United States in renewable energy investments over the past several years, in 2012 China asserted its dominance, increasing its overall investments by 22%—and primarily in solar activities. This shift to China with a further shift from production to installation as well as declining PV prices led to an overall increase in solar capacity despite an 11% global decline in solar investment in 2012.7
Private Investment Trends
Private investment trends are important to understand the future of the industry because capital tends to flow to the areas of greatest impact. It is important to keep in mind, however, that private investments only show once slice of the total, as many managed economies like China have seen enormous public investments in the solar industry over the last decade. These investments are covered following the data on private investments.
While understanding the various technologies is important to forecasting trends, even more important is analysis by stage. These stages include the following categories:
● Concept: This phase refers when a company’s product, service, or technology is still in a planning or design phase.
● Product development: This phase refers to when a company is actively pursuing develop-ment/prototyping of alpha, beta, pilot, or commercial offering of its product, service, or technology but has not yet achieved customer traction.
● Shipping product/pilot: In this phase, a company has moved from product, service, technol-ogy design and development stage and has demonstrated initial customer traction or pilot deployments with strategic partners.
● Wide commercial availability: In the final phase, a company’s product, service, or technol-ogy is widely available to the target market via commercial channels.8
Global Investments
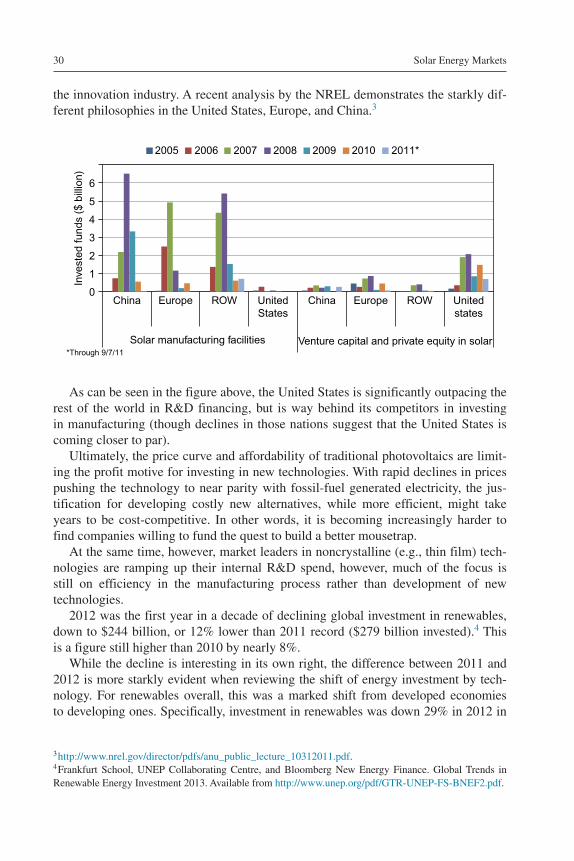
Overall, global solar investment from 2007 to 2012 has been record breaking. Over that period, there have been 1283 private investment deals with a total of value of $44,661,340,063. These have been most frequently funded to firms that already have commercially available products across the globe, as seen in the figure below.
5 id. at p. 11.
8 Cleantech Group’s i3 Platform.
7 id.
6 id.
Solar Energy Markets32
23 180 286 605$1018 $779
$7839
$30,100
Concept Productdevelopment
Shippingproduct/pilot
Wide commercialavailability
Deals
Investment $ millions
Global private investment, 2007–2012, by type, in millions.
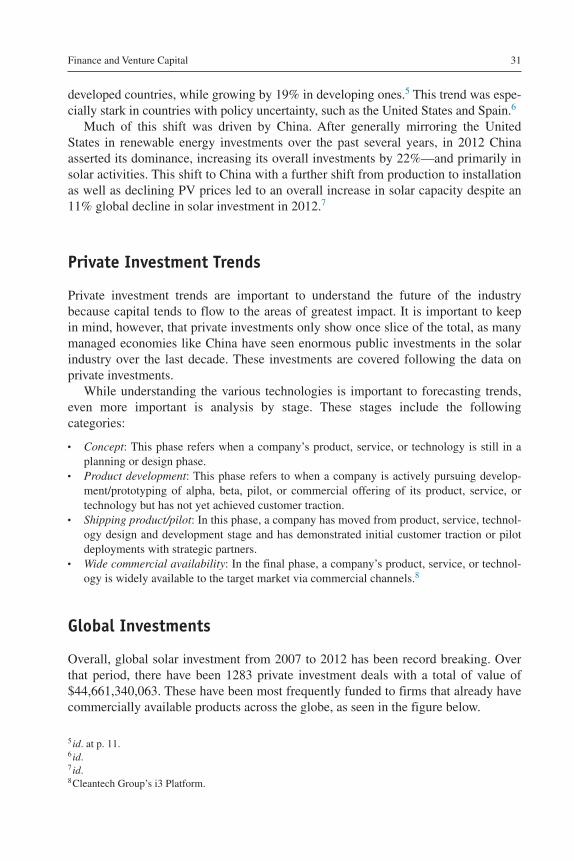
Most of the investment during the period occurred during 2011 and 2012. As verified from other sources and trends, the 2012 declines do not look as precipitous when compared to previous years.
$2099
$5819
$2566
$4473
$15,974
$13,429
2007 2008 2009 2010 2011 2012
Global private investment, in millions.
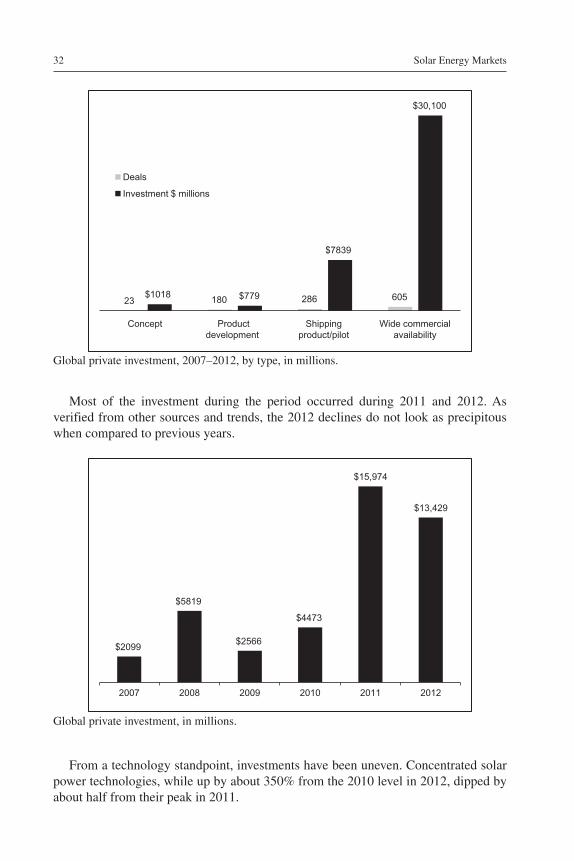
From a technology standpoint, investments have been uneven. Concentrated solar power technologies, while up by about 350% from the 2010 level in 2012, dipped by about half from their peak in 2011.
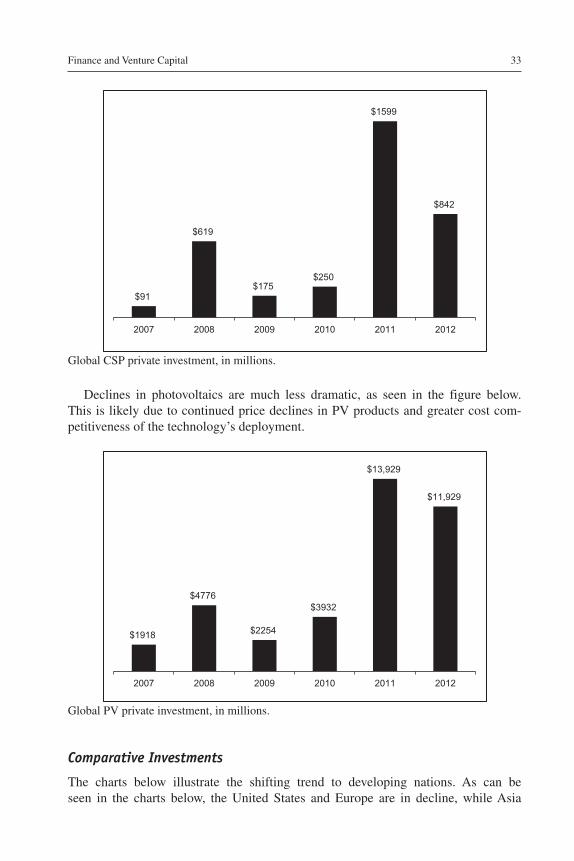
Finance and Venture Capital 33
$91
$619
$175 $250
$1599
$842
2007 2008 2009 2010 2011 2012
Global CSP private investment, in millions.
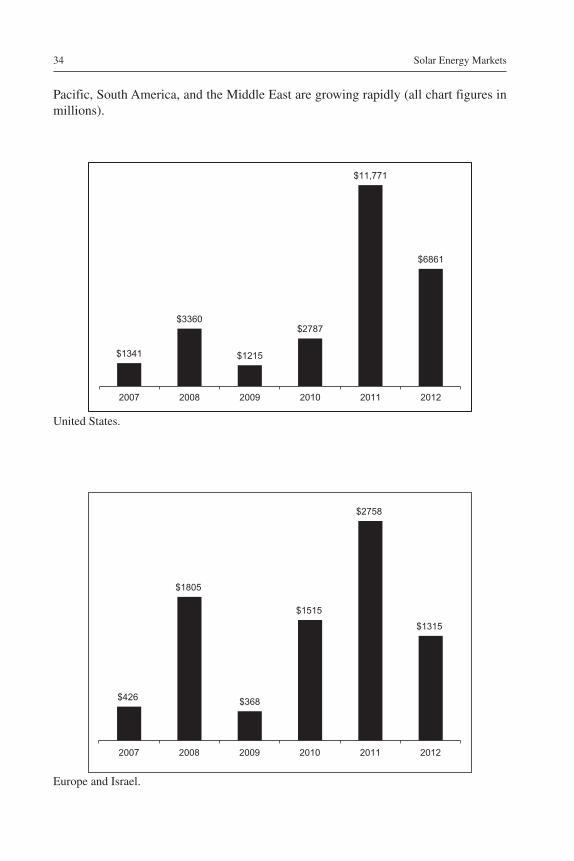
Declines in photovoltaics are much less dramatic, as seen in the figure below. This is likely due to continued price declines in PV products and greater cost com-petitiveness of the technology’s deployment.
$1918
$4776
$2254
$3932
$13,929
$11,929
2007 2008 2009 2010 2011 2012
Global PV private investment, in millions.
Comparative Investments
The charts below illustrate the shifting trend to developing nations. As can be seen in the charts below, the United States and Europe are in decline, while Asia
Solar Energy Markets34
Pacific, South America, and the Middle East are growing rapidly (all chart figures in millions).
$1341
$3360
$1215
$2787
$11,771
$6861
2007 2008 2009 2010 2011 2012
United States.
$426
$1805
$368
$1515
$2758
$1315
2007 2008 2009 2010 2011 2012
Europe and Israel.
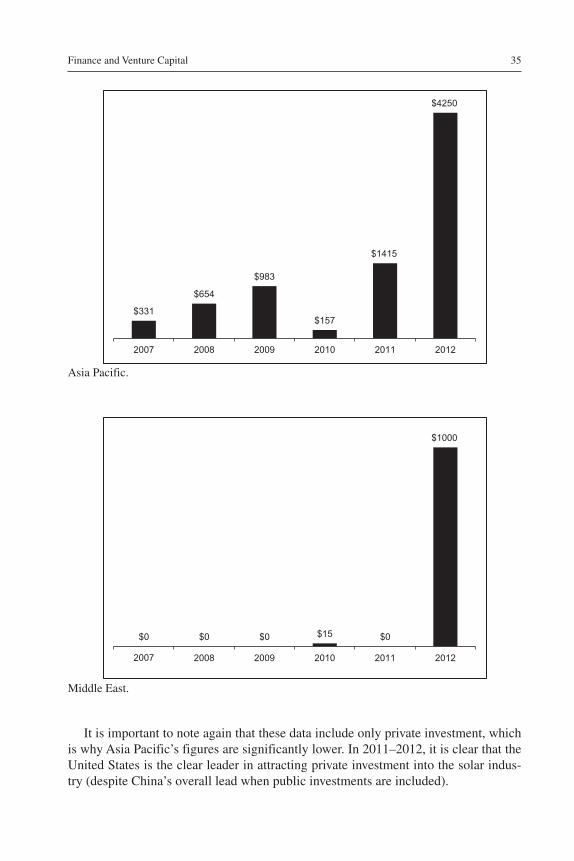
Finance and Venture Capital 35
$331
$654
$983
$157
$1415
$4250
2007 2008 2009 2010 2011 2012
Asia Pacific.
$0 $0 $0 $15 $0
$1000
2007 2008 2009 2010 2011 2012
Middle East.
It is important to note again that these data include only private investment, which is why Asia Pacific’s figures are significantly lower. In 2011–2012, it is clear that the United States is the clear leader in attracting private investment into the solar indus-try (despite China’s overall lead when public investments are included).

Solar Energy Markets36
$4 $30 $1000
$4073
$5665
$18,632
Africa Central/SouthAmerica
Middle East Europe andIsrael
Asia Pacific North America
Private solar investment, 2007–2012, in millions.
United States
Solar firms in the United States received nearly $27 billion ($26,716,373,939) in pri-vate financing between 2007 and 2012 in over 700 investment deals. Most of this funding came for later-stage firms, as seen below.
14 126 199 377$14 $479
$5428
$19,492
Concept Productdevelopment
Shippingproduct/pilot
Wide commercialavailability
Deals
Investment $ millions
US solar investment, 2007–2012, by type, in millions.
Private solar investment spiked in 2011 followed by sharp decline in 2012. Despite the decline, it is still significantly higher than in 2010.
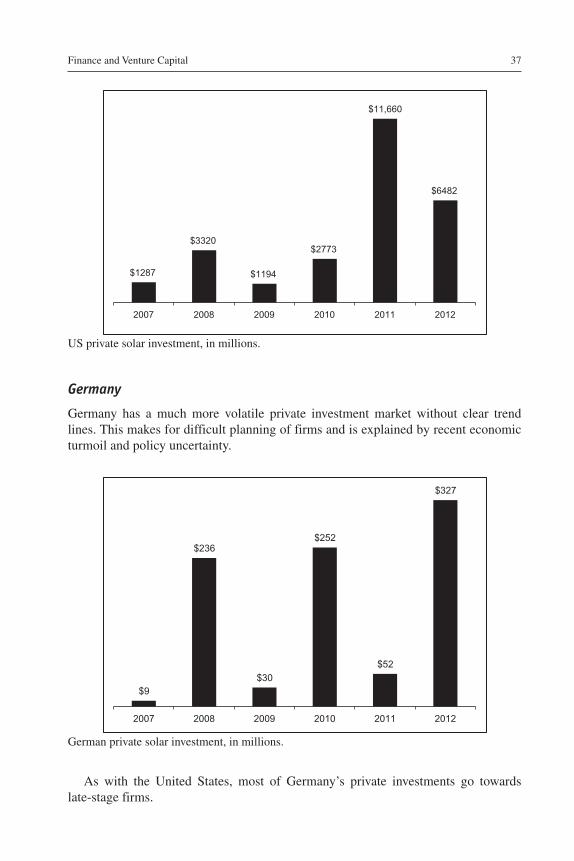
Finance and Venture Capital 37
$1287
$3320
$1194
$2773
$11,660
$6482
2007 2008 2009 2010 2011 2012
US private solar investment, in millions.
Germany
Germany has a much more volatile private investment market without clear trend lines. This makes for difficult planning of firms and is explained by recent economic turmoil and policy uncertainty.
$9
$236
$30
$252
$52
$327
2007 2008 2009 2010 2011 2012
German private solar investment, in millions.
As with the United States, most of Germany’s private investments go towards late-stage firms.
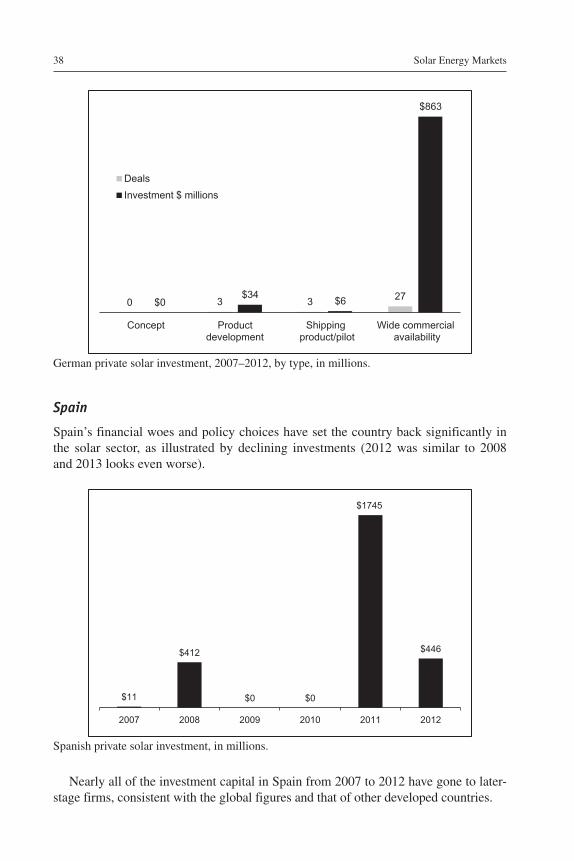
Solar Energy Markets38
0 3 3 27$0
$34 $6
$863
Concept Product development
Shipping product/pilot
Wide commercial availability
Deals
Investment $ millions
German private solar investment, 2007–2012, by type, in millions.
Spain
Spain’s financial woes and policy choices have set the country back significantly in the solar sector, as illustrated by declining investments (2012 was similar to 2008 and 2013 looks even worse).
$11
$412
$0 $0
$1745
$446
2007 2008 2009 2010 2011 2012
Spanish private solar investment, in millions.
Nearly all of the investment capital in Spain from 2007 to 2012 have gone to later-stage firms, consistent with the global figures and that of other developed countries.
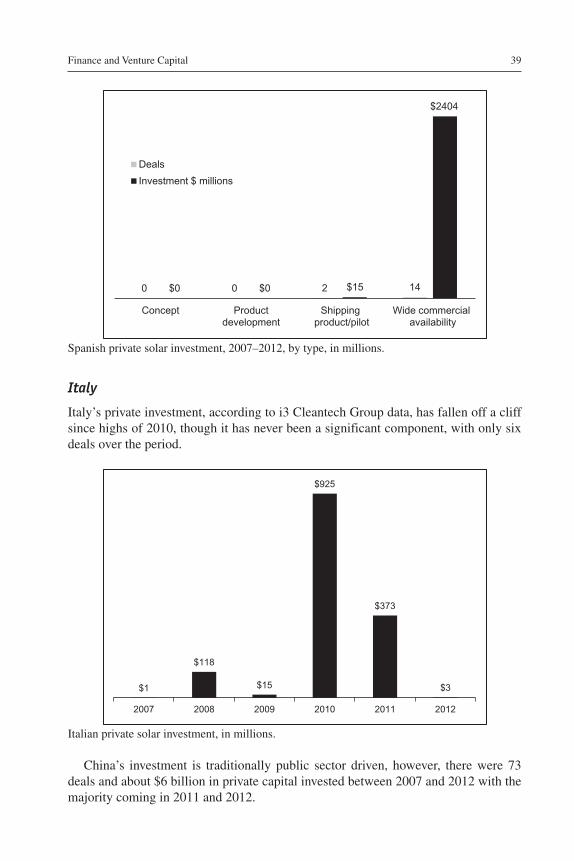
Finance and Venture Capital 39
0 0 2 14$0 $0 $15
$2404
Concept Productdevelopment
Shipping product/pilot
Wide commercial availability
Deals
Investment $ millions
Spanish private solar investment, 2007–2012, by type, in millions.
Italy
Italy’s private investment, according to i3 Cleantech Group data, has fallen off a cliff since highs of 2010, though it has never been a significant component, with only six deals over the period.
$1
$118
$15
$925
$373
$3
2007 2008 2009 2010 2011 2012
Italian private solar investment, in millions.
China’s investment is traditionally public sector driven, however, there were 73 deals and about $6 billion in private capital invested between 2007 and 2012 with the majority coming in 2011 and 2012.
Solar Energy Markets40
$231 $441
$156 $88
$1059
$3892
2007 2008 2009 2010 2011 2012
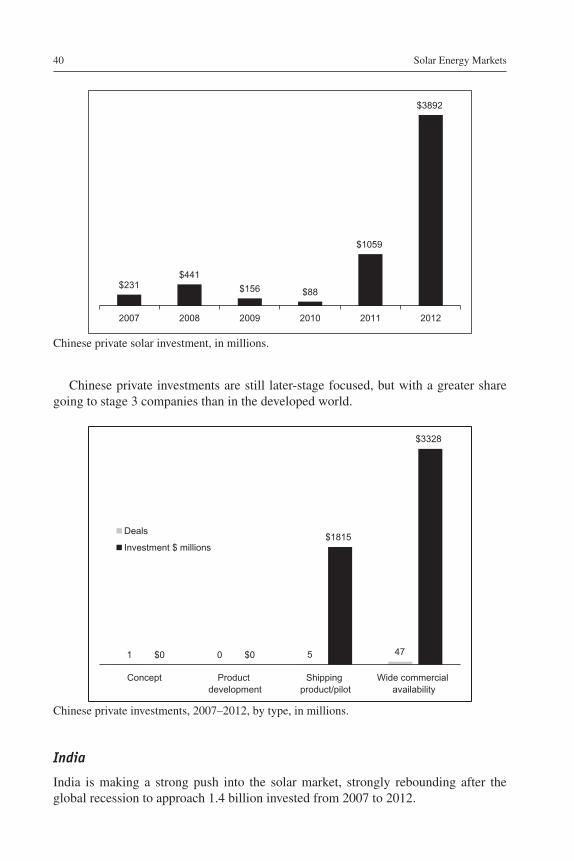
Chinese private solar investment, in millions.
Chinese private investments are still later-stage focused, but with a greater share going to stage 3 companies than in the developed world.
1 0 5 47$0 $0
$1815
$3328
Concept Product development
Shipping product/pilot
Wide commercial availability
Deals
Investment $ millions
Chinese private investments, 2007–2012, by type, in millions.
India
India is making a strong push into the solar market, strongly rebounding after the global recession to approach 1.4 billion invested from 2007 to 2012.
Finance and Venture Capital 41
$100
$207
$50 $54
$325 $340
2007 2008 2009 2010 2011 2012
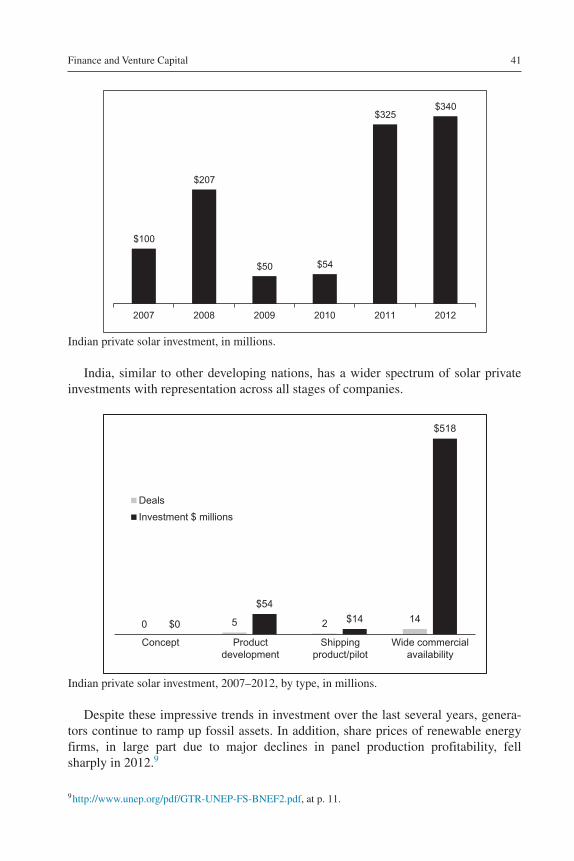
Indian private solar investment, in millions.
India, similar to other developing nations, has a wider spectrum of solar private investments with representation across all stages of companies.
0 5 2 14$0
$54
$14
$518
Concept Productdevelopment
Shippingproduct/pilot
Wide commercialavailability
Deals
Investment $ millions
Indian private solar investment, 2007–2012, by type, in millions.
Despite these impressive trends in investment over the last several years, genera-tors continue to ramp up fossil assets. In addition, share prices of renewable energy firms, in large part due to major declines in panel production profitability, fell sharply in 2012.9
9 http://www.unep.org/pdf/GTR-UNEP-FS-BNEF2.pdf, at p. 11.
Solar Energy Markets42
On the other hand, small-scale investments are up significantly, while asset finance of larger projects declined in 2012.10
Public Sector Spending
It is difficult to parse the differences between public sector spending and support-ive policies; between reduced tax receipts (currently the stimulus measure preferred in the United States) and direct cash incentive (in favor in China). This brief section addresses several of the most important points for public sector trends across the globe.
● Europe, once the primary driver of solar markets, is embroiled in austerity measures. Little direct support for R&D or installation should be expected.
● In the United States, despite several high-profile bankruptcies, public investment in solar R&D continues to rise. In 2012, the $629 million invested in R&D by the federal govern-ment is nearly double the 2009 figure of $343 million. The Energy Innovation Tracker esti-mates that the most likely scenario is for this number to swell to $770 million by 2015.
● China is shifting its subsidies, however, its managed economy makes it impossible to com-pare on an apples-to-apples basis. Overall, China invests about $6.4 billion in wind and solar per year, a number sure to rise as installation becomes a major focus of the govern-ment to reduce environmental damage.
● New entrants, such as the United Arab Emirates and Saudi Arabia, are reinvesting oil rev-enues into solar to stem the trend of becoming net oil importers by 2030.
Overall, inexpensive capital, lower prices, and supportive policies have shifted investment starkly away from production and also from research and development toward installation. With the market economics (see Chapter 9) remaining favorable over the short- and medium term, it is a good bet to think that this shift will remain in place over time, even if its momentum slows. Equilibrium of supply and demand is critical for overall success in the sector, however until then, investments for developing a better mousetrap or producing more of them are not as favorable as development pro-jects and this is unlikely to change in the near term.
10 id.