solar development on contaminated and disturbed … · and disturbed lands can help create jobs and...
TRANSCRIPT

NREL is a national laboratory of the U.S. Department of Energy Office of Energy Efficiency & Renewable Energy Operated by the Alliance for Sustainable Energy, LLC
This report is available at no cost from the National Renewable Energy Laboratory (NREL) at www.nrel.gov/publications.
Contract No. DE-AC36-08GO28308
Solar Development on Contaminated and Disturbed Lands Jordan Macknick, Courtney Lee, Gail Mosey, and Jenny Melius National Renewable Energy Laboratory
Technical Report NREL/TP-6A20-58485 December 2013

NREL is a national laboratory of the U.S. Department of Energy Office of Energy Efficiency & Renewable Energy Operated by the Alliance for Sustainable Energy, LLC
This report is available at no cost from the National Renewable Energy Laboratory (NREL) at www.nrel.gov/publications.
Contract No. DE-AC36-08GO28308
National Renewable Energy Laboratory 15013 Denver West Parkway Golden, CO 80401 303-275-3000 • www.nrel.gov
Solar Development on Contaminated and Disturbed Lands Jordan Macknick, Courtney Lee, Gail Mosey, and Jenny Melius National Renewable Energy Laboratory
Prepared under Task No. DOCC.1013
Technical Report NREL/TP-6A20-58485 December 2013

NOTICE
This report was prepared as an account of work sponsored by an agency of the United States government. Neither the United States government nor any agency thereof, nor any of their employees, makes any warranty, express or implied, or assumes any legal liability or responsibility for the accuracy, completeness, or usefulness of any information, apparatus, product, or process disclosed, or represents that its use would not infringe privately owned rights. Reference herein to any specific commercial product, process, or service by trade name, trademark, manufacturer, or otherwise does not necessarily constitute or imply its endorsement, recommendation, or favoring by the United States government or any agency thereof. The views and opinions of authors expressed herein do not necessarily state or reflect those of the United States government or any agency thereof.
This report is available at no cost from the National Renewable Energy Laboratory (NREL) at www.nrel.gov/publications.
Available electronically at http://www.osti.gov/bridge
Available for a processing fee to U.S. Department of Energy and its contractors, in paper, from:
U.S. Department of Energy Office of Scientific and Technical Information P.O. Box 62 Oak Ridge, TN 37831-0062 phone: 865.576.8401 fax: 865.576.5728 email: mailto:[email protected]
Available for sale to the public, in paper, from:
U.S. Department of Commerce National Technical Information Service 5285 Port Royal Road Springfield, VA 22161 phone: 800.553.6847 fax: 703.605.6900 email: [email protected] online ordering: http://www.ntis.gov/help/ordermethods.aspx
Cover Photos: (left to right) photo by Pat Corkery, NREL 16416, photo from SunEdison, NREL 17423, photo by Pat Corkery, NREL 16560, photo by Dennis Schroeder, NREL 17613, photo by Dean Armstrong, NREL 17436, photo by Pat Corkery, NREL 17721.
Printed on paper containing at least 50% wastepaper, including 10% post consumer waste.

iii
Acknowledgments This work was funded by the U.S. Department of Energy’s (DOE’s) Office of Energy Efficiency and Renewable Energy (EERE) and the Solar Energy Technologies Program (SETP). The authors wish to thank the following individuals for their thoughtful comments, input, and review of the document in its various stages: Jorge Figueroa, Western Resource Advocates; Marc Thomas and Katie Brown, Environmental Protection Agency; and Nate Blair, Scott Gossett, Anelia Milbrandt, and especially Laura Vimmerstedt, NREL. We also wish to thank Mary Lukkonen of NREL for her editorial support.
This report is available at no cost from the National Renewable Energy Laboratory (NREL) at www.nrel.gov/publications.

iv
Executive Summary A significant amount of land classified as contaminated and disturbed across the United States has the potential to host developments of utility-scale solar power. This report examines the prospect of developing utility- and commercial-scale concentrated solar power (CSP) and solar photovoltaics (PV) technologies on degraded and environmentally contaminated lands. The potential for solar development on contaminated and disturbed lands was assessed, and for the largest and highest solar resource sites, the economic impacts and feasibility were evaluated. Overall, levelized cost of electricity (LCOE) tends to depend on the solar resource and electricity generated per land area, which varies by location. Generally, LCOE was lower in the Southwest where the amount of electricity generated is highest. Developing solar power on contaminated and disturbed lands can help create jobs and revitalize local and state economies, and selecting these sites over greenfield sites can potentially have permitting and environmental mitigation advantages. The U.S. Department of Energy (DOE) SunShot goals call for 632 GW of PV and 83 GW of CSP to be deployed by 2050. Conservative land-use estimates of this study (10 acres per megawatt) show that there are disturbed and environmentally contaminated lands throughout the country that could be suitable for utility-scale solar power, and, that there is sufficient land area to meet SunShot solar deployment goals. The purpose of this assessment is to improve the understanding of these sites and facilitate solar developers’ selection of contaminated and disturbed sites for development.
This report is available at no cost from the National Renewable Energy Laboratory (NREL) at www.nrel.gov/publications.

v
Table of Contents 1 Introduction ........................................................................................................................................... 1 2 Methods ................................................................................................................................................. 3
2.1 Definitions and Data Sources ........................................................................................................... 3 2.2 Filtering Criteria .............................................................................................................................. 4 2.3 SAM Analysis .................................................................................................................................. 5 2.4 JEDI Analysis .................................................................................................................................. 5
3 Results ................................................................................................................................................... 6 3.1 Land and Solar Potential .................................................................................................................. 6
4 SAM Results ........................................................................................................................................ 17 4.1 Levelized Costs of Electricity ........................................................................................................ 17 4.2 JEDI Results .................................................................................................................................. 20
5 Discussion ........................................................................................................................................... 24 6 Conclusion .......................................................................................................................................... 26 7 References .......................................................................................................................................... 27
This report is available at no cost from the National Renewable Energy Laboratory (NREL) at www.nrel.gov/publications.

vi
List of Figures Figure 1. Top 25 largest sites for CSP development on barren, invasive species, and
disturbed lands ...........................................................................................................................8 Figure 2. Top 25 largest sites for utility-scale PV development on barren, invasive species, and
disturbed lands ...........................................................................................................................9 Figure 3. Top 25 largest sites for large-scale commercial PV development on barren, invasive
species, and disturbed lands .....................................................................................................10 Figure 4. Top 25 largest sites for CSP development on federally owned contaminated lands ......11 Figure 5. Top 25 largest sites for utility-scale PV development on federally owned
contaminated lands...................................................................................................................12 Figure 6. Top 25 largest sites for large-scale commercial PV development on federally owned
contaminated lands...................................................................................................................13 Figure 7. Top 25 largest sites for CSP development on non-federally owned contaminated
lands .........................................................................................................................................14 Figure 8. Top 25 largest sites for utility-scale PV development on non-federally owned
contaminated lands...................................................................................................................15 Figure 9. Top 25 largest sites for large-scale commercial PV development on non-federally
owned contaminated lands .......................................................................................................16 Figure 10. LCOE map of the 25 largest utility PV sites ................................................................17 Figure 11. Box-and-whisker plot of LCOE in $/kWh for top disturbed sites................................19 Figure 12. Box-and-whisker plot of LCOE in $/kWh for top contaminated sites .........................19 Figure 13. Number of jobs created for the construction of each project for contaminated sites ...20 Figure 14. Amount of economic impacts for each location for contaminated sites ......................21 Figure 15. Number of jobs created during construction of each project for disturbed sites and
agricultural sites .......................................................................................................................21 Figure 16. Amount of economic impacts for each location for disturbed sites and agricultural
sites ..........................................................................................................................................22 Figure C-1. Total barren, invasive, disturbed (BID) land without any restrictions .......................33 Figure C-2. Total agriculture land without any restrictions ...........................................................33 Figure C-3. Large-scale commercial: BID land with land/slope restrictions ................................34 Figure C-4. Large-scale commercial: Agriculture land with land/slope restrictions .....................34 Figure C-5. Utility scale: BID land with land/slope/solar restrictions...........................................35 Figure C-6. Utility scale: Agriculture land with land/slope/solar resource ...................................35 Figure C-7. Agriculture top 25 sites by area (large-scale commercial PV) ...................................36 Figure C-8. Agriculture top 25 sites by area (utility-scale PV) .....................................................36 Figure C-9. Agriculture top 25 sites by area (CSP) .......................................................................37 Figure C-10. LCOE maps of sites with highest solar resource (large-scale commercial PV on
barren, invasive species, and disturbed lands) .........................................................................37 Figure C-11. LCOE maps of sites with highest solar resource (large-scale commercial PV on
agricultural lands) ....................................................................................................................38 Figure C-12. LCOE maps of sites with highest solar resource (utility-scale PV on barren,
invasive species, and disturbed lands) .....................................................................................38 Figure C-13. LCOE maps of sites with highest solar resource (utility-scale PV on
agricultural lands) ....................................................................................................................39 Figure C-14. LCOE maps of sites with highest solar resource (CSP on barren, invasive species,
and disturbed lands) .................................................................................................................39
This report is available at no cost from the National Renewable Energy Laboratory (NREL) at www.nrel.gov/publications.

vii
Figure C-15. LCOE maps of sites with highest solar resource (CSP on agricultural lands) .........40 Figure C-16. All contaminated sites ..............................................................................................40 Figure C-17. Contaminated sites with land/slope restrictions (large-scale commercial PV) ........41 Figure C-18. Contaminated sites with land/slope restrictions (utility-scale PV)...........................41 Figure C-19. Contaminated sites with land/slope/solar restrictions (CSP)....................................42 Figure C-20. Levelized cost of electricity map (large-scale commercial PV on federal lands,
minimum solar resource of 6 kWh/m2/day) .............................................................................42 Figure C-21. Levelized cost of electricity map (large-scale commercial PV on non-federal
lands, minimum solar resource of 6 kWh/m2/day) ..................................................................43 Figure C-22. Levelized cost of electricity map (large-scale commercial PV on federal lands,
no minimum solar resource) ....................................................................................................43 Figure C-23. Levelized cost of electricity map (large-scale commercial PV on non-federal
lands, no minimum solar resource) ..........................................................................................44 Figure C-24. Levelized cost of electricity map (utility-scale PV on federal lands, minimum
solar resource of 6 kWh/m2/day) .............................................................................................44 Figure C-25. Levelized cost of electricity map (utility-scale PV on non-federal lands,
minimum solar resource of 6 kWh/m2/day) .............................................................................45 Figure C-26. Levelized cost of electricity map (CSP on federal lands, minimum solar resource
of 6 kWh/m2/day) .....................................................................................................................45 Figure C-27. Levelized cost of electricity map (CSP on non-federal lands, minimum solar
resource of 6 kWh/m2/day) ......................................................................................................46
List of Tables Table 1. PV and CSP Screening Criteria .........................................................................................4 Table 2. PV and CSP System Characteristics for SAM Analysis ....................................................5 Table 3. Total Area of Land Cover Types Filtered for Solar Development Suitability (Millions
of Acres).....................................................................................................................................6 Table 4. Total Potential Solar Capacity on Land Cover Types (GW Installed Capacity) ...............7 Table 5. LCOE Real in $/kWh for Contaminated Lands ...............................................................18 Table 6. LCOE Real in $/kWh for Disturbed Lands .....................................................................18 Table 7. Annual Jobs and Economic Impacts During Operating Years for Contaminated Sites ..22 Table 8. Annual Jobs and Economic Impacts During Operating Years for Disturbed Sites and
Agricultural Sites .....................................................................................................................23 Table B-1. Land Use Categories From NLCD ..............................................................................31 Table B-2. Land Use Categories for California .............................................................................31 Table B-3. Land Use Categories From SWREGAP ......................................................................32
This report is available at no cost from the National Renewable Energy Laboratory (NREL) at www.nrel.gov/publications.

1
1 Introduction Utility-scale solar projects require large, relatively flat, contiguous areas of land for siting due to their design, the density of solar energy on the earth’s surface, and economies of scale. Certain environmental impacts are unavoidable with developments at this scale. Under the U.S. Department of Energy (DOE) SunShot Initiative goals, utility-scale solar installations are projected to result in the cumulative installation of approximately 302 gigawatts (GW) of solar photovoltaics (PV) and 28 GW of concentrating solar power (CSP) technologies by 2030 and 632 GW of PV and 83 GW of CSP by 2050 (DOE 2012). To meet this ambitious target, the level of solar energy penetration would require 900,000–2,700,000 acres of land by 2030 and 2,100,000–6,200,000 acres of land by 2050 (DOE 2012). In addition, the Bureau of Land Management (BLM) is undertaking a number of efforts to facilitate solar energy development by evaluating over 19 million acres of federal lands in Arizona, California, Colorado, Nevada, New Mexico, and Utah, with the potential for around 32 GW of installed utility-scale solar project capacity on BLM and nearby non-BLM lands in these states by 2030 (BLM/DOE 2012).
Current site preparation and construction practices for utility-scale solar projects lead to direct environmental impacts (e.g., soil disturbance and habitat fragmentation) as well as indirect environmental impacts (e.g., changes in surface water quality due to soil erosion at the construction site), which may lead to long-term damage (BLM/DOE 2012). Most projects completely clear vegetation and grade land prior to construction, cover areas with gravel, and use water to suppress dust prior to and throughout construction; these activities lead to the need for environmental mitigation (BLM/DOE 2012). Furthermore, site preparation and operational activities can represent a substantial portion of non-technology costs (Ardani 2012). In addition, environmental and resource issues on pristine lands, if not properly addressed from the beginning, can delay or prevent solar deployment in specific areas and potentially lead to additional unplanned mitigation efforts and environmental litigation (Rivera 2011; Stanfield 2011; D’Alessandro 2012).
Many stakeholders have noted their preference for siting solar power development on marginal lands, including degraded and contaminated lands, over pristine land. Using marginal lands reduces stress on intact, undeveloped lands. These lands may also have existing on-site infrastructure, potentially lower transaction costs, greater public support for development, streamlined permitting and zoning processes, and are often already located close to roads, rail, and transmission (EPA 2012a). Feasibility studies confirm the potential benefits associated with utilizing contaminated sites for renewable energy projects (Simon and Mosey 2013a; Simon and Mosey 2013b; Steen et al. 2013; Salasovich and Mosey 2012; Salasovich and Mosey 2011; VanGeet and Mosey 2010; Lisell and Mosey 2010a; Lisell and Mosey 2010b).
The U.S. Environmental Protection Agency (EPA) has reported that there are over 468 environmentally contaminated sites, each over 100 acres, just in the southwestern United States (EPA 2009). These sites represent over 7 million acres of land, or almost half of the total acreage of contaminated lands in the United States. Other studies have highlighted the potential for contaminated lands to be utilized by other types of renewable energy technologies, such as wind, biopower, and biofuels (Mosey et al. 2007). These results are consistent with this study’s analysis.
This report is available at no cost from the National Renewable Energy Laboratory (NREL) at www.nrel.gov/publications.

2
Achieving the market penetration and cost reduction goals of the SunShot Initiative, or achieving high levels of penetration in areas with low levels of land availability, could require utility-scale solar installations to be designed and deployed in ways that maximize land-use efficiency and minimize negative biodiversity impacts. Through improved land-use efficiency, smart design, and ecological impact mitigation, utility-scale solar projects could achieve greater deployment levels to realize cost-reduction benefits from industry learning.
This report examines the potential development of utility- and commercial-scale solar power on contaminated and disturbed lands. The report will further define what contaminated and disturbed lands are, assess the levelized cost of electricity (LCOE) and job impacts are for site-specific locations, and look at overall non-technical barriers to development of solar on marginal lands. The report will allow for a better understanding about these sites and allow solar developers to more readily choose disturbed and contaminated sites for development. Incentive and policy mechanisms may address barriers to utilizing these sites. Identifying cost reduction measures for installing solar on marginal lands may lead to lower overall costs and higher levels of solar deployment.
This report is available at no cost from the National Renewable Energy Laboratory (NREL) at www.nrel.gov/publications.

3
2 Methods Potential contaminated and disturbed sites for solar development across the United States were identified using geographic information system (GIS) data, as well as key filtering and exclusion assumptions. NREL’s economic modeling analyzed the economic costs and impacts for top sites. This study provides a coarse overview of options and opportunities from a national perspective for solar development on disturbed and contaminated lands. As such, this study does not provide specific information that would be required for siting solar projects in specific locations, but it does offer perspectives on the magnitude and general location of promising areas for solar development. Estimates of potential solar development are based on existing sources of land cover data, basic filtering criteria, standard financial analyses, and simple economic impact analyses.
2.1 Definitions and Data Sources Environmentally contaminated lands are those contaminated by improper handling or disposal of toxic and hazardous materials and wastes. They are typically tracked and categorized by the EPA and include Superfund sites, Resource Conservation and Recovery Act (RCRA) sites, brownfields, and abandoned mine lands (AMLs) (EPA 2009). Other contaminated properties are tracked by state voluntary cleanup programs (VCPs). Data sources used categorized contaminated sites by land ownership. Sites were classified as either federally owned land or non-federally owned land. Federal lands include federally owned RCRA and Superfund sites. Landfills, abandoned mine lands, brownfields, and non-federally owned RCRA and Superfund sites, are classified as non-federal lands.
The United States Geological Survey (USGS) defines disturbed lands as land in an altered and often non-vegetated state due to disturbances. They are different from environmentally contaminated lands and may include former industrial sites, various types of intensively used agricultural lands, public lands that have been impacted by activities such as livestock grazing or the use of off-road vehicles, and mining or oil and gas development lands. Disturbed lands are not designated by the EPA as environmentally contaminated yet still might not be suitable for productive agricultural use. For the purposes of this study, the following are considered disturbed lands:
• Potentially and formerly contaminated lands
• Barren lands
• Invasive species-impacted lands
• Other disturbed lands (e.g., recently burned, gravel pits). Barren lands are lands of limited ability to support life, and invasive species lands contain non-indigenous plants or animal species that can harm the environment. Detailed definitions on disturbed, barren, and invasive species lands can be found in Appendix B.
Disturbed land cover data were retrieved from three primary sources: the California Gap Analysis Project (GAP) for California, the Southwest Regional Gap Analysis Project (SWREGAP) for southwestern states, and the National Land Cover Database (NLCD) for all other states (Homer et al. 2007; Lowry et al. 2005; Lennartz et al. 2008). Each dataset had
This report is available at no cost from the National Renewable Energy Laboratory (NREL) at www.nrel.gov/publications.
4
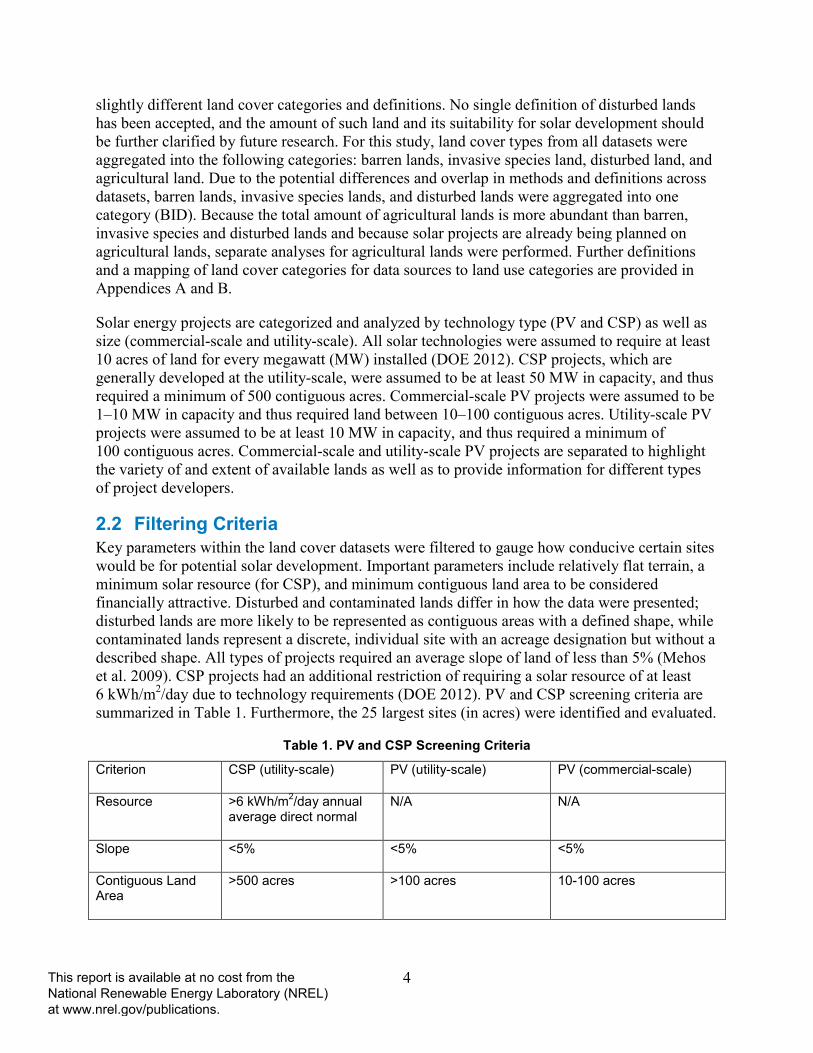
slightly different land cover categories and definitions. No single definition of disturbed lands has been accepted, and the amount of such land and its suitability for solar development should be further clarified by future research. For this study, land cover types from all datasets were aggregated into the following categories: barren lands, invasive species land, disturbed land, and agricultural land. Due to the potential differences and overlap in methods and definitions across datasets, barren lands, invasive species lands, and disturbed lands were aggregated into one category (BID). Because the total amount of agricultural lands is more abundant than barren, invasive species and disturbed lands and because solar projects are already being planned on agricultural lands, separate analyses for agricultural lands were performed. Further definitions and a mapping of land cover categories for data sources to land use categories are provided in Appendices A and B.
Solar energy projects are categorized and analyzed by technology type (PV and CSP) as well as size (commercial-scale and utility-scale). All solar technologies were assumed to require at least 10 acres of land for every megawatt (MW) installed (DOE 2012). CSP projects, which are generally developed at the utility-scale, were assumed to be at least 50 MW in capacity, and thus required a minimum of 500 contiguous acres. Commercial-scale PV projects were assumed to be 1–10 MW in capacity and thus required land between 10–100 contiguous acres. Utility-scale PV projects were assumed to be at least 10 MW in capacity, and thus required a minimum of 100 contiguous acres. Commercial-scale and utility-scale PV projects are separated to highlight the variety of and extent of available lands as well as to provide information for different types of project developers.
2.2 Filtering Criteria Key parameters within the land cover datasets were filtered to gauge how conducive certain sites would be for potential solar development. Important parameters include relatively flat terrain, a minimum solar resource (for CSP), and minimum contiguous land area to be considered financially attractive. Disturbed and contaminated lands differ in how the data were presented; disturbed lands are more likely to be represented as contiguous areas with a defined shape, while contaminated lands represent a discrete, individual site with an acreage designation but without a described shape. All types of projects required an average slope of land of less than 5% (Mehos et al. 2009). CSP projects had an additional restriction of requiring a solar resource of at least 6 kWh/m2/day due to technology requirements (DOE 2012). PV and CSP screening criteria are summarized in Table 1. Furthermore, the 25 largest sites (in acres) were identified and evaluated.
Table 1. PV and CSP Screening Criteria
Criterion CSP (utility-scale) PV (utility-scale) PV (commercial-scale)
Resource >6 kWh/m2/day annual average direct normal
N/A N/A
Slope <5% <5% <5%
Contiguous Land Area
>500 acres >100 acres 10-100 acres
This report is available at no cost from the National Renewable Energy Laboratory (NREL) at www.nrel.gov/publications.

5
2.3 SAM Analysis DOE’s National Renewable Energy Laboratory’s (NREL) System Advisor Model (SAM) was used to predict performance and cost of energy for the development of large-scale commercial PV, utility-scale PV, and CSP solar technologies for contaminated and disturbed lands across the United States (NREL 2013). Using site location (latitude and longitudes coordinates), we analyzed and estimated annual energy generation and LCOE for the top 25 largest potential contaminated and disturbed sites. SAM Version 2012.5.11 was utilized for the purposes of this analysis. Solar system costs can be quite dynamic, and current PV and CSP costs might be much lower than costs considered in this report.
For CSP projects, SAM technology inputs represented a dry-cooled 100-MW parabolic trough system. The SAM technology input “PVWatts System Model” was used for a 5-MW large-scale commercial PV project and a 20-MW utility-scale PV system. Utility-scale CSP and PV technology simulations used the default financial settings of an independent power producer (IPP), while large-scale commercial PV simulations used financing settings characterized by a commercial power purchasing agreement (PPA). Table 2 summarizes PV and CSP system characteristics and parameters for the SAM analysis.
Table 2. PV and CSP System Characteristics for SAM Analysis
Characteristic CSP (parabolic trough) PV (utility-scale) PV (commercial-scale)
Capacity 100 MW 20 MW 5 MW
Cooling System Dry N/A N/A
Axis-Tracking N/A Single Single
Energy Storage 6 hours N/A N/A
Financial Settings Default Independent Power Producer
Default Independent Power Producer
Default Commercial Power Purchasing Agreement
2.4 JEDI Analysis NREL’s Jobs and Economic Development Impact (JEDI) model measures the economic impacts of a solar project (NREL 2012). JEDI evaluates the number of jobs created and economic impacts to a specific local area during the construction and operating phases of an energy project. The JEDI model was used to evaluate the differences in jobs and economic impact between states. This study did not attempt to compare the difference between JEDI results for a contaminated or disturbed site with greenfield sites, which is an area of future analysis.
We performed JEDI simulations of CSP and PV technologies consistent with the characteristics of the SAM analysis (see Table 2). The solar cell material input for both large-scale and utility-scale PV was crystalline silicon, and the system tracking option was fixed mount. The construction year period started in 2013, and default project costs settings were used.
This report is available at no cost from the National Renewable Energy Laboratory (NREL) at www.nrel.gov/publications.

6
3 Results 3.1 Land and Solar Potential Results from the GIS and filtering analysis show that of the 62 million acres of BID land in the United States, 16 million acres would be sufficiently flat and in sufficiently large contiguous plots for PV development. Of those, 1.1 million acres have solar resource over 6 kWh/m2/day, making them potentially suitable for CSP development. Agricultural land resources are larger than BID land, accounting for approximately 380 million acres. Of these, 270 million acres are sufficiently flat and large enough for PV development, and 9.0 million acres have solar resources suitable for CSP development. Contaminated lands make up a smaller portion of total land than BID lands, at 16 million acres. Of those, approximately 3.7 million acres could potentially be suitable for PV development, with 0.7 million acres having solar resources suitable for CSP development (Table 3).
Table 3. Total Area of Land Cover Types Filtered for Solar Development Suitability (Millions of Acres)
Land type Total area (millions of acres)
Area after land and slope restrictions (millions of acres)
Area after solar resource restrictions
(6kWh/m2/day)
Agriculture 380 270 9.0
Disturbed/invasive/barren 62 16 1.1
Contaminated lands1 16 3.7 0.7
As DOE SunShot goals call for 632 GW of PV and 83 GW of CSP to be deployed by 2050, conservative land-use estimates of this study (10 acres per MW) show that SunShot solar deployment goals could be met entirely by siting solar energy projects on disturbed and environmentally contaminated lands (Table 4). In addition, although existing agricultural land could potentially play an important role in future solar energy development, agricultural lands would not be required for solar development to meet the SunShot goals. While not every identified disturbed and contaminated site will be suitable for solar energy development, these lands offer a starting point for siting projects in locations that could minimize environmental impacts, and include both public and private land.
1 For contaminated lands on federal property, we conservatively estimate that only 10% of the land area is suitable for solar energy development, based on similar assumptions in prior studies (e.g., EPA 2009). Without this assumption, total contaminated land available after land and slope restrictions would be 13 million acres, and the total contaminated land available after land, slope, and solar resource restrictions would be 6 million acres.
This report is available at no cost from the National Renewable Energy Laboratory (NREL) at www.nrel.gov/publications.
7
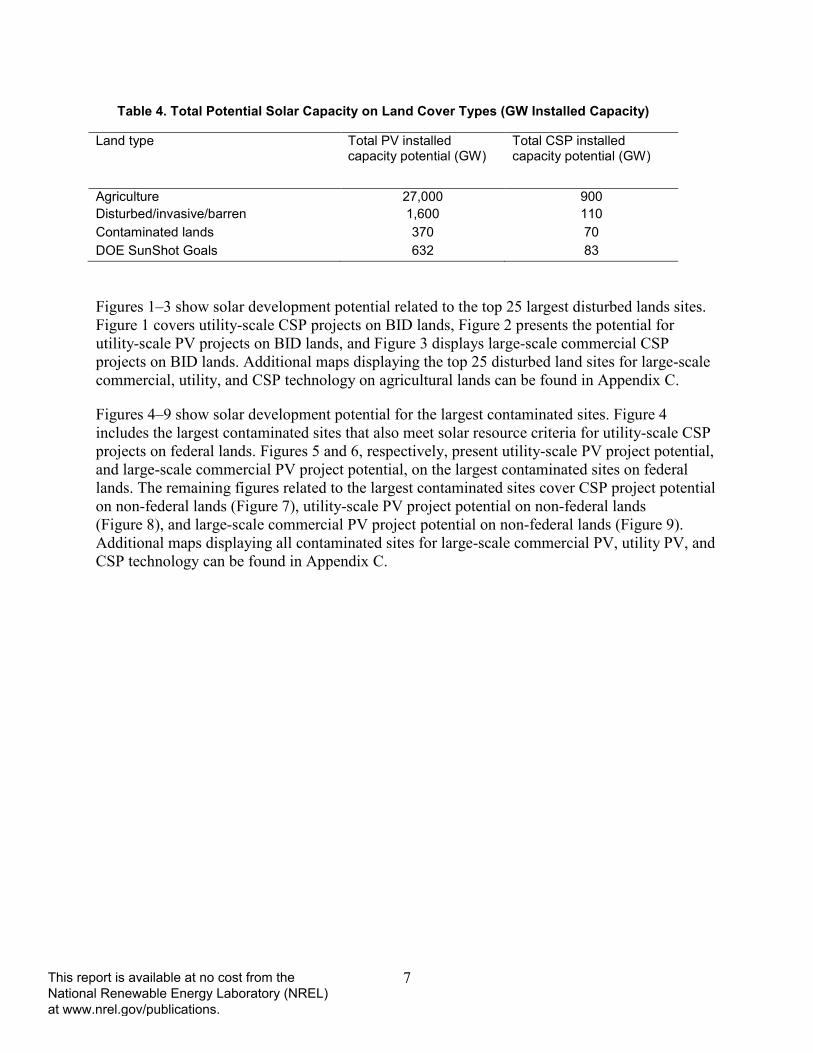
Table 4. Total Potential Solar Capacity on Land Cover Types (GW Installed Capacity)
Land type Total PV installed capacity potential (GW)
Total CSP installed capacity potential (GW)
Agriculture 27,000 900 Disturbed/invasive/barren 1,600 110 Contaminated lands 370 70 DOE SunShot Goals 632 83 Figures 1–3 show solar development potential related to the top 25 largest disturbed lands sites. Figure 1 covers utility-scale CSP projects on BID lands, Figure 2 presents the potential for utility-scale PV projects on BID lands, and Figure 3 displays large-scale commercial CSP projects on BID lands. Additional maps displaying the top 25 disturbed land sites for large-scale commercial, utility, and CSP technology on agricultural lands can be found in Appendix C.
Figures 4–9 show solar development potential for the largest contaminated sites. Figure 4 includes the largest contaminated sites that also meet solar resource criteria for utility-scale CSP projects on federal lands. Figures 5 and 6, respectively, present utility-scale PV project potential, and large-scale commercial PV project potential, on the largest contaminated sites on federal lands. The remaining figures related to the largest contaminated sites cover CSP project potential on non-federal lands (Figure 7), utility-scale PV project potential on non-federal lands (Figure 8), and large-scale commercial PV project potential on non-federal lands (Figure 9). Additional maps displaying all contaminated sites for large-scale commercial PV, utility PV, and CSP technology can be found in Appendix C.
This report is available at no cost from the National Renewable Energy Laboratory (NREL) at www.nrel.gov/publications.

8
Criteria: Slope <= 5%; size >= 500 acres; solar quality >= 6 kWh/m2/day; Sources: UCSB Biogeography Lab; Southwest Regional Gap Analysis Project; USGS Gap Analysis Project.
Figure 1. Top 25 largest sites for CSP development on barren, invasive species, and disturbed lands
Total Area (Acres)
A 37,025
F 17,588
K 25,951
P 20,453
U
B 13,948
G 15,901
L 54,131
Q 145,371
V
C 16,664
H 20,418
M 45,943
R 21,557
W
D 45,038
I 60,805
N 24,986
S 20,064
X
E 21,402 J 25,667 O 38,470 T 18,620 Y
This report is available at no cost from the National Renewable Energy Laboratory (NREL) at www.nrel.gov/publications.

9
Criteria: Slope <= 5%; size >= 100 acres; solar quality = not applicable; Sources: UCSB Biogeography Lab; Southwest Regional Gap Analysis Project; USGS Gap Analysis Project
Figure 2. Top 25 largest sites for utility-scale PV development on barren, invasive species, and disturbed lands
A 111,231 F 45,033 K 25,859 P 25,803 U 72,212
B 41,986 G 23,961 L 68,662 Q 40,636 V 214,313
C 26,403 H 43,319 M 57,902 R 82,654 W 24,529
D 65,753 I 27,940 N 25,077 S 26,064 X 65,515
E 34,937 J 33,112 O 61,015 T 48,003 Y 26,269
Total Area (Acres)
This report is available at no cost from the National Renewable Energy Laboratory (NREL) at www.nrel.gov/publications.

10
Criteria: Slope <= 5%; size 10 - 99 acres; solar quality = not applicable; Sources: UCSB Biogeography Lab; Southwest Regional Gap Analysis Project; USGS Gap Analysis Project
Figure 3. Top 25 largest sites for large-scale commercial PV development on barren, invasive species, and disturbed lands
Total Area (Acres)Largest sites range from 99.8 to 99.9 acres
This report is available at no cost from the National Renewable Energy Laboratory (NREL) at www.nrel.gov/publications.

11
Criteria: Slope <= 5%; size >= 500 acres; solar quality >= 6 kWh/m2/day; Sources: U.S. Environmental Protection Agency; RE-Powering America’s Land
Figure 4. Top 25 largest sites for CSP development on federally owned contaminated lands
This report is available at no cost from the National Renewable Energy Laboratory (NREL) at www.nrel.gov/publications.

12
Criteria: Slope <= 5%; size >= 100 acres; solar quality = not applicable;
Figure 5. Top 25 largest sites for utility-scale PV development on federally owned contaminated lands
This report is available at no cost from the National Renewable Energy Laboratory (NREL) at www.nrel.gov/publications.

13
Sources: U.S. Environmental Protection Agency; RE-Powering America’s Land Criteria: Slope <= 5%; size 10 - 99 acres; solar quality = not applicable; Sources: U.S. Environmental Protection Agency; RE-Powering America’s Land
Figure 6. Top 25 largest sites for large-scale commercial PV development on federally owned contaminated lands
This report is available at no cost from the National Renewable Energy Laboratory (NREL) at www.nrel.gov/publications.

14
Criteria: Slope <= 5%; size > 500 acres; solar quality >= 6 kWh/m2/day; Sources: U.S. Environmental Protection Agency; RE-Powering America’s Land
Figure 7. Top 25 largest sites for CSP development on non-federally owned contaminated lands
This report is available at no cost from the National Renewable Energy Laboratory (NREL) at www.nrel.gov/publications.

15
Criteria: Slope <= 5%; size >= 100 acres; solar quality = not applicable; Sources: U.S. Environmental Protection Agency; RE-Powering America’s Land
Figure 8. Top 25 largest sites for utility-scale PV development on non-federally owned contaminated lands
This report is available at no cost from the National Renewable Energy Laboratory (NREL) at www.nrel.gov/publications.

16
Criteria: Slope <= 5%; size 10 - 99 acres; solar quality = not applicable;
Figure 9. Top 25 largest sites for large-scale commercial PV development on non-federally owned contaminated lands
This report is available at no cost from the National Renewable Energy Laboratory (NREL) at www.nrel.gov/publications.

17
4 SAM Results 4.1 Levelized Costs of Electricity LCOE for both PV and CSP technologies on contaminated and disturbed lands was evaluated in SAM. LCOE values can vary greatly due to location, technology, and solar resource. For example, a large-scale commercial PV site in Phelan, California, that has a solar resource of greater than 6 kWh/m2/day, can generate approximately 8,440 MWh annually at a cost of ~$0.15/kWh, while a site in Slippery Rock, Pennsylvania, with a solar quality of 4 kWh/m2/day, will generate approximately 5,300 MWh at a cost of ~$0.24/kWh.
Figure 10 compares the various LCOE values with annual energy generated for the largest utility-scale PV potential sites on federal and non-federal lands. The figure not only reflects the relationship between annual energy generation, LCOE, and solar resource but also displays the distribution of where the top potential sites are located. In this case, the map displays the variations between non-federal and federal utility-scale PV sites. Additional maps showing other technologies, including CSP and large-scale commercial PV, can be found in Appendix C.
Criteria: Slope <= 5%; size >= 100 acres; solar quality = not applicable; single-axis tracking Sources: U.S. Environmental Protection Agency; RE-Powering America’s Land
Figure 10. LCOE map of the 25 largest utility PV sites
This report is available at no cost from the National Renewable Energy Laboratory (NREL) at www.nrel.gov/publications.

18
LCOE costs were calculated for each set of 25 top sites for both contaminated and disturbed lands (Tables 5 and 6, Figures 12 and 13). CSP LCOE values ranged from $0.17–$0.24/kWh; utility-scale PV sites ranged from $0.18–$0.31/kWh; and large-scale commercial PV sites ranged from $0.15–$0.26/kWh.
Table 5. LCOE Real in $/kWh for Contaminated Lands LSC = Large-scale commercial; SR = Solar resource of at least 6.0 kWh/m2/day. Average Max Min CSP Fed $0.196 $0.231 $0.168
CSP Non-Fed $0.194 $0.228 $0.173
PV Util Fed SR $0.193 $0.203 $0.185
PV Util Non-Fed SR $0.195 $0.206 $0.187
PV Util Fed $0.231 $0.284 $0.188
PV Util Non-Fed $0.250 $0.312 $0.191
PV LSC Fed SR $0.161 $0.167 $0.156
PV LSC Non-Fed SR $0.158 $0.169 $0.150
PV LSC Fed $0.209 $0.260 $0.156
PV LSC Non-Fed $0.223 $0.237 $0.186
Table 6. LCOE Real in $/kWh for Disturbed Lands AG = Agricultural lands; BID = Barren, invasive species, and disturbed lands; LSC = Large-scale commercial Average Max Min CSP AG $0.206 $0.241 $0.173
CSP BID $0.213 $0.244 $0.180
PV Util AG $0.190 $0.197 $0.184
PV Util BID $0.190 $0.196 $0.187
PV LSC AG $0.152 $0.159 $0.151
PV LSC BID $0.157 $0.159 $0.150
Median LCOE values and ranges show considerable variation in values within each technology (Figures 11 and 12). PV development on disturbed and contaminated lands with a solar resource of at least 6.0 kWh/m2/day had less variation when compared to PV developments in areas with a lower solar resource.
This report is available at no cost from the National Renewable Energy Laboratory (NREL) at www.nrel.gov/publications.

19
Figure 11. Box-and-whisker plot of LCOE in $/kWh for top disturbed sites
Low and high error bars represent minimum and maximum costs, respectively. Upper and lower ends of boxes represent the 75th and 25th percentiles and horizontal lines represent medians. AG = Agricultural lands; BID = Barren, invasive species, and disturbed lands; LSC = Large-scale commercial; SR = Solar
resource of at least 6.0 kWh/m2/day.
Figure 12. Box-and-whisker plot of LCOE in $/kWh for top contaminated sites
Low and high error bars represent minimum and maximum costs, respectively. Upper and lower ends of boxes represent the 75th and 25th percentiles and horizontal lines represent medians. LSC = Large-scale
commercial; SR = Solar resource of 6.0 kWh/m2/day.
This report is available at no cost from the National Renewable Energy Laboratory (NREL) at www.nrel.gov/publications.

20
4.2 JEDI Results Jobs and economic impacts were evaluated for PV and CSP projects on contaminated and disturbed lands using the JEDI model. For all types of projects, jobs and economic impacts increase as the size of the project increases; a 100-MW project will create more jobs and more revenue to a state’s economy than a 5-MW project. Jobs and economic impacts also vary from state to state. As an example, a 100-MW CSP project on contaminated lands in Texas is expected to create around 1,927 jobs during construction and 96 permanent operating jobs, whereas a similar project in Arizona would create more jobs during construction (2,152) and during the operational phase (108). Despite this, due to differences in local economies and activities the Texas project would add approximately $380 million to the local economy during construction, whereas the Arizona project would only add $321 million during that time period.
It is difficult to make a broad comparison among various sites, and sites should be assessed on an individual basis. The results of JEDI’s economic impacts are a general representation of how the impacts of a project can vary by region and state, and additional information on state variations are addressed elsewhere (NREL 2012).
Figures 13, 14, 15, and 16 display the jobs created during the construction years and the amount of dollars (in millions) the construction of that project will bring to that state’s economy for each top site for contaminated and disturbed lands. As mentioned earlier, the size of the system has an important role in determining total level of impact, so a utility-scale project is likely to have a larger economic impact than a commercial-scale project, just due to its overall size.
Figure 13. Number of jobs created for the construction of each project for contaminated sites
LSC = Large-scale commercial; SR = Solar resource of at least 6.0 kWh/m2/day.
This report is available at no cost from the National Renewable Energy Laboratory (NREL) at www.nrel.gov/publications.

21
Figure 14. Amount of economic impacts for each location for contaminated sites
LSC = Large-scale commercial; SR = Solar resource of at least 6.0 kWh/m2/day.
Figure 15. Number of jobs created during construction of each project for disturbed sites and
agricultural sites
AG = Agricultural lands; BID = Barren, invasive species, and disturbed land; LSC = Large-scale commercial.
This report is available at no cost from the National Renewable Energy Laboratory (NREL) at www.nrel.gov/publications.

22
Figure 16. Amount of economic impacts for each location for disturbed sites and agricultural sites
AG = Agricultural lands; BID = Barren, invasive species, and disturbed land; LSC = Large-scale commercial.
Tables 7 and 8 show the results for both contaminated and disturbed lands on the number of annual jobs created and the annual dollars (in millions) those jobs will add to each state’s economy.
Table 7. Annual Jobs and Economic Impacts During Operating Years for Contaminated Sites LSC = Large-scale commercial; SR = Solar resource of at least 6.0kWh/m2/day. Annual Jobs Annual Operating Economic
Impacts (Millions)
CSP Fed (TX) 96.0 14.35
CSP Non-Fed (AZ) 108.0 11.93
PV Util Fed SR (NM) 6.0 0.49
PV Util Non-Fed SR (NV) 5.7 0.52
PV Util Fed (NM) 6.0 0.49
PV Util Non-Fed (MO) 6.1 0.56
PV LSC Fed SR (CA) 1.5 0.16
PV LSC Non-Fed SR (CA) 1.5 0.16
PV LSC Fed (MD) 1.4 0.13
PV LSC Non-Fed (PA) 1.5 0.15
This report is available at no cost from the National Renewable Energy Laboratory (NREL) at www.nrel.gov/publications.

23
Table 8. Annual Jobs and Economic Impacts During Operating Years for Disturbed Sites and Agricultural Sites
AG = Agricultural lands; BID = Barren, invasive species, and disturbed lands; LSC = Large-scale commercial. Annual Jobs Annual Operating Economic
Impacts (Millions)
CSP AG (CO) 99.0 14.41
CSP BID (TX) 96.0 14.35
PV Util AG (NV) 5.7 0.53
PV Util BID (AZ) 6.2 0.57
PV LSC AG (NM) 1.5 0.12
PV LSC BID (AZ) 1.5 0.14
This report is available at no cost from the National Renewable Energy Laboratory (NREL) at www.nrel.gov/publications.

24
5 Discussion Developing solar projects on contaminated and disturbed lands can provide advantages over development on currently productive or high ecosystem-value land. Current solar development practices can cause substantial impacts to land (e.g., soil disturbance, habitat fragmentation, or changes in surface water quality due to soil erosion at the construction site) (BLM/DOE 2012; DOE 2012). There are likely to be fewer negative environmental impacts to lands that are already degraded or damaged than land that is currently providing habitat and ecosystem services to a region. By avoiding additional environmental degradation and engaging community stakeholders early in the process, developers could potentially reduce the risk of project delays and the possibility of litigation, as well as establish a sustainable land development policy by reusing a portion of the over 20 million acres of contaminated lands currently tracked by EPA (EPA 2012b); this acreage is roughly equivalent to the State of Ohio. Many solar projects have been subject to environmental litigation due to perceived impacts on the environment (Glicksman 2011). Siting projects on already disturbed or contaminated lands may reduce the need for environmental mitigation activities.
Degraded lands often are located in rural areas or in marginal lands of urban areas, which may be in need of economic revitalization. Siting a financially attractive project in an area without productive land opportunities could improve local economic conditions. Results from the JEDI analysis show potential economic benefits from construction jobs and economic impacts, as well as longer-term jobs during operation of solar energy projects. If the area is degraded from historical industrial activities or other activities that required electricity infrastructure, grid connection costs could be reduced by leveraging existing infrastructure. An emerging opportunity for solar projects are existing power plant sites (not considered in this study) that might be facing retirement or that could incorporate solar infrastructure into their operations.
Despite the many advantages, there also could be some challenges posed by developing on disturbed and contaminated lands. If the area is remote, transmission costs, in addition to other infrastructure-related costs (e.g., road-building and temporary housing construction for workers), could be higher than a location closer to existing infrastructure. In addition, there are still likely to be habitat impacts that require mitigation, even when developing on previously disturbed lands. The identification of disturbed and contaminated lands may also be a challenge; lands that have been degraded and disturbed in the past may eventually become productive, healthy lands over time. Certain contaminated lands may have liability and regulatory challenges associated with their development. However, EPA is actively supporting renewable energy as a beneficial reuse and provides support to developers and system owners to address liability concerns (EPA 2012c).
Solar projects being developed on agricultural lands might face competition challenges if land were to be taken out of food production to be used for energy production. There also could be concerns over the impact that projects would have on rural communities if they displace traditional agricultural activities. Areas of future study include the evaluation of the potential for co-location of solar energy development and agriculture and the use of solar energy projects to rehabilitate fallow and degraded agricultural lands.
This report is available at no cost from the National Renewable Energy Laboratory (NREL) at www.nrel.gov/publications.

25
Disturbed and contaminated lands are found on a variety of federal lands, crossing many federal agency jurisdictions. As described above, DOE and the Department of the Interior have already been coordinating activities related to solar development on federal lands. This multi-agency approach could likely be built upon and improved by including coordinated input from DOE, Department of the Interior, Department of Defense, Department of Agriculture, and EPA.
Results from this work are inherently limited by existing land cover datasets. While this study provides an initial estimate of the potential for solar projects to be located on disturbed and contaminated lands, it relies on existing sources of data for land cover. Existing sources can be outdated, leading to uncertainty over the feasibility of developing in certain areas. Furthermore, land cover datasets for adjacent regions and states may be developed with different methodologies, resulting in apparent land cover differences along political borders that are not supported by ground-truthing or satellite imagery analysis. There also is no commonly accepted definition for “disturbed” lands, which complicates efforts to select appropriate lands. While most developers and environmental organizations can agree that projects should be targeted for already disturbed land, there currently is no common understanding of what disturbed lands include.
Future efforts could assist in providing a clear definition of what disturbed lands are and under what conditions they would be appropriate for solar development. Siting decisions could also be improved by including additional filtering criteria optimization tools for important siting components, such as proximity to transmission or other infrastructure, cost structures of certain utilities, and overlap with sensitive environmental regions. A more detailed analysis could also examine various agricultural parameters (e.g., revenue per acre, crop type, or water usage) to see how local incomes could be affected by new solar projects. This could be analyzed in conjunction with estimates of how solar development could affect national and regional levels of food and other agricultural production. Future work could also develop an interactive online siting tool, which could be implemented in an existing framework, such as the Solar Power Prospector,2 to assist developers and interested stakeholders in identifying appropriate lands for solar development.
Results of this work indicate that there is sufficient disturbed and contaminated land available for siting solar energy technologies to achieve SunShot Initiative solar deployment goals, without requiring the use of existing agricultural or other land in productive use. Future studies can build off this work to identify potential pathways and barriers to achieving this goal.
2 Find the Solar Power Prospector at http://maps.nrel.gov/prospector.
This report is available at no cost from the National Renewable Energy Laboratory (NREL) at www.nrel.gov/publications.

26
6 Conclusion Of the estimated 80 million acres of contaminated and disturbed land in the United States, approximately 20 million acres could be suitable to host deployment of utility and commercial-scale PV and CSP technologies, as examined in this report. The DOE SunShot Initiative goals could theoretically be met by development of solar projects on previously disturbed or contaminated lands. Future development efforts could prioritize this degraded land over pristine lands.
The technology performance, costs, and economic impacts associated with new solar projects were analyzed for top 25 largest potential sites for CSP, utility-scale PV, and commercial-scale PV. Several characteristics, including LCOE, type of technology, solar resource, and energy generation, may vary greatly across sites and regions. LCOE values are generally lower in the Southwest, where solar resources are highest.
One benefit of developing solar projects on disturbed and/or contaminated lands advantage is that these projects could stimulate and revitalize local and state economies in areas without many productive land uses. Other potential benefits of siting projects on disturbed and/or contaminated lands as opposed to productive lands include reduced delays due to litigation and other siting permitting processes as well as reduced requirements for purchasing environmental mitigation land. Conversely, the tradeoffs associated with developing solar power on contaminated and disturbed lands, compared to other lands, could lead to increased infrastructure costs or increased permitting requirements.
Our report does not address whether CSP technologies are preferred over PV, but rather examines some of the tradeoffs that should be considered in identifying the best option to develop these lands. The report has identified locations and sites that may have high potential for development, and further analysis at a local or state level could contribute to a more complete assessment in the future.
This report is available at no cost from the National Renewable Energy Laboratory (NREL) at www.nrel.gov/publications.

27
7 References Anderson, James R.; Hardy, Ernest E.; Roach, John T.; Witmer, Richard E. (2001). "A Land Use and Land Cover Classification System For Use With Remote Sensor Data." The US Geological Survey. Accessed 2013: http://landcover.usgs.gov/pdf/anderson.pdf.
Ardani, K.; Barbose, G.; Margolis, R.; Wiser, R.; Feldman, D.; and Ong, S. (2012). Benchmarking non-hardware balance of system (soft) costs for U.S. photovoltaic systems using a data-driven analysis from PV installer survey results. DOE/GO-10212-3834. Washington, D.C.: U.S. Department of Energy.
D’Alessandro, L. (2012). Environmental groups sue DOI over location of 664-MW Calico solar project. SNL Financial.
U.S. Department of Energy. (2012). SunShot Vision Study. Office of Energy Efficiency and Renewable Energy. DOE/GO-102012-3037. Washington, D.C.: U.S. Department of Energy.
U.S. Department of the Interior. (2012). Final Programmatic Environmental Impact Statement (PEIS) for Solar Energy Development in Six Southwestern States. FES 12-14; DOE/EIS-0403. Washington, DC: U.S. Department of the Interior.
U.S. Environmental Protection Agency. (2009). "Opportunities to Reduce Greenhouse Gas Emissions through Materials and Land Management Practices." Washington, DC: Environmental Protection Agency.
U.S. Environmental Protection Agency. (2012a). “Re-Powering America’s Land.” Washington DC: Environmental Protection Agency. Accessed 2013: http://www.epa.gov/renewableenergyland/docs/contaminated_land_resuse_factsheet.pdf.
U.S. Environmental Protection Agency. (2012b). “Protecting Communities and Restoring Land.” Washington, DC: Environmental Protection Agency. Accessed 2013: http://www.epa.gov/swerrims/docs/oswer_accomplishment_report_2012.pdf.
U.S. Environmental Protection Agency. (2012c). “Siting Renewable Energy on Potentially Contaminated Properties: Liability Considerations.” Accessed 2013: http://www.epa.gov/enforcement/cleanup/documents/superfund/re-liab-2012-fs.pdf.
U.S. Environmental Protection Agency. (2012d). "Superfunds." Washington, DC: Environmental Protection Agency. Accessed 2013: http://www.epa.gov/aml/basicinf.htm.
U.S. Environmental Protection Agency. (2012e). "Types of Contaminated Sites." Washington, DC: Environmental Protection Agency. Accessed 2013: http://www.epa.gov/compliance/cleanup/revitalization/site-types.html.
Gap Analysis Project. Logan, UT: Utah State University RS/GIS Laboratory.
This report is available at no cost from the National Renewable Energy Laboratory (NREL) at www.nrel.gov/publications.

28
Glicksman, R. (2011). “Solar Energy Development on the Federal Public Lands: Environmental Trade-Offs on the Road to a Lower-Carbon Future.” San Diego Journal of Energy & Climate Law (3); GWU Legal Studies Research Paper No. 582.
Homer, C.; Dewitz, J.; Fry, J.; Coan, M.; Hossain, N.; Larson, C.; Herold, N.; McKerrow, A.; VanDriel, J.N.; and Wickham, J. (2007). "Completion of the 2001 National Land Cover Database for the Conterminous United States." Photogrammetric Engineering and Remote Sensing (73:4); pp. 337-341.
Lennartz, S.; Bax, T.; Aycrigg, J.; Davidson, A.; Reid, M.; and Congalton, R. (2008). Final Report on Land Cover Mapping Methods for California Map Zones 3, 4, 5, 6, 12, and 13. University of Idaho Gap Analysis Program. Accessed 2013: http://gap.uidaho.edu/index.php/ca-land-cover.
Lisell, L.; Mosey, G. (2010a). Feasibility Study of Economics and Performance of Solar Photovoltaics in Nitro, West Virginia. Prepared in Partnership with the Environmental Protection Agency for the RE-Powering America's Land Initiative.NREL/TP-6A2-48594. Golden, CO: National Renewable Energy Laboratory, 54 pp.
Lisell, L.; Mosey, G. (2010b). Feasibility Study of Economics and Performance of Solar Photovoltaics at the Former St. Marks Refinery in St. Marks, Florida. A Study Prepared in Partnership with the Environmental Protection Agency for the RE-Powering America's Lands Initiative. NREL/TP-6A2-48853. Golden, CO: National Renewable Energy Laboratory. 46 pp.
Lowry, J. H. Jr.; Langs, R. D.; Ramsey, K.; Boykin, D.; Bradford, P.; Comer, S.; Falzarano, W.; Kepner, J.; Kirby, L.; Langs, J.; Prior-Magee, G.; Manis, L.; O’Brien, T.; Sajwaj, K..; Thomas, A.; Rieth, W.; Schrader, S.; Schrupp, D.; Schulz, K.; Thompson, B.; Velasquez, C.; Wallace, C.; Waller, E.; Wolk, B. (2005). "Final Report on Land Cover Mapping Methods." Southwest Regional
Mehos, M.; Kabel, D.; and Smithers, P. (2009). "Planting the Seed." IEEE Power and Energy Magazine, (7:3); pp. 7.
Mosey, G.; Heimiller, D.; Dahle, D.; Vimmerstedt, L.; and Brady-Sabeff, L. (2007). Converting Limbo Lands to Energy-Generating Stations: Renewable Energy Technologies on Underused, Formerly Contaminated Sites. NREL/TP-640-41522. Golden, CO: National Renewable Energy Laboratory. 35 pp.
Mosey, G.; Van Geet, O. (2010). Feasibility Study of Economics and Performance of Solar Photovoltaics at the Stringfellow Superfund Site in Riverside, California. Prepared in Partnership with the Environmental Protection Agency for the RE-Powering America's Land Initiative. NREL/TP-6A20-48770. Golden, CO: National Renewable Energy Laboratory. 39 pp.
National Renewable Energy Laboratory. (2012). "Jobs and Economic Development Impact Models (JEDI)." Accessed 2013: http://www.nrel.gov/analysis/jedi/.
National Renewable Energy Laboratory. (2013). "System Advisor Model (SAM)." Version 2013.1.15. Accessed 2013: https://sam.nrel.gov/.
This report is available at no cost from the National Renewable Energy Laboratory (NREL) at www.nrel.gov/publications.

29
Rivera, C. (2011). SunPower, First Solar subsidiary reach agreement with environmental groups. August 9. SNL Financial.
Salasovich, J.; Mosey, G. (2011). Feasibility Study of Solar Photovoltaics on Landfills in Puerto Rico. NREL/TP-6A20-52181. Golden, CO: National Renewable Energy Laboratory. 88 pp.
Salasovich, J.; Mosey, G. (2012). Feasibility Study of Economics and Performance of Solar Photovoltaics at Johnson County Landfill. NREL/TP-6A20-53186. Golden, CO: National Renewable Energy Laboratory. 46 pp.
Simon, J.; Mosey, G. (2013a). Feasibility Study of Economics and Performance of Solar Photovoltaics at the Kerr McGee Site in Columbus, Mississippi. Prepared in Partnership with the Environmental Protection Agency for the RE-Powering America’s Land Initiative. NREL Report No. TP-7A30-57251. Golden, CO: National Renewable Energy Laboratory. 38 pp.
Simon, J., Mosey, G. (2013b). Feasibility Study of Economics and Performance of Solar Photovoltaics at the Sky Park Landfill Site in Eau Claire, Wisconsin. A Study Prepared in Partnership with the Environmental Protection Agency for the RE-Powering America’s Land Initiative. NREL/TP-7A30-56995. Golden, CO: National Renewable Energy Laboratory. 40 pp.
Stanfield, J. (2011). Environmental group files lawsuit to halt construction of Ivanpah solar project. SNL Financial.
Steen, M.; Lisell, L.; Mosey, G. (2013). Feasibility Study of Economics and Performance of Solar Photovoltaics at the Vincent Mullins Landfill in Tucson, Arizona. A Study Prepared in Partnership with the Environmental Protection Agency for the RE-Powering America’s Land Initiative NREL/TP-7A30-56812. Golden, CO: National Renewable Energy Laboratory. 38 pp.
U.S. Geological Survey. (2012). “Land Cover Trends Project: Classification System.” Accessed 2013: http://landcovertrends.usgs.gov/main/classification.html.
This report is available at no cost from the National Renewable Energy Laboratory (NREL) at www.nrel.gov/publications.

30
Appendix A. EPA Land Definitions Abandon Mine Land (AML): Those lands, waters, and surrounding watersheds contaminated or scarred by extraction, beneficiation, or processing of ores and minerals. Abandoned mine lands include areas where mining or processing activity is temporarily inactive (EPA 2012a).
Agricultural: Defined broadly as land used primarily for production of food and fiber (Anderson 2001).
Barren: Land of limited ability to support life and in which less than one-third of the area has vegetation or other cover (Anderson 2001). It is an area of thin soil, sand, or rocks and if vegetation is present it is more widely spaces and scrubby.
Brownfield: The term "brownfield site" means real property, the expansion, redevelopment, or reuse of which may be complicated by the presence or potential presence of a hazardous substance, pollutant, or contaminant (EPA 2012d).
Disturbed: Land in an altered and often non-vegetated state that due to disturbances. Disturbances can be from mechanical means (forest clear-cutting, earthmoving, scraping, chaining, reservoir drawdown, and other human-induced changes) or from non-mechanical means (disturbances caused by wind, floods, fire, animals, etc.) (USGS 2012).
Invasive Species: A non-indigenous plant or animal species that can harm the environment, human health, or the economy (EPA 2012e).
Resource Conservation and Recovery Act site: A site that is subject to clean up under the Resource Conservation and Recovery Act due to past or current treatment, storage or disposal of hazardous wastes and that has historical releases of contamination (EPA 2012b). “RCRA brownfields” are RCRA facilities where reuse or redevelopment is slow due to real or perceived concerns about actual or potential contamination, liability, and RCRA requirements.
Superfund: 1. The program operated under the legislative authority of CERCLA (Comprehensive Environmental Response, Compensation, and Liability Act of 1980) and SARA (Superfund Amendments and Reauthorization Act) that funds and carries out EPA solid waste emergency and long-term removal and remedial activities. These activities include establishing the National Priorities List, investigating sites for inclusion on the list, determining their priority, and conducting and/or supervising cleanup and other remedial actions. 2. A fund set up under CERCLA to help pay for cleanup of hazardous waste sites and to take legal action to force those responsible for the sites to clean them up. The Superfund consists of funds from taxes imposed upon the petroleum and chemical industries, an environmental tax on corporations, and from general tax revenues (also known as Trust Fund and Hazardous Waste Superfund) (EPA 2012e).
This report is available at no cost from the National Renewable Energy Laboratory (NREL) at www.nrel.gov/publications.

31
Appendix B. Land Classification System
Table B-1. Land Use Categories From NLCD
Land use category reported Land use category for this analysis
Orchards Vineyards and Other High Structure Agriculture
Agriculture
Cultivated Cropland Pasture/Hay Undifferentiated Barren Land Barren lands Introduced Upland Vegetation - Annual Grassland
Invasive species
Introduced Upland Vegetation - Perennial Grassland and Forbland Introduced Upland Vegetation - Shrub Disturbed, Non-specific
Disturbed
Disturbed/Successional - Grass/Forb Regeneration Disturbed/Successional - Shrub Regeneration Quarries, Mines, Gravel Pits and Oil Wells
Table B-2. Land Use Categories for California
Land use category reported Land use category for this analysis
Cropland and Pasture
Agriculture
Irrigated row and field crops
Irrigated hayfield
Dryland grain crops
Rice fields
Confined Feeding Operations
Other Agricultural Land
Mixed barren land Barren lands
Quarries, and gravel pits Disturbed
Transitional bare areas
This report is available at no cost from the National Renewable Energy Laboratory (NREL) at www.nrel.gov/publications.

32
Table B-3. Land Use Categories From SWREGAP
Land use category reported Land use category for this analysis
Agriculture Agriculture Barren Lands, Non-specific Barren lands Invasive plants Invasive Species Disturbed, non-specific Disturbed
Recently burned Recently mined or quarried Disturbed, Oil well
This report is available at no cost from the National Renewable Energy Laboratory (NREL) at www.nrel.gov/publications.

33
Appendix C. Additional Maps DISTURBED LANDS MAPS
Figure C-1. Total barren, invasive, disturbed (BID) land without any restrictions
Figure C-2. Total agriculture land without any restrictions
This report is available at no cost from the National Renewable Energy Laboratory (NREL) at www.nrel.gov/publications.

34
Figure C-3. Large-scale commercial: BID land with land/slope restrictions
Figure C-4. Large-scale commercial: Agriculture land with land/slope restrictions
This report is available at no cost from the National Renewable Energy Laboratory (NREL) at www.nrel.gov/publications.

35
Figure C-5. Utility scale: BID land with land/slope/solar restrictions
Figure C-6. Utility scale: Agriculture land with land/slope/solar resource
This report is available at no cost from the National Renewable Energy Laboratory (NREL) at www.nrel.gov/publications.

36
Figure C-7. Agriculture top 25 sites by area (large-scale commercial PV)
Figure C-8. Agriculture top 25 sites by area (utility-scale PV)
This report is available at no cost from the National Renewable Energy Laboratory (NREL) at www.nrel.gov/publications.

37
Figure C-9. Agriculture top 25 sites by area (CSP)
Figure C-10. LCOE maps of sites with highest solar resource (large-scale commercial PV on barren, invasive species, and disturbed lands)
This report is available at no cost from the National Renewable Energy Laboratory (NREL) at www.nrel.gov/publications.

38
Figure C-11. LCOE maps of sites with highest solar resource (large-scale commercial PV on
agricultural lands)
Figure C-12. LCOE maps of sites with highest solar resource (utility-scale PV on barren, invasive
species, and disturbed lands)
This report is available at no cost from the National Renewable Energy Laboratory (NREL) at www.nrel.gov/publications.

39
Figure C-13. LCOE maps of sites with highest solar resource (utility-scale PV on
agricultural lands)
Figure C-14. LCOE maps of sites with highest solar resource (CSP on barren, invasive species,
and disturbed lands)
This report is available at no cost from the National Renewable Energy Laboratory (NREL) at www.nrel.gov/publications.
40
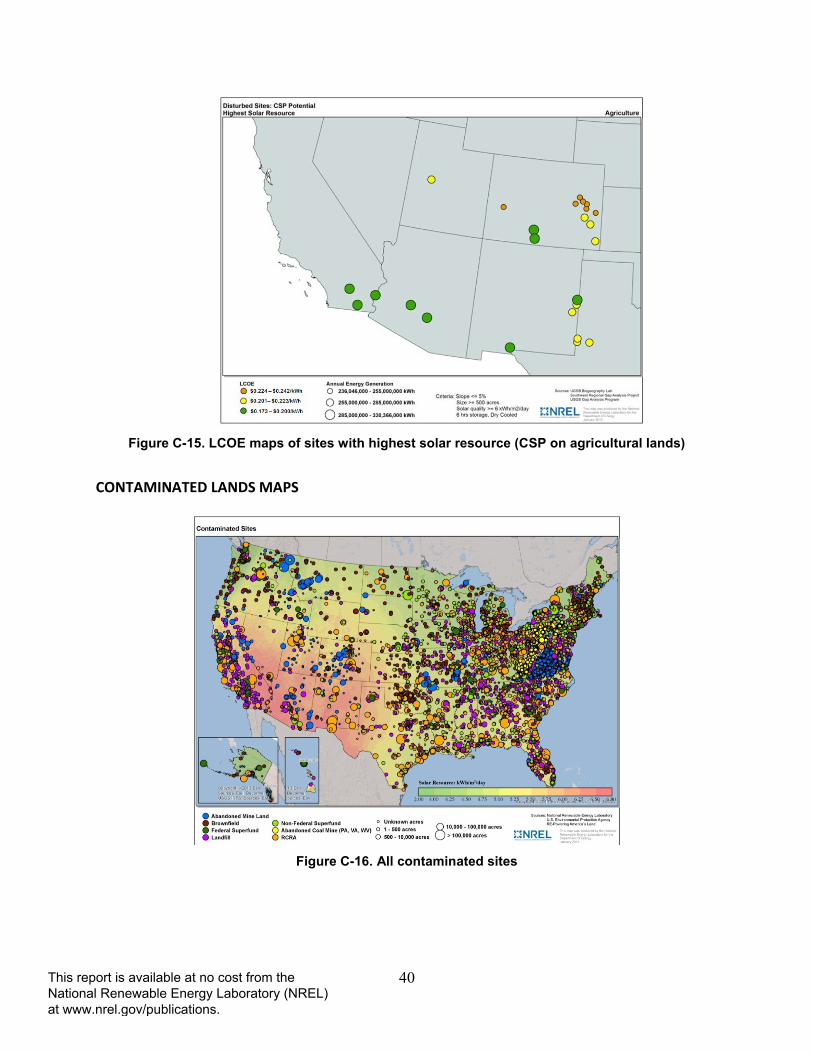
Figure C-15. LCOE maps of sites with highest solar resource (CSP on agricultural lands)
CONTAMINATED LANDS MAPS
Figure C-16. All contaminated sites
This report is available at no cost from the National Renewable Energy Laboratory (NREL) at www.nrel.gov/publications.

41
Figure C-17. Contaminated sites with land/slope restrictions (large-scale commercial PV)
Figure C-18. Contaminated sites with land/slope restrictions (utility-scale PV)
This report is available at no cost from the National Renewable Energy Laboratory (NREL) at www.nrel.gov/publications.

42
Figure C-19. Contaminated sites with land/slope/solar restrictions (CSP)
Figure C-20. Levelized cost of electricity map (large-scale commercial PV on federal lands,
minimum solar resource of 6 kWh/m2/day)
This report is available at no cost from the National Renewable Energy Laboratory (NREL) at www.nrel.gov/publications.

43
Figure C-21. Levelized cost of electricity map (large-scale commercial PV on non-federal lands,
minimum solar resource of 6 kWh/m2/day)
Figure C-22. Levelized cost of electricity map (large-scale commercial PV on federal lands, no
minimum solar resource)
This report is available at no cost from the National Renewable Energy Laboratory (NREL) at www.nrel.gov/publications.

44
Figure C-23. Levelized cost of electricity map (large-scale commercial PV on non-federal lands, no
minimum solar resource)
Figure C-24. Levelized cost of electricity map (utility-scale PV on federal lands, minimum solar
resource of 6 kWh/m2/day)
This report is available at no cost from the National Renewable Energy Laboratory (NREL) at www.nrel.gov/publications.

45
Figure C-25. Levelized cost of electricity map (utility-scale PV on non-federal lands, minimum
solar resource of 6 kWh/m2/day)
Figure C-26. Levelized cost of electricity map (CSP on federal lands, minimum solar resource of 6
kWh/m2/day)
This report is available at no cost from the National Renewable Energy Laboratory (NREL) at www.nrel.gov/publications.

46
Figure C-27. Levelized cost of electricity map (CSP on non-federal lands, minimum solar resource
of 6 kWh/m2/day)
This report is available at no cost from the National Renewable Energy Laboratory (NREL) at www.nrel.gov/publications.