solar cycle distribution of strong solar proton events and the related solar-terrestrial phenomena
TRANSCRIPT
Astrophys Space SciDOI 10.1007/s10509-014-1964-1
O R I G I NA L A RT I C L E
Solar cycle distribution of strong solar proton eventsand the related solar-terrestrial phenomena
Guiming Le · Xingxing Yang · Liuguang Ding ·Yonghua Liu · Yangping Lu · Minhao Chen
Received: 29 April 2014 / Accepted: 6 May 2014© Springer Science+Business Media Dordrecht 2014
Abstract We investigated the solar cycle distribution ofstrong solar proton events (SPEs, peak flux ≥1000 pfu) andthe solar-terrestrial phenomena associated with the strongSPEs during solar cycles 21–23. The results show that 37strong SPEs were registered over this period of time, where20 strong SPEs were originated from the super active re-gions (SARs) and 28 strong SPEs were accompanied by theX-class flares. Most strong SPEs were not associated withthe ground level enhancement (GLE) event. Most strongSPEs occurred in the descending phases of the solar cy-cles. The weaker the solar cycle, the higher the proportionof strong SPES occurred in the descending phase of the cy-cle. The number of the strong SPEs that occurred within asolar cycle is poorly associated with the solar cycle size.The intensity of the SPEs is highly dependent of the locationof their source regions, with the super SPEs (≥20000 pfu)distributed around solar disk center. A super SPE was al-ways accompanied by a fast shock driven by the associatedcoronal mass ejection and a great geomagnetic storm. Thesource location of strongest GLE event is distributed in the
G. Le (B)National Center for Space Weather, China MeteorologicalAdministration, Beijing 100081, Chinae-mail: [email protected]
G. Le · Y. LiuSOA Key Laboratory for Polar Science, Polar Research Instituteof China, Shanghai 200136, China
L. Ding · Y. Lu · M. ChenSchool of Physics and Optoelectronic Engineering, NanjingUniversity of Information Science & Technology, Nanjing,Jiangsu 210044, China
X. YangMeteorological Office of Southwestern, Xingyi 562400, China
well-connected region. The SPEs associated with super GLEevents (peak increase rate ≥100%) which have their peakflux much lower than 10000 pfu were not accompanied byan intense geomagnetic storm.
Keywords Solar flare · Coronal mass ejection · Shock ·Solar proton events · Ground level enhancement ·Geomagnetic storm
1 Introduction
According to the definition of NOAA Space EnvironmentServices Center, a solar proton event (SPE) is defined asan event with a peak intensity of >10 pfu (particle fluxunit; 1 particle cm−2·sr−1·s−1) for >10 MeV protons. So-lar proton events have received widely attentions as a non-relativistic solar energetic particle (SEP) event. Gerontidouet al. (2002) studied the frequency distributions of solar pro-ton events. Kurt et al. (2004) made a statistical analysis ofthe SPEs that occurred during 1970–2002. They pointed outthat 42 SPEs were associated with GLE events and greatnumber of SPEs are connected with west flares. Shea andSmart (1990) pointed out that other than an increase in SPEoccurrence with increasing solar cycle, no recognizable pat-tern could be identified between the occurrence of solar pro-ton events and the solar cycle. Shea and Smart (2007) stud-ied the significant SPEs for five solar cycles and pointed outthat the SPE distributions are different from one solar cy-cle to another and more SPEs generally occur during themaximum of solar activity (years 3 through 8 of the so-lar sunspot cycle) than during the remaining portion of thesolar cycle. Relativistic solar protons interact with Earth’satmosphere and then generate sufficient intensities of sec-ondary particles, which can be observed by the instrument

Astrophys Space Sci
on the ground, this phenomena is termed as ground levelenhancement (GLE) event. Over a solar cycle, only ∼15 %of the SPEs were associated with a GLE event (Shea andSmart 2012). The active regions (ARs) that can producevery strong eruptions would be termed as super active re-gions (SARs). ∼44 % of all the X class X-ray flares wereproduced by 45 SARs during solar cycle 21–23 (Chen et al.2011). ∼77.4 % of the GLE events were produced by SARsduring solar cycles 22 and 23 (Le et al. 2013b). ∼81.08 %of the X5.0–X9.9 flares and 95.2 % of the ≥X10 flareswere produced by SARs during solar cycles 21–23 (Le et al.2014).
What pattern is the solar cycle distribution of strong SPEsduring 1976–2008? How many strong SPEs were accompa-nied by the GLEs? What are the characteristics of the longi-tudinal distribution of the source region of the strong SPEs?And what for the GLE events? How is the geomagnetic ac-tivity associated with the strong SPEs? These questions arethe target of this paper. The data analysis will be presented inSect. 2, the discussion is present in Sect. 3 and the summaryis presented in the final section.
2 Data analysis
The smoothed monthly mean sunspot numbers (SMMSNs)are used to describe the progress of a solar cycle. The SMM-SNs can be obtained from the website http://sidc.oma.be.The period from the minimum of SMMSNs to the maximumof SMMSNs is defined as the ascending phase of the cycle,and that from one month after the maximum of SMMSNsto the minimum of SMMSNs as the descending phase of thecycle. We term the maximum of SMMSN of a solar cycle asthe solar cycle size or the solar cycle intensity.
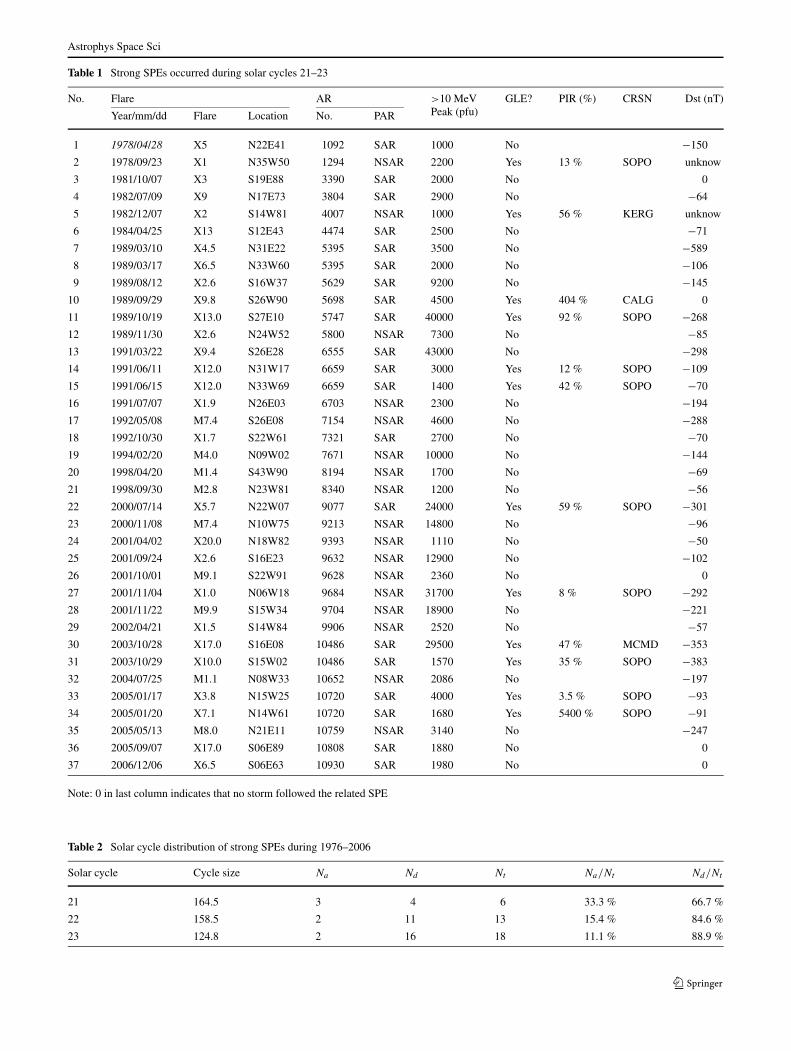
The strong SPEs and the concurrent solar flares data areobtained from the website (http://umbra.nascom.nasa.gov/SEP/). The largest peak increase rates (PIRs) of the GLEevents associated with the strong SPEs were copied from thepaper of Belove et al. (2010). According to the data of strongSPEs, the GLE and the X-ray flare data associated with thestrong SPEs, we get Table 1, which lists the strong SPEsand the related solar-terrestrial phenomena occurred duringsolar cycles 21–23. In the table, strong SPE is numberedin column (1), date in column (2), the intensity of the softX-ray flare in column (3), the flare location in column (4),the NOAA number of the AR in column (5), the propertiesof the ARs in column (6), the intensity of strong SPE incolumn (7), is the strong SPE associated with a GLE in col-umn (8), the PIR of the GLE event in column (9), the cosmicray station name (CRSN) in column (10) and the geomag-netic storms associated with the SPEs in column (11).
We can see from Table 1 that the total number of thestrong SPEs during solar cycles 21–23 was 37 and 12 of
Fig. 1 Solar cycle distribution of strong SPEs. The upper panel isthe smoothed monthly mean sunspot numbers (SMMSNs). The lowerpanel is the time distribution of strong SPEs. The vertical dashed linesindicate the solar cycle maximum. The y-axis of the lower panel is theSPE intensity (SPEI)
them were associated with the GLE events. In other words,more than two thirds of the strong SPEs were not associatedwith GLE events. According to the list of super active re-gions (SARs) that occurred during solar cycles 21–23 (Chenet al. 2011), 54 % of the strong SPEs originated from theSARs. From Table 1, we can get that the solar cycle distri-bution of strong SPEs during solar cycles 21–23 (Fig. 1).Table 2 presents the properties of solar distribution of thestrong SPEs during solar cycles 21–23, where Na and Nd
denote the number of the strong SPEs in the ascending anddescending phase of a solar cycle respectively, and Nt thetotal number of the cycle. We can see from Table 2 that thetotal number of strong SPEs in solar cycles 21, 22 and 23are 6, 13 and 18 respectively. However, the solar cycle sizefor solar cycles 21, 22 and 23 are 164.5, 158.5 and 124.8respectively. This suggests that the total number of strongSPEs within a solar cycle has a poor correlation with thesolar cycle size. In cycle 21, 22 and 23, 66.7 %, 84.6 %and 88.9 % of the strong SPEs appeared in the descendingphase, suggesting that the weaker the solar cycle, the higherthe proportion of the strong SPEs occurred in the descend-ing phase. All SPEs with peak intensity ≥5000 pfu occurredin the descending phases during solar cycles 21–23.
According to Table 1, the longitudinal distribution of thestrong SPEs and the intensity of the GLE events associatedwith the strong SPEs are shown in Fig. 2. We can see fromFig. 2 that both the intensity of SPEs and the GLE eventsis highly dependent of the longitudes of the source regions.The solar source of the super SPEs (≥20000 pfu) were dis-tributed in the longitudinal area from E28° to W18°, i.e., thesuper SPEs occurred in the area around solar disk center.However, the source regions for the super GLE events asso-ciated with strong SPEs were distributed in the longitudinalarea from W60° to W90°. Evidently, the strongest SPE isdistributed around the solar disk center, while the strongestGLE event is distributed in the well-connected region.
Shea and Smart (2012) summarizes the space weather ef-fects associated with GLE events during the solar cycle 23.
Astrophys Space Sci
Table 1 Strong SPEs occurred during solar cycles 21–23
No. Flare AR >10 MeVPeak (pfu)
GLE? PIR (%) CRSN Dst (nT)
Year/mm/dd Flare Location No. PAR
1 1978/04/28 X5 N22E41 1092 SAR 1000 No −150
2 1978/09/23 X1 N35W50 1294 NSAR 2200 Yes 13 % SOPO unknow
3 1981/10/07 X3 S19E88 3390 SAR 2000 No 0
4 1982/07/09 X9 N17E73 3804 SAR 2900 No −64
5 1982/12/07 X2 S14W81 4007 NSAR 1000 Yes 56 % KERG unknow
6 1984/04/25 X13 S12E43 4474 SAR 2500 No −71
7 1989/03/10 X4.5 N31E22 5395 SAR 3500 No −589
8 1989/03/17 X6.5 N33W60 5395 SAR 2000 No −106
9 1989/08/12 X2.6 S16W37 5629 SAR 9200 No −145
10 1989/09/29 X9.8 S26W90 5698 SAR 4500 Yes 404 % CALG 0
11 1989/10/19 X13.0 S27E10 5747 SAR 40000 Yes 92 % SOPO −268
12 1989/11/30 X2.6 N24W52 5800 NSAR 7300 No −85
13 1991/03/22 X9.4 S26E28 6555 SAR 43000 No −298
14 1991/06/11 X12.0 N31W17 6659 SAR 3000 Yes 12 % SOPO −109
15 1991/06/15 X12.0 N33W69 6659 SAR 1400 Yes 42 % SOPO −70
16 1991/07/07 X1.9 N26E03 6703 NSAR 2300 No −194
17 1992/05/08 M7.4 S26E08 7154 NSAR 4600 No −288
18 1992/10/30 X1.7 S22W61 7321 SAR 2700 No −70
19 1994/02/20 M4.0 N09W02 7671 NSAR 10000 No −144
20 1998/04/20 M1.4 S43W90 8194 NSAR 1700 No −69
21 1998/09/30 M2.8 N23W81 8340 NSAR 1200 No −56
22 2000/07/14 X5.7 N22W07 9077 SAR 24000 Yes 59 % SOPO −301
23 2000/11/08 M7.4 N10W75 9213 NSAR 14800 No −96
24 2001/04/02 X20.0 N18W82 9393 NSAR 1110 No −50
25 2001/09/24 X2.6 S16E23 9632 NSAR 12900 No −102
26 2001/10/01 M9.1 S22W91 9628 NSAR 2360 No 0
27 2001/11/04 X1.0 N06W18 9684 NSAR 31700 Yes 8 % SOPO −292
28 2001/11/22 M9.9 S15W34 9704 NSAR 18900 No −221
29 2002/04/21 X1.5 S14W84 9906 NSAR 2520 No −57
30 2003/10/28 X17.0 S16E08 10486 SAR 29500 Yes 47 % MCMD −353
31 2003/10/29 X10.0 S15W02 10486 SAR 1570 Yes 35 % SOPO −383
32 2004/07/25 M1.1 N08W33 10652 NSAR 2086 No −197
33 2005/01/17 X3.8 N15W25 10720 SAR 4000 Yes 3.5 % SOPO −93
34 2005/01/20 X7.1 N14W61 10720 SAR 1680 Yes 5400 % SOPO −91
35 2005/05/13 M8.0 N21E11 10759 NSAR 3140 No −247
36 2005/09/07 X17.0 S06E89 10808 SAR 1880 No 0
37 2006/12/06 X6.5 S06E63 10930 SAR 1980 No 0
Note: 0 in last column indicates that no storm followed the related SPE
Table 2 Solar cycle distribution of strong SPEs during 1976–2006
Solar cycle Cycle size Na Nd Nt Na/Nt Nd/Nt
21 164.5 3 4 6 33.3 % 66.7 %
22 158.5 2 11 13 15.4 % 84.6 %
23 124.8 2 16 18 11.1 % 88.9 %
Astrophys Space Sci
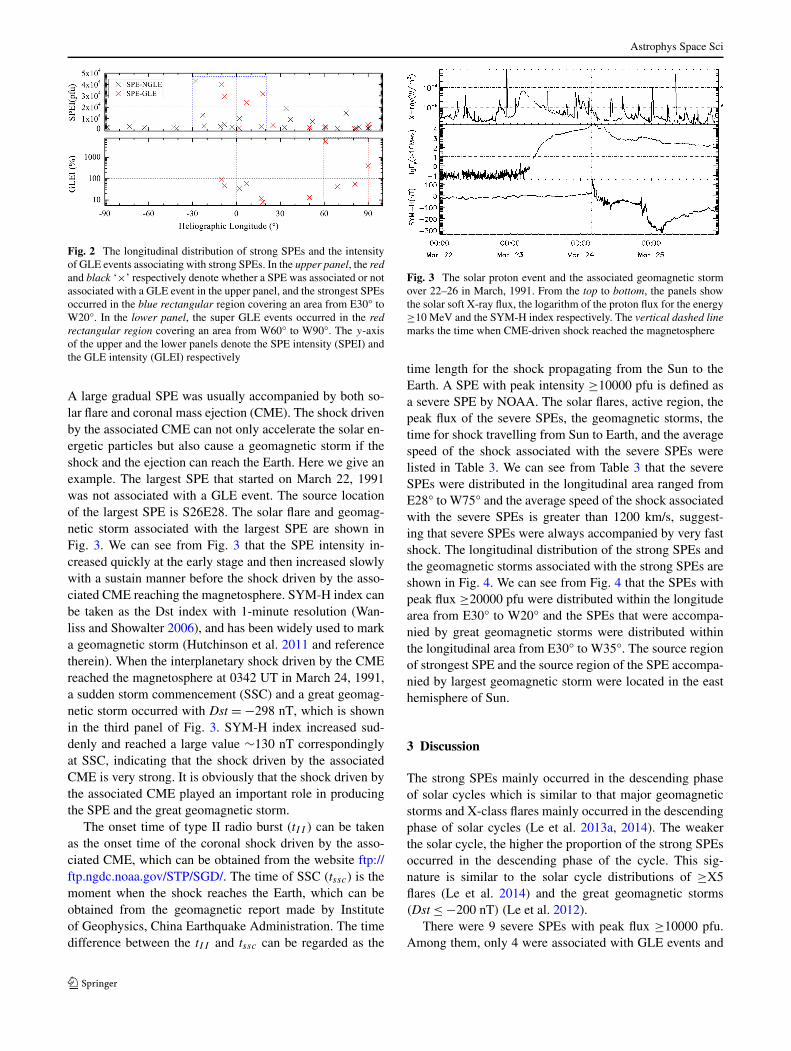
Fig. 2 The longitudinal distribution of strong SPEs and the intensityof GLE events associating with strong SPEs. In the upper panel, the redand black ‘×’ respectively denote whether a SPE was associated or notassociated with a GLE event in the upper panel, and the strongest SPEsoccurred in the blue rectangular region covering an area from E30° toW20°. In the lower panel, the super GLE events occurred in the redrectangular region covering an area from W60° to W90°. The y-axisof the upper and the lower panels denote the SPE intensity (SPEI) andthe GLE intensity (GLEI) respectively
A large gradual SPE was usually accompanied by both so-lar flare and coronal mass ejection (CME). The shock drivenby the associated CME can not only accelerate the solar en-ergetic particles but also cause a geomagnetic storm if theshock and the ejection can reach the Earth. Here we give anexample. The largest SPE that started on March 22, 1991was not associated with a GLE event. The source locationof the largest SPE is S26E28. The solar flare and geomag-netic storm associated with the largest SPE are shown inFig. 3. We can see from Fig. 3 that the SPE intensity in-creased quickly at the early stage and then increased slowlywith a sustain manner before the shock driven by the asso-ciated CME reaching the magnetosphere. SYM-H index canbe taken as the Dst index with 1-minute resolution (Wan-liss and Showalter 2006), and has been widely used to marka geomagnetic storm (Hutchinson et al. 2011 and referencetherein). When the interplanetary shock driven by the CMEreached the magnetosphere at 0342 UT in March 24, 1991,a sudden storm commencement (SSC) and a great geomag-netic storm occurred with Dst = −298 nT, which is shownin the third panel of Fig. 3. SYM-H index increased sud-denly and reached a large value ∼130 nT correspondinglyat SSC, indicating that the shock driven by the associatedCME is very strong. It is obviously that the shock driven bythe associated CME played an important role in producingthe SPE and the great geomagnetic storm.
The onset time of type II radio burst (tII ) can be takenas the onset time of the coronal shock driven by the asso-ciated CME, which can be obtained from the website ftp://ftp.ngdc.noaa.gov/STP/SGD/. The time of SSC (tssc) is themoment when the shock reaches the Earth, which can beobtained from the geomagnetic report made by Instituteof Geophysics, China Earthquake Administration. The timedifference between the tII and tssc can be regarded as the
Fig. 3 The solar proton event and the associated geomagnetic stormover 22–26 in March, 1991. From the top to bottom, the panels showthe solar soft X-ray flux, the logarithm of the proton flux for the energy≥10 MeV and the SYM-H index respectively. The vertical dashed linemarks the time when CME-driven shock reached the magnetosphere
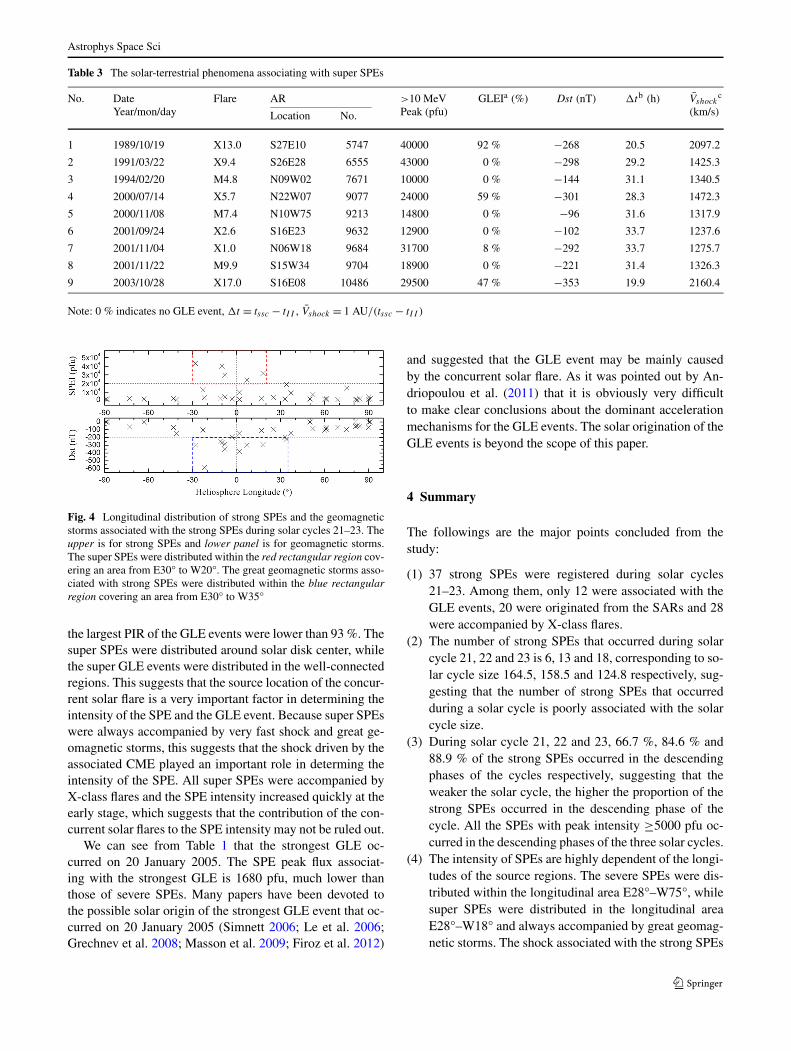
time length for the shock propagating from the Sun to theEarth. A SPE with peak intensity ≥10000 pfu is defined asa severe SPE by NOAA. The solar flares, active region, thepeak flux of the severe SPEs, the geomagnetic storms, thetime for shock travelling from Sun to Earth, and the averagespeed of the shock associated with the severe SPEs werelisted in Table 3. We can see from Table 3 that the severeSPEs were distributed in the longitudinal area ranged fromE28° to W75° and the average speed of the shock associatedwith the severe SPEs is greater than 1200 km/s, suggest-ing that severe SPEs were always accompanied by very fastshock. The longitudinal distribution of the strong SPEs andthe geomagnetic storms associated with the strong SPEs areshown in Fig. 4. We can see from Fig. 4 that the SPEs withpeak flux ≥20000 pfu were distributed within the longitudearea from E30° to W20° and the SPEs that were accompa-nied by great geomagnetic storms were distributed withinthe longitudinal area from E30° to W35°. The source regionof strongest SPE and the source region of the SPE accompa-nied by largest geomagnetic storm were located in the easthemisphere of Sun.
3 Discussion
The strong SPEs mainly occurred in the descending phaseof solar cycles which is similar to that major geomagneticstorms and X-class flares mainly occurred in the descendingphase of solar cycles (Le et al. 2013a, 2014). The weakerthe solar cycle, the higher the proportion of the strong SPEsoccurred in the descending phase of the cycle. This sig-nature is similar to the solar cycle distributions of ≥X5flares (Le et al. 2014) and the great geomagnetic storms(Dst ≤ −200 nT) (Le et al. 2012).
There were 9 severe SPEs with peak flux ≥10000 pfu.Among them, only 4 were associated with GLE events and
Astrophys Space Sci
Table 3 The solar-terrestrial phenomena associating with super SPEs
No. DateYear/mon/day
Flare AR >10 MeVPeak (pfu)
GLEIa (%) Dst (nT) �tb (h) V̄shockc
(km/s)Location No.
1 1989/10/19 X13.0 S27E10 5747 40000 92 % −268 20.5 2097.2
2 1991/03/22 X9.4 S26E28 6555 43000 0 % −298 29.2 1425.3
3 1994/02/20 M4.8 N09W02 7671 10000 0 % −144 31.1 1340.5
4 2000/07/14 X5.7 N22W07 9077 24000 59 % −301 28.3 1472.3
5 2000/11/08 M7.4 N10W75 9213 14800 0 % −96 31.6 1317.9
6 2001/09/24 X2.6 S16E23 9632 12900 0 % −102 33.7 1237.6
7 2001/11/04 X1.0 N06W18 9684 31700 8 % −292 33.7 1275.7
8 2001/11/22 M9.9 S15W34 9704 18900 0 % −221 31.4 1326.3
9 2003/10/28 X17.0 S16E08 10486 29500 47 % −353 19.9 2160.4
Note: 0 % indicates no GLE event, �t = tssc − tII , V̄shock = 1 AU/(tssc − tII )
Fig. 4 Longitudinal distribution of strong SPEs and the geomagneticstorms associated with the strong SPEs during solar cycles 21–23. Theupper is for strong SPEs and lower panel is for geomagnetic storms.The super SPEs were distributed within the red rectangular region cov-ering an area from E30° to W20°. The great geomagnetic storms asso-ciated with strong SPEs were distributed within the blue rectangularregion covering an area from E30° to W35°
the largest PIR of the GLE events were lower than 93 %. Thesuper SPEs were distributed around solar disk center, whilethe super GLE events were distributed in the well-connectedregions. This suggests that the source location of the concur-rent solar flare is a very important factor in determining theintensity of the SPE and the GLE event. Because super SPEswere always accompanied by very fast shock and great ge-omagnetic storms, this suggests that the shock driven by theassociated CME played an important role in determing theintensity of the SPE. All super SPEs were accompanied byX-class flares and the SPE intensity increased quickly at theearly stage, which suggests that the contribution of the con-current solar flares to the SPE intensity may not be ruled out.
We can see from Table 1 that the strongest GLE oc-curred on 20 January 2005. The SPE peak flux associat-ing with the strongest GLE is 1680 pfu, much lower thanthose of severe SPEs. Many papers have been devoted tothe possible solar origin of the strongest GLE event that oc-curred on 20 January 2005 (Simnett 2006; Le et al. 2006;Grechnev et al. 2008; Masson et al. 2009; Firoz et al. 2012)
and suggested that the GLE event may be mainly causedby the concurrent solar flare. As it was pointed out by An-driopoulou et al. (2011) that it is obviously very difficultto make clear conclusions about the dominant accelerationmechanisms for the GLE events. The solar origination of theGLE events is beyond the scope of this paper.
4 Summary
The followings are the major points concluded from thestudy:
(1) 37 strong SPEs were registered during solar cycles21–23. Among them, only 12 were associated with theGLE events, 20 were originated from the SARs and 28were accompanied by X-class flares.
(2) The number of strong SPEs that occurred during solarcycle 21, 22 and 23 is 6, 13 and 18, corresponding to so-lar cycle size 164.5, 158.5 and 124.8 respectively, sug-gesting that the number of strong SPEs that occurredduring a solar cycle is poorly associated with the solarcycle size.
(3) During solar cycle 21, 22 and 23, 66.7 %, 84.6 % and88.9 % of the strong SPEs occurred in the descendingphases of the cycles respectively, suggesting that theweaker the solar cycle, the higher the proportion of thestrong SPEs occurred in the descending phase of thecycle. All the SPEs with peak intensity ≥5000 pfu oc-curred in the descending phases of the three solar cycles.
(4) The intensity of SPEs are highly dependent of the longi-tudes of the source regions. The severe SPEs were dis-tributed within the longitudinal area E28°–W75°, whilesuper SPEs were distributed in the longitudinal areaE28°–W18° and always accompanied by great geomag-netic storms. The shock associated with the strong SPEs
Astrophys Space Sci
played an important role in determining the intensity ofthe SPEs and the subsequent geomagnetic storms.
(5) The intensity of geomagnetic storms associated with thestrong SPEs are also dependent of the longitudes of thesource regions. The SPEs that were accompanied bygreat geomagnetic storms were distributed in the lon-gitudinal area E30°–W35°. The source region for thestrongest SPE and the SPE that was accompanied bystrongest geomagnetic storm were located in the easthemisphere.
(6) The intensity of GLE events highly depends on the lon-gitudes of the source regions. The super GLE events thatwere associated with the strong SPEs were distributedin the longitudinal area W60°–W90°. The super GLEevents were not accompanied by intense geomagneticstorms and the peak flux of SPEs associating with superGLE is much lower than those of severe SPEs.
Acknowledgements We thank NOAA for it provides the solarsoft X-ray, solar proton event data, and thank Solar Influences DataAnalysis Center for it provides smoothed monthly mean sunspotnumbers. This work is supported by the National Basic ResearchProgram of China (973 Program, Grant No. 2012CB957801), Na-tional Natural Science Foundation of China (Grant No. 41074132,41274193, 41304150), National Standard Research Program (GrantNo. 200710123), and Shanghai Pujing Talent Project (12PJ1409200).
References
Andriopoulou, M., Mavromichalaki, H., Plainaki, C., et al.: Sol. Phys.269, 155 (2011)
Belove, A.V., Eroshenko, E.A., Kryakunova, O.N., et al.: Geomagn.Aeron. 50, 21 (2010)
Chen, A.Q., Wang, J.X., Li, J.W., et al.: Astron. Astrophys. 534, A47(2011)
Firoz, K.A., Gan, W.Q., Moon, Y.-J., Li, C.: Astrophys. J. 758, 119(2012)
Gerontidou, M., Vassilakia, A., Mavromichalakia, H., Kurtb, V.: J. At-mos. Sol.-Terr. Phys. 64, 489 (2002)
Grechnev, V.V., Kurt, V.G., Chertok, I.M., et al.: Sol. Phys. 252, 149(2008)
Hutchinson, J.A., Wright, D.M., Milan, S.E.: J. Geophys. Res. 116,A09211 (2011)
Kurt, V., Belov, A., Mavromichalaki, H., Gerontidou, M.: Ann. Geo-phys. 22, 2255 (2004)
Le, G.-M., Tang, Y.H., Han, Y.B., et al.: Chin. J. Astron. Astrophys. 6,751 (2006)
Le, G., Cai, Z., Wang, H., Zhu, Y.: Astrophys. Space Sci. 339, 151(2012)
Le, G.-M., Cai, Z., Wang, H.-N., et al.: Res. Astron. Astrophys. 13, 739(2013a)
Le, G.-M., Li, P., Yang, H.-g., et al.: Res. Astron. Astrophys. 13, 1219(2013b)
Le, G., Yang, X.-X., Liu, Y.-H., et al.: Astrophys. Space Sci. 350, 443(2014)
Masson, S., Klein, K.-L., Bütikofer, R., et al.: Sol. Phys. 257, 305(2009)
Shea, M.A., Smart, D.F.: Sol. Phys. 127, 297 (1990)Shea, M.A., Smart, D.F.: In: Proceedings of the 30th ICRC, vol. 1 (SH),
p. 261 (2007)Shea, M.A., Smart, D.F.: Space Sci. Rev. 171, 161 (2012)Simnett, G.M.: Astron. Astrophys. 445, 715 (2006)Wanliss, J.A., Showalter, K.M.: J. Geophys. Res. 111, A02202 (2006)