soil-water characteristic curves of stabilized expansive soils
TRANSCRIPT
Dow
nloa
ded
from
asc
elib
rary
.org
by
Uni
vers
ity O
f C
entr
al F
lori
da o
n 01
/24/
14. C
opyr
ight
ASC
E. F
or p
erso
nal u
se o
nly;
all
righ
ts r
eser
ved.
Soil-Water Characteristic Curvesof Stabilized Expansive Soils
Anand J. Puppala, P.E.1; Koonnamas Punthutaecha2; and Sai K. Vanapalli, P.E.3
Abstract: The engineering properties of expansive soils are conventionally improved through the use of additives such as fly ash, lime,and chemical additives. Such soils are often referred to as stabilized or modified or treated expansive soils. The soil-water characteristiccurves �SWCC� of two expansive soils from Texas were measured both in natural and stabilized conditions using the pressure plateapparatus in the suction range of 0-1,000 kPa. The SWCC results are used to interpret the expansive soil behavior due to stabilizertreatment. In addition, relationships were developed between the basic soil and stabilizer properties such as water content, dry density,liquid limit, plastic limit, and stabilizer dosages and the model constants of the SWCC formulation of Fredlund and Xing via multiplelinear regression analysis. The analysis showed that higher coefficients of correlations can be achieved by using six independent soilproperties. The comparisons between the predicted and measured volumetric water contents are within ±20% for ash-treated expansivesoils, and within ±15% for combined ash- and fiber-treated expansive soils. The research data and interpretation analysis presented herecan be extended to understand volume change behaviors of other stabilized expansive soils using the SWCC test data.
DOI: 10.1061/�ASCE�1090-0241�2006�132:6�736�
CE Database subject headings: Unsaturated soils; Swelling; Fly ash; Bottom ash; Fibers; Suction; Soil water; Expansive soils.
Introduction
Expansive soils are commonly found in many arid and semiaridareas in the world such as Australia, Canada, China, India, Israel,South Africa, and the United States. These soils typically exhibitmoderate to high plasticity, low to moderate strength, and highswell and shrinkage characteristics �Holtz and Gibbs 1956;Sherwood 1962; Aitchison et al. 1973; Lytton 1981; Alonso et al.1987; Chen 1988�. Structures built on expansive soils tend toundergo moderate to severe cracking problems due to swellingand shrinkage behavior �Nelson and Miller 1992�. The damageassociated with the construction of lightly loaded structures suchas pavements and residential structures on expansive soils haseconomical implications. The studies of Jones and Holtz �1973�show the losses associated with the damage to structures con-structed on expansive soils in the United States is 9 billion dollarsper year. These losses are greater than all the combined losses dueto natural hazards such as floods, earthquakes, and tornadoes.
Several investigators have undertaken studies to determineempirical relations to estimate the swelling characteristics of ex-
1Professor, Dept. of Civil and Environmental Engineering, The Univ.of Texas at Arlington, Arlington, TX 76019. E-mail: [email protected]
2Formerly, Doctoral Student, Dept. of Civil and EnvironmentalEngineering, The Univ. of Texas at Arlington, Arlington, TX 76019.E-mail: [email protected]
3Dept. of Civil Engineering, Univ. of Ottawa, Ottawa, ON, CanadaK1N6N5. E-mail: [email protected]
Note. Discussion open until November 1, 2006. Separate discussionsmust be submitted for individual papers. To extend the closing date byone month, a written request must be filed with the ASCE ManagingEditor. The manuscript for this paper was submitted for review and pos-sible publication on August 1, 2003; approved on October 7, 2005. Thispaper is part of the Journal of Geotechnical and GeoenvironmentalEngineering, Vol. 132, No. 6, June 1, 2006. ©ASCE, ISSN 1090-0241/
2006/6-736–751/$25.00.736 / JOURNAL OF GEOTECHNICAL AND GEOENVIRONMENTAL ENGINE
J. Geotech. Geoenviron. Eng
pansive soils based on Atterberg limits, index properties includingliquidity index, and other simple soil properties determined fromthe laboratory or field tests �Holtz and Gibbs 1956; Seed et al.1962; Van der Merwe 1964; Richards et al. 1984�. These studieswere useful to understand some aspects of the expansive soilsbehavior; however, they do not provide a conceptual frameworkto interpret engineering behavior. This is because different soilsthat have the same Atterberg limits can exhibit different volumechange behavior and shear strength characteristics as many pa-rameters such as soil structure, chemical composition, and miner-als present in the soil can influence their behavior.
Engineering behavior of collapsible, residual, compacted, andexpansive soils that are typically in a state of unsaturated condi-tion can be better interpreted if the influence of matric suction istaken into account �Fredlund 2000�. Experimental studies relatedto the direct measurements of unsaturated soil properties is timeconsuming and expensive. For this reason, during the last decade,the focus of research has been toward development of numericalmodels or semiempirical procedures to predict the engineeringbehavior of unsaturated soils using the soil water characteristiccurve �SWCC� �Barbour 1998�. The SWCC describes the rela-tionship between gravimetric water content, w, or volumetricwater content, �, or degree of saturation, S, and soil suction,�ua−uw�, of the soil, where ua�pore air pressure and uw�porewater pressure. The SWCC has proven to be a valuable concep-tual and interpretative tool by which the engineering behavior ofunsaturated soils such as flow, strength, and volume change be-havior can be understood and predicted. Although the above-mentioned studies are promising for the extension of principles ofunsaturated soils into conventional engineering practice, a limitednumber of investigative studies have been undertaken to study theSWCC of expansive soils �Rahardjo et al. 1995; Ng et al. 2000;Bao and Ng 2000; Likos et al. 2003�.
The engineering behavior of expansive soils is traditionally
improved by stabilization techniques through the use of additivesERING © ASCE / JUNE 2006
. 2006.132:736-751.
Dow
nloa
ded
from
asc
elib
rary
.org
by
Uni
vers
ity O
f C
entr
al F
lori
da o
n 01
/24/
14. C
opyr
ight
ASC
E. F
or p
erso
nal u
se o
nly;
all
righ
ts r
eser
ved.
such as fly ash and chemicals. In this paper, the SWCC behaviorof two natural and stabilized expansive soils from Texas �i.e.,Dallas-Fort Worth and Arlington clays� are presented. The mainfocus has been to study the effects of stabilizer treatment on theSWCCs of soils. Two types of treatments that include chemical�coal combustion products� and combined chemical-mechanical�ashes-fibers� treatment methods were studied. The SWCCs weremeasured using pressure plate apparatus in the suction rangeof 0–1,000 kPa and the test results were analyzed using theFredlund and Xing �1994� equation. The three model constants ofthe Fredlund and Xing �1994� equation �i.e., a ,n, and m� werethen correlated with basic soil properties, stabilizer types, anddosage proportions extending multiple linear regression analysis.The correlations developed were evaluated to predict the SWCCsof the untreated and treated expansive soils. The correlations thatprovided best predictions are recommended for soils similar tothose used in the experimental studies. No attempt was made toextend the SWCC analysis to interpret swell and swell pressurebehavior of treated or untreated expansive soils.
Background
Numerous models are available in the literature to represent theexperimental results of the SWCC into mathematical models. Sill-ers et al. �2001� provided a comprehensive coverage of thesemodels. Of the many formulations available in the literature,Brooks and Corey �1964�, van Genuchten �1980�, and Fredlundand Xing �1994� equations are commonly used to representSWCC data. Comprehensive studies by Leong and Rahardjo�1997� and Sillers et al. �2001� have shown that the experimentaldata for various soils over a wide soil suction range can be wellfitted using the Fredlund and Xing �1994� equation. Due to thisreason, the Fredlund and Xing �1994� equation is used in theanalysis of this paper.
The Fredlund and Xing �1994� model formulation provides acontinuous SWCC as a function of volumetric water content overthe entire soil suction range of 0–1,000,000 kPa in terms ofthree parameters designated as a ,n, and m. The Fredlund andXing �1994� model equation can be expressed in the followingform
�v =�s
�ln�e + ��
a�n��m
�1�
where �v�volumetric water content; �s�saturated water content�volumetric water content at suction�0 kPa�; e�void ratio;��the soil suction �kPa�; and a ,n ,m�model parameters. Themodel parameters in this equation can be related to the key char-acteristics of the unsaturated soil behavior. For example, the aparameter is related to the air-entry value, which is the suctionvalue at which air starts to enter the largest pores in the soil. Then parameter is related to pore-size distribution of the soil, whichcontrols the slope of the SWCC. The m parameter is related toasymmetry of the model curve.
The relationships for model constants of the Fredlund andXing �1994� equation were obtained in terms of basic soil prop-erties including water content, dry density, liquid limit, plasticlimit, and stabilizer properties including dosages via multiple lin-ear regression analysis. In other words, the uniqueness of the data
was examined using the model constants of the Fredlund andJOURNAL OF GEOTECHNICAL AND
J. Geotech. Geoenviron. Eng
Xing �1994� equation obtained by performing statistical regres-sion analysis in this paper.
Experimental Program
The experimental program for the research was conducted in twophases. In the first phase of the study, expansive soils were stabi-lized using Class F fly ash and bottom ash. Four different propor-tions of each stabilizer were studied. In the second phase,combined treatment studies were undertaken using ashes �Class Ffly ash and bottom ash� and fibers �nylon and polypropylenefibers�. In the research work presented in this paper, the SWCCwere obtained following the drying path in the suction range of0–1,000 kPa. This range of suction is of interest to practicingengineers dealing with compacted and stabilized subsoils undercovered structures such as pavements.
Materials
The samples of natural, expansive soils used in this study werecollected from the Dallas-Fort Worth International Airport in Irv-
Table 1. Physical Soil Properties of DFW and Arlington Soils
Soil property DFW soil Arlington soil
% passing No. 200 91 87
Specific gravity, Gs 2.65 2.46
Liquid limit, wL �%� 50 44
Plastic limit, wP �%� 18 22
Plasticity index, Ip �%� 32 22
Optimum moisturecontent �%�
16.04 17.49
Maximum dry unitweight �kN/m3�
15.96 16.26
Volumetric swell strain atoptimum moisturecontent �%�
9.8 8.1
Swell pressure �kPa� 101.6 116.0
USCS classification CL CL
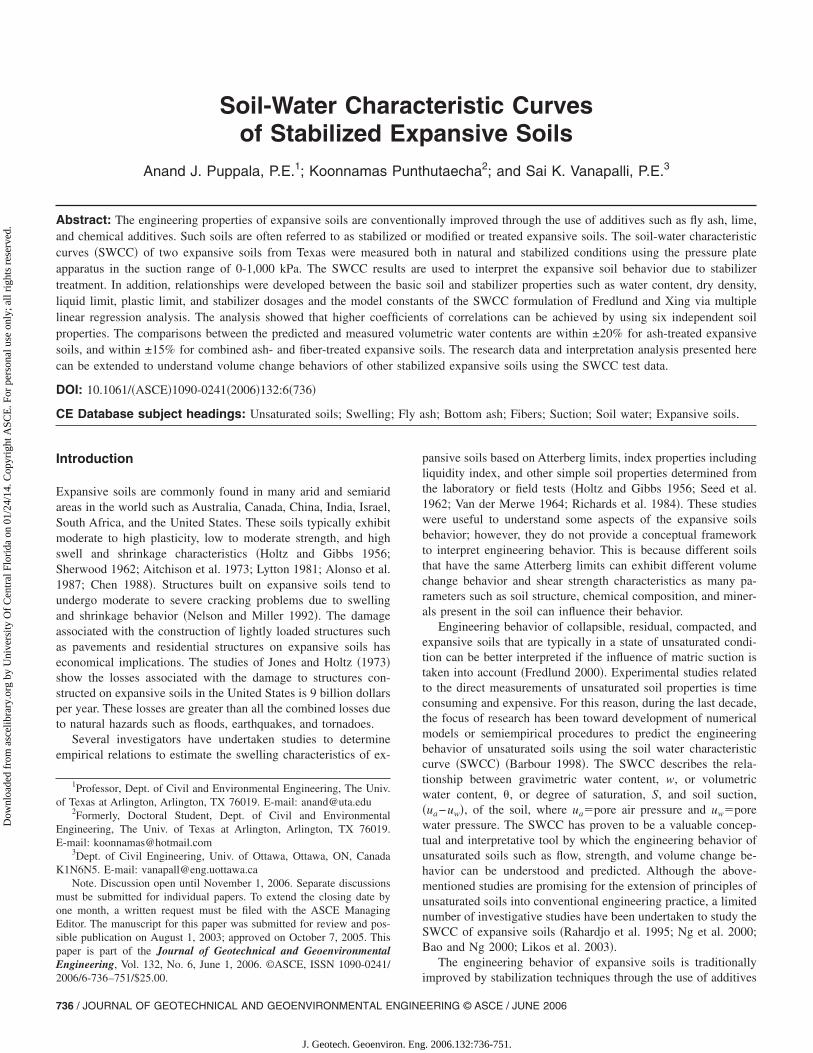
Fig. 1. Standard proctor compaction test results of DFW andArlington clays
GEOENVIRONMENTAL ENGINEERING © ASCE / JUNE 2006 / 737
. 2006.132:736-751.
Dow
nloa
ded
from
asc
elib
rary
.org
by
Uni
vers
ity O
f C
entr
al F
lori
da o
n 01
/24/
14. C
opyr
ight
ASC
E. F
or p
erso
nal u
se o
nly;
all
righ
ts r
eser
ved.
ing, Tex., and South Arlington, Tex. These samples are respec-tively identified as DFW and Arlington clays. The DFW clay isyellow in color and the Arlington clay is medium brown/gray incolor. X-ray diffraction studies show that both clays contain clayminerals including montmorillonite, and illite and nonclay miner-als including quartz. The plasticity index �Ip� values of the DFWand Arlington clay are 32 and 22%, respectively. Fig. 1 presentscompaction characteristics measured from standard Proctor testsfor both soils.
Swell Pressure Tests
The swell pressure was measured by testing a compacted soilspecimen in a consolidation apparatus following ASTM D-4546�2000a� method. Soil specimens of 63.5 mm in diameter and24.5 mm in height were compacted at optimum moisture contentconditions and subjected to swell by providing access for thespecimens to imbibe water. Loading increments were added to the
Table 2. Chemical Composition of Coal Combustion Ashes
Chemical composition�%�
Class Fflyash�F1�
Class Fflyash�F2� Bottom asha
Silicon dioxide �SiO2� 54.8 63.0 21–60
Aluminum oxide �Al2O3� 22.3 19.7 10–37
Calcium oxide �CaO� 9.8 7.4 0–22
Sulfur trioxide �SO3� 0.6 0.1 N/A
Ferric oxide �Fe2O3� 5.1 4.9 5–37
Magnesium oxide �MgO� — 1.6 0–4
% passing No. 40 — — 44
% passing No. 200 — — 8aRange was provided by the supplier.
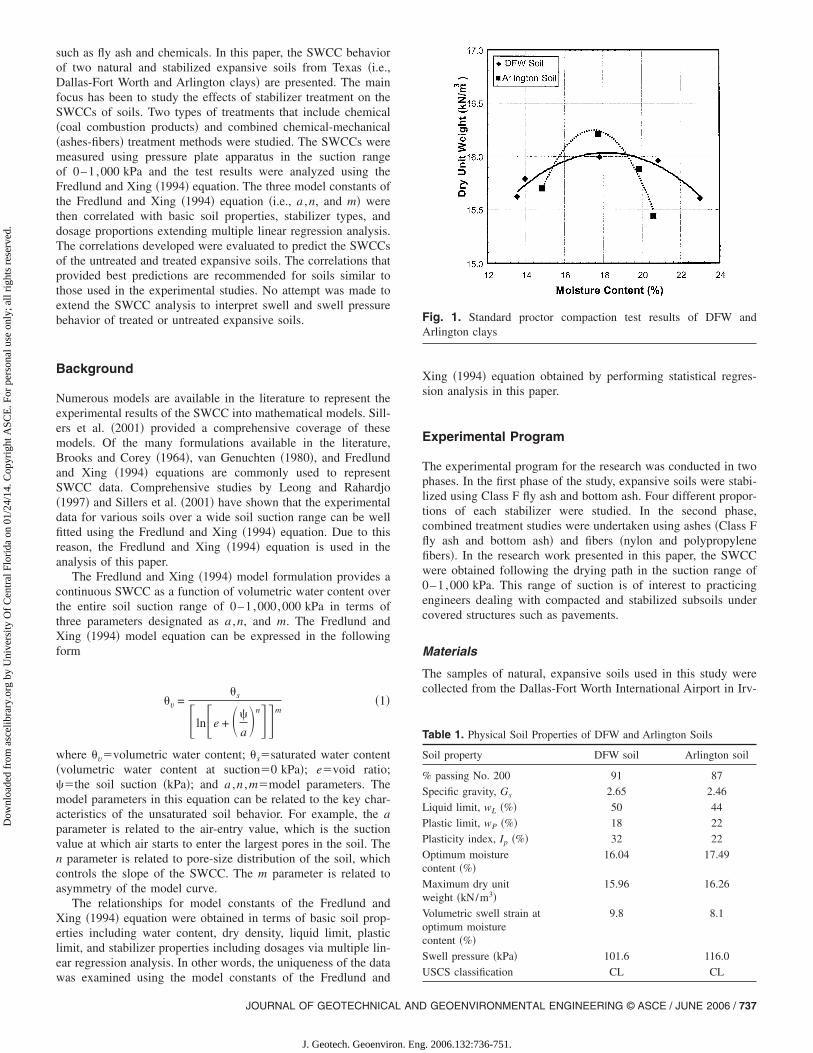
Fig. 2. Pressure plate setup used for the de
738 / JOURNAL OF GEOTECHNICAL AND GEOENVIRONMENTAL ENGINE
J. Geotech. Geoenviron. Eng
specimens in order to maintain zero swell strain condition duringthe testing period. The final load increment at zero percent swellwas determined and used to calculate swell pressure. Both physi-cal and swell properties of the control soils are presented in Table1. Based on the magnitudes of volumetric swell strain and swellpressure values, both the control soils used in this research can beconsidered as moderate expansive soils �Chen 1988�. More detailsof the volumetric swell strain and swell pressure test proceduresare available in Punthutaecha �2002�.
Soil Stabilizers Used
The three ash stabilizers used in the study were produced fromdifferent coal combustion plants. The first ash stabilizer, Class Ffly ash, which is termed as “Fly Ash 1” or “F1,” is a product fromthe Mohave plant in Texas. The second and third ash stabilizers,“Fly Ash 2” or “F2” and “bottom ash,” respectively, are producedfrom the Monticello plant in Texas. Chemical properties of these
Table 3. Physical Characteristics of Recycled Plastic Fibers
PropertiesPolypropylene fibers
�PP�Nylon fibers
�N�
Tensile strength 669 MPa 910–980 MPa
Young’s modulus 4020 MPa 5175 MPa
Melting point 165°C �330°F� 224°C �435°F�Chemical resistance Excellent Good
Alkali resistant Excellent Excellent
Acid and salt resistance High Good
Ultraviolet resistance — Excellent
Thermal conductivity — Low
Absorption None 4-5 %
Specific gravity 0.91 1.10
ation of the SWCC studies of present soils
terminERING © ASCE / JUNE 2006
. 2006.132:736-751.
Dow
nloa
ded
from
asc
elib
rary
.org
by
Uni
vers
ity O
f C
entr
al F
lori
da o
n 01
/24/
14. C
opyr
ight
ASC
E. F
or p
erso
nal u
se o
nly;
all
righ
ts r
eser
ved.
ashes were analyzed as per ASTM C 311-00 �2002b� and aresummarized in Table 2. According to ASTM C 618-02 �2002a��material specification�, both fly ashes belong to the Class F cat-egory and have low amounts of calcium. Soils from differentareas of north Texas contain large amounts of sulfates and exhibitsulfate heaving when calcium-rich stabilizers are used for stabili-zation �Kota et al. 1996; Perrin 1992�. Class F fly ash is com-monly used for stabilization purposes for these expansive soils tomitigate sulfate heaving. Hence, Class F fly ash is also used asstabilizer in this study.
Two types of polymeric fibers were used as fiber stabilizers.Both the fibrillated nonpolarpolypropylene �PP� and hydrophilicnylon fibers �N� were products from recycled plastic materials.
Table 4. Proportions of Stabilizers Added to Ash-Treated Soils
DFW soil Arlington soil
Stabilizer
Proportion�% per dry
weight of soil� Stabilizer
Proportion�% per dry
weight of soil�
F1 0, 10, 15, 20 F1 0, 10, 15, 20
F2 0, 10, 15, 20 F2 0, 10, 15, 20
B 0, 10, 15, 20 B 0, 10, 15, 20
Note: F1�fly ash from Mohave plant; F2�fly ash from Monticello plant;and B�bottom ash from Monticello plant.
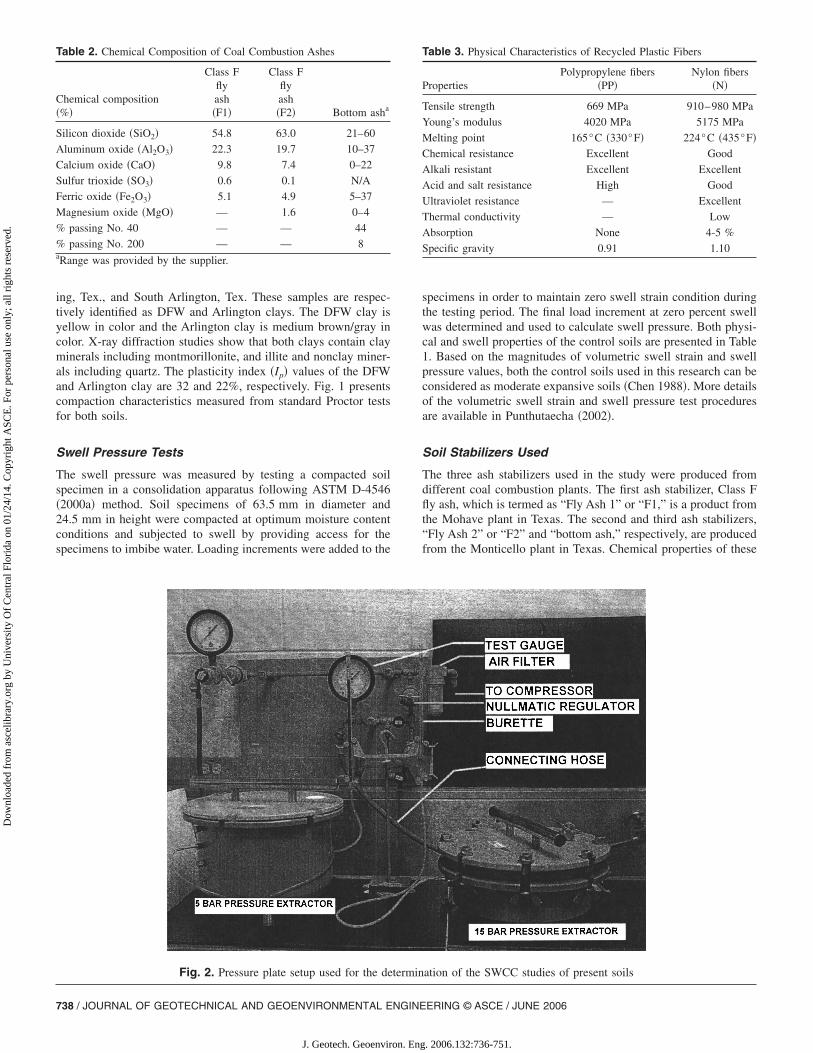
Fig. 3. SWCCs of control an
JOURNAL OF GEOTECHNICAL AND
J. Geotech. Geoenviron. Eng
The fibers are used to enhance tensile strength of soils and topromote recycling of fibrous materials. The physical characteris-tics of both polypropylene and nylon fibers are summarized inTable 3. These fibers are not affected by the presence of saltcontent in soils, biological degradation, ultraviolet degradation,and high temperature conditions �see Table 3�.
Table 5. Proportion of Stabilizer to Combined Ash and Fiber-TreatedSoils
DFW soil Arlington soil
Stabilizer
Proportion�% per dry
weight of soil� Stabilizer
Proportion�% per dry
weight of soil�
F1+P 19.0+0.3 F1+P 14.0+0.3
F1+N 19.0+0.5 F1+N 14.0+0.4
F2+P 15.0+0.3 F2+P 14.0+0.3
F2+N 15.0+0.5 F2+N 14.0+0.4
B+P 19.0+0.3 B+P 18.0+0.3
B+N 19.0+0.5 B+N 18.0+0.4
Note: F1�fly ash from Mohave plant; F2�fly ash from Monticello plant;B�bottom ash from Monticello plant; P�polypropylene fibers; andN�nylon fibers.
s F fly ash-treated soils �F1�
d ClasGEOENVIRONMENTAL ENGINEERING © ASCE / JUNE 2006 / 739
. 2006.132:736-751.
Dow
nloa
ded
from
asc
elib
rary
.org
by
Uni
vers
ity O
f C
entr
al F
lori
da o
n 01
/24/
14. C
opyr
ight
ASC
E. F
or p
erso
nal u
se o
nly;
all
righ
ts r
eser
ved.
Pressure Plate Test Method
Compacted soil specimens were tested in the pressure plate appa-ratus to measure the water retention characteristics. A soil mixturewas impact compacted using a 24.4 N �5.5 lb� hammer in cylin-drical molds at the optimum compaction water content as perstandard Proctor test results. This procedure was followed forboth untreated and treated soils. Optimum compaction moisturestate was chosen since it closely represents the in situ field com-paction condition of stabilized subsoils. The compacted soilspecimens of 63.5 mm in diameter and 25.4 mm in thicknesswere extracted from cylindrical molds, wrapped in moisture tightbags, stored in 100% humidity controlled rooms, and cured for 14days. After curing, soil specimens were allowed to imbibe waterfor a period of 48 h to achieve saturated conditions. The period of48 h was decided based on several trial studies to achieve fullysaturated conditions. The degree of saturation estimated fromvolume-mass calculations was found to be near 100% �above96%� for all the specimens used in the study.
The SWCC of the prepared saturated soil specimens were de-termined using the pressure plate apparatus shown in Fig. 2. The
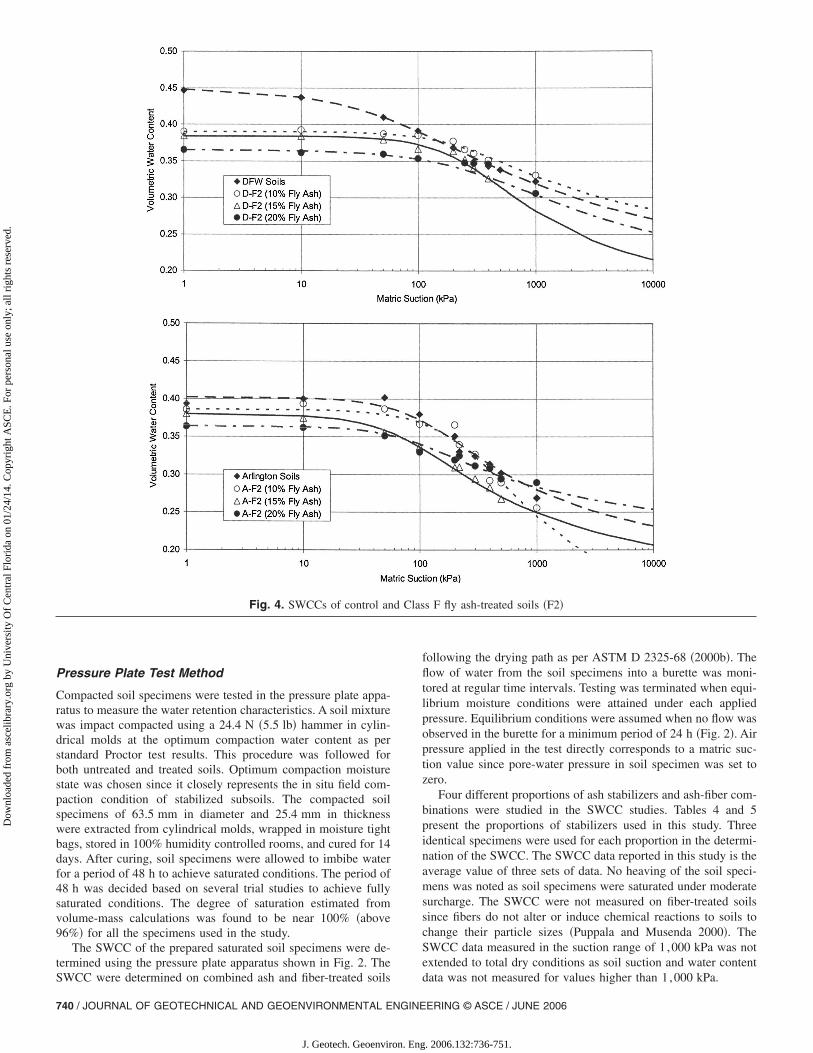
Fig. 4. SWCCs of control an
SWCC were determined on combined ash and fiber-treated soils
740 / JOURNAL OF GEOTECHNICAL AND GEOENVIRONMENTAL ENGINE
J. Geotech. Geoenviron. Eng
following the drying path as per ASTM D 2325-68 �2000b�. Theflow of water from the soil specimens into a burette was moni-tored at regular time intervals. Testing was terminated when equi-librium moisture conditions were attained under each appliedpressure. Equilibrium conditions were assumed when no flow wasobserved in the burette for a minimum period of 24 h �Fig. 2�. Airpressure applied in the test directly corresponds to a matric suc-tion value since pore-water pressure in soil specimen was set tozero.
Four different proportions of ash stabilizers and ash-fiber com-binations were studied in the SWCC studies. Tables 4 and 5present the proportions of stabilizers used in this study. Threeidentical specimens were used for each proportion in the determi-nation of the SWCC. The SWCC data reported in this study is theaverage value of three sets of data. No heaving of the soil speci-mens was noted as soil specimens were saturated under moderatesurcharge. The SWCC were not measured on fiber-treated soilssince fibers do not alter or induce chemical reactions to soils tochange their particle sizes �Puppala and Musenda 2000�. TheSWCC data measured in the suction range of 1 ,000 kPa was notextended to total dry conditions as soil suction and water content
s F fly ash-treated soils �F2�
d Clasdata was not measured for values higher than 1,000 kPa.
ERING © ASCE / JUNE 2006
. 2006.132:736-751.
Dow
nloa
ded
from
asc
elib
rary
.org
by
Uni
vers
ity O
f C
entr
al F
lori
da o
n 01
/24/
14. C
opyr
ight
ASC
E. F
or p
erso
nal u
se o
nly;
all
righ
ts r
eser
ved.
Pressure Plate Test Results and Analysis
Figs. 3–7 summarize the SWCC of control or untreated soils,ash-treated, and combined ash and fiber-treated expansive soils.The porosity and pore-size distribution of the soil are influencedto various levels when fly ash or bottom ash was added to expan-sive soils. The measured SWCC data of ash-treated expansivesoils was analyzed to understand this influence in greater detail.
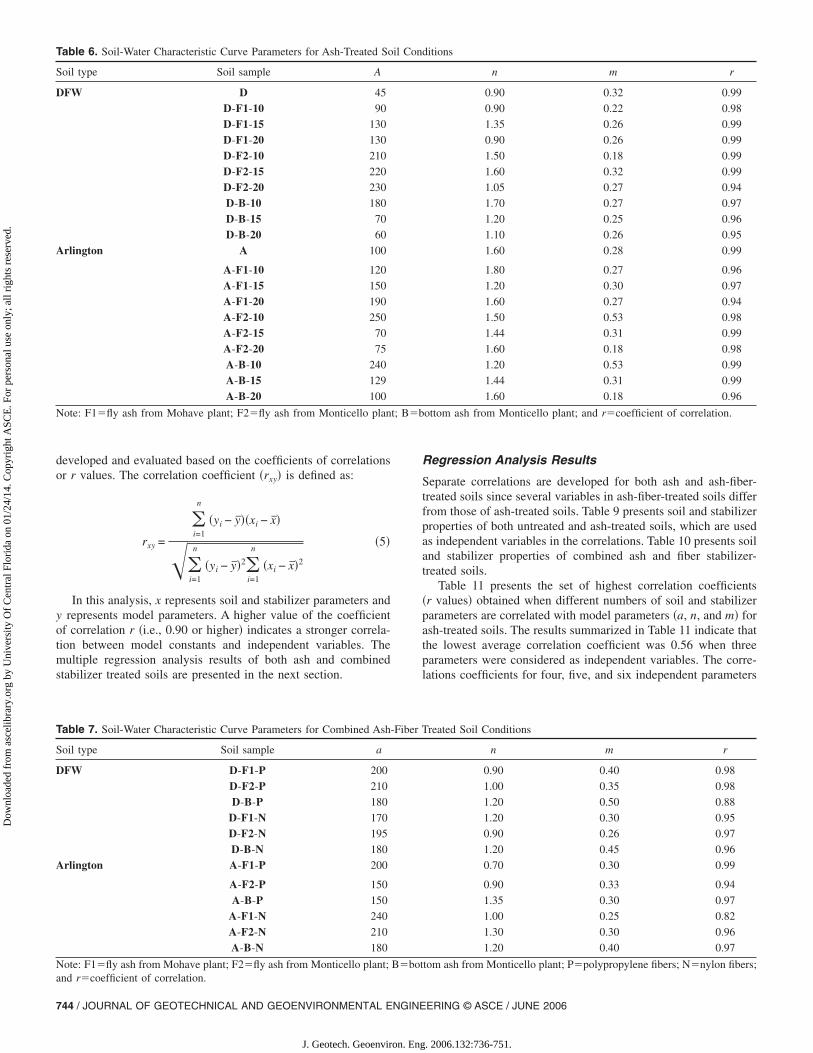
Experimental data measured in the suction range of0–1,000 kPa was extrapolated up to 10,000 kPa using Eq. �1�.However, in the analysis, the extrapolated data at high suctions�i.e., 1 ,000–10,000 kPa� was not used. Tables 6 and 7 provide asummary of Fredlund and Xing �1994� parameters �i.e., a ,n, andm� used to model the SWCC by multiple regression analysis. Thecoefficients of correlations of all model parameters were greaterthan 0.90, suggesting good correlations were obtained betweenthe experimental data and the modeled SWCC.
In the case of fly ash-treated soils, the volumetric water con-tents decreased with an increase in the percentage of fly ash sta-bilizers. Similar trends of results were obtained with the use ofthe two different fly ash types. This behavior is expected since fly
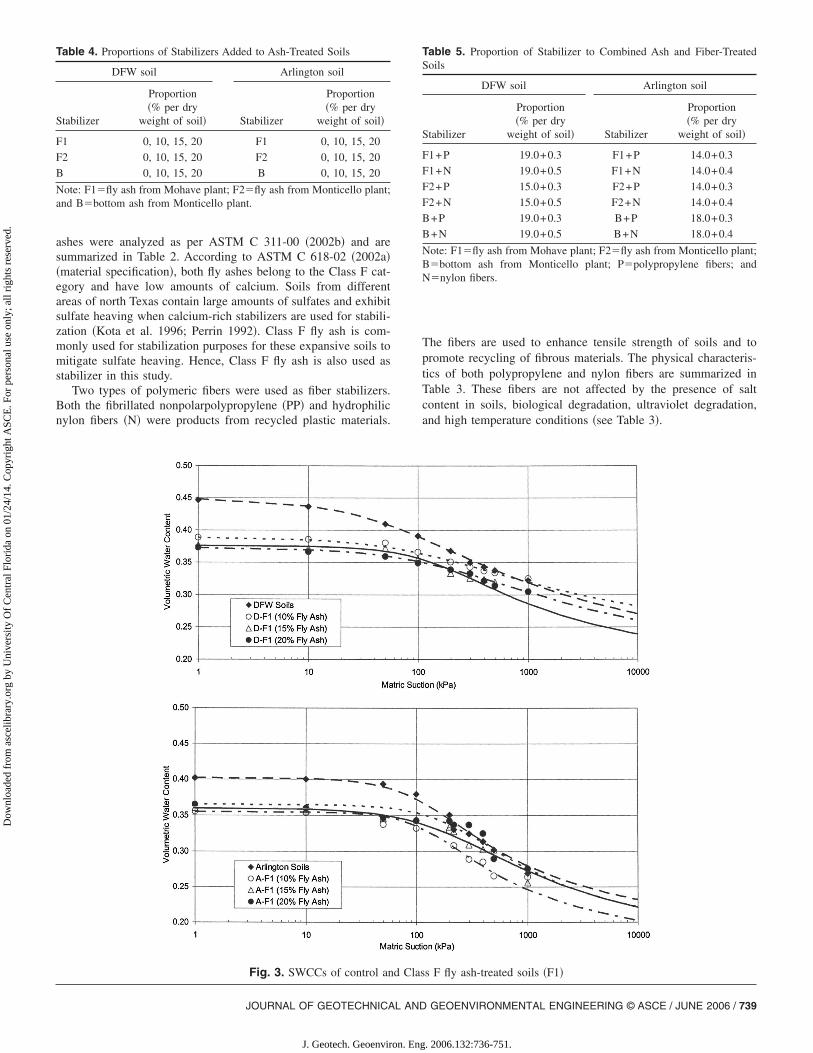
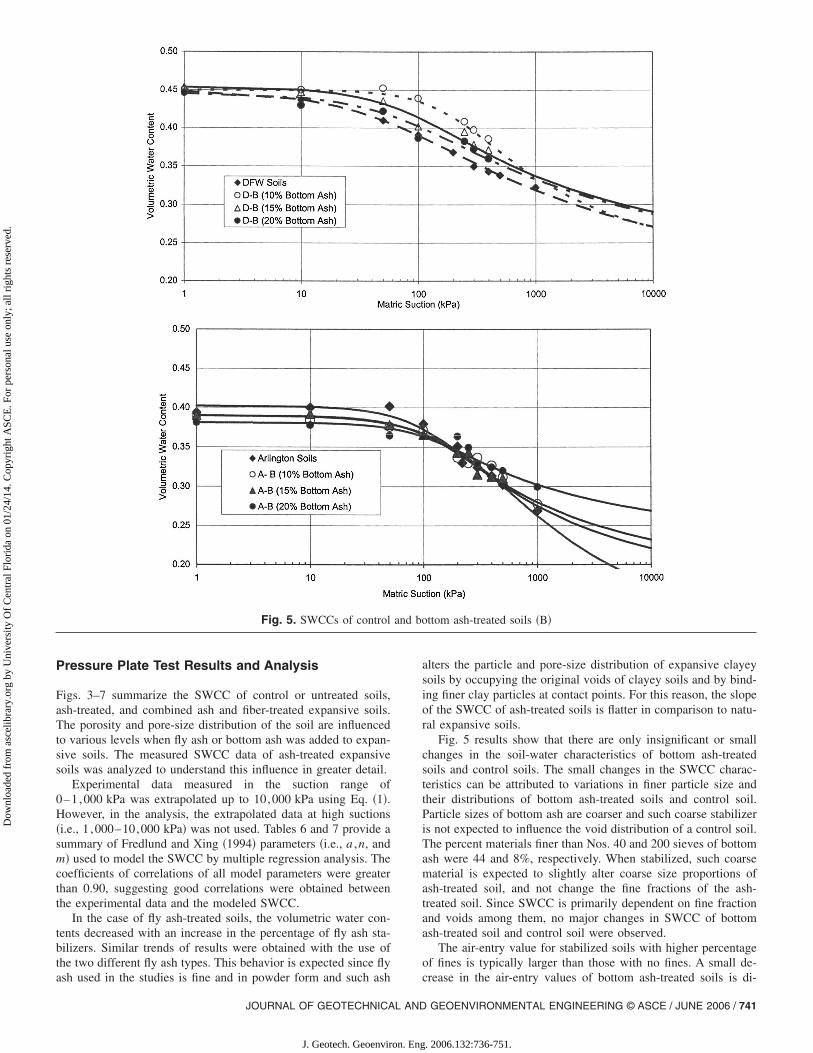
Fig. 5. SWCCs of control
ash used in the studies is fine and in powder form and such ash
JOURNAL OF GEOTECHNICAL AND
J. Geotech. Geoenviron. Eng
alters the particle and pore-size distribution of expansive clayeysoils by occupying the original voids of clayey soils and by bind-ing finer clay particles at contact points. For this reason, the slopeof the SWCC of ash-treated soils is flatter in comparison to natu-ral expansive soils.
Fig. 5 results show that there are only insignificant or smallchanges in the soil-water characteristics of bottom ash-treatedsoils and control soils. The small changes in the SWCC charac-teristics can be attributed to variations in finer particle size andtheir distributions of bottom ash-treated soils and control soil.Particle sizes of bottom ash are coarser and such coarse stabilizeris not expected to influence the void distribution of a control soil.The percent materials finer than Nos. 40 and 200 sieves of bottomash were 44 and 8%, respectively. When stabilized, such coarsematerial is expected to slightly alter coarse size proportions ofash-treated soil, and not change the fine fractions of the ash-treated soil. Since SWCC is primarily dependent on fine fractionand voids among them, no major changes in SWCC of bottomash-treated soil and control soil were observed.
The air-entry value for stabilized soils with higher percentageof fines is typically larger than those with no fines. A small de-
ottom ash-treated soils �B�
and bcrease in the air-entry values of bottom ash-treated soils is di-
GEOENVIRONMENTAL ENGINEERING © ASCE / JUNE 2006 / 741
. 2006.132:736-751.

Dow
nloa
ded
from
asc
elib
rary
.org
by
Uni
vers
ity O
f C
entr
al F
lori
da o
n 01
/24/
14. C
opyr
ight
ASC
E. F
or p
erso
nal u
se o
nly;
all
righ
ts r
eser
ved.
rectly attributed to small increases in coarse particle sizes with theaddition of bottom ash stabilizer. The increase in the proportion ofbottom ash had resulted in the formation of a treated soil withslightly higher percentage of coarser size particles, thus yieldinglow air-entry values.
The parameter n in the Fredlund and Xing equation �1994�varied between 0.9 and 1.8, with the majority of the n valuesaround 1.0 �Tables 6 and 7�. The n parameter is an approximateindicator of the pore size distribution of soils. The larger thevalues of n, the more uniform the pore sizes in the soil are. Suchbehavior indicates that the treated soils exhibit a more uniformpore size distribution than the control soils. The n value of controlArlington clay is larger than DFW clayey soil. This implies thatthe pore size distribution of Arlington clay is more uniform incomparison to DFW clay.
The parameter, m in the Fredlund and Xing equation �1994�provides information related to the asymmetry of SWCC curve.Low m values of orders less than 0.5 indicate moderate slopes inthe soil suction range below 1,000 kPa. High m values of 1.2 or
Fig. 6. SWCCs of control and combined stabiliz
above indicate steeper slopes in the same suction range. In the
742 / JOURNAL OF GEOTECHNICAL AND GEOENVIRONMENTAL ENGINE
J. Geotech. Geoenviron. Eng
stabilized soils, moderate slopes were observed with m valuesranging from 0.18 to 0.32, with occasional high values.
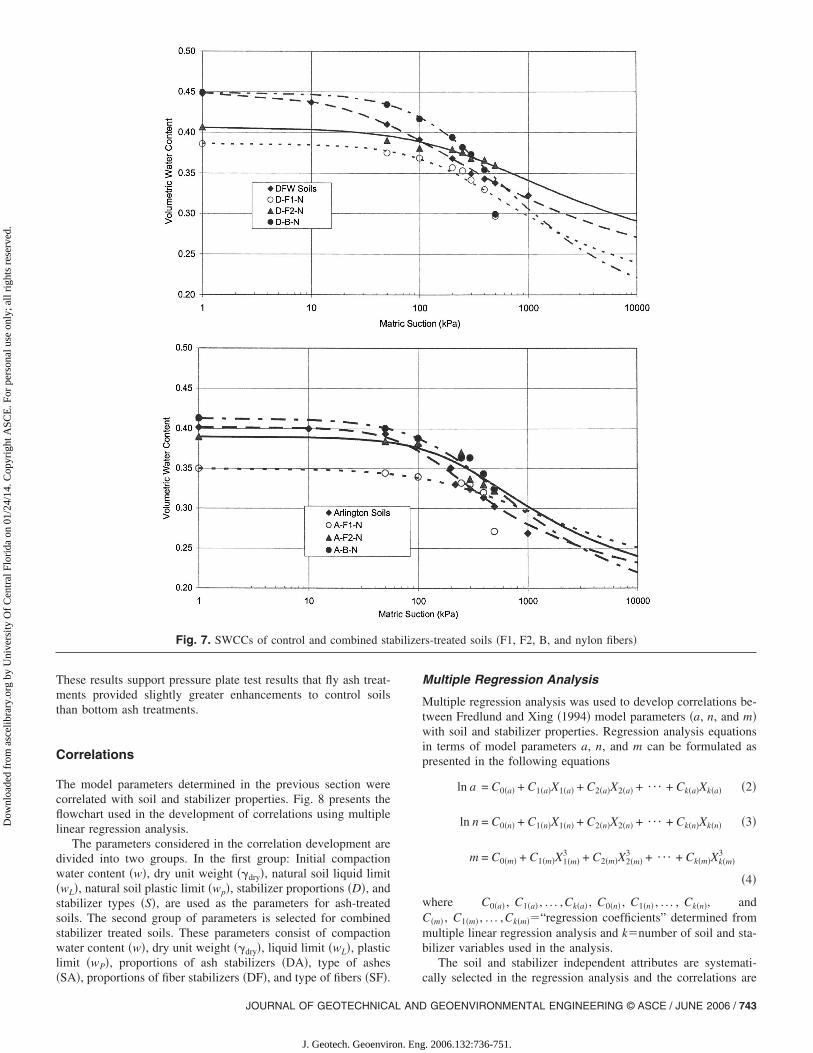
The combined ash and fiber stabilizers decreased volumetricwater contents of fly ash and fiber-treated soils in comparison tocontrol soils. On the other hand, the changes in volumetric watercontents of bottom ash and fiber-treated soils are small. Thesevariations indicate that the behavior of combined stabilization iscontrolled by the ash material stabilization. This implies that thepresence of fibers in the treated soils has no significant influenceon the volumetric water contents of combined stabilized or treatedsoils.
Swell Pressure Assessments
The changes in swell pressures associated with the stabilizer treat-ment are summarized in Table 8. The results show that the ClassF fly ash treatment reduced the swell pressures of both controlsoils by approximately 67% whereas bottom ash treatment re-
ated soils �F1, F2, B, and polypropylene fibers�
ers-treduced swell pressures of control soils by approximately 56%.
ERING © ASCE / JUNE 2006
. 2006.132:736-751.
Dow
nloa
ded
from
asc
elib
rary
.org
by
Uni
vers
ity O
f C
entr
al F
lori
da o
n 01
/24/
14. C
opyr
ight
ASC
E. F
or p
erso
nal u
se o
nly;
all
righ
ts r
eser
ved.
These results support pressure plate test results that fly ash treat-ments provided slightly greater enhancements to control soilsthan bottom ash treatments.
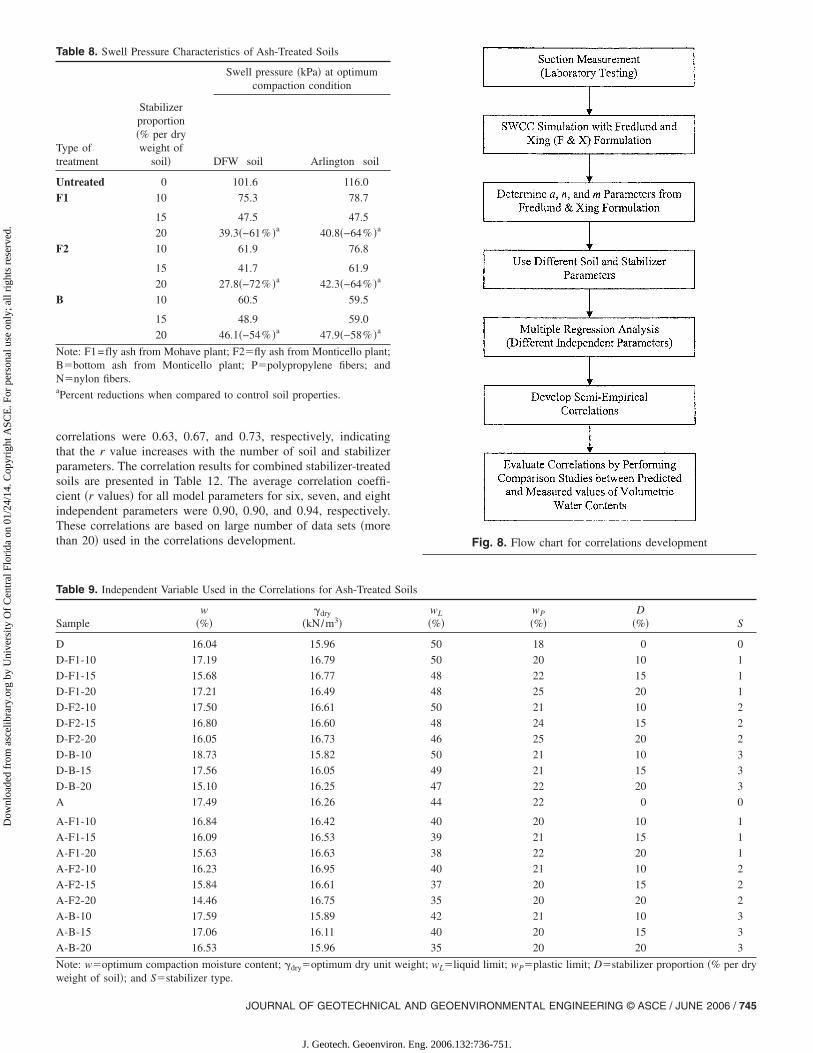
Correlations
The model parameters determined in the previous section werecorrelated with soil and stabilizer properties. Fig. 8 presents theflowchart used in the development of correlations using multiplelinear regression analysis.
The parameters considered in the correlation development aredivided into two groups. In the first group: Initial compactionwater content �w�, dry unit weight ��dry�, natural soil liquid limit�wL�, natural soil plastic limit �wp�, stabilizer proportions �D�, andstabilizer types �S�, are used as the parameters for ash-treatedsoils. The second group of parameters is selected for combinedstabilizer treated soils. These parameters consist of compactionwater content �w�, dry unit weight ��dry�, liquid limit �wL�, plasticlimit �wP�, proportions of ash stabilizers �DA�, type of ashes
Fig. 7. SWCCs of control and combined sta
�SA�, proportions of fiber stabilizers �DF�, and type of fibers �SF�.
JOURNAL OF GEOTECHNICAL AND
J. Geotech. Geoenviron. Eng
Multiple Regression Analysis
Multiple regression analysis was used to develop correlations be-tween Fredlund and Xing �1994� model parameters �a, n, and m�with soil and stabilizer properties. Regression analysis equationsin terms of model parameters a, n, and m can be formulated aspresented in the following equations
ln a = C0�a� + C1�a�X1�a� + C2�a�X2�a� + ¯ + Ck�a�Xk�a� �2�
ln n = C0�n� + C1�n�X1�n� + C2�n�X2�n� + ¯ + Ck�n�Xk�n� �3�
m = C0�m� + C1�m�X1�m�3 + C2�m�X2�m�
3 + ¯ + Ck�m�Xk�m�3
�4�
where C0�a� , C1�a� , . . . ,Ck�a� , C0�n� , C1�n� , . . . , Ck�n�, andC�m� , C1�m� , . . . ,Ck�m��“regression coefficients” determined frommultiple linear regression analysis and k�number of soil and sta-bilizer variables used in the analysis.
The soil and stabilizer independent attributes are systemati-
s-treated soils �F1, F2, B, and nylon fibers�
bilizercally selected in the regression analysis and the correlations are
GEOENVIRONMENTAL ENGINEERING © ASCE / JUNE 2006 / 743
. 2006.132:736-751.
t; B�b
Dow
nloa
ded
from
asc
elib
rary
.org
by
Uni
vers
ity O
f C
entr
al F
lori
da o
n 01
/24/
14. C
opyr
ight
ASC
E. F
or p
erso
nal u
se o
nly;
all
righ
ts r
eser
ved.
developed and evaluated based on the coefficients of correlationsor r values. The correlation coefficient �rxy� is defined as:
rxy =
�i=1
n
�yi − y��xi − x�
��i=1
n
�yi − y�2�i=1
n
�xi − x�2
�5�
In this analysis, x represents soil and stabilizer parameters andy represents model parameters. A higher value of the coefficientof correlation r �i.e., 0.90 or higher� indicates a stronger correla-tion between model constants and independent variables. Themultiple regression analysis results of both ash and combinedstabilizer treated soils are presented in the next section.
Table 6. Soil-Water Characteristic Curve Parameters for Ash-Treated So
Soil type Soil sample A
DFW D 45
D-F1-10 90
D-F1-15 130
D-F1-20 130
D-F2-10 210
D-F2-15 220
D-F2-20 230
D-B-10 180
D-B-15 70
D-B-20 60
Arlington A 100
A-F1-10 120
A-F1-15 150
A-F1-20 190
A-F2-10 250
A-F2-15 70
A-F2-20 75
A-B-10 240
A-B-15 129
A-B-20 100
Note: F1�fly ash from Mohave plant; F2�fly ash from Monticello plan
Table 7. Soil-Water Characteristic Curve Parameters for Combined Ash-
Soil type Soil sample a
DFW D-F1-P 200
D-F2-P 210
D-B-P 180
D-F1-N 170
D-F2-N 195
D-B-N 180
Arlington A-F1-P 200
A-F2-P 150
A-B-P 150
A-F1-N 240
A-F2-N 210
A-B-N 180
Note: F1�fly ash from Mohave plant; F2�fly ash from Monticello plant;
and r�coefficient of correlation.744 / JOURNAL OF GEOTECHNICAL AND GEOENVIRONMENTAL ENGINE
J. Geotech. Geoenviron. Eng
Regression Analysis Results
Separate correlations are developed for both ash and ash-fiber-treated soils since several variables in ash-fiber-treated soils differfrom those of ash-treated soils. Table 9 presents soil and stabilizerproperties of both untreated and ash-treated soils, which are usedas independent variables in the correlations. Table 10 presents soiland stabilizer properties of combined ash and fiber stabilizer-treated soils.
Table 11 presents the set of highest correlation coefficients�r values� obtained when different numbers of soil and stabilizerparameters are correlated with model parameters �a, n, and m� forash-treated soils. The results summarized in Table 11 indicate thatthe lowest average correlation coefficient was 0.56 when threeparameters were considered as independent variables. The corre-lations coefficients for four, five, and six independent parameters
ditions
n m r
0.90 0.32 0.99
0.90 0.22 0.98
1.35 0.26 0.99
0.90 0.26 0.99
1.50 0.18 0.99
1.60 0.32 0.99
1.05 0.27 0.94
1.70 0.27 0.97
1.20 0.25 0.96
1.10 0.26 0.95
1.60 0.28 0.99
1.80 0.27 0.96
1.20 0.30 0.97
1.60 0.27 0.94
1.50 0.53 0.98
1.44 0.31 0.99
1.60 0.18 0.98
1.20 0.53 0.99
1.44 0.31 0.99
1.60 0.18 0.96
ottom ash from Monticello plant; and r�coefficient of correlation.
Treated Soil Conditions
n m r
0.90 0.40 0.98
1.00 0.35 0.98
1.20 0.50 0.88
1.20 0.30 0.95
0.90 0.26 0.97
1.20 0.45 0.96
0.70 0.30 0.99
0.90 0.33 0.94
1.35 0.30 0.97
1.00 0.25 0.82
1.30 0.30 0.96
1.20 0.40 0.97
tom ash from Monticello plant; P�polypropylene fibers; N�nylon fibers;
il Con
Fiber
B�bot
ERING © ASCE / JUNE 2006
. 2006.132:736-751.
Dow
nloa
ded
from
asc
elib
rary
.org
by
Uni
vers
ity O
f C
entr
al F
lori
da o
n 01
/24/
14. C
opyr
ight
ASC
E. F
or p
erso
nal u
se o
nly;
all
righ
ts r
eser
ved.
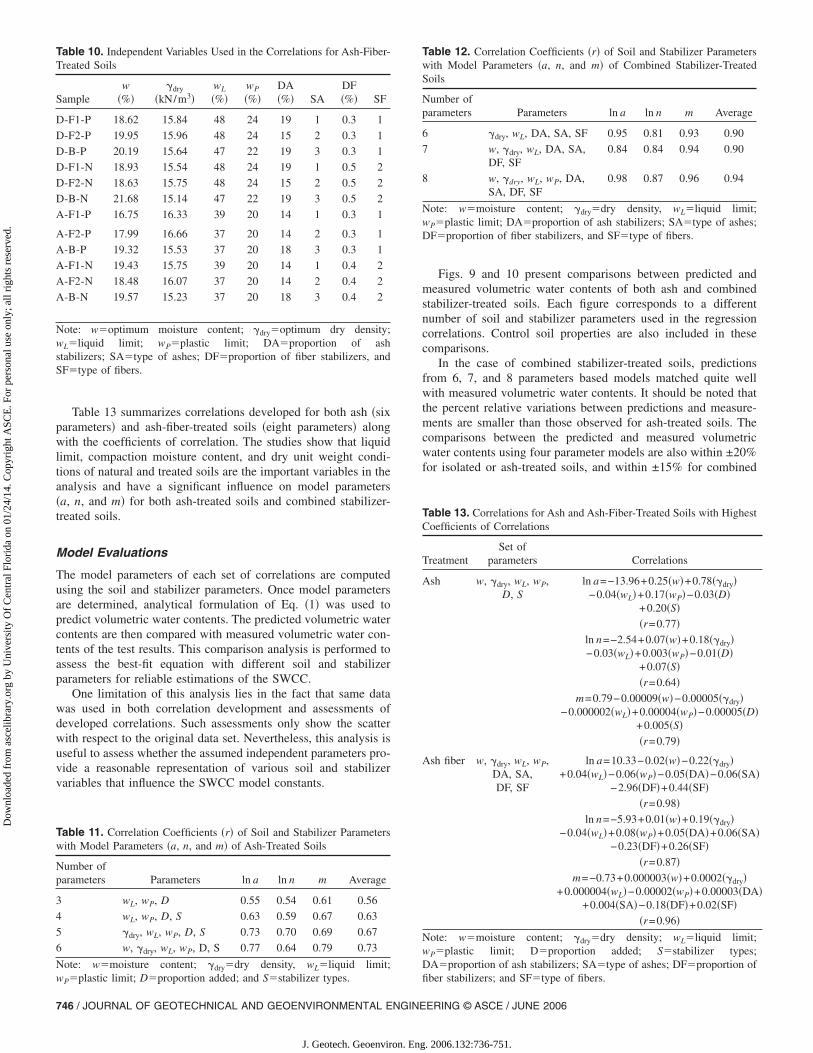
correlations were 0.63, 0.67, and 0.73, respectively, indicatingthat the r value increases with the number of soil and stabilizerparameters. The correlation results for combined stabilizer-treatedsoils are presented in Table 12. The average correlation coeffi-cient �r values� for all model parameters for six, seven, and eightindependent parameters were 0.90, 0.90, and 0.94, respectively.These correlations are based on large number of data sets �morethan 20� used in the correlations development.
Table 8. Swell Pressure Characteristics of Ash-Treated Soils
Swell pressure �kPa� at optimumcompaction condition
Type oftreatment
Stabilizerproportion�% per dryweight of
soil� DFW soil Arlington soil
Untreated 0 101.6 116.0
F1 10 75.3 78.7
15 47.5 47.5
20 39.3�−61% �a 40.8�−64% �a
F2 10 61.9 76.8
15 41.7 61.9
20 27.8�−72% �a 42.3�−64% �a
B 10 60.5 59.5
15 48.9 59.0
20 46.1�−54% �a 47.9�−58% �a
Note: F1=fly ash from Mohave plant; F2�fly ash from Monticello plant;B�bottom ash from Monticello plant; P�polypropylene fibers; andN�nylon fibers.aPercent reductions when compared to control soil properties.
Table 9. Independent Variable Used in the Correlations for Ash-Treated
Samplew
�%��dry
�kN/m3�
D 16.04 15.96
D-F1-10 17.19 16.79
D-F1-15 15.68 16.77
D-F1-20 17.21 16.49
D-F2-10 17.50 16.61
D-F2-15 16.80 16.60
D-F2-20 16.05 16.73
D-B-10 18.73 15.82
D-B-15 17.56 16.05
D-B-20 15.10 16.25
A 17.49 16.26
A-F1-10 16.84 16.42
A-F1-15 16.09 16.53
A-F1-20 15.63 16.63
A-F2-10 16.23 16.95
A-F2-15 15.84 16.61
A-F2-20 14.46 16.75
A-B-10 17.59 15.89
A-B-15 17.06 16.11
A-B-20 16.53 15.96
Note: w�optimum compaction moisture content; �dry�optimum dry unit
Soils
wL
�%�wP
�%�D
�%� S
50 18 0 0
50 20 10 1
48 22 15 1
48 25 20 1
50 21 10 2
48 24 15 2
46 25 20 2
50 21 10 3
49 21 15 3
47 22 20 3
44 22 0 0
40 20 10 1
39 21 15 1
38 22 20 1
40 21 10 2
37 20 15 2
35 20 20 2
42 21 10 3
40 20 15 3
35 20 20 3
weight; wL�liquid limit; wP�plastic limit; D�stabilizer proportion �% per dry
weight of soil�; and S�stabilizer type.JOURNAL OF GEOTECHNICAL AND
J. Geotech. Geoenviron. Eng
Fig. 8. Flow chart for correlations development
GEOENVIRONMENTAL ENGINEERING © ASCE / JUNE 2006 / 745
. 2006.132:736-751.
�
Dow
nloa
ded
from
asc
elib
rary
.org
by
Uni
vers
ity O
f C
entr
al F
lori
da o
n 01
/24/
14. C
opyr
ight
ASC
E. F
or p
erso
nal u
se o
nly;
all
righ
ts r
eser
ved.
Table 13 summarizes correlations developed for both ash �sixparameters� and ash-fiber-treated soils �eight parameters� alongwith the coefficients of correlation. The studies show that liquidlimit, compaction moisture content, and dry unit weight condi-tions of natural and treated soils are the important variables in theanalysis and have a significant influence on model parameters�a, n, and m� for both ash-treated soils and combined stabilizer-treated soils.
Model Evaluations
The model parameters of each set of correlations are computedusing the soil and stabilizer parameters. Once model parametersare determined, analytical formulation of Eq. �1� was used topredict volumetric water contents. The predicted volumetric watercontents are then compared with measured volumetric water con-tents of the test results. This comparison analysis is performed toassess the best-fit equation with different soil and stabilizerparameters for reliable estimations of the SWCC.
One limitation of this analysis lies in the fact that same datawas used in both correlation development and assessments ofdeveloped correlations. Such assessments only show the scatterwith respect to the original data set. Nevertheless, this analysis isuseful to assess whether the assumed independent parameters pro-vide a reasonable representation of various soil and stabilizervariables that influence the SWCC model constants.
Table 10. Independent Variables Used in the Correlations for Ash-Fiber-Treated Soils
Samplew
�%��dry
�kN/m3�wL
�%�wP
�%�DA�%� SA
DF�%� SF
D-F1-P 18.62 15.84 48 24 19 1 0.3 1
D-F2-P 19.95 15.96 48 24 15 2 0.3 1
D-B-P 20.19 15.64 47 22 19 3 0.3 1
D-F1-N 18.93 15.54 48 24 19 1 0.5 2
D-F2-N 18.63 15.75 48 24 15 2 0.5 2
D-B-N 21.68 15.14 47 22 19 3 0.5 2
A-F1-P 16.75 16.33 39 20 14 1 0.3 1
A-F2-P 17.99 16.66 37 20 14 2 0.3 1
A-B-P 19.32 15.53 37 20 18 3 0.3 1
A-F1-N 19.43 15.75 39 20 14 1 0.4 2
A-F2-N 18.48 16.07 37 20 14 2 0.4 2
A-B-N 19.57 15.23 37 20 18 3 0.4 2
Note: w�optimum moisture content; �dry�optimum dry density;wL�liquid limit; wP�plastic limit; DA�proportion of ashstabilizers; SA�type of ashes; DF�proportion of fiber stabilizers, andSF�type of fibers.
Table 11. Correlation Coefficients �r� of Soil and Stabilizer Parameterswith Model Parameters �a, n, and m� of Ash-Treated Soils
Number ofparameters Parameters ln a ln n m Average
3 wL, wP, D 0.55 0.54 0.61 0.56
4 wL, wP, D, S 0.63 0.59 0.67 0.63
5 �dry, wL, wP, D, S 0.73 0.70 0.69 0.67
6 w, �dry, wL, wP, D, S 0.77 0.64 0.79 0.73
Note: w�moisture content; �dry�dry density, wL�liquid limit;
wP�plastic limit; D�proportion added; and S�stabilizer types.746 / JOURNAL OF GEOTECHNICAL AND GEOENVIRONMENTAL ENGINE
J. Geotech. Geoenviron. Eng
Figs. 9 and 10 present comparisons between predicted andmeasured volumetric water contents of both ash and combinedstabilizer-treated soils. Each figure corresponds to a differentnumber of soil and stabilizer parameters used in the regressioncorrelations. Control soil properties are also included in thesecomparisons.
In the case of combined stabilizer-treated soils, predictionsfrom 6, 7, and 8 parameters based models matched quite wellwith measured volumetric water contents. It should be noted thatthe percent relative variations between predictions and measure-ments are smaller than those observed for ash-treated soils. Thecomparisons between the predicted and measured volumetricwater contents using four parameter models are also within ±20%for isolated or ash-treated soils, and within ±15% for combined
Table 12. Correlation Coefficients �r� of Soil and Stabilizer Parameterswith Model Parameters �a, n, and m� of Combined Stabilizer-TreatedSoils
Number ofparameters Parameters ln a ln n m Average
6 �dry, wL, DA, SA, SF 0.95 0.81 0.93 0.90
7 w, �dry, wL, DA, SA,DF, SF
0.84 0.84 0.94 0.90
8 w, �dry, wL, wP, DA,SA, DF, SF
0.98 0.87 0.96 0.94
Note: w�moisture content; �dry�dry density, wL�liquid limit;wP�plastic limit; DA�proportion of ash stabilizers; SA�type of ashes;DF�proportion of fiber stabilizers, and SF�type of fibers.
Table 13. Correlations for Ash and Ash-Fiber-Treated Soils with HighestCoefficients of Correlations
TreatmentSet of
parameters Correlations
Ash w, �dry, wL, wP,D, S
ln a=−13.96+0.25�w�+0.78��dry�−0.04�wL�+0.17�wP�−0.03�D�
+0.20�S��r=0.77�
ln n=−2.54+0.07�w�+0.18��dry�−0.03�wL�+0.003�wP�−0.01�D�
+0.07�S��r=0.64�
m=0.79−0.00009�w�−0.00005��dry�−0.000002�wL�+0.00004�wP�−0.00005�D�
+0.005�S��r=0.79�
Ash fiber w, �dry, wL, wP,DA, SA,DF, SF
ln a=10.33−0.02�w�−0.22��dry�+0.04�wL�−0.06�wP�−0.05�DA�−0.06�SA�
−2.96�DF�+0.44�SF��r=0.98�
ln n=−5.93+0.01�w�+0.19��dry�−0.04�wL�+0.08�wP�+0.05�DA�+0.06�SA�
−0.23�DF�+0.26�SF��r=0.87�
m=−0.73+0.000003�w�+0.0002��dry�+0.000004�wL�−0.00002�wP�+0.00003�DA
+0.004�SA�−0.18�DF�+0.02�SF��r=0.96�
Note: w�moisture content; �dry�dry density; wL�liquid limit;wP�plastic limit; D�proportion added; S�stabilizer types;DA�proportion of ash stabilizers; SA�type of ashes; DF�proportion of
fiber stabilizers; and SF�type of fibers.ERING © ASCE / JUNE 2006
. 2006.132:736-751.

Dow
nloa
ded
from
asc
elib
rary
.org
by
Uni
vers
ity O
f C
entr
al F
lori
da o
n 01
/24/
14. C
opyr
ight
ASC
E. F
or p
erso
nal u
se o
nly;
all
righ
ts r
eser
ved.
Fig. 9. Comparisons between predicted and measured volumetric water contents for ash-treated soils
JOURNAL OF GEOTECHNICAL AND GEOENVIRONMENTAL ENGINEERING © ASCE / JUNE 2006 / 747
J. Geotech. Geoenviron. Eng. 2006.132:736-751.

Dow
nloa
ded
from
asc
elib
rary
.org
by
Uni
vers
ity O
f C
entr
al F
lori
da o
n 01
/24/
14. C
opyr
ight
ASC
E. F
or p
erso
nal u
se o
nly;
all
righ
ts r
eser
ved.
Fig. 9. �Continued�.
748 / JOURNAL OF GEOTECHNICAL AND GEOENVIRONMENTAL ENGINEERING © ASCE / JUNE 2006
J. Geotech. Geoenviron. Eng. 2006.132:736-751.

Dow
nloa
ded
from
asc
elib
rary
.org
by
Uni
vers
ity O
f C
entr
al F
lori
da o
n 01
/24/
14. C
opyr
ight
ASC
E. F
or p
erso
nal u
se o
nly;
all
righ
ts r
eser
ved.
ash and fiber-treated soils. Six parameter models provided betterestimations in comparison to four or five parameter models.
It should be noted here that variations of ±20% do not implythat these correlations are better or can be recommended for pre-dicting the SWCC behavior of expansive soils. Lack of regressionmodels for SWCC of treated soils in the literature makes it com-plicated to fully evaluate the developed correlations for betterinterpretation of expansive soil behavior under chemical treat-ments. Hence, such high variability should be expected when newmodeling correlations are initially developed for treated soils.Further experimental studies on treated soils are, however, ex-pected to either validate or refine these model correlations, which
Fig. 10. Comparisons between predicted and measured v
will reduce the high variations in their prediction capabilities.
JOURNAL OF GEOTECHNICAL AND
J. Geotech. Geoenviron. Eng
Summary and Conclusions
This paper presents experimental and analytical model studies ofSWCC of two stabilized expansive soils from Texas. Two types ofrecycled ashes—Class F fly and bottom—and two types offibers—nylon and polypropylene—were used as stabilizers in thestudy.
The volumetric water contents of Class F fly ash-treated soilsdecreased with an increase in the percentage of fly ash stabilizers.These changes are attributed to modifications in both particle sizeand moderate cementing effects in stabilized soils. The fine flyash materials, similar cement stabilizer, reduce pore void distri-
tric water contents for combined stabilizers-treated soils
olumebution of clayey soils by occupying their voids and also bond
GEOENVIRONMENTAL ENGINEERING © ASCE / JUNE 2006 / 749
. 2006.132:736-751.

Dow
nloa
ded
from
asc
elib
rary
.org
by
Uni
vers
ity O
f C
entr
al F
lori
da o
n 01
/24/
14. C
opyr
ight
ASC
E. F
or p
erso
nal u
se o
nly;
all
righ
ts r
eser
ved.
finer clay particles at contact points. As a result, fine ash-treatedsoils exhibit moderate to low plastic soil behavior with low volu-metric moisture contents. On the other hand, bottom ash providedminor alterations to particle size distribution of treated soils,mainly due to the coarse nature of these materials.
Swell pressure tests conducted on ash-treated soils indicatethat the Class F fly ash treatment provided maximum enhance-ments in the ash stabilizers. Fly ash treatment decreased swellpressures of both control soils approximately by 65% whereasbottom ash reduced swell pressure properties of control soils, ap-proximately by 56%. These results support the observations notedfrom pressure plate tests that finer fly ash treatments providedparticle size variations that result in greater reductions of swellpressures.
The model constants obtained using the Fredlund and Xing�1994� equation were correlated via multiple linear regressionanalysis with basic soil properties such as water content, dry den-sity, liquid limit, plastic limit, and other different stabilizer prop-erties to determine the uniqueness of the data. The multiple linearregression analysis using six parameters or higher provide regres-sion coefficient value, r of 0.9 or higher. Comparisons betweenthe predicted and measured volumetric water contents are within±20% for isolated or ash-treated soils when four to six parametercorrelations were used, and within ±15% for combined ash andfiber-treated soils when six to eight parameter correlations wereused. From a practical perspective, four parameter models may besufficient for reasonable predictions of ash-treated soils and sixparameter models are sufficient for combined ash-fiber-treatedsoils.
In summary, the research reported in this paper shows that theSWCC behavior can be a useful tool to understand the stabiliza-tion effects on expansive soils. The studies can be further ex-tended to better understand the engineering behavior of stabilizedexpansive soils.
Acknowledgments
This study was supported by the Advanced Technology Program�ATP� of Texas Higher Education Coordinating Board, Austin,Tex., under Research Grant No. 1407610-50. The writers wouldlike to acknowledge this support. Also, the writers would like toacknowledge Boral Material Technologies, Texas, for providingmaterial support and E. Garven for assistance in the preparationof the figures of this paper.
References
Aitchison, G. D., Peter, P., and Martin, R. �1973�. “The instability indicesIpm and Ips in expansive soils.” Proc., 3rd Int. Conf. on Expansive
Soils, Haifa, Israel, 2, 101–104.Alonso, E. E., Gens, A., and Hight, D. W. �1987�. “Special problems
soils.” General Rep., European Conference on Soil Mechanics andFoundation Engineering, Dublin. Ireland.
ASTM. �2000a�. “One-dimensional swell or settlement properties of co-hesive soils.” ASTM D 4546, ASTM Book of Standards, Vol. 4.08,
Philadelphia, 363–369.750 / JOURNAL OF GEOTECHNICAL AND GEOENVIRONMENTAL ENGINE
J. Geotech. Geoenviron. Eng
ASTM. �2000b�. “Standard test method for capillary-moisture relation-ships for coarse and medium textured soils by pressure-plate appara-tus.” ASTM D 2325-68, ASTM Book of Standards, Vol. 4.08, Philadel-phia, 363–369.
ASTM. �2002a�. “Standard specification for coal fly ash and raw or cal-cined natural pozzolan for use as a mineral admixture in concrete.”ASTM C 618-02, ASTM Book of Standards, Vol. 4.08, Philadelphia.
ASTM. �2002b�. “Standard test method for testing fly ash or naturalpozzolanas for use as a mineral admixture in Portland cement con-crete.” ASTM C 311-00, ASTM Book of Standards, Vol. 4.02, Phila-delphia.
Bao, C. G., and Ng, C. W. W. �2000�. “Some thoughts and studies on the
prediction of slope stability in expansive soils.” Proc., 1st Asian Conf.
on Unsaturated Soils, Balkema, Rotterdam, The Netherlands, 15–32.Barbour, S. L. �1998�. “The soil-water characteristic curve: A historical
perspective.” Can. Geotech. J., 35, 873–894.Brooks, R. H., and Corey, A. T., �1964�. “Hydraulic properties of porous
media.” Colorado State University Hydrology Paper, 27�3�, 22–27.
Chen, F. H. �1988�. Foundations on expansive soils, 2nd Ed., Elsevier
Science, New York.Fredlund, D. G. �2000�. “The 1999 R.M. Hardy lecture: The implemen-
tation of unsaturated soil mechanics into geotechnical engineering.”Can. Geotech. J., 37, 963–986.
Fredlund, D. G., and Xing, A. �1994�. “Equations for the soil-water char-acteristic curve.” Can. Geotech. J., 31, 521–532.
Holtz, W. G., and Gibbs, H. J. �1956�. “Engineering properties of expan-sive clays.” Trans. ASCE, 121, 641–663.
Jones, D. E., and Holtz, W. J. �1973�. “Expansive soils: The hiddendisaster.” Civ. Eng. (N.Y.) 43�8�, 49–51.
Kota, B. V., Prakash, S., Hazlett, D., and Perrin, L. �1996�. “Sulfate-bearing soils: problems with calcium based stabilizers.” Transporta-tion Research Record 1546 Transportation Research Board, NationalResearch Council, Washington, D.C., 62–69.
Leong, E. C., and Rahardjo, H. �1997�. “Review of soil-water character-istic curve equations.” J. Geotech. Geoenviron. Eng., 123�12�,1106–1117.
Likos, W. J., Olsen, H. W., Krosley, L., and Lu, N. �2003�. “Measuredand estimated suction indices for swelling potential classification.”J. Geotech. Geoenviron. Eng., 129�7�, 665–668.
Lytton, R. L. �1981�. “The design of foundations and pavements on ex-
pansive clays.” Proc., 4th Regional Geotechnical Conf., Baranquilla,
Colombia.Nelson, J. D., and Miller, D. J. �1992�. Expansive soils, problems and
practice in foundation and pavement engineering, Wiley, New York.Ng, C. W. W., Wang, B., Gong, B. W., and Bao, C. G. �2000�. “Prelimi-
nary study on soil-water characteristics of two expansive soils.” Proc.,
Asian Conf. on Unsaturated Soils: From Theory to Practice,Singapore, H. Rahardjo, D. G. Toll, and E. C. Leong, eds., Balkema,Rotterdam, The Netherlands, 347–353.
Perrin, L. �1992�. “Expansion of lime treated clays containing sulfates.”
Proc. 7th Int. Conf. on Expansive Soils, Dallas, 1, 409–411.Punthutaecha, K. �2002�. “Volume change behavior of expansive soils
modified with recycled materials.” Ph.D. thesis, The University ofTexas at Arlington, Arlington, Tex.
Puppala, A. J., and Musenda, C. �2000�. “Effect of fiber reinforcement onstrength and volume change behavior of two expansive soils.” Trans-portation Research Record 1736, Transportation Research Board,Washington, D.C.
Rahardjo, H., Lim, T. T., Chang, M. F., and Fredlund, D. G. �1995�.“Shear strength characteristics of a residual soil.” Can. Geotech. J.,32, 60–77.
Richards, B. G., Peter, P., and Martin, R. �1984�. “The determination of
volume change properties in expansive soils.” Proc., 5th Int. Conf. on
Expansive Soils, Adelaide, Australia, 179–186.
ERING © ASCE / JUNE 2006
. 2006.132:736-751.
Dow
nloa
ded
from
asc
elib
rary
.org
by
Uni
vers
ity O
f C
entr
al F
lori
da o
n 01
/24/
14. C
opyr
ight
ASC
E. F
or p
erso
nal u
se o
nly;
all
righ
ts r
eser
ved.
Seed, H. B., Woodward, R. J., and Lundgren, R. �1962�. “Prediction ofswelling potential for compacted clays.” J. Soil Mech. Found. Div.,88�3�, 53–88.
Sherwood, P. T. �1962�. “The effect of sulfates on cement and lime-stabilized soils.” Highway Research Board Bulletin, 355, 98–107.
Sillers, W. S., Fredlund, D. G., and Zakerzadeh, N. �2001�. “Mathemati-cal attributes of some soil-water characteristic curve models.” Geo-
JOURNAL OF GEOTECHNICAL AND
J. Geotech. Geoenviron. Eng
technical and Geological Engineering, 19, 243–283.Van der Merwe, D. H. �1964�. “The prediction of heave from the plastic-
ity index and percentage fraction of soils.” Civil Engineering in SouthAfrica, 6�6�, 103–107.
van Genuchten, M. T. �1980�. “A closed-form equation for predicting thehydraulic conductivity of unsaturated soils.” Soil Sci. Soc. Am. J., 44,892–898.
GEOENVIRONMENTAL ENGINEERING © ASCE / JUNE 2006 / 751
. 2006.132:736-751.