soil water change as related to position of wheat straw mulch on the soil surface1
TRANSCRIPT
Soil Water Change as Related to Position of Wheat Straw Mulch on the Soil Surface1
D. E. SMIKA2
ABSTRACTA field study was conducted in the Central Great Plains to de-
termine the effects of the position of wheat straw mulch on soil waterchange of a silt loam soil (a montmorillonitic, mesic Aridic Paleus-toll) during three 14-month fallow periods. Treatments of 4600 kg/ha of wheat straw mulch flat on the soil surface, 3A flat and '/< stand-ing, or l/i flat and '/2 standing (normal position following standardcombine harvesting) were compared with bare soil. Standing stubblewas 0.46 m tall. Soil water content of one 1-m3 hydraulic lysimeterwithin each treatment was measured daily and changes summed foreach week, and at a distance of 2 m from each side of the lysimetera neutron depth probe was used to determine soil water contentweekly except when the soil was frozen. The relationship of soilwater change for each weekly period with weekly values of totalprecipitation, total open-pan (U.S. Weather Bureau Class A) evap-oration, average daylight-hour vapor pressure deficit, average max-imum air temperature, average daily air temperature, average day-light-hour air temperature, total solar radiation, and average dailywind movement, was determined by single and multiple-correlationtechniques. Soil water increases were related only to precipitationevents with the highest correlation resulting from the l/i flat *fi stand-ing wheat straw position treatment. Soil water losses were best cor-related with wind movement with r2 values of 0.55, 0.41, 0.41, and0.32 for bare soil, flat 3/4 flat-1* standing, and lfi flat-1/: standingtreatments, respectively. Soil water loss occurred from both bare soiland where the mulch was flat with winds of 0.08 MS '. When V* or'/z of the mulch was standing, a wind of at least 0.55 MS ' wasneeded before soil water loss occurred. Standing wheat straw doesnot function as a wick for loss of water from the soil.
Additional Index Words: wind, precipitation, soil surface temper-ature, wick action.
Smika, D.E. 1983. Soil water change as related to position of wheatstraw mulch on the soil surface. Soil Sci. Soc. Am. J. 47:988-991.
STORED SOIL WATER at seeding in the Central GreatPlains is more efficiently used by plants than water
received while the crop is growing (3). This fact is aprimary reason why fallow has been shown to be themost water-use efficient system for wheat productionin the Central Plains (5). In a region of erratic precip-itation amounts and frequency, water shortage is theprimary factor limiting dryland crop production;therefore, every effort should be made to increase theefficiency of the best system that is available. Soil waterloss by evaporation from the soil surface is probablythe greatest factor contributing to low fallow waterstorage efficiencies in the Great Plains.
Soil water storage during fallow increases with in-creasing amounts of residue on the soil surface (4, 7).The placement of equal quantities of wheat residue onthe soil surface in concentrated zones vs. uniform dis-tribution over the entire soil surface has been esti-mated to be beneficial for reducing soil water evapo-ration (1). The research reported herein was conductedto evaluate (i) the role that various positions of strawmulch on the soil surface plays in soil water change
1 Contribution from Soil, Water, and Air Sciences, USDA-ARS.Received 21 Apr. 1982. Approved 1 Apr. 1983.2 Soil Scientist, Central Great Plains Res. Stn., Akron, CO 80720.
and soil surface microclimate during fallow comparedto bare soil; and, (ii) if standing wheat stubble attachedto its root system removes soil water by wick action.
METHODS AND MATERIALSThis field experiment was conducted at the Central Great
Plains Research Station near Akron, Colo. The soil of theexperimental area is a Weld silt loam which is a member ofthe fine, montmorillonitic, mesic Aridic Paleustolls. Soilwater change data were collected during three 14-month fal-low periods, and data on soil water loss by wick action ofstanding stubble were collected in the fourth year.
Residue position treatments were established each yearfollowing combine harvesting of the area and were: all strawflat on the soil surface, straw 3/4 flat-'A standing, and strawVi flat-te standing. These treatments were compared to abare soil treatment where all residue had been removed bymowing and hand raking. The all-flat treatment was ob-tained by cutting all remaining standing residue at the soilsurface and uniformly distributing it on the soil surface. The3/4 flat-'/4 standing treatment was obtained by randomly cut-ting 1A of all remaining standing straw at the soil surface anduniformly distributing it on the soil surface. The 1A flat-'/istanding treatment is the distribution obtained by the com-bine harvesting. The standing residue was 0.46 m tall andthe total amount of residue was 4600 kg/hg. Seeding drillrows were 0.30 m apart and oriented east-west during 2years and north-south in 1 year. Plots were 9 by 9 m witha 1-m3 hydraulic lysimeter located in the center. The blockof 8 plots was located in an area of standing wheat stubblethat extended for at least 60 m in all directions from theedges of the plots. The lysimeter gauges were read daily at0730 with differences in daily readings summed to obtainweekly soil water content values. Two and one-half metersnorth, south, east, and west from the center of each lysi-meter, soil water content was determined weekly with a neu-tron probe at 0.30-m increments to a depth of 1.80 m. Read-ings in both systems were taken during the time when thesoil was not frozen or covered with snow. During the 3 years,140 weeks of data were available and soil water during theseweeks was classified as increases (74), loss (27), or no change(39) weeks.
Chang (2) states that evaporation depends on tempera-ture, wind, humidity, and radiation. In this paper humidityis expressed in terms of vapor pressure deficit and simpleor multiple regression techniques were used to establish re-lationships of weekly soil water increase or loss values withweekly values of: total precipitation, total U.S. Weather Bu-reau Class A open-pan evaporation, average daylight-hourvapor pressure deficit, average maximum air temperature,average daily air temperature, average daylight-hour air tem-perature, total solar radiation, and average daylight-hour airtemperature, total solar radiation, and average daily windat 1 m above the soil surface. Weeks with no soil waterchange were not evaluated separately in this study.
All weed growth in all plots was controlled through theuse of combinations of residual and/or contact herbicides asneeded and appropriate for the weed species to be con-trolled.
Wind velocities at the soil surface at the top of the flatmulch layer, and at 0.23-, 0.46-, and 1.0-m distances abovethe soil surface were determined by averaging 6 to 10 in-stantaneous readings at each height as obtained with an om-nidirectional, linearized, constant-temperature, platinum-re-sistance wire sensor accurate for wind velocities from 0.02to 29.72 MS"1. Wind measurements were made only when
988
SMIKA: SOIL WATER CHANGE AS RELATED TO POSITION OF WHEAT STRAW MULCH ON THE SOIL SURFACE 989
wind direction was 10 degrees or more from parallel to therow direction of the stubble. Soil surface and composite soiland straw on the soil surface temperatures (hereafter all willbe referred to soil surface temperature) were measured dailyat 1000, 1200, and 1500 h MDT using an infrared radiationthermometer with a 10.5- to 12.5-jum spectral region with a2.0-degree field of view. Air temperatures were measuredhourly with a copper-constantan thermocouple shielded fromdirect radia^n at 0.23 and 1 m above the soil surface.
To determine if standing wheat straw has a wick actionon soil water loss, during the fourth year of the study, fourlysimeters had all stubble removed and four lysimeters hadte flat-'A standing stubble, and all lysimeters were wetted tofield capacity. Two of the bare and two of the te flat-te stand-ing stubble lysimeters had the entire soil surface covered toa depth of at least 2 cm with a mixture of paraffin and bees-wax (20:1 ratio) to completely seal the soil surface. All lys-imeters were read daily at 0730 for 34 d from 31 July to 2September.
RESULTS AND DISCUSSIONLysimeter and neutron probe water content mea-
surements produced almost identical results for eachweekly period so all soil water storage values given inTable 1 are an average of both measurement methodsfor the 3 years. For all weeks of the fallow period,straw position significantly influenced both total fal-low period water storage and storage efficiency withlfi flat-'/S standing >3A flat-'A standing > all flat >bare soil (Table 1). These storage amounts and effi-ciencies are similar to values obtained on larger fieldswith comparable treatments (6).
Soil water increase weeks were related only to totalweekly precipation with r2 values of 0.86**, 0.85**,0.84**, and 0.92** for the bare soil, flat, % flat-'/4standing, and Vi flat-Vi standing straw treatments, re-spectively. These relationships were all essentiallyidentical except for the '/2 flat-1/? standing treatment.While a net soil water gain may have been recordedfor a specific week, there may have been some daysduring the week when water was lost from the soil.
Of the factors tested, soil water losses were corre-lated the best to wind movement of 1 m above thesoil surface with r2 values of 0.55**, 0.41*, 0.41*, and0.32 for the bare, flat, 3A flat-'/4 standing, and [/2 flat-!/2 standing straw position treatments, respectively.These r2 values increased by amounts of 0.05 or lesswhen soil water loss was correlated to combination ofthe various factors. Thus, clearly showing that windwas the dominant factor influencing soil water loss.The regression equations for soil water loss as related
Table 1—Fallow period water storage to a depth of 1.8 m andstorage efficiency for bare soil and different straw
positions on the soil surface, 3-year average.
Water storage
Straw position Amount Efficiencyt
Bare soilFlat straw3/4 flat-1/4 standing1/2 flat-1/2 standing
96 a**137 b234 c272 d
18.6 w**26.5 x45.3 y52.9 z
* Values accompanied by different letters are significantly different atP = 0.01.
t Storage efficiency is the water stored divided by precipitation receivedduring: storage period multiplied by 100.
0.5 1.0 1.5 2.0 2.5 3.0 3.5 4.0 4.5AVERAGE DAILY WIND SPEED (MS"1)
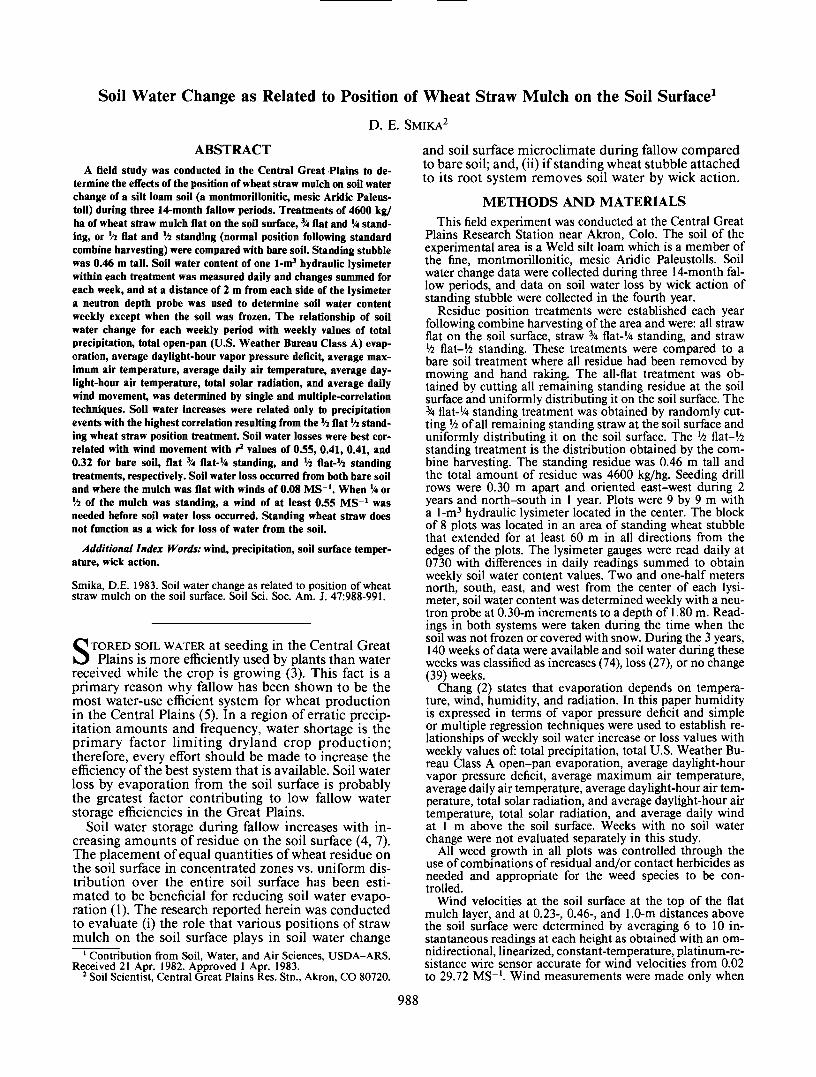
Fig. 1—Relation of soil water loss per day to average daily windvelocity for bare soil and soil with straw mulch in different po-sitions on the soil surface during soil water loss weeks.
to wind speed for the r2 values and treatments in thesame order as listed above are: Y = 0.125.x, Y =-0.22 + 0.117x; Y = -0.77 + 0.106.x; and y =— 0.625 + 0.069.x, respectively (Fig. 1), where x =average daily wind velocity in MS and Y = mm ofwater loss per day during weeks when soil water lossoccurred. From these analyses water loss from baresoil was found to occur when wind occurred at thesoil surface and that an average of 0.45 mm loss oc-curred for each 0.28 MS"1 increase in wind. With flatstubble, water loss from the soil did not occur until awind speed of at least 0.14 MS""1 occurred, but there-after average water loss of 0.42 mm occurred for each0.28 MS"1 of wind. This loss rate is only a 7% reduc-tion over that found with bare soil. When 3A of thestraw was flat 1A was standing an average daily windvelocity of 0.56 MS"1 was needed before water waslost for each 0.28 MS"1 of wind speed. This latterstraw position decreased water loss by 16% when com-pared to bare soil and 10% when compared to flatstraw.
With '/2 flat-!/2 standing straw, an average daily windvelocity of 0.69 MS"1 was needed before water lossoccurred, and each 0.28 MS"1 increase in wind move-ment above this level resulted in an average water lossof 0.25 mm. The l/i flat-!/2 standing treatment de-creased water loss associated with wind by 44, 40, and34% when compared to the bare soil, flat straw, and3/4 flat-V4 standing treatments, respectively.
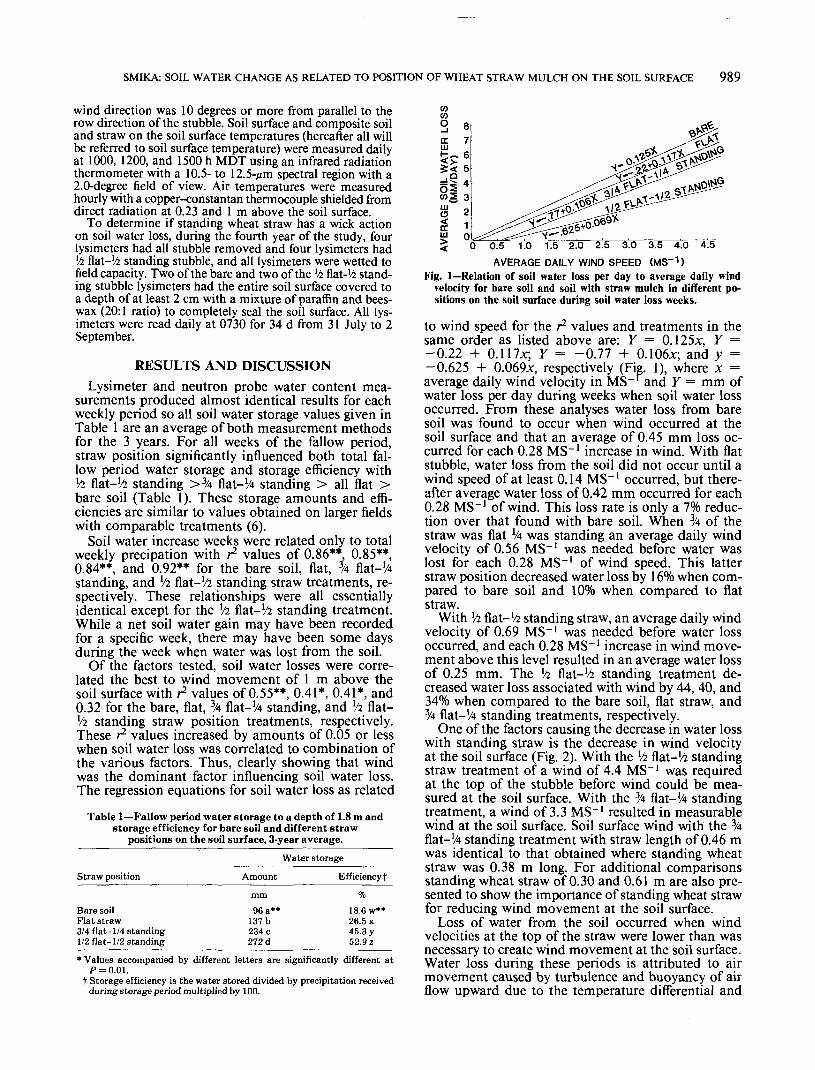
One of the factors causing the decrease in water losswith standing straw is the decrease in wind velocityat the soil surface (Fig. 2). With the '/z flat-1^ standingstraw treatment of a wind of 4.4 MS"1 was requiredat the top of the stubble before wind could be mea-sured at the soil surface. With the 3/4 flat-V4 standingtreatment, a wind of 3.3 MS"1 resulted in measurablewind at the soil surface. Soil surface wind with the 3/4flat-1/! standing treatment with straw length of 0.46 mwas identical to that obtained where standing wheatstraw was 0.38 m long. For additional comparisonsstanding wheat straw of 0.30 and 0.61 m are also pre-sented to show the importance of standing wheat strawfor reducing wind movement at the soil surface.
Loss of water from the soil occurred when windvelocities at the top of the straw were lower than wasnecessary to create wind movement at the soil surface.Water loss during these periods is attributed to airmovement caused by turbulence and buoyancy of airflow upward due to the temperature differential and
990 SOIL SCI. SOC. AM. J., VOL. 47, 1983
7-
,T 6ui
tuo2 4DC3CO
5 "in
4 2o V.-
O*
*^o*''f< */^'/'f c . ->v-\'j- ,Wr.* >'
A ' ?*^
>•?' *>*
0 3 4 5 6 7 8 9 1 0
WIND SPEED AT TOP OF S T R A W (MS"1)
Fig. 2—Relation of wind velocity at the soil surface to wind velocityat the top of the straw for straw heights of 30, 38, 46, and 61 cm.
the rate of change of wind speed between the soil sur-face and the top of the standing straw.
The longest continuous water loss period was 5weeks and occurred during part of August and the first10 d of September of the 3rd year of the study. Thisperiod began the day after 16.8 mm of rain. Duringthis 5-week period, average daily water and total waterlosses were highest with bare soil and lowest with the'/2 flat-'/2 standing straw treatments (Table 2). The flatand 3A flat-'/4 standing straw treatments resulted inabout equal daily loss rates and total losses, both ofwhich were about midway between those for the othertwo treatments. Only the 1A flat-te standing treatmentended the 5-week period with any of the 16.8-mm rainremaining as soil water, and even that was 01.4mm.
In addition to the previously discussed influence ofwind reduction and straw position on soil water loss,straw position affected soil surface temperature (Table2) which also influenced daily water loss and waterloss for the total 5-week period. Total soil water lossduring this 5-week period was highly related to soilsurface temperature, r2 = .996**. Each degree Celsiusincrease in temperature resulted in 0.014 mm of waterloss per day. The decrease in soil surface temperaturewith the different straw positions compared to air tem-perature above the standing straw positions compared
Table 2—Soil water loss and average daily soil surfacetemperature as affected by bare soil and strawposition during a 5-week August-September
period without precipitation.
Straw position
Bare soilFlat straw3/4 flat-1/4 standing1/2 flat-1/2 standing
Soil water loss
Average daily Total
0.66 c** 23.1 f**0.56 b 19.6 e0.53 b 18.6 e0.43 a 15. Id
Soil surfacetempera turef
°C47.8 z**41.7 y39.6 y32.2 x
** Values accompanied by different letters are significantly different atP = 0.0l.
t Average of measurements at 1000, 1200, and 1500 h with a radiationthermometer.
2 4 6 8 10 12 14 16 18 20 22 24 26 28 30 32 34
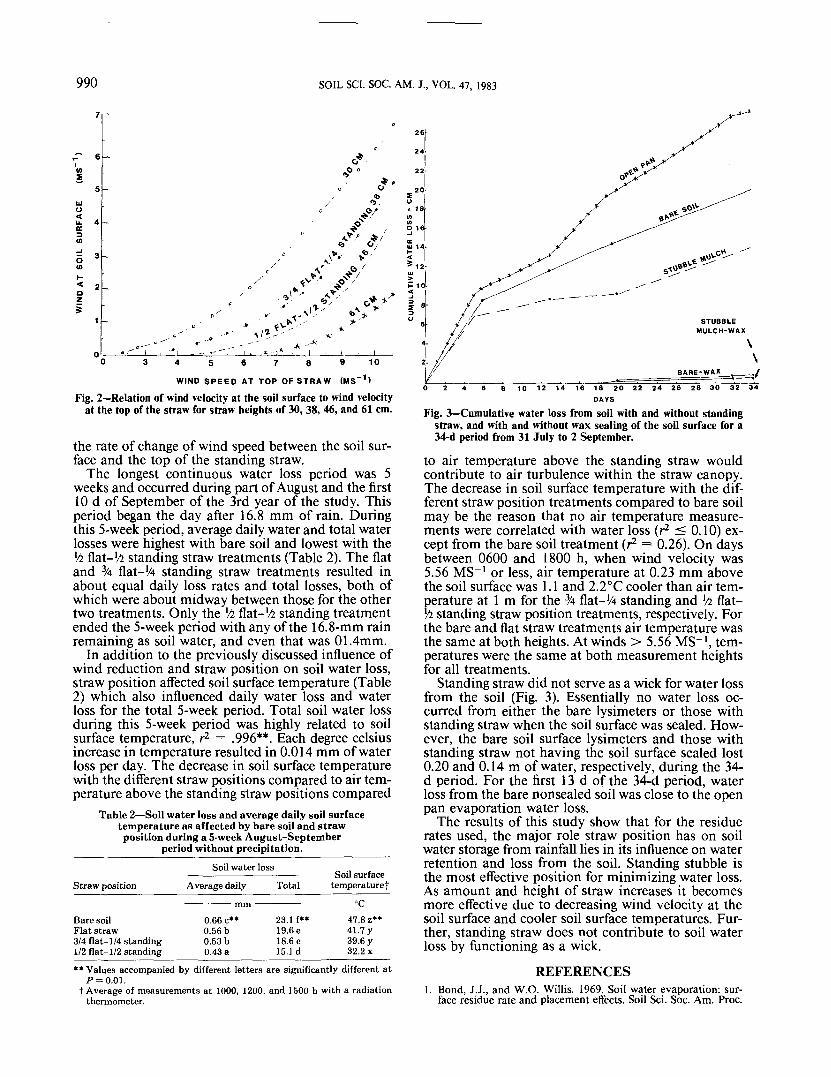
Fig. 3—Cumulative water loss from soil with and without standingstraw, and with and without wax sealing of the soil surface for a34-d period from 31 July to 2 September.
to air temperature above the standing straw wouldcontribute to air turbulence within the straw canopy.The decrease in soil surface temperature with the dif-ferent straw position treatments compared to bare soilmay be the reason that no air temperature measure-ments were correlated with water loss (r2 < 0.10) ex-cept from the bare soil treatment (r2 = 0.26). On daysbetween 0600 and 1800 h, when wind velocity was5.56 MS~' or less, air temperature at 0.23 mm abovethe soil surface was 1.1 and 2.2°C cooler than air tem-perature at 1 m for the 3/4 flat-'/4 standing and l/i flat-k standing straw position treatments, respectively. Forthe bare and flat straw treatments air temperature wasthe same at both heights. At winds > 5.56 MS~', tem-peratures were the same at both measurement heightsfor all treatments.
Standing straw did not serve as a wick for water lossfrom the soil (Fig. 3). Essentially no water loss oc-curred from either the bare lysimeters or those withstanding straw when the soil surface was sealed. How-ever, the bare soil surface lysimeters and those withstanding straw not having the soil surface sealed lost0.20 and 0.14 m of water, respectively, during the 34-d period. For the first 13 d of the 34-d period, waterloss from the bare nonsealed soil was close to the openpan evaporation water loss.
The results of this study show that for the residuerates used, the major role straw position has on soilwater storage from rainfall lies in its influence on waterretention and loss from the soil. Standing stubble isthe most effective position for minimizing water loss.As amount and height of straw increases it becomesmore effective due to decreasing wind velocity at thesoil surface and cooler soil surface temperatures. Fur-ther, standing straw does not contribute to soil waterloss by functioning as a wick.
ROSE ET AL.: A MATHEMATICAL MODEL OF SOIL EROSION & DEPOSITION PROCESSES: I 991