soil washing optimisation and assessment of the...
TRANSCRIPT
Soil Washing Optimisation and Assessment of the Residues with Focus on Copper: a Method to Treat Metal Contaminated Sites Master of Science Thesis in Civil and Environmental Engineering NELLY KHMILKOVSKA Department of Civil and Environmental Engineering Water Environment Technology CHALMERS UNIVERSITY OF TECHNOLOGY Gothenburg Master’s Thesis 2014:07

MASTER’S THESIS 2014:07
Soil Washing Optimisation and Assessment of the
Residues with Focus on Copper: a Method to Treat Metal
Contaminated Sites Master of Science Thesis in Civil and Environmental Engineering
NELLY KHMILKOVSKA
Department of Civil and Environmental Engineering Water Environmental Technology
CHALMERS UNIVERSITY OF TECHNOLOGY
Gothenburg, Sweden 2014
In collaboration with
UNIVERSITY OF BORÅS School of Engineering
Borås, Sweden 2014
Soil washing Optimisation and Assessment of the Residues with Focus on Copper: a
Method to Treat Metal Contaminated Sites
Master of Science Thesis in Civil and Environmental Engineering
NELLY KHMILKOVSKA
© NELLY KHMILKOVSKA, 2014
Examensarbete / Institutionen för bygg- och miljöteknik,
Chalmers Tekniska Högskola 2014:07
Department of Civil and Environmental Engineering
Water Environmental Technology
Chalmers University of Technology
SE-412 96 Gothenburg
Sweden
Telephone: + 46 (0)31-772 1000
Cover: Cover pictures showing a soil sample after sieving is completed. Chalmers Reproservice / Department of Civil and Environmental Engineering Göteborg, Sweden 2014
I
Soil washing Optimisation and Assessment of the Residues of the Residues with Focus on Copper: a Method to Treat Metal Contaminated Sites
Master of Science Thesis in Civil and Environmental Engineering NELLY KHMILKOVSKA Department of Civil and Environmental Engineering Water Environment Technology Chalmers University of Technology
ABSTRACT
Contamination of soil with toxic metals is a common and far-reaching problem of today around the world. Metals have polluted many sites due to past and present industrial processes, landfills and mining and pose risks for ecological systems and human health. Only in Sweden, 80 000 contaminated sites were estimated. Currently the most established remediation technique used for metal contaminated soils is excavating and landfilling. This practice doesn’t solve the issue because it simply moves the problem to a different location. On the contrary, soil washing is a permanent alternative treatment used to remove metal contaminants from soils that also allows for valuable metals to be recovered. This study examined soils, which are severely polluted with copper (Cu) and other toxic metals. In focus was developing of an enhanced soil washing method using two leachants successively: acidic wastewater and ordinary water to dissociate toxic metals from soil matrix. The focal point was to ensure minimal copper concentration remained in final residues after the treatment. The changes in the soils’ texture were studied with a view to acquire deeper understanding of the effect of acidic wastewater on soil’s structure.
Additionally, by re-using a by-product from incineration – wastewater, this project aimed to address the society’s increasing demand for sustainable use of materials. Consequently, facilitating the transformation of the social attitude towards waste as a valuable resource.
The findings from the research showed that the acidic wastewater is effective in removing certain toxic metals from the soil matrix, in particular Cu (~90%). Still, high leaching of Cu did not result in receiving clean enough residues to be returned back to the original site. Nevertheless, by using the developed method to treat metal contaminated soils, the compliance with the Swedish guidelines for non-hazardous waste can be achieved. The final residues demonstrated ability to adsorb mercury (Hg) from wastewater. This emphasised the importance of including pre-treatment for wastewater prior using it for washing. The changes in soils’ structure didn’t affect significantly its quality. The expected outcomes from further improvements on this study is achievement of even cleaner residues, which ensures depositing the soil residues to inert landfill or returning them back to the site.
Keywords: Soil washing, leaching, acid washing, copper, metal contaminated soil, post-treated soil.

II
CHALMERS, Civil and Environmental Engineering, Master’s Thesis 2014:07 1
Table of Contents
1 INTRODUCTION ........................................................................................................... 5 1.1 AIMS AND OBJECTIVES ...................................................................................................... 6 1.2 LIMITATIONS ................................................................................................................... 6
2 LITERATURE REVIEW .................................................................................................... 8 2.1 VALUE OF SOIL ................................................................................................................ 8 2.2 COPPER .......................................................................................................................... 9 2.3 REMEDIATION METHODS ................................................................................................ 10
3 STUDIED SITES ........................................................................................................... 13 3.1 KÖPMANNEBRO ............................................................................................................. 13 3.2 BJÖRKHULT ................................................................................................................... 13
4 CRITERIA FOR CONTAMINATED MATERIAL ................................................................ 15 4.1 KM AND MKM GUIDELINES ............................................................................................ 15 4.2 SWEDISH STANDARD LEACHING TEST SS-‐EN-‐12457-‐3 ........................................................ 16
5 METHODS AND MATERIALS ....................................................................................... 17 5.1 PREPARATION ............................................................................................................... 17
Sampling ......................................................................................................................... 17 Sample preparation ........................................................................................................ 17 Process water ................................................................................................................. 18
5.2 OPTIMISATION OF LEACHING PARAMETERS ......................................................................... 18 Process water optimisation ............................................................................................ 19 Physical pre-‐treatment ................................................................................................... 19 Liquid to solid ratio ......................................................................................................... 20 Leaching procedure for optimisation part ...................................................................... 20
5.3 BATCH LEACHING ........................................................................................................... 21 5.4 CHARACTERISTICS OF SOIL RESIDUES AFTER BATCH LEACHING ................................................. 23
Soil as Filter and Buffer for Heavy Metals ....................................................................... 24 pH measurement of soil samples .................................................................................... 24 Humus content ............................................................................................................... 25 Clay content .................................................................................................................... 25 Soil texture ...................................................................................................................... 25 SEM -‐ Scanning Electron Microscope .............................................................................. 25 Swedish Standard Leaching Test .................................................................................... 25
5.5 ANALYTICAL METHODS ................................................................................................... 26 HACH ............................................................................................................................... 26 External analyses ............................................................................................................ 26 Efficiency estimation ....................................................................................................... 27
6 RESULTS AND DISCUSSION ......................................................................................... 28 6.1 CHARACTERISTICS OF ORIGINAL SOIL .................................................................................. 28
pH ................................................................................................................................... 28 Soil texture ...................................................................................................................... 28 Metal concentration ....................................................................................................... 29
6.2 OPTIMIZATION PART ...................................................................................................... 30 Process water optimization ............................................................................................ 30 Sieving optimisation ....................................................................................................... 31 L/S optimization .............................................................................................................. 32
6.3 BATCH EXPERIMENT ....................................................................................................... 33
CHALMERS, Civil and Environmental Engineering, Master’s Thesis 2014:07 2
Washing optimisation ..................................................................................................... 33 6.4 FINAL RESIDUES CHARACTERISATION AND EVALUATION ......................................................... 34
Soil matrix weight change .............................................................................................. 36 Efficiency ......................................................................................................................... 36 pH ................................................................................................................................... 37 Soil texture ...................................................................................................................... 38 Soil as Filter and Buffer for Heavy Metals ....................................................................... 39 SEM ................................................................................................................................. 39 SS-‐EN12457-‐3 leaching test ............................................................................................ 40
6.5 PROSPECT ..................................................................................................................... 42
7 CONCLUSIONS ........................................................................................................... 43
8 CONTINUATION OF THE WORK .................................................................................. 44
Appendix I…………………………………………………………………………49
Appendix II…………………………………………………………………………49
Appendix III………………………………………………………………………...50
Appendix IV………………………………………………………………………...51
Appendix V…………………………………………………………………………52
CHALMERS, Civil and Environmental Engineering, Master’s Thesis 2014:07 3
Acknowledgment As I moved through the completion of this research work, not only I acquired deeper knowledge in the field but most importantly met individuals without whom this dissertation would not have been possible.
Fist, my deep gratitude goes to my thesis supervisor, Karin Karlfeldt Fedje for her unsurpassable drive, expertise and generous guidance. My warm gratitude goes to my supervisor and examiner, Ann-Margret Strömvall for her continuous support and enthusiasm. I have been incredibly lucky to have such through and patient supervision all the way. Their encouragement I will never forget. In the laboratory I have always had the best support possible, from Mona Pålsson. Her positive energy and generous guidance allowed my practical work to be not only efficient but also enjoyable.
I owe a particular debt of thanks to Yevheniya Volchko for her kind help and literature assistance that had an important contribution to this project, to Oskar Modin for his amiable and prompt help with IC analysis and Sebastien Rauch for his cooperative and kind help with ICP-MS analysis. I am very grateful to Haiping Lai for finding the time and helping me with SEM session, which made a significant difference to my project.
My sincere thanks goes to Anita Pettersson in the University of Borås, for playing a crucial role in my quest for finding a project that I yearned to give my all dedication. Thanks to her I had luck to work on such a project for a year. I am indebted to Peter Therning in the University of Borås, whose forward-thinking, percipience and trust in me allowed me to enter University of Borås in the first place. Thank you!
I appreciate all the students and teachers in the Water Environment Technology division for making this year with Chalmers a very special and positive experience for me.
Nelly Khmilkovska Gothenburg
May 2014
CHALMERS, Civil and Environmental Engineering, Master’s Thesis 2014:07 4
Glossary Site I Köpmannebro Site II Björkhult Leachant, is a liquid used in a leaching test as a leaching agent. Eluate, is a solution (solvent and dissolved matter) produced during a leaching process. Soil washing, is a permanent soil treatment method used for removing metal contaminants from soils with water or chemical solutions as a leachant. Enhanced soil washing, is an improved soil treatment method used for removing metal contaminants from soils. The variations may include sequential washing steps, longer time of washing or adding washing steps with other leaching medium.
Acidic leaching, term used in this project to describe a part of batch leaching experiment where process water was used to wash original soil.
Washing, term used in this project to describe a part of batch leaching experiment followed after acidic leaching where soil residues were washed with Milli-Q water.
Final soil residues, is a fraction of soil that is left after original soil went through the full batch leaching experiment.
Surface horizons, are different layers within a soil profile that are more or less parallel at the earth's surface.
Soil structure, is a quality of a soil determined by how individual soil granules clump or bind together and aggregate.
CHALMERS, Civil and Environmental Engineering, Master’s Thesis 2014:07 5
1 Introduction “Heavy metals” is a joint definition of metals and metalloids that have density greater than 4g/!"!. Regardless, it is the fact that some of them have chemical properties such as toxicity or ability to express poison-like quality, what causes concern (Duruibe et al., 2007). These toxic metals enter into the environment from natural and anthropogenic sources. However, those that occur naturally are rarely at toxic levels. The real threat comes from sources like mining and various industrial activities, landfills and the use of pesticides (Duruibe et al., 2007) (USDA, 2000). Contamination of soil with toxic metals is a common and serious problem of today. Under various circumstances metals leach into groundwater and eventually end up in the aquifer. They can be transported into near surface waters if metals are emitted to the run-off water, which causes contamination of this water and consequently sediments and soil pollution. Once metal pollutants are introduced into the environment they accumulate because of their inability to degrade. The only exceptions are metals in organic form as for example mercury and selenium pollutants that can be volatilized by microorganisms (USDA, 2000). Metals in soil are sorbed on humus particles, which then passes the pollutant along with nutrients to plants and in this way metals may enter the food chain (Dermont et al., 2008). Moreover, high content of toxic metals have a direct adverse affect on soil microbial health, which may have negative effect on soil fertility (Ahmad and Ooi, 2010). Correspondingly, this leads to serious consequences for the environment and for human health.
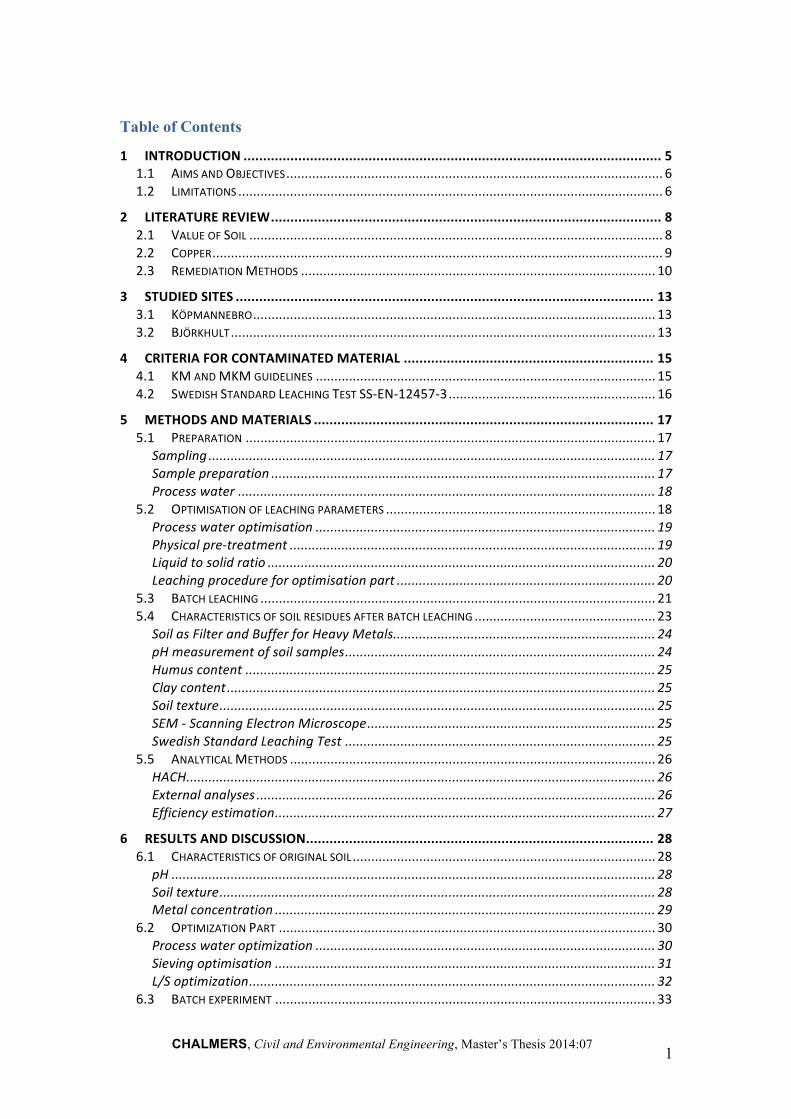
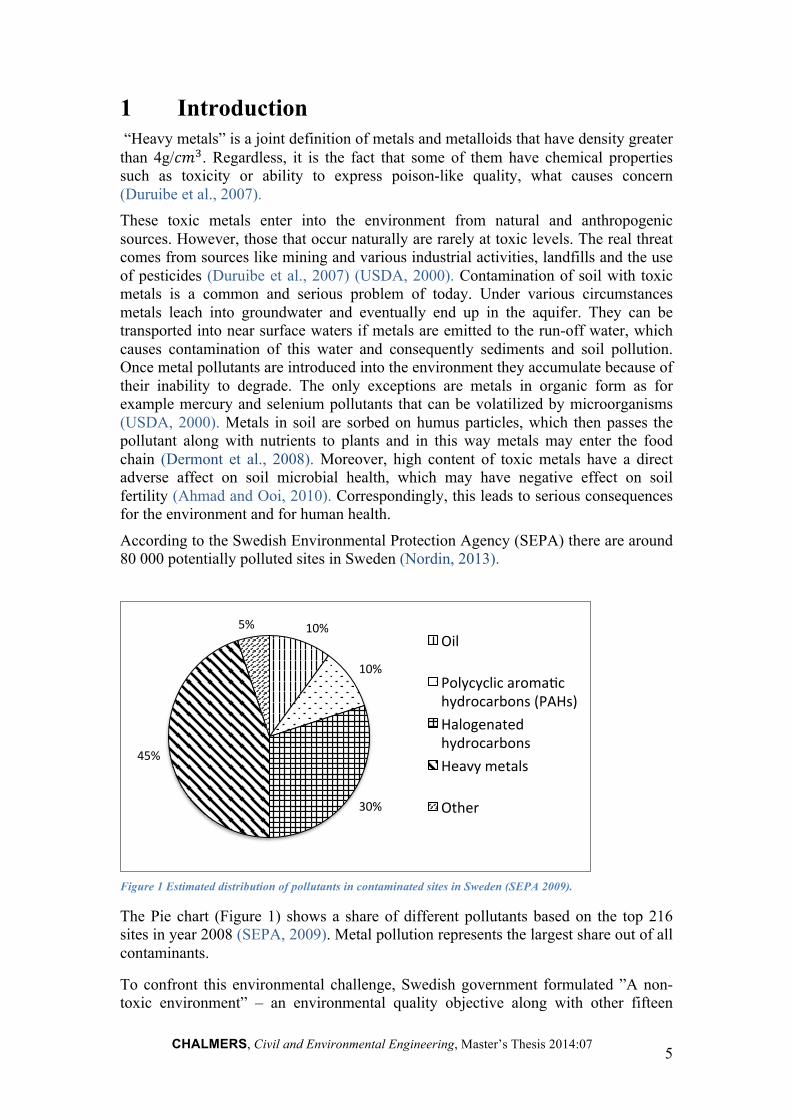
According to the Swedish Environmental Protection Agency (SEPA) there are around 80 000 potentially polluted sites in Sweden (Nordin, 2013).
Figure 1 Estimated distribution of pollutants in contaminated sites in Sweden (SEPA 2009).
The Pie chart (Figure 1) shows a share of different pollutants based on the top 216 sites in year 2008 (SEPA, 2009). Metal pollution represents the largest share out of all contaminants.
To confront this environmental challenge, Swedish government formulated ”A non-toxic environment” – an environmental quality objective along with other fifteen
10%
10%
30%
45%
5% Oil
Polycyclic aromaQc hydrocarbons (PAHs) Halogenated hydrocarbons Heavy metals
Other
CHALMERS, Civil and Environmental Engineering, Master’s Thesis 2014:07 6
environmental objectives to be achieved by 2020 (SEPA, 2013). To address this serious environmental threat, all polluted in Sweden sites were recognized according to the origin and degree of pollution and the toxic effect. Currently this process is still at the inventory phase where all of the potentially polluted sites are split into classes (SEPA, 2013). Simultaneously, most urgent sites are treated. However, the difficulty is that more contaminated sites arise continuously (SEPA, 2013, Ohlsson et al., 2011).
1.1 Aims and Objectives The aim of this master’s thesis was to contribute with increased knowledge and better understanding of acidic soil washing as a remedial method for soils contaminated with toxic metals. A particular focus was given to Cu contaminant and evaluation of the effect of the treatment on the soil’s structure and properties. The aspiration of this work is to develop a soil remediation method that allows receiving final soil residues with metals content below Swedish guidelines and near neutral acidity.
The finding of this study should elucidate further on topic of dealing with toxic metals in soils and methods of handling post remedial soil residues.
Specific objective were to:
• Develop an enhanced acidic washing method with all parameters for effective washing of metals optimized.
• Investigate the effect of washing steps with water after leaching with acidic agent; and to optimize the liquid to solid ratio (L/S) and number of sequential steps used for this part.
• Evaluate the success of the developed method by its efficiency to leach Cu and its ability to receive sufficiently ‘clean’ and stable soil residues.
• Evaluate and monitor changes in concentration of other toxic metals and in the soil residues.
• Evaluate the final soil residues in terms of sensitive land use i.e. KM/MKM and the standard leaching test SS- EN12457-3.
• Investigate the effect of the acidic wastewater on soil by comparing and evaluating physical and chemical changes that took place after the treatment.
1.2 Limitations The definition of the limiting factors aimed to facilitate the achievement of fair experiments with reliable results and was described while setting the scope of the study as well as added later as the experimental part was in progress. The main limitations accepted and encountered in this study are listed below: • Due to time limitation this study focused on washing of soils from deeper horizons
and excluded bark. This was true for both sites where bark was present.
CHALMERS, Civil and Environmental Engineering, Master’s Thesis 2014:07 7
• The preparation of representative soil sample mix was limited by the available soil samples collected previously from several test points identified in Kemakta Konsult AB and WSP reports.
• To receive quantitative data for metal concentration in liquid and solid samples the
samples were sent to a certified external laboratory for ICP-AES analysis (inductively coupled plasma atomic emission spectroscopy) due to latter not being available at the laboratory at that time. The results that showed below a certain detection limit were divided into 2 and used in further calculation. For example, when ICP-AES detected a concentration of Co < 20 µg/L, 10 µg/L was assumed.
• To evaluate the stability of the metal contaminants within the original soil and final residues the modified SS-EN-12457-3 leaching test was used. The amount of the sample tested was limited to 2g due to limited availability of a total mixed soil sample.
CHALMERS, Civil and Environmental Engineering, Master’s Thesis 2014:07 8
2 Literature Review A literature study on soil as a natural valuable material, copper and current remedial methods are presented below.
2.1 Value of Soil Soil is a natural non-renewable resource that plays wide spectrum of vital roles that goes far beyond the most immediately-understood ‘soil function as food production’. According to the European Commission (European Commission, 2014), soil’s multi-functionality can be described as “Soil performs a multitude of ecological, economical, social and cultural functions of vital significance.” The multi-functionality of soil is a fundamental principle of the modern understanding of soils (Lehmann, David and Stahr, 2009). Scientific communities recognised diversity of soil functions as (European Commission, 2014 and Volchko, 2013):
• Biomass production • Storing, filtering and transforming substances and water • Biodiversity pool • Cultural environment for humans • Source of raw materials • Carbon pool • Geological and archeological heritage
The quality of food and water depends on the soil’s condition. In this project, the value of soil was explored in the context of soil’s ability to filtrate and buffer substances - Soil as Hazard Protection - to increase the awareness of soil as a site for adsorption, transformation and immobilization of inorganic pollutants (Lehmann, David and Stahr, 2009).
According to Baird and Cann (2008), soils are composed of solid particles, 90% of which have inorganic nature and the rest are organic matter and pore space. Generally, the half of the pore space is water and the other half is air. The silicate minerals represent the majority of the soil’s inorganic part. These minerals composed of polymeric inorganic structures with a silicon atom as the fundamental unit, surrounded by four oxygen atoms. Consequently, each oxygen atom linked with another silicon unit. Some networks have aluminum ions, Al3+, instead of silicon, Si 4+, with presence of other cations such as H+, K+, Na+, Ca2+ Mg2+ or Fe2+. Table 1 Classification system of soil particle sizes based on the International Society of Soil Science classification system.
Soil type Particle size (µm)
Clay < 2 Silt 2 - 20 Sand 20 - 2000 Gravel (non-soil) > 2000
On macro level the inorganic particles are the products of weathering of silicate rocks and chemical reactions with water and acids and consist of stones, sand, silt, and clay. The proportion of these components determines soil’s texture.
CHALMERS, Civil and Environmental Engineering, Master’s Thesis 2014:07 9
Depending on the size of these particles the soil can be classified into different types, see Table 1. Sand classifies further into fine sand (20-200µm) and coarse sand (200- 2000µm) (Baird and Cann, 2008).
The total surface area of a clay particle per gram is thousands of times larger than that of a silt or a sand that’s why they act as colloids upon contact with water. Accordingly, most significant mechanisms in soil such as retaining nutrients or binding organic matter happen on the surface of colloidal clay particles (Baird and Cann, 2008). The fractions of different sizes form soil’s skeleton and affects its physical, chemical and biological characteristics.
The organic part consists primarily of humus - partly decomposed photosynthetic plant material (Baird and Cann, 2008). The organic matter is an important component of soil and it represents 1-6% of the soil’s structure depending on a soil type. It characterized by dark colour and primarily consists of humus. The humus content has a direct effect on physical, chemical and biological qualities of the soil. In this project, the terms humus and organic content used interchangeably implying the same meaning.
2.2 Copper The use of Cu metal accounts for at least 10,000 years. It is widely used, especially for electrical wiring in telecommunications, building and technology sector. In addition, Cu used to produce brass and bronze alloys, expanding further the spectrum of its use. The versatility of Cu is a result of its unique qualities, such as high toughness and ductility. Moreover, Cu is only second to silver in conductivity, making it an exceptional conductor of heat and electricity (European Copper Institute, 2014).
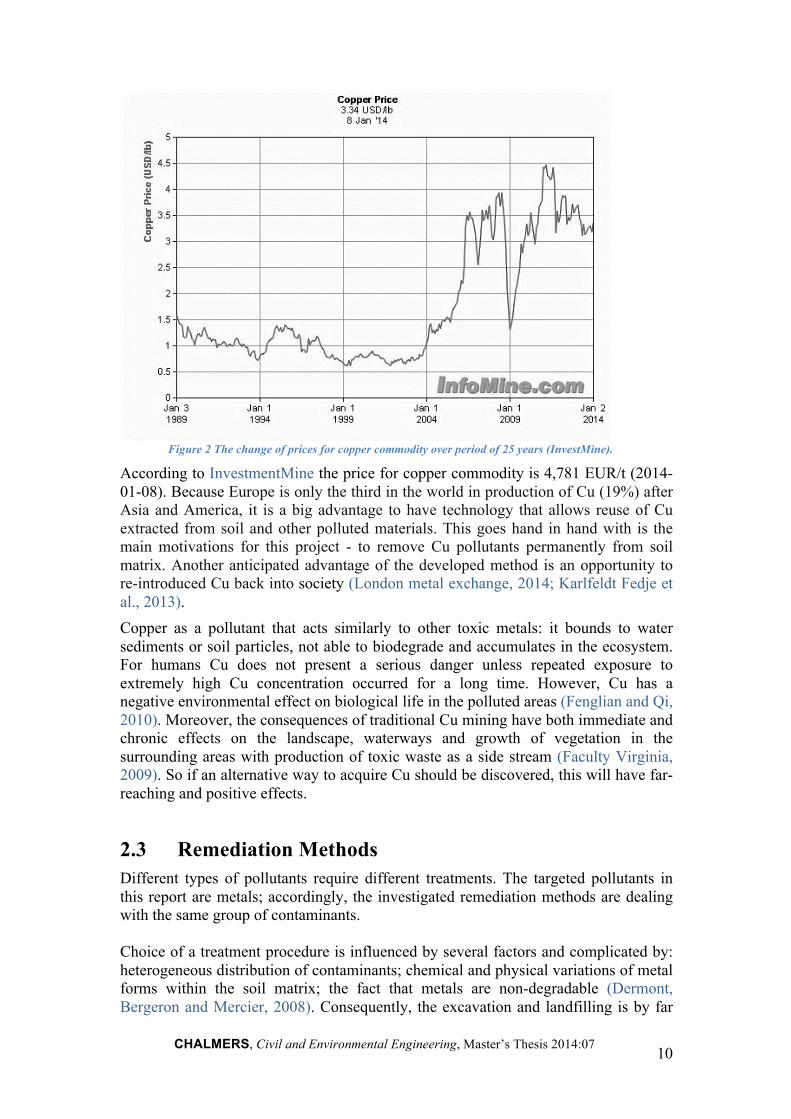
Although reserves of Cu are still sizeable, there are too many variable to conclude confidently that Cu source is infinite. Such as scientists neither know exactly how much of Cu sources there are in Earth’s crust nor its exact locations. The global Cu consumption reached 19.8 million tonnes per annum in 2011 and expected to rise in the future. Moreover, with China’s and India’s increasing demands for metals, Cu supply becomes increasingly constrained which leads to increased Cu prices, see Figure 2 (London metal exchange, 2014 and InvestmentMine, 2014).
CHALMERS, Civil and Environmental Engineering, Master’s Thesis 2014:07 10
Figure 2 The change of prices for copper commodity over period of 25 years (InvestMine).
According to InvestmentMine the price for copper commodity is 4,781 EUR/t (2014-01-08). Because Europe is only the third in the world in production of Cu (19%) after Asia and America, it is a big advantage to have technology that allows reuse of Cu extracted from soil and other polluted materials. This goes hand in hand with is the main motivations for this project - to remove Cu pollutants permanently from soil matrix. Another anticipated advantage of the developed method is an opportunity to re-introduced Cu back into society (London metal exchange, 2014; Karlfeldt Fedje et al., 2013). Copper as a pollutant that acts similarly to other toxic metals: it bounds to water sediments or soil particles, not able to biodegrade and accumulates in the ecosystem. For humans Cu does not present a serious danger unless repeated exposure to extremely high Cu concentration occurred for a long time. However, Cu has a negative environmental effect on biological life in the polluted areas (Fenglian and Qi, 2010). Moreover, the consequences of traditional Cu mining have both immediate and chronic effects on the landscape, waterways and growth of vegetation in the surrounding areas with production of toxic waste as a side stream (Faculty Virginia, 2009). So if an alternative way to acquire Cu should be discovered, this will have far-reaching and positive effects.
2.3 Remediation Methods Different types of pollutants require different treatments. The targeted pollutants in this report are metals; accordingly, the investigated remediation methods are dealing with the same group of contaminants. Choice of a treatment procedure is influenced by several factors and complicated by: heterogeneous distribution of contaminants; chemical and physical variations of metal forms within the soil matrix; the fact that metals are non-degradable (Dermont, Bergeron and Mercier, 2008). Consequently, the excavation and landfilling is by far
CHALMERS, Civil and Environmental Engineering, Master’s Thesis 2014:07 11
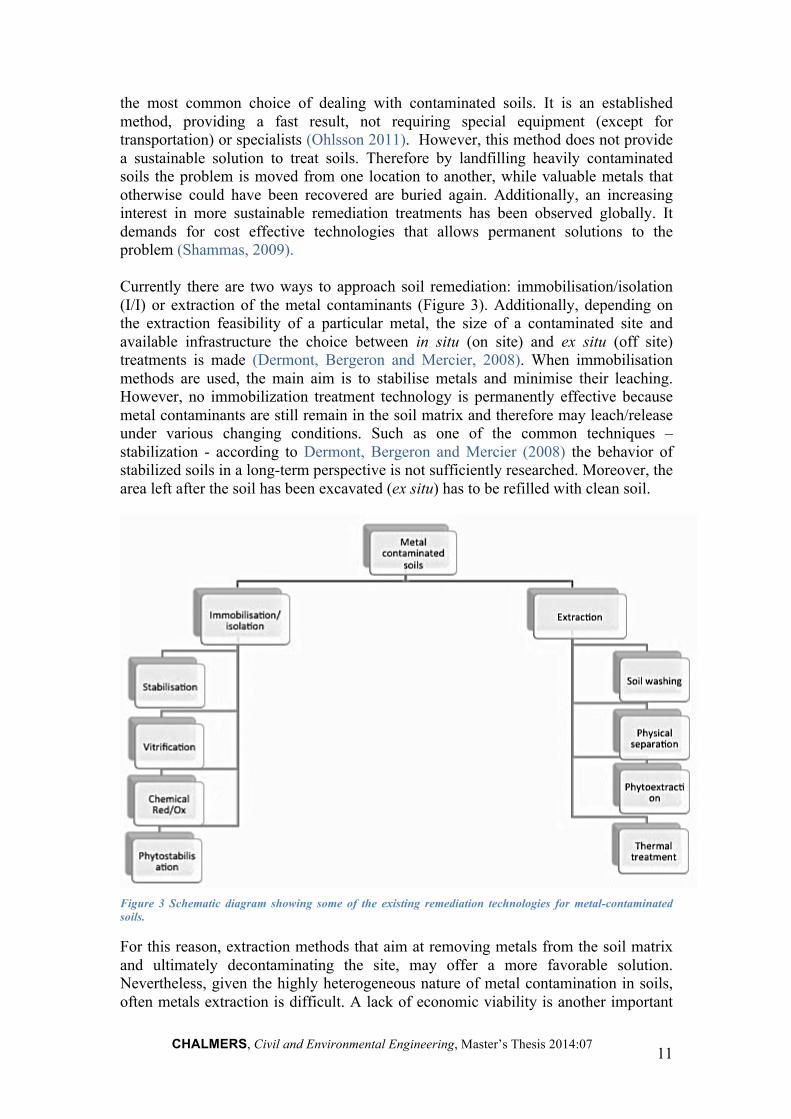
the most common choice of dealing with contaminated soils. It is an established method, providing a fast result, not requiring special equipment (except for transportation) or specialists (Ohlsson 2011). However, this method does not provide a sustainable solution to treat soils. Therefore by landfilling heavily contaminated soils the problem is moved from one location to another, while valuable metals that otherwise could have been recovered are buried again. Additionally, an increasing interest in more sustainable remediation treatments has been observed globally. It demands for cost effective technologies that allows permanent solutions to the problem (Shammas, 2009). Currently there are two ways to approach soil remediation: immobilisation/isolation (I/I) or extraction of the metal contaminants (Figure 3). Additionally, depending on the extraction feasibility of a particular metal, the size of a contaminated site and available infrastructure the choice between in situ (on site) and ex situ (off site) treatments is made (Dermont, Bergeron and Mercier, 2008). When immobilisation methods are used, the main aim is to stabilise metals and minimise their leaching. However, no immobilization treatment technology is permanently effective because metal contaminants are still remain in the soil matrix and therefore may leach/release under various changing conditions. Such as one of the common techniques – stabilization - according to Dermont, Bergeron and Mercier (2008) the behavior of stabilized soils in a long-term perspective is not sufficiently researched. Moreover, the area left after the soil has been excavated (ex situ) has to be refilled with clean soil.
Figure 3 Schematic diagram showing some of the existing remediation technologies for metal-contaminated soils.
For this reason, extraction methods that aim at removing metals from the soil matrix and ultimately decontaminating the site, may offer a more favorable solution. Nevertheless, given the highly heterogeneous nature of metal contamination in soils, often metals extraction is difficult. A lack of economic viability is another important
CHALMERS, Civil and Environmental Engineering, Master’s Thesis 2014:07 12
factor. Such as well-established technique of physical separation may allow fast solution with immediate reduction in contaminated volume. However, this method is difficult to use for high clay or humic content soils (Mulligan, Yong and Gibbs, 2000). Phytoextraction is an in situ technique that uses plants to extract metals from the soil. By using this procedure, a large area can be treated without excavation. However, the process duration is long and limited by depth of the root zone and harvesting routine (Dermont, Bergeron and Mercier, 2008). Soil washing is an ex situ technique that uses an extracting aqueous agent such as acid, base or chelating agents to extract metal from soil. It allows to remove permanently metals from the soil’s matrix with a potential to recover it. However, soils with high humic and clay content are difficult to treat, while chemical leaching agent can be expensive and possess hazardous qualities (Dermont, Bergeron and Mercier, 2007; Abumaizar and Smith, 1999). Looking to address the above challenges, this project further explored and expanded the possibility to permanently remove metals from soil by using soil washing with acidic wastewater. Moreover, through using a waste product instead of expensive reagents the method aims to improve economic viability.
CHALMERS, Civil and Environmental Engineering, Master’s Thesis 2014:07 13
3 Studied sites
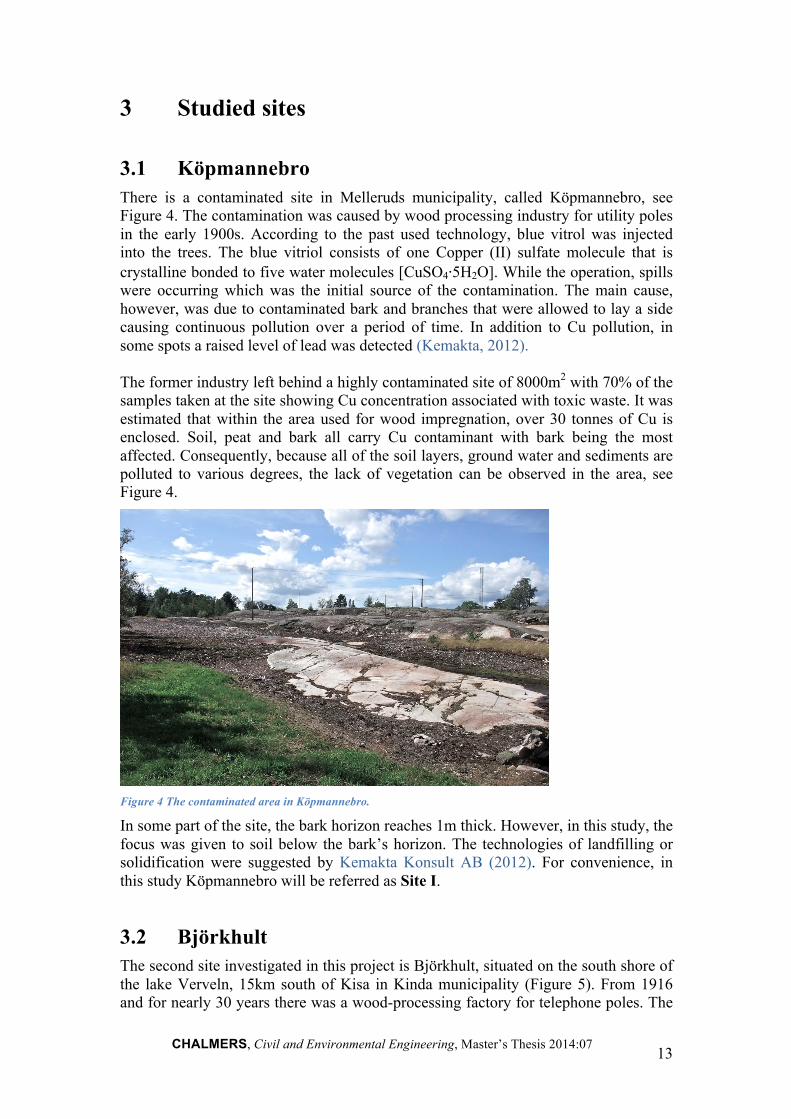
3.1 Köpmannebro There is a contaminated site in Melleruds municipality, called Köpmannebro, see Figure 4. The contamination was caused by wood processing industry for utility poles in the early 1900s. According to the past used technology, blue vitrol was injected into the trees. The blue vitriol consists of one Copper (II) sulfate molecule that is crystalline bonded to five water molecules [CuSO4⋅5H2O]. While the operation, spills were occurring which was the initial source of the contamination. The main cause, however, was due to contaminated bark and branches that were allowed to lay a side causing continuous pollution over a period of time. In addition to Cu pollution, in some spots a raised level of lead was detected (Kemakta, 2012). The former industry left behind a highly contaminated site of 8000m2 with 70% of the samples taken at the site showing Cu concentration associated with toxic waste. It was estimated that within the area used for wood impregnation, over 30 tonnes of Cu is enclosed. Soil, peat and bark all carry Cu contaminant with bark being the most affected. Consequently, because all of the soil layers, ground water and sediments are polluted to various degrees, the lack of vegetation can be observed in the area, see Figure 4.
Figure 4 The contaminated area in Köpmannebro.
In some part of the site, the bark horizon reaches 1m thick. However, in this study, the focus was given to soil below the bark’s horizon. The technologies of landfilling or solidification were suggested by Kemakta Konsult AB (2012). For convenience, in this study Köpmannebro will be referred as Site I.
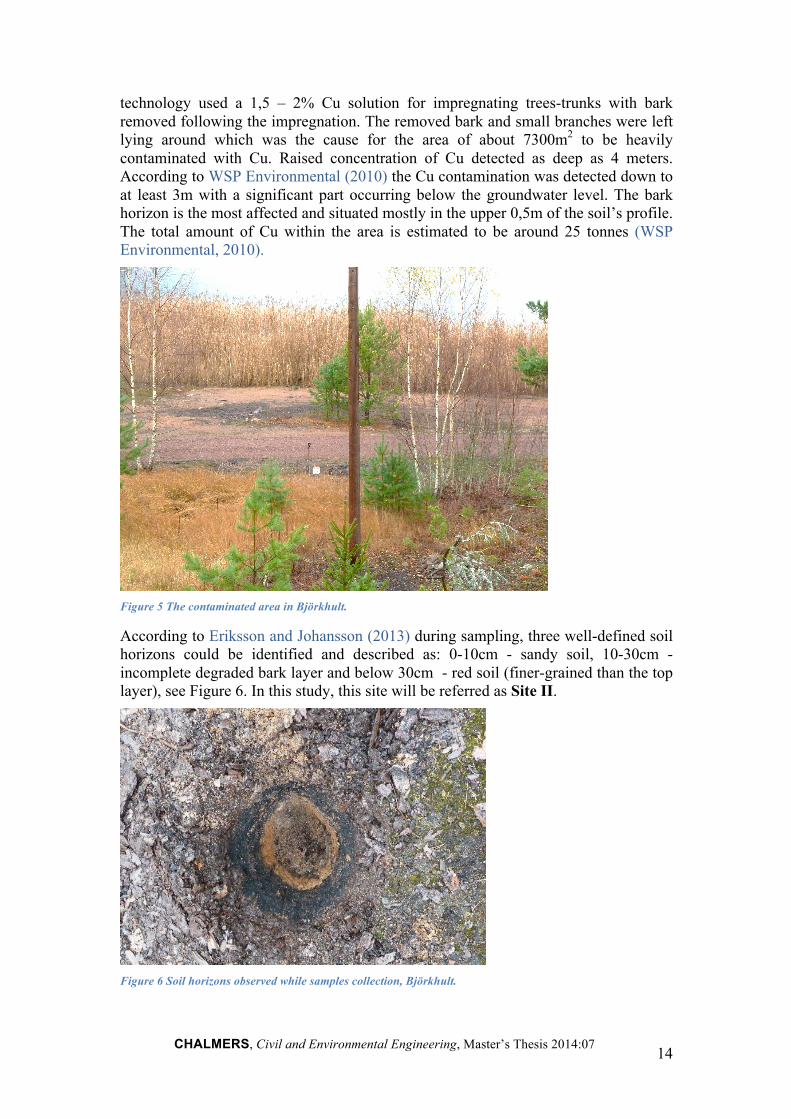
3.2 Björkhult The second site investigated in this project is Björkhult, situated on the south shore of the lake Verveln, 15km south of Kisa in Kinda municipality (Figure 5). From 1916 and for nearly 30 years there was a wood-processing factory for telephone poles. The
CHALMERS, Civil and Environmental Engineering, Master’s Thesis 2014:07 14
technology used a 1,5 – 2% Cu solution for impregnating trees-trunks with bark removed following the impregnation. The removed bark and small branches were left lying around which was the cause for the area of about 7300m2 to be heavily contaminated with Cu. Raised concentration of Cu detected as deep as 4 meters. According to WSP Environmental (2010) the Cu contamination was detected down to at least 3m with a significant part occurring below the groundwater level. The bark horizon is the most affected and situated mostly in the upper 0,5m of the soil’s profile. The total amount of Cu within the area is estimated to be around 25 tonnes (WSP Environmental, 2010).
Figure 5 The contaminated area in Björkhult.
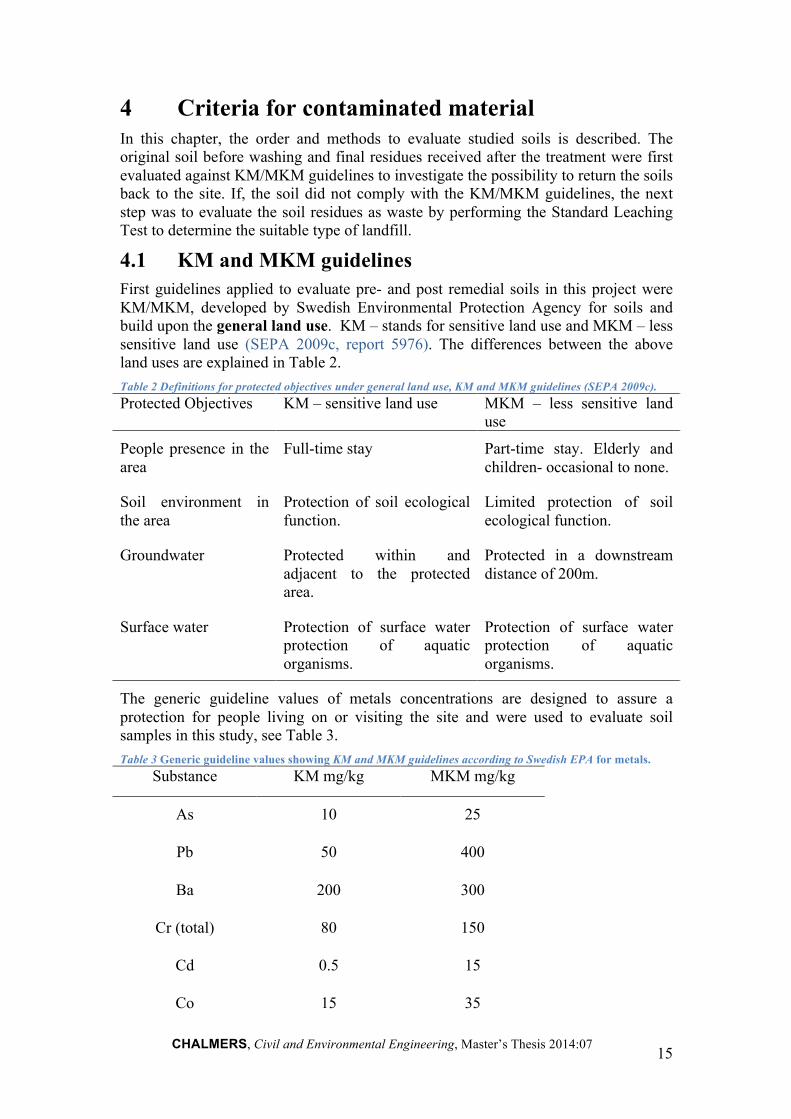
According to Eriksson and Johansson (2013) during sampling, three well-defined soil horizons could be identified and described as: 0-10cm - sandy soil, 10-30cm - incomplete degraded bark layer and below 30cm - red soil (finer-grained than the top layer), see Figure 6. In this study, this site will be referred as Site II.
Figure 6 Soil horizons observed while samples collection, Björkhult.
CHALMERS, Civil and Environmental Engineering, Master’s Thesis 2014:07 15
4 Criteria for contaminated material In this chapter, the order and methods to evaluate studied soils is described. The original soil before washing and final residues received after the treatment were first evaluated against KM/MKM guidelines to investigate the possibility to return the soils back to the site. If, the soil did not comply with the KM/MKM guidelines, the next step was to evaluate the soil residues as waste by performing the Standard Leaching Test to determine the suitable type of landfill.
4.1 KM and MKM guidelines First guidelines applied to evaluate pre- and post remedial soils in this project were KM/MKM, developed by Swedish Environmental Protection Agency for soils and build upon the general land use. KM – stands for sensitive land use and MKM – less sensitive land use (SEPA 2009c, report 5976). The differences between the above land uses are explained in Table 2. Table 2 Definitions for protected objectives under general land use, KM and MKM guidelines (SEPA 2009c). Protected Objectives KM – sensitive land use MKM – less sensitive land
use
People presence in the area
Full-time stay Part-time stay. Elderly and children- occasional to none.
Soil environment in the area
Protection of soil ecological function.
Limited protection of soil ecological function.
Groundwater Protected within and adjacent to the protected area.
Protected in a downstream distance of 200m.
Surface water Protection of surface water protection of aquatic organisms.
Protection of surface water protection of aquatic organisms.
The generic guideline values of metals concentrations are designed to assure a protection for people living on or visiting the site and were used to evaluate soil samples in this study, see Table 3. Table 3 Generic guideline values showing KM and MKM guidelines according to Swedish EPA for metals.
Substance KM mg/kg MKM mg/kg
As 10 25
Pb 50 400
Ba 200 300
Cr (total) 80 150
Cd 0.5 15
Co 15 35
CHALMERS, Civil and Environmental Engineering, Master’s Thesis 2014:07 16
Cu 80 200
Sb 12 30
Zn 250 500
Hg 0,25 2,5
Mo 40 100
Ni 40 120
V 100 200
Thus, the requirements to the soil quality according to the KM/MKM-guidelines depend on the soil applications, existed and likely activities on the particular site and the age groups of people that potentially will be exposed to contaminants.
4.2 Swedish Standard Leaching Test SS-EN-12457-3 Second stage in evaluating of the pre-and post remedial soils if they had concentrations of metals above the KM or MKM guidelines was to do a downscaled leaching test SS – EN 12457-3 (SIS, 2003). This stage treats soil as a waste and called waste characterisation. This is a compliance test applicable to use on a material that have at least 95% (mass) grain size less than 4mm. Appropriately, the soils from both sites were suitable to use.
This leaching test assessing the mechanism of release of soluble pollutants when granular waste material is in contact with water. This mechanism predicts the potential risk to the environment if the soil is re-used or disposed to a landfill. Thus, the purpose of this test is to predict stability of the soil.
The released soluble constituents were measured for metals concentrations and analysed. To interpret the results, the guidelines developed by SEPA were applied. According to SEPA report (NFS 2004:10), the waste can be classified as inert, non-hazardous and hazardous. For each of the classes the table is given with metals’ and organic materials’ limits stated. Based on the results, the soil can be given one of the three classes and determine whether it can be deposited in a landfill for non-hazardous waste.
CHALMERS, Civil and Environmental Engineering, Master’s Thesis 2014:07 17
5 Methods and Materials The project began with literature study, followed by laboratory work. The literature research was done to get an overview of the current remediation techniques of metal contaminated soils (MCS). The outcomes of the literature study were: determination of suitable values for variables used in the leaching experiments and the development of a plan for experimental part of the project. The laboratory part of the project commenced when the appropriate experimental data was collected and made into a final flow chart helping to navigate throughout the practical work.
5.1 Preparation Before the experimental part was commenced some additional preparation had to be made. The description of these steps is given below.
Sampling Soil samples from the two sites were collected in 2012 from the areas marked as Cu ‘hot spots’ in Köpmannebro (Site I) and Björkhult (Site II) (Kemakta, 2012 and Arnér, 2011). The soil was collected at specific depths by means of stainless steel shovels. The samples were then stored in PP-bottles at 4°C for around a year. Sample preparation In order to prepare a single representative sample for Site I and Site II, soils from several ‘hot spots’ were mixed together. For Site I, a mortar was used to break dry clay-like soil agglomerates but avoiding intensive grinding. The soil samples collected from depths between 50–80cm was mixed together with those collected deeper than 100cm to make mixed sample from Site I. For Site II, soils taken between 20–50cm and 40–60cm were mixed. The final mixture was screened and materials larger than 2cm removed. The samples were dried in an oven (Memmert U15) at 104°C, until their weights were constant. The first two hours of the drying procedure the samples from both sites were gently stirred several times to avoid formation of a solid cluster. After the samples were completely dried, they were cooled and stored in desiccators.
CHALMERS, Civil and Environmental Engineering, Master’s Thesis 2014:07 18
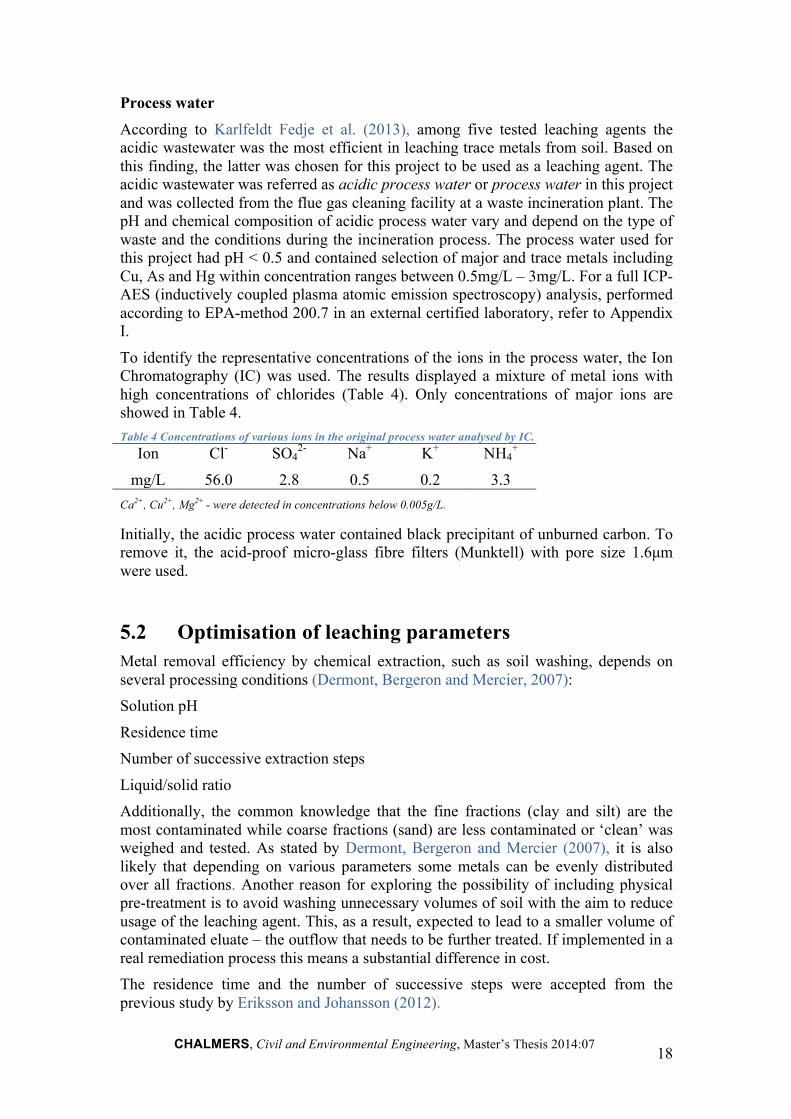
Process water According to Karlfeldt Fedje et al. (2013), among five tested leaching agents the acidic wastewater was the most efficient in leaching trace metals from soil. Based on this finding, the latter was chosen for this project to be used as a leaching agent. The acidic wastewater was referred as acidic process water or process water in this project and was collected from the flue gas cleaning facility at a waste incineration plant. The pH and chemical composition of acidic process water vary and depend on the type of waste and the conditions during the incineration process. The process water used for this project had pH < 0.5 and contained selection of major and trace metals including Cu, As and Hg within concentration ranges between 0.5mg/L – 3mg/L. For a full ICP-AES (inductively coupled plasma atomic emission spectroscopy) analysis, performed according to EPA-method 200.7 in an external certified laboratory, refer to Appendix I.
To identify the representative concentrations of the ions in the process water, the Ion Chromatography (IC) was used. The results displayed a mixture of metal ions with high concentrations of chlorides (Table 4). Only concentrations of major ions are showed in Table 4. Table 4 Concentrations of various ions in the original process water analysed by IC.
Ion Cl- SO42- Na+ K+ NH4
+
mg/L 56.0 2.8 0.5 0.2 3.3 Ca2+, Cu2+, Mg2+ - were detected in concentrations below 0.005g/L.
Initially, the acidic process water contained black precipitant of unburned carbon. To remove it, the acid-proof micro-glass fibre filters (Munktell) with pore size 1.6µm were used.
5.2 Optimisation of leaching parameters Metal removal efficiency by chemical extraction, such as soil washing, depends on several processing conditions (Dermont, Bergeron and Mercier, 2007): Solution pH
Residence time Number of successive extraction steps
Liquid/solid ratio Additionally, the common knowledge that the fine fractions (clay and silt) are the most contaminated while coarse fractions (sand) are less contaminated or ‘clean’ was weighed and tested. As stated by Dermont, Bergeron and Mercier (2007), it is also likely that depending on various parameters some metals can be evenly distributed over all fractions. Another reason for exploring the possibility of including physical pre-treatment is to avoid washing unnecessary volumes of soil with the aim to reduce usage of the leaching agent. This, as a result, expected to lead to a smaller volume of contaminated eluate – the outflow that needs to be further treated. If implemented in a real remediation process this means a substantial difference in cost. The residence time and the number of successive steps were accepted from the previous study by Eriksson and Johansson (2012).
CHALMERS, Civil and Environmental Engineering, Master’s Thesis 2014:07 19
According to the Dermont, Bergeron and Mercier (2007), removal efficiency depends on the metal type and the valence of the element that is aimed to be extracted. Copper is cationic metal so its extractability increases when the solution pH decreases. Indeed, as stated by Karlfeldt Fedje et al. (2013) that pH value has to be lower than 2 to achieve an effective leaching. This means that the existed acidic process water was satisfying this criterion and didn’t need to be optimised. Nevertheless, to reduce the negative affect of the process water on the soil structure and with a consideration of its limited yearly produced a dilution optimization was considered. Another factor that was optimized prior commencing the leaching experiments was liquid to solid ratio (L/S). According to the previous study by Eriksson and Johansson (2012) the optimum L/S ratio was found to be 10; the L/S ratios tested at the time were 2, 5 and 10. The purpose of this optimisation step was to find out whether 5 >L/S < 10 can be more effective or at least as effective. The aim was to find L/S-value that is as low as possible, ensuring the economical viability if implemented on a larger scale.
To ensure that the micro-glass fibre filters (Munktell) do not increase or decrease the release of any metals, a quality assurance test was done. Two eluates produced from leaching of soil from Site I were filtered through the usual fibreglass filter and through cellulose acetate filter by Sartorius Stedium (pore size 0.45µm). Both filtered eluates were analysed separately for metals concentrations by an external laboratory. The results showed that concentration of Ba was the only one that differed considerably. It was 1.5 times higher in the eluates filtered with the micro-glass fibre filter than when the cellulose filter was used, see Appendix III. This fact was taken into account when results were analysed. Process water optimisation Fixed parameters used:
• L/S = 10 • One sample per tested dilution ratio of the process water
Four different solutions were prepared with different dilution ratios of process water/Milli-Q: original process water, 75/25, 50/50 and 35/65. The soil samples from Site I were leached with the four leaching agents. The details about the leaching procedure are found in Figure 7. For each of the four leachates, separate eluates were collected and Cu concentration analysed by a semi-quantitative method HACH (Chapter 5.5). In addition, the pH was measured. The tested solution (process water/Milli-Q) that corresponded to an eluate with the highest concentration of Cu was taken as the optimum dilution (optimum process water) and used in all further experiments. The soil from Site II was not included in this part of the experiment.
Physical pre-treatment Fixed parameters used:
• L/S= 10 • Optimum process water • One sample per tested size fraction
To determine fraction distribution in soil samples from each site a sieve was used prior the leaching. The sieve comprised of 5 parts with mesh sizes from <0.125 mm to ≥1 mm.
CHALMERS, Civil and Environmental Engineering, Master’s Thesis 2014:07 20
For both sites the sieve was used in the same manner except that the soil sample from Site I had to be mortared gently to break agglomerated clay particles prior the sieving. The sieve with a soil sample was shaken for 2 minutes and then allowed to stand for a minute before opening. This was done to ensure that smaller fractions were settled. The fraction size distribution (w-%) was calculated for the each site.
To find out what fractions of the studied soils are the most contaminated, each soil fraction was leached separately and handled according to the schematics in Figure 7.
The eluates produced after the leaching procedure were analysed for Cu concentration by semi-quantitative HACH method. Then, Cu concentration in the original samples, of each fraction size was estimated based on the efficiency of 90% and depending on the Cu concentration measured in the corresponding eluates. The assumption of the 90% leaching efficiency was made based on the early studies by Karlfeldt Fedje et al. (2013). The latter showed that the acidic process water could leach ≥ 90% of Cu. To receive more accurate data some eluates were also analysed by ICP-AES. Liquid to solid ratio Fixed parameters used:
• Optimum process water • Site I – not sieved, Site II – sieved • Triplicates per tested L/S-value
Three L/S values were tested: 8, 9 and 10. To find the optimum L/S (L/Sopt), triplicates were leached for each L/S-value to acquire a reliable data. The soil samples from both sites were leached according to Figure 7. The semi-quantitative HACH method was used for the chemical analysis of Cu concentration in all eluates. The L/S-value that leached a highest concentration of Cu was taken as the L/Sopt and used in final batch leaching procedure.
Leaching procedure for optimisation part To perform the optimisation part the following leaching procedure was used:
Pre-mixed and dried soil samples from both sites of 4g was placed in 50 ml PP-bottles and marked. The optimum process water was added to reach a specific L/S. The samples were leached for 30min on shaking table Julabo SW-20C with 140rpm. Immediately after the shaking table, a centrifuge Sigma 4-16 was used to separate the liquid from the solid part at 3000G for 15minutes. After the centrifugation was complete, the liquid part was decanted.
The residence time and settings for defining the intensity of shaking on the reciprocal table were taken from the previous studies by Eriksson and Johansson (2013) and Karlfeldt Fedje et al. (2013). The solid part was discarded at this stage of the experiment, focusing on the supernatant. The liquids were filtered with the acid-proof micro-glass fibre filters (Munktell), followed by the analysis with HACH or storing in
CHALMERS, Civil and Environmental Engineering, Master’s Thesis 2014:07 21
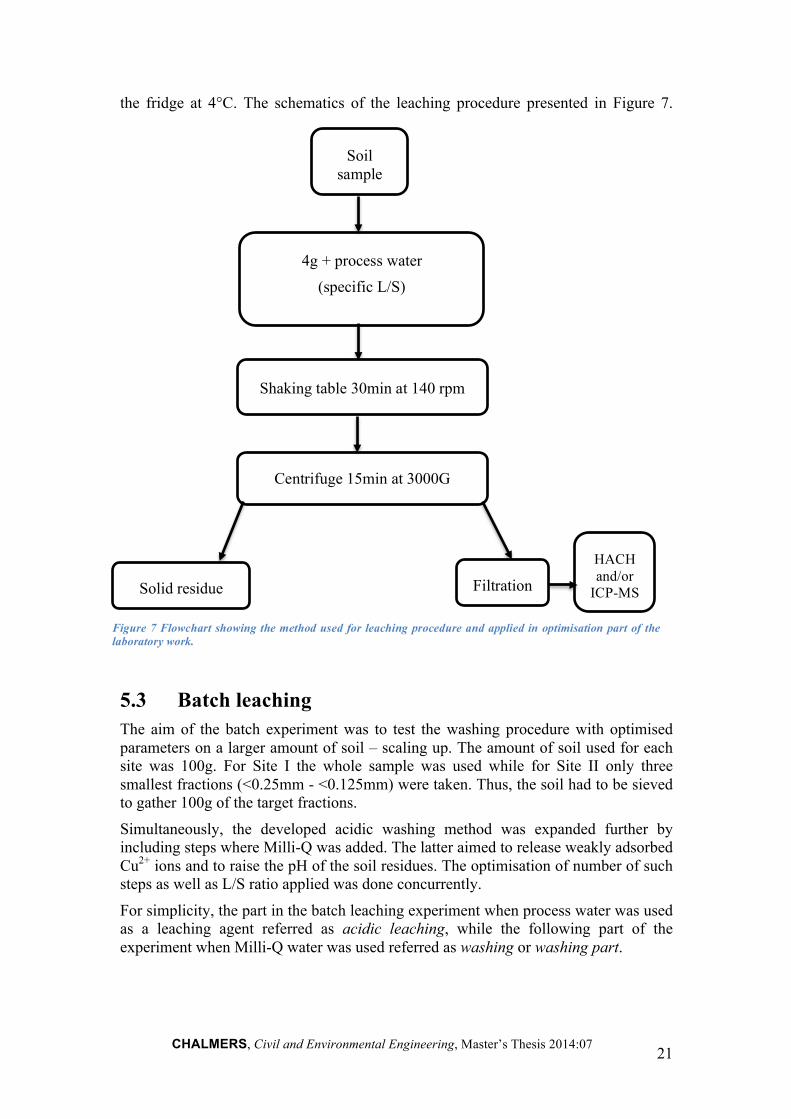
the fridge at 4°C. The schematics of the leaching procedure presented in Figure 7.
5.3 Batch leaching The aim of the batch experiment was to test the washing procedure with optimised parameters on a larger amount of soil – scaling up. The amount of soil used for each site was 100g. For Site I the whole sample was used while for Site II only three smallest fractions (<0.25mm - <0.125mm) were taken. Thus, the soil had to be sieved to gather 100g of the target fractions.
Simultaneously, the developed acidic washing method was expanded further by including steps where Milli-Q was added. The latter aimed to release weakly adsorbed Cu2+ ions and to raise the pH of the soil residues. The optimisation of number of such steps as well as L/S ratio applied was done concurrently.
For simplicity, the part in the batch leaching experiment when process water was used as a leaching agent referred as acidic leaching, while the following part of the experiment when Milli-Q water was used referred as washing or washing part.
Soil sample
4g + process water (specific L/S)
Shaking table 30min at 140 rpm
Centrifuge 15min at 3000G
Solid residue Filtration
HACH and/or
ICP-MS
Figure 7 Flowchart showing the method used for leaching procedure and applied in optimisation part of the laboratory work.
CHALMERS, Civil and Environmental Engineering, Master’s Thesis 2014:07 22
Acidic leaching
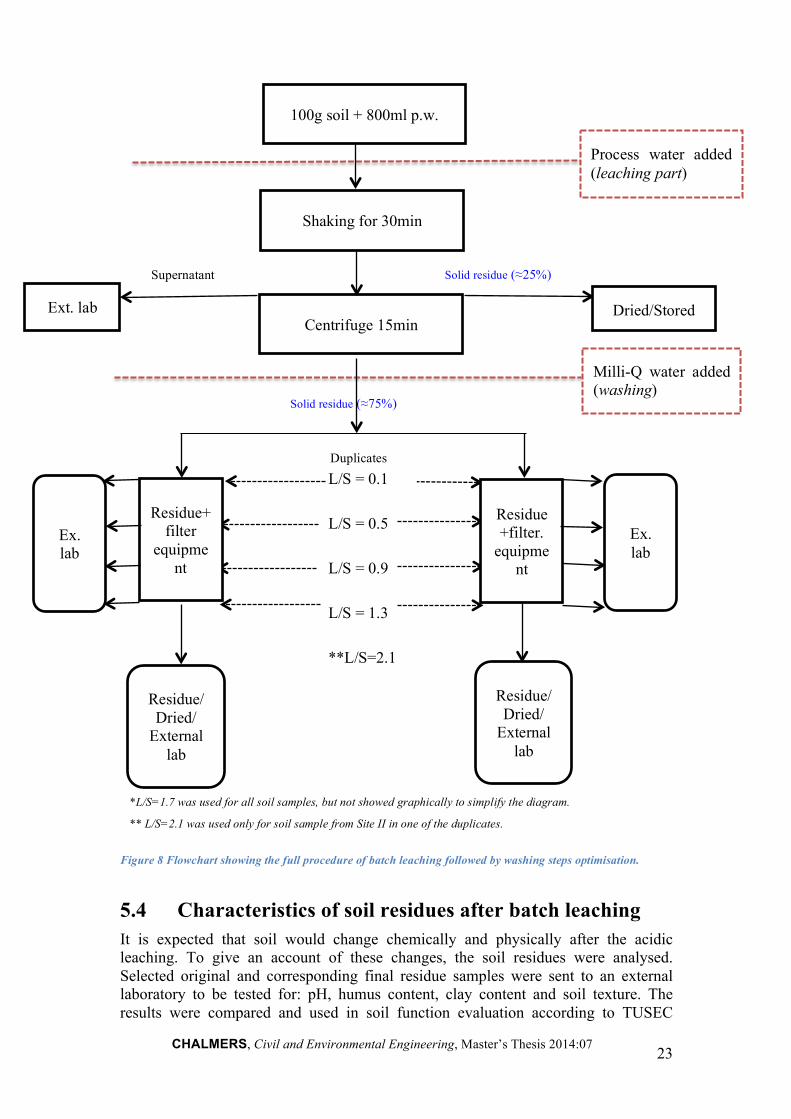
The dried soil sample of 100g was separated into two equal parts and placed in two 500ml PP-bottles. To each sample the optimum process water was added with the L/Sopt(L/S = 8). Further, the samples were treated according to the same method as described in Figure 8. The solid residues received after the centrifuging were separated into two parts (≈75/25%). The smaller part was dried in the oven (Memmert U15 at 80°C) and stored in a desiccator until further analysis. The larger part was further divided into two equal parts that were simultaneously used in the washing experiment that followed directly after the acidic leaching.
Washing The optimisation of L/S ratio and the optimum number of washing steps was performed in duplicates. The experiment was done on the same day when duplicates were formed from freshly centrifuged solid part (≈75%) that was left after the acidic leaching. With a pipette, Milli-Q was added sequentially to each of the duplicates placed into the plastic holder on a filtering apparatus. Each step had a specific L/S ratio. The L/S values were estimated based on a centrifuge-dry soil; the weight change was traced through the each stage of the experiment. After adding each water portion to the residue, it was left to stand for 2 min before starting a vacuum filtration. This was done to allow the Milli-Q water to flow freely through the larger pores within the soil matrix before forcing it downwards by the vacuum suction. For each L/S-value added, an eluate was collected separately. The values of L/S that were used in the laboratory work are given in Figure 8. In addition, one of the duplicates in the soil residue from Site II was tested for L/S=2.1. The residues that were left after completing of all sequential washing steps were collected and dried in the oven (Memmert U15) at 80°C until their weight was stabilized. The dry residues were stored in desiccators until further analyses. The full procedure of batch experiment is shown in Figure 8.
CHALMERS, Civil and Environmental Engineering, Master’s Thesis 2014:07 23
5.4 Characteristics of soil residues after batch leaching It is expected that soil would change chemically and physically after the acidic leaching. To give an account of these changes, the soil residues were analysed. Selected original and corresponding final residue samples were sent to an external laboratory to be tested for: pH, humus content, clay content and soil texture. The results were compared and used in soil function evaluation according to TUSEC
Milli-Q water added (washing)
100g soil + 800ml p.w.
Shaking for 30min
Centrifuge 15min Ext. lab
Supernatant
Solid residue (≈75%)
L/S = 0.1
L/S = 0.5
L/S = 0.9
L/S = 1.3
**L/S=2.1
Ex. lab
Residue+filter.
equipment
Duplicates
Residue+filter
equipment
Ex. lab
Residue/Dried/
External lab
Residue/Dried/
External lab
Process water added (leaching part)
Solid residue (≈25%)
Dried/Stored
Figure 8 Flowchart showing the full procedure of batch leaching followed by washing steps optimisation.
*L/S=1.7 was used for all soil samples, but not showed graphically to simplify the diagram.
** L/S=2.1 was used only for soil sample from Site II in one of the duplicates.
CHALMERS, Civil and Environmental Engineering, Master’s Thesis 2014:07 24
manual. In addition, scanning electron microscope (SEM) was used to get supplementary information about internal particle structures and solid phase speciation of metals in the soil matrix.
Soil as Filter and Buffer for Heavy Metals The Institute of Soil Science and Land Evaluation developed TUSEC manual - a tool for schematic assessment of natural and anthropogenic soils (Lehmann, David and Stahr, 2009). The manual enables soil evaluation and categorization independently of specific pedological methodologies. With help of this methodology a wide selection of soil functions can be evaluated as well as individual soil performances.
According to Senate Department for Urban Development and the Environment (2009), buffering function expresses soils ability to impede movement of toxic metals in the ecosystemic material flow. The soils ability to eliminate them completely from this cycle describes by soil’s filtration function.
To answer the question: how efficient is the studied soil in buffering and filtering of toxic metals, it was chosen to assess it’s following soil function:
Soil as Filter and Buffer for Heavy Metals (STOFIT3’B) This evaluation performed on original soil samples and final soil residues and allowed to rate the soils as follows: “very low” – 5, “low” – 4, “intermediate” – 3, “high” – 2, “very high” – 1.
The TUSEC manual offers two procedures: A-procedure (not chosen) - demands for high quality of available data of every single horizon; B-procedure (chosen) - based on soil data that does not take into account every individual soil horizon (Lehmann, David and Stahr, 2009). Moreover, because B-procedure does not require a standardized data collection, it is easier to apply it due to time constrictions. The results of B-Procedure should be used for orientating evaluation.
The following input parameters for both sites were used: 1. Clay content 2. Humus content 3. pH-value 4. Information on average groundwater level
The procedure described in TUSEC manual is in step-order. The information regarding groundwater level was taken from Kemakta and WSP Environmental reports for the Site I and II respectively (Kemakta, 2012 and WSP Environmental, 2010). As a result, a score of 1 to 5 was received.
pH measurement of soil samples In this study, the method for measuring pH in the laboratory was done according to ISO 10390: 1994 (Bergil and Bydén, 1995) using a WTW pH-electrode SenTix 41-3 with a WTW Multi 35i.
The external pH analysis of the original and post-remedial soil samples were done according to the SS – ISO 10 390 method with uncertainty of < 0.4% (for selected samples). These results were compared to the internal laboratory readings (quality control) and the average of two analyses was given as the final answer.
CHALMERS, Civil and Environmental Engineering, Master’s Thesis 2014:07 25
Humus content The soil was pre-treated for analyses in agreement with SS – ISO 11 464 standard, ed.1 regulations. The humus content was analysed according to KLK 1965:1 with uncertainty <5%. The received results were used as one of the input parameters in the evaluation of the soil function as Filter and Buffer for Heavy Metals as well as in determination of a soil type. Clay content Clay content analysis detects the weight % of clay minerals, formed by weathering of the silicate minerals from rock. The clay content was measured according to SS – ISO 11277:2009 standard with uncertainty <10%. The results were used to disclose soil texture and served as one of the input parameters in evaluating soil function as Filter and Buffer for Heavy Metals. Soil texture The soil texture was evaluated as stated in SS - ISO 11277:2009 standard with uncertainty of <10% by an external laboratory based on samples of 60g taken from each site. A joint name was given to each of the studied soil, based on the amount (%) of the humus and its soil texture, see Table 14.
SEM - Scanning Electron Microscope Scanning electron microscope coupled with energy dispersive x-ray EDX was used to produce magnified images of the soil samples. The visual assessment was done to compare the external morphology and orientation of granules making up the sample (Geochemical Instrumentation and Analysis, 2013). The following samples were assessed:
Site I - original soil and final residues after full washing procedure. Site II - original sieved soil and final residues.
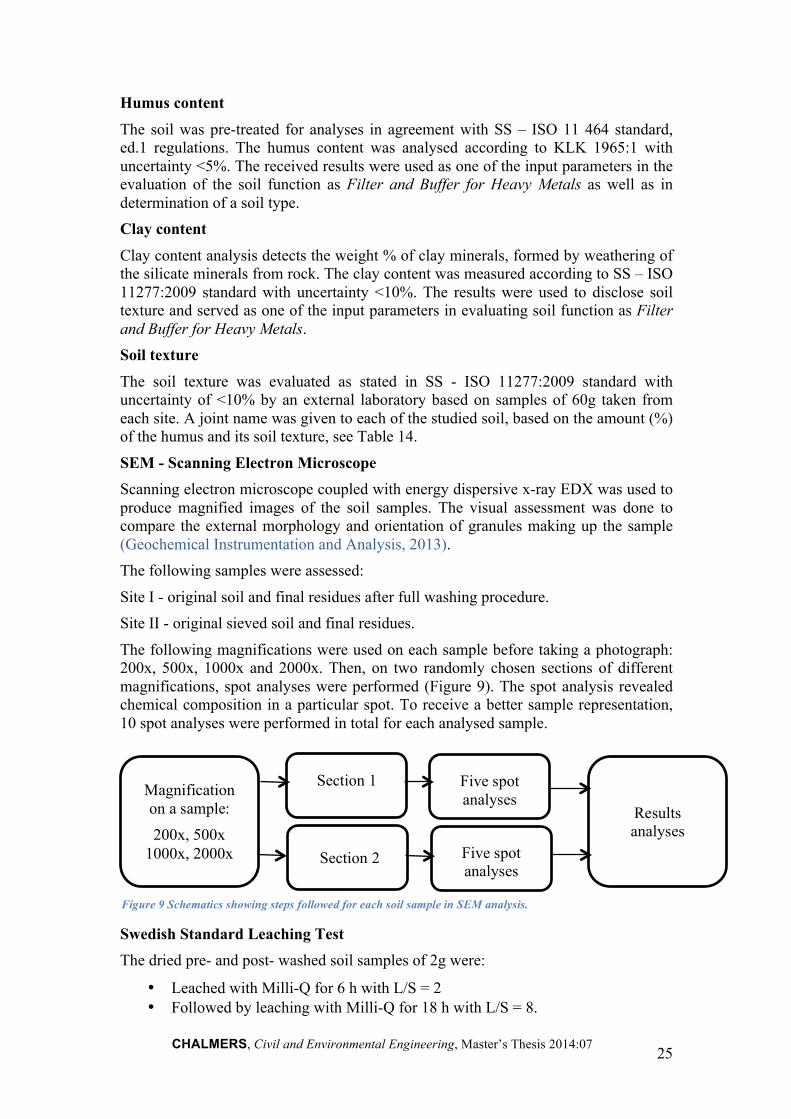
The following magnifications were used on each sample before taking a photograph: 200x, 500x, 1000x and 2000x. Then, on two randomly chosen sections of different magnifications, spot analyses were performed (Figure 9). The spot analysis revealed chemical composition in a particular spot. To receive a better sample representation, 10 spot analyses were performed in total for each analysed sample.
Swedish Standard Leaching Test The dried pre- and post- washed soil samples of 2g were:
• Leached with Milli-Q for 6 h with L/S = 2 • Followed by leaching with Milli-Q for 18 h with L/S = 8.
Magnification on a sample: 200x, 500x
1000x, 2000x
Section 1
Five spot analyses
Section 2 Five spot analyses
Results analyses
Figure 9 Schematics showing steps followed for each soil sample in SEM analysis.
CHALMERS, Civil and Environmental Engineering, Master’s Thesis 2014:07 26
The standard leaching procedure and equipment were used, see Figure 7. Each sample’s liquid part was decanted, its volume measured and filtered. The resulted four eluates were marked and stored at 4°C awaiting analysis with ICP-AES.
The following substances were not analysed and therefore excluded from evaluation at this stage: Hg, Se, Sb and Cl. The organic pollutants were not studied in this project but they are present in the NFS 2004:10 as criteria for waste evaluation.
5.5 Analytical Methods HACH The HACH is a photometric instrument designed to test the quality of water or liquid solutions. In this study it was used to receive quick internal measurements on Cu concentration. However, the detected Cu amounts should be seen as semi-quantitative rather than exact values. Consequently, HACH results were used for comparing between samples in order to determine trends.
The standard HACH Method 8506 was applied. Furthermore, the Bicinchoninate methodology was chosen (HACH manual, 2009). Before analysis the following adjustments had to be performed for most eluates:
• Dilution, since all elutes were extremely concentrated with Cu • pH adjustment between 4-6 by adding pH 8M KOH.
External analyses To receive quantitative data, selected solid and liquid samples were sent to external certified laboratories. Their services were used to measure metals concentration in eluates, process water, original soil samples and final soil residues. Prior to the analysis, all eluates were filtered. If a sample had pH above 2, it was acidified by using 1% HNO3 in proportion 1ml HNO3 to 100 ml of a sample (concentrated HNO3). Some of the samples were diluted as well.
All liquid samples were analysed using ICP-AES according to EPA methods 200.7. To analyse Hg and Se the ICP-AFS were used, according to method SS-EN ISO 17852. While, Sb was analysed by ICP-SFMS instrument according to US EPA 200.8 method.
Analyses of solid samples were done according to EPA methods: (modified) 200.7 with ICP-AES instrument and 200.8 with ICP-SFMS instrument. To analyse As, Cd, Cu, Co, Hg, Ni, Pb, W, Sb, S, Se and Zn the samples were dried at 50 ° C and the element concentrations were TS-corrected to 105 ° C. Microwave-assisted digestion was used with 5 ml of concentrated nitric acid and 0.5ml H2O2. For Sn, digestion with reverse Aqua Regia was used. For other elements the following method steps were used: 0.1g dried sample was melted with 0.4g lithium metaborate (LiBO2) and subsequently dissolved in dilute nitric acid (HNO3).
To test the sample with the ICP-MS instrument it was first converted into an aerosol and injected into the OCP-torch where the sample evaporated. Through collision with electrons the sample atomized and ionized. The analysis detected the atom ions based on their M/Z-ratio (Thomas, 2004).
The original soil samples and final soil residues that were left after the fully optimised batch experiment were tested for pH, soil texture, humus and clay contents in a
CHALMERS, Civil and Environmental Engineering, Master’s Thesis 2014:07 27
specialised certified laboratory. The pre-treatment of the soil samples for physical and chemical analysis was done according to SS-ISO 11464 ed. 1. To analyse particle size distribution as well as clay content the SS-ISO 11277:2009 standard was applied with detection uncertainty of <10%. To analyse humus content the KLK 1965:1 standard was applied with <5% uncertainty.
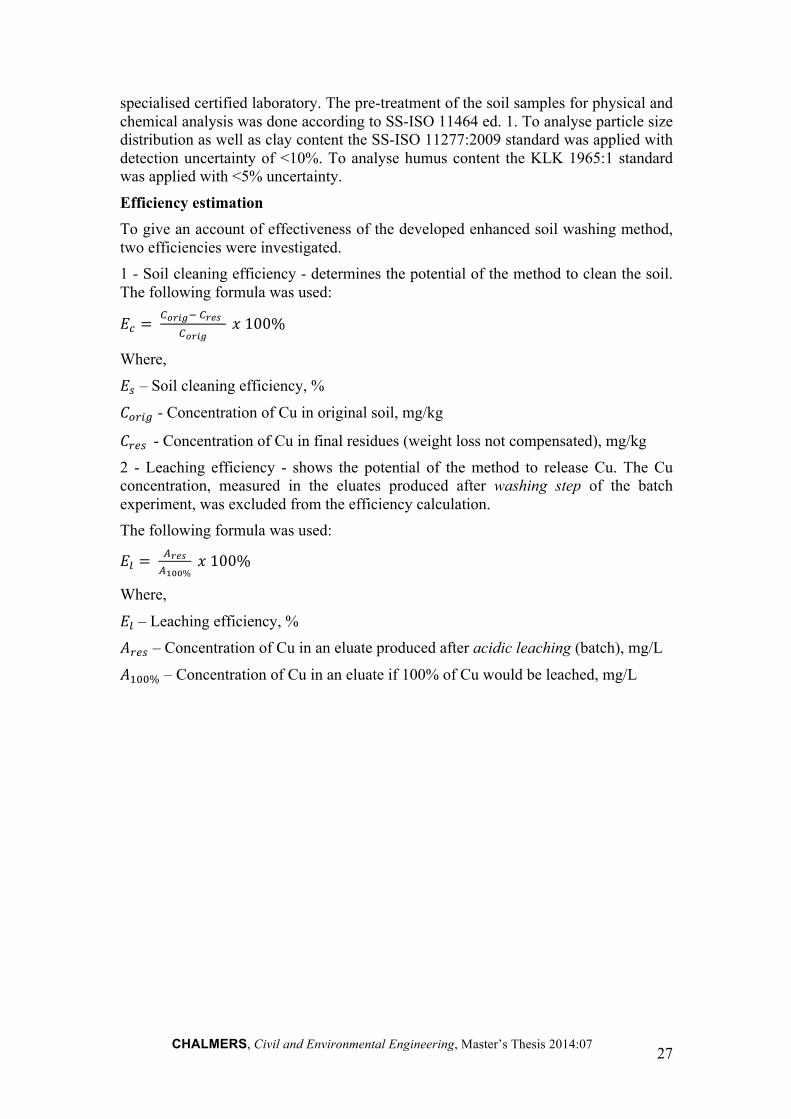
Efficiency estimation To give an account of effectiveness of the developed enhanced soil washing method, two efficiencies were investigated. 1 - Soil cleaning efficiency - determines the potential of the method to clean the soil. The following formula was used:
!! = !!"#$! !!"#
!!"#$ ! 100%
Where,
!! – Soil cleaning efficiency, %
!!"#$ - Concentration of Cu in original soil, mg/kg
!!"# - Concentration of Cu in final residues (weight loss not compensated), mg/kg
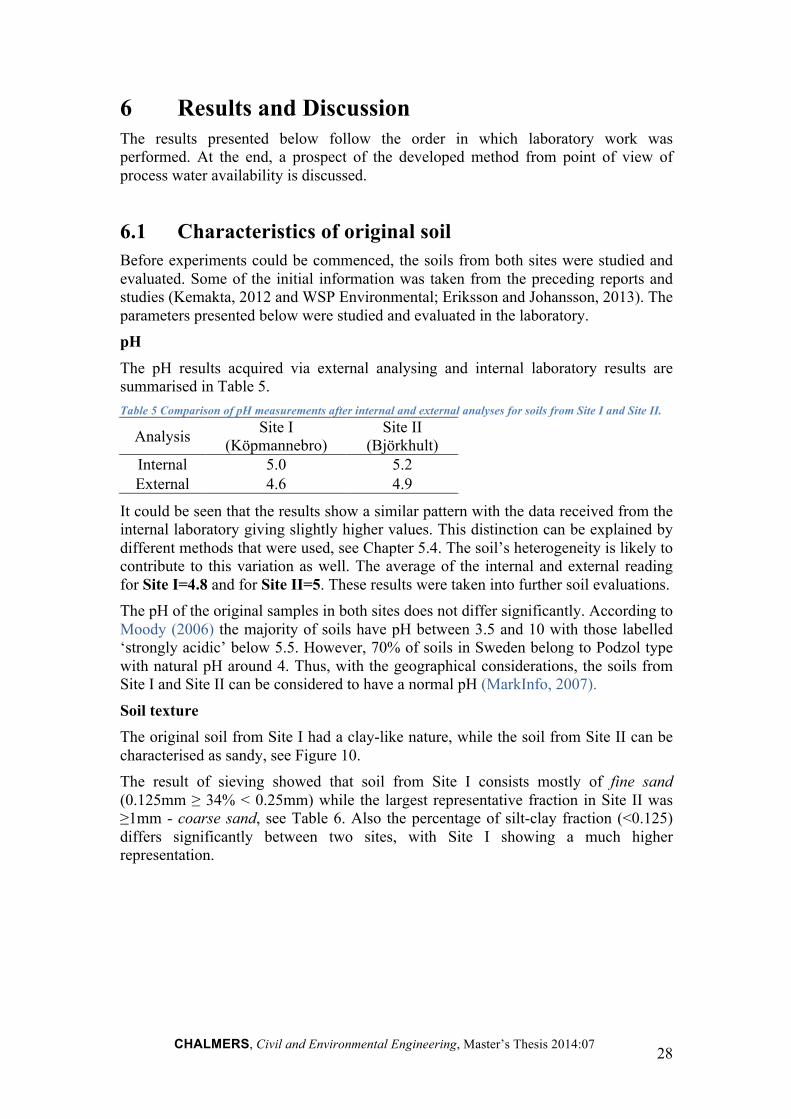
2 - Leaching efficiency - shows the potential of the method to release Cu. The Cu concentration, measured in the eluates produced after washing step of the batch experiment, was excluded from the efficiency calculation. The following formula was used:
!! = !!"#!!""%
! 100%
Where,
!! – Leaching efficiency, %
!!"# – Concentration of Cu in an eluate produced after acidic leaching (batch), mg/L
!!""% – Concentration of Cu in an eluate if 100% of Cu would be leached, mg/L
CHALMERS, Civil and Environmental Engineering, Master’s Thesis 2014:07 28
6 Results and Discussion The results presented below follow the order in which laboratory work was performed. At the end, a prospect of the developed method from point of view of process water availability is discussed.
6.1 Characteristics of original soil Before experiments could be commenced, the soils from both sites were studied and evaluated. Some of the initial information was taken from the preceding reports and studies (Kemakta, 2012 and WSP Environmental; Eriksson and Johansson, 2013). The parameters presented below were studied and evaluated in the laboratory. pH The pH results acquired via external analysing and internal laboratory results are summarised in Table 5. Table 5 Comparison of pH measurements after internal and external analyses for soils from Site I and Site II.
Analysis Site I (Köpmannebro)
Site II (Björkhult)
Internal 5.0 5.2 External 4.6 4.9
It could be seen that the results show a similar pattern with the data received from the internal laboratory giving slightly higher values. This distinction can be explained by different methods that were used, see Chapter 5.4. The soil’s heterogeneity is likely to contribute to this variation as well. The average of the internal and external reading for Site I=4.8 and for Site II=5. These results were taken into further soil evaluations. The pH of the original samples in both sites does not differ significantly. According to Moody (2006) the majority of soils have pH between 3.5 and 10 with those labelled ‘strongly acidic’ below 5.5. However, 70% of soils in Sweden belong to Podzol type with natural pH around 4. Thus, with the geographical considerations, the soils from Site I and Site II can be considered to have a normal pH (MarkInfo, 2007).
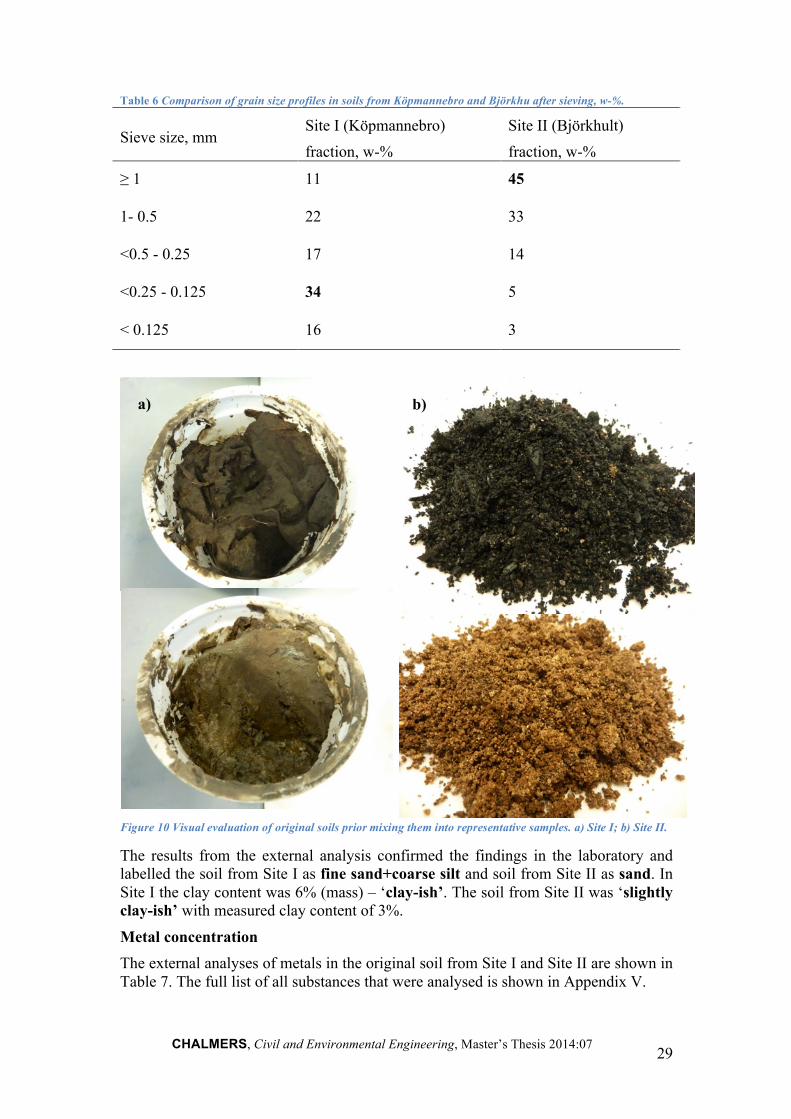
Soil texture The original soil from Site I had a clay-like nature, while the soil from Site II can be characterised as sandy, see Figure 10. The result of sieving showed that soil from Site I consists mostly of fine sand (0.125mm ≥ 34% < 0.25mm) while the largest representative fraction in Site II was ≥1mm - coarse sand, see Table 6. Also the percentage of silt-clay fraction (<0.125) differs significantly between two sites, with Site I showing a much higher representation.
CHALMERS, Civil and Environmental Engineering, Master’s Thesis 2014:07 29
Table 6 Comparison of grain size profiles in soils from Köpmannebro and Björkhu after sieving, w-%.
Sieve size, mm Site I (Köpmannebro) fraction, w-%
Site II (Björkhult) fraction, w-%
≥ 1 11 45
1- 0.5 22 33
<0.5 - 0.25 17 14
<0.25 - 0.125 34 5
< 0.125 16 3
The results from the external analysis confirmed the findings in the laboratory and labelled the soil from Site I as fine sand+coarse silt and soil from Site II as sand. In Site I the clay content was 6% (mass) – ‘clay-ish’. The soil from Site II was ‘slightly clay-ish’ with measured clay content of 3%.
Metal concentration The external analyses of metals in the original soil from Site I and Site II are shown in Table 7. The full list of all substances that were analysed is shown in Appendix V.
a) b)
Figure 10 Visual evaluation of original soils prior mixing them into representative samples. a) Site I; b) Site II.
CHALMERS, Civil and Environmental Engineering, Master’s Thesis 2014:07 30
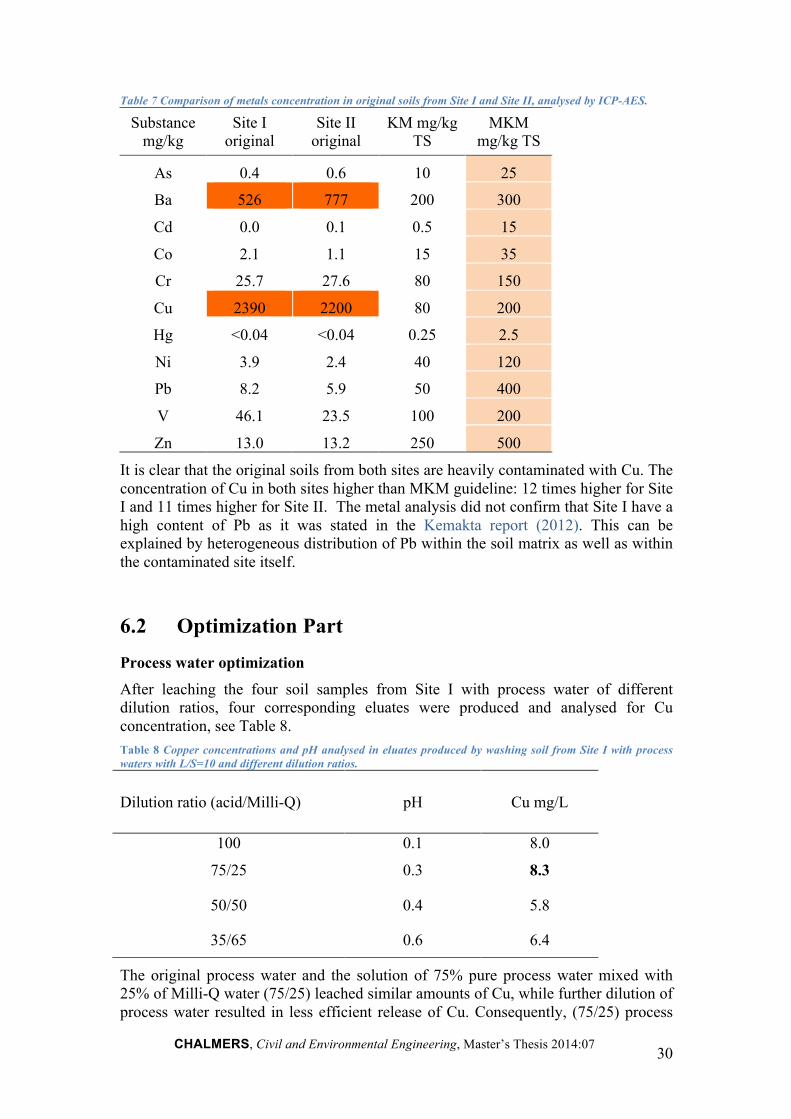
Table 7 Comparison of metals concentration in original soils from Site I and Site II, analysed by ICP-AES.
Substance mg/kg
Site I original
Site II original
KM mg/kg TS
MKM mg/kg TS
As 0.4 0.6 10 25
Ba 526 777 200 300
Cd 0.0 0.1 0.5 15
Co 2.1 1.1 15 35
Cr 25.7 27.6 80 150
Cu 2390 2200 80 200
Hg <0.04 <0.04 0.25 2.5
Ni 3.9 2.4 40 120
Pb 8.2 5.9 50 400
V 46.1 23.5 100 200
Zn 13.0 13.2 250 500
It is clear that the original soils from both sites are heavily contaminated with Cu. The concentration of Cu in both sites higher than MKM guideline: 12 times higher for Site I and 11 times higher for Site II. The metal analysis did not confirm that Site I have a high content of Pb as it was stated in the Kemakta report (2012). This can be explained by heterogeneous distribution of Pb within the soil matrix as well as within the contaminated site itself.
6.2 Optimization Part
Process water optimization After leaching the four soil samples from Site I with process water of different dilution ratios, four corresponding eluates were produced and analysed for Cu concentration, see Table 8. Table 8 Copper concentrations and pH analysed in eluates produced by washing soil from Site I with process waters with L/S=10 and different dilution ratios.
Dilution ratio (acid/Milli-Q) pH Cu mg/L
100 0.1 8.0
75/25 0.3 8.3
50/50 0.4 5.8
35/65 0.6 6.4
The original process water and the solution of 75% pure process water mixed with 25% of Milli-Q water (75/25) leached similar amounts of Cu, while further dilution of process water resulted in less efficient release of Cu. Consequently, (75/25) process
CHALMERS, Civil and Environmental Engineering, Master’s Thesis 2014:07 31
water was used in all further experiments. By using less concentrated process water, two positive outcomes can be expected:
• Lower negative effect on the soil matrix • Less process water can wash more soil
For future experiments it is desirable to repeat the above optimization of process water in triplicates to ensure more reliable results. Moreover, because chemical composition of process water varies significantly it is advisable to do the dilution optimization for every new process water taken from the industry with intention to be used as a leaching agent. Sieving optimisation To evaluate suitability of physical separation as pre-treatment method the soils from both sites were sieved. The results showing particle size distribution, correlated to Cu leachability in soils from both sites are presented in Table 9.
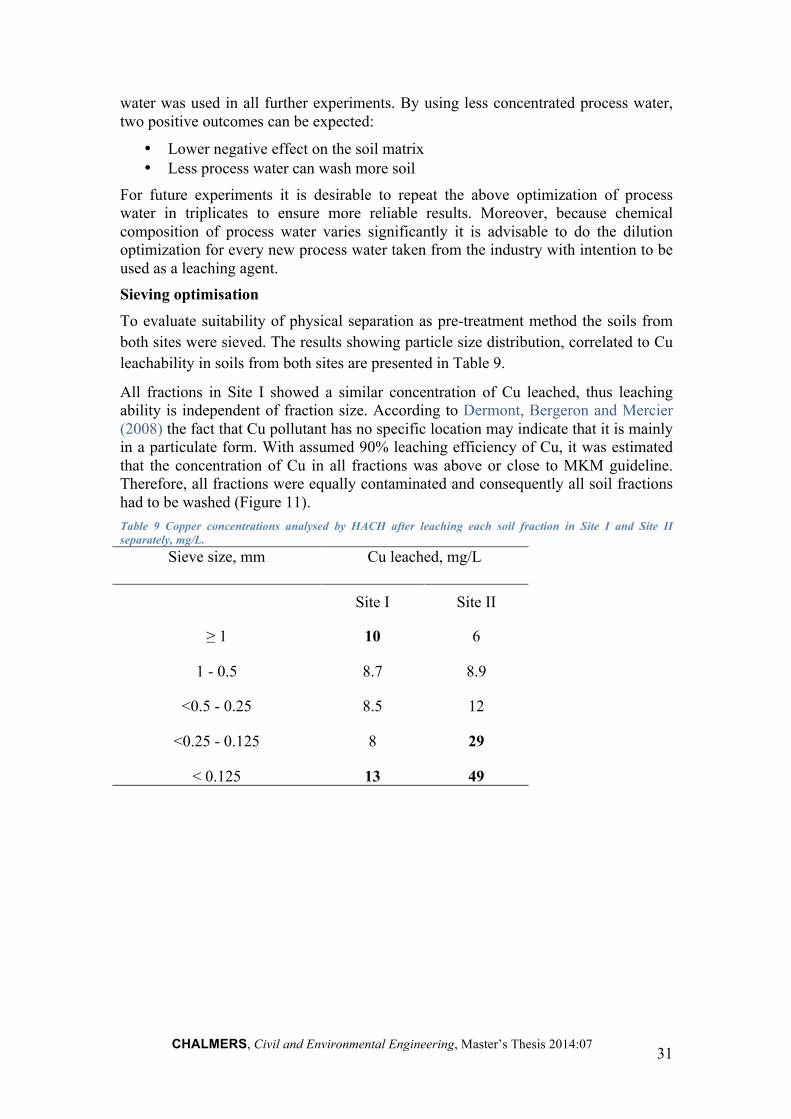
All fractions in Site I showed a similar concentration of Cu leached, thus leaching ability is independent of fraction size. According to Dermont, Bergeron and Mercier (2008) the fact that Cu pollutant has no specific location may indicate that it is mainly in a particulate form. With assumed 90% leaching efficiency of Cu, it was estimated that the concentration of Cu in all fractions was above or close to MKM guideline. Therefore, all fractions were equally contaminated and consequently all soil fractions had to be washed (Figure 11). Table 9 Copper concentrations analysed by HACH after leaching each soil fraction in Site I and Site II separately, mg/L.
Sieve size, mm
Cu leached, mg/L
Site I Site II
≥ 1 10 6
1 - 0.5 8.7 8.9
<0.5 - 0.25 8.5 12
<0.25 - 0.125 8 29
< 0.125 13 49
CHALMERS, Civil and Environmental Engineering, Master’s Thesis 2014:07 32
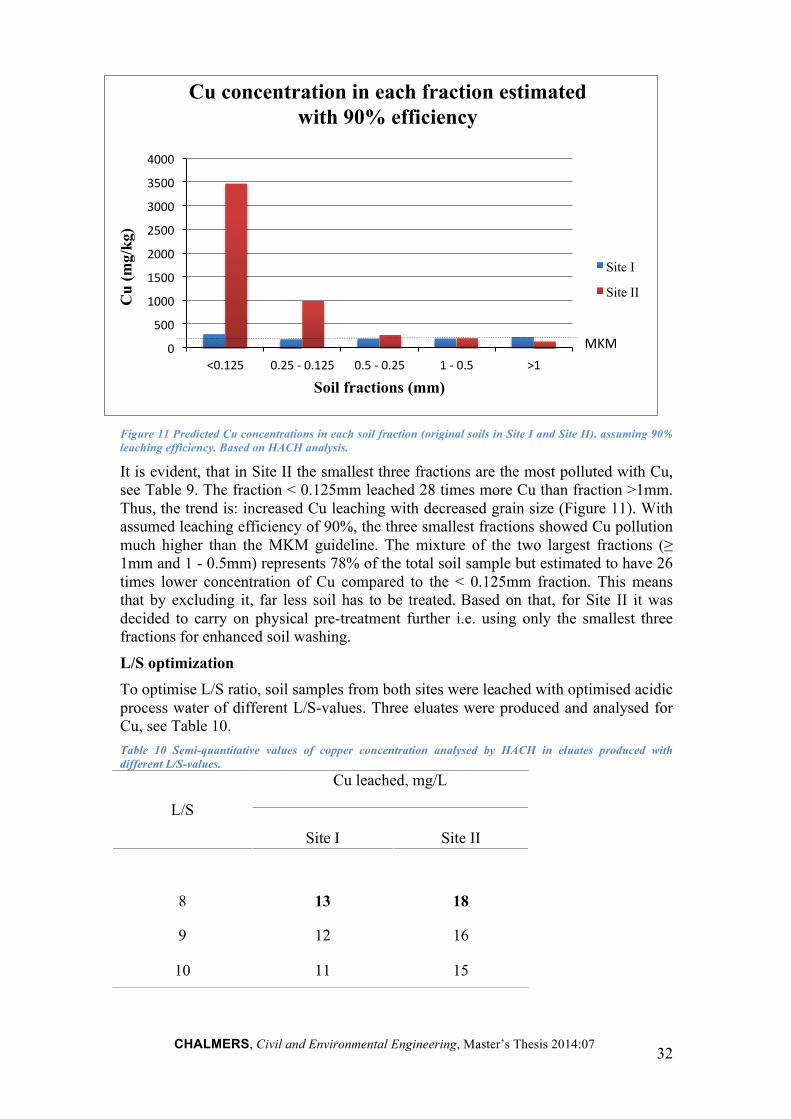
Figure 11 Predicted Cu concentrations in each soil fraction (original soils in Site I and Site II), assuming 90% leaching efficiency. Based on HACH analysis.
It is evident, that in Site II the smallest three fractions are the most polluted with Cu, see Table 9. The fraction < 0.125mm leached 28 times more Cu than fraction >1mm. Thus, the trend is: increased Cu leaching with decreased grain size (Figure 11). With assumed leaching efficiency of 90%, the three smallest fractions showed Cu pollution much higher than the MKM guideline. The mixture of the two largest fractions (≥ 1mm and 1 - 0.5mm) represents 78% of the total soil sample but estimated to have 26 times lower concentration of Cu compared to the < 0.125mm fraction. This means that by excluding it, far less soil has to be treated. Based on that, for Site II it was decided to carry on physical pre-treatment further i.e. using only the smallest three fractions for enhanced soil washing.
L/S optimization To optimise L/S ratio, soil samples from both sites were leached with optimised acidic process water of different L/S-values. Three eluates were produced and analysed for Cu, see Table 10. Table 10 Semi-quantitative values of copper concentration analysed by HACH in eluates produced with different L/S-values.
L/S
Cu leached, mg/L
Site I Site II
8 13 18
9 12 16
10 11 15
0
500
1000
1500
2000
2500
3000
3500
4000
<0.125 0.25 -‐ 0.125 0.5 -‐ 0.25 1 -‐ 0.5 >1
Cu
(mg/
kg)
Soil fractions (mm)
Cu concentration in each fraction estimated with 90% efficiency
Site I
Site II
MKM
CHALMERS, Civil and Environmental Engineering, Master’s Thesis 2014:07 33
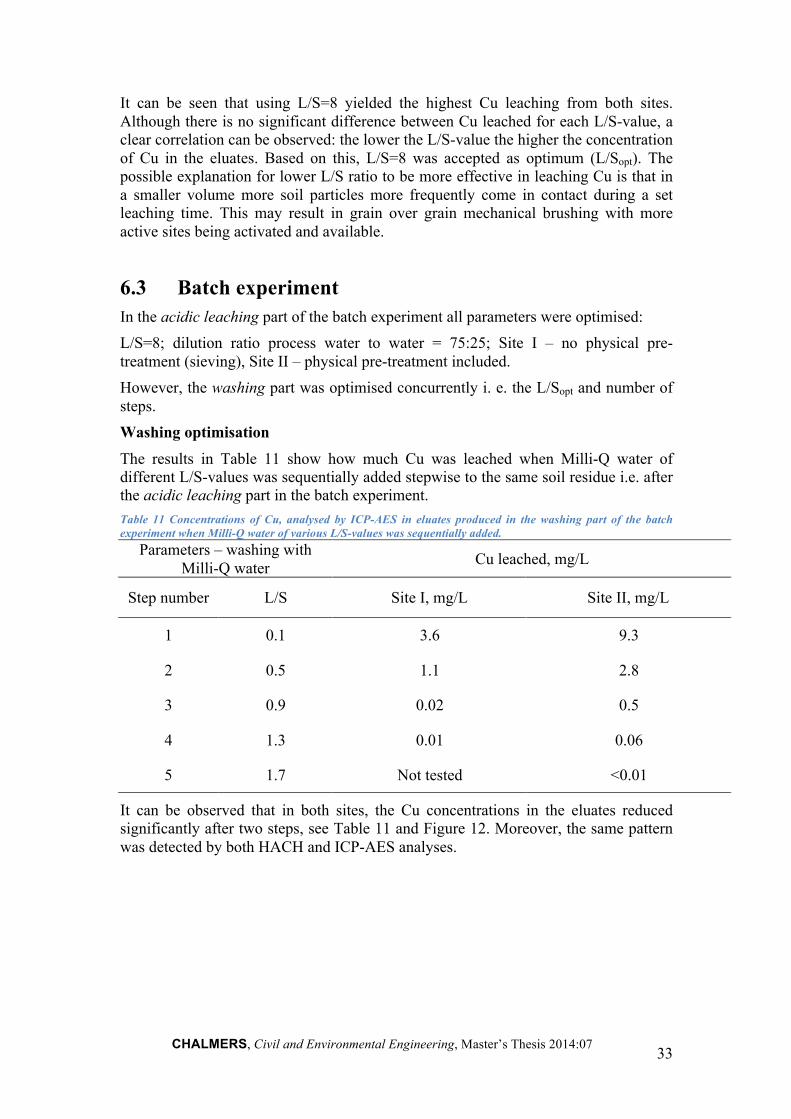
It can be seen that using L/S=8 yielded the highest Cu leaching from both sites. Although there is no significant difference between Cu leached for each L/S-value, a clear correlation can be observed: the lower the L/S-value the higher the concentration of Cu in the eluates. Based on this, L/S=8 was accepted as optimum (L/Sopt). The possible explanation for lower L/S ratio to be more effective in leaching Cu is that in a smaller volume more soil particles more frequently come in contact during a set leaching time. This may result in grain over grain mechanical brushing with more active sites being activated and available.
6.3 Batch experiment In the acidic leaching part of the batch experiment all parameters were optimised: L/S=8; dilution ratio process water to water = 75:25; Site I – no physical pre-treatment (sieving), Site II – physical pre-treatment included. However, the washing part was optimised concurrently i. e. the L/Sopt and number of steps. Washing optimisation The results in Table 11 show how much Cu was leached when Milli-Q water of different L/S-values was sequentially added stepwise to the same soil residue i.e. after the acidic leaching part in the batch experiment. Table 11 Concentrations of Cu, analysed by ICP-AES in eluates produced in the washing part of the batch experiment when Milli-Q water of various L/S-values was sequentially added.
Parameters – washing with Milli-Q water Cu leached, mg/L
Step number L/S Site I, mg/L Site II, mg/L
1 0.1 3.6 9.3
2 0.5 1.1 2.8
3 0.9 0.02 0.5
4 1.3 0.01 0.06
5 1.7 Not tested <0.01
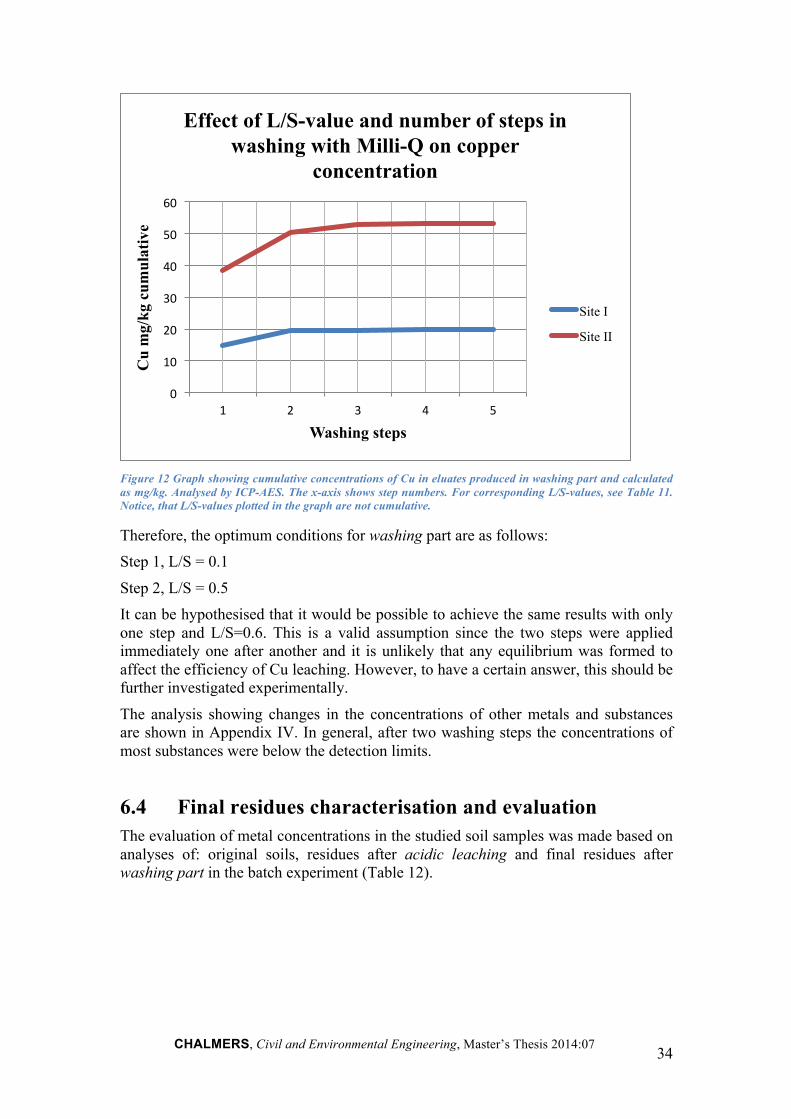
It can be observed that in both sites, the Cu concentrations in the eluates reduced significantly after two steps, see Table 11 and Figure 12. Moreover, the same pattern was detected by both HACH and ICP-AES analyses.
CHALMERS, Civil and Environmental Engineering, Master’s Thesis 2014:07 34
Figure 12 Graph showing cumulative concentrations of Cu in eluates produced in washing part and calculated as mg/kg. Analysed by ICP-AES. The x-axis shows step numbers. For corresponding L/S-values, see Table 11. Notice, that L/S-values plotted in the graph are not cumulative.
Therefore, the optimum conditions for washing part are as follows: Step 1, L/S = 0.1
Step 2, L/S = 0.5 It can be hypothesised that it would be possible to achieve the same results with only one step and L/S=0.6. This is a valid assumption since the two steps were applied immediately one after another and it is unlikely that any equilibrium was formed to affect the efficiency of Cu leaching. However, to have a certain answer, this should be further investigated experimentally.
The analysis showing changes in the concentrations of other metals and substances are shown in Appendix IV. In general, after two washing steps the concentrations of most substances were below the detection limits.
6.4 Final residues characterisation and evaluation The evaluation of metal concentrations in the studied soil samples was made based on analyses of: original soils, residues after acidic leaching and final residues after washing part in the batch experiment (Table 12).
0
10
20
30
40
50
60
1 2 3 4 5
Cu
mg/
kg c
umul
ativ
e
Washing steps
Effect of L/S-value and number of steps in washing with Milli-Q on copper
concentration
Site I
Site II
CHALMERS, Civil and Environmental Engineering, Master’s Thesis 2014:07 35
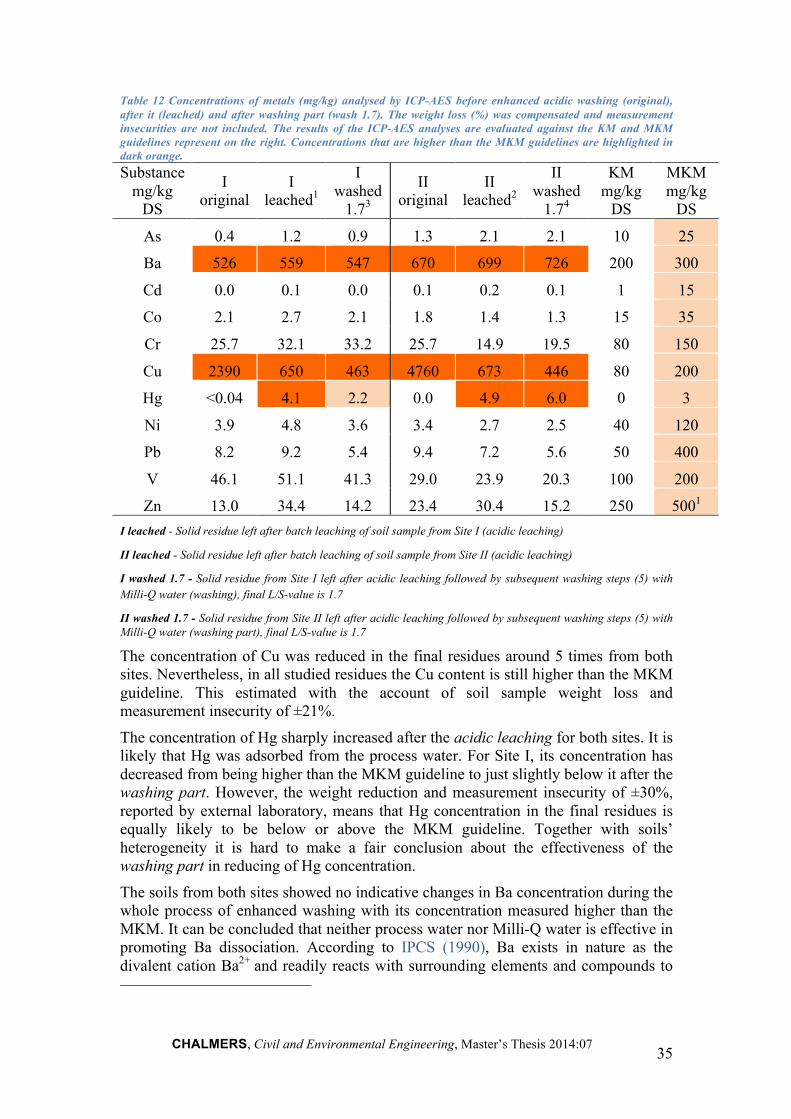
Table 12 Concentrations of metals (mg/kg) analysed by ICP-AES before enhanced acidic washing (original), after it (leached) and after washing part (wash 1.7). The weight loss (%) was compensated and measurement insecurities are not included. The results of the ICP-AES analyses are evaluated against the KM and MKM guidelines represent on the right. Concentrations that are higher than the MKM guidelines are highlighted in dark orange. Substance
mg/kg DS
I original
I leached1
I washed
1.73
II original
II leached2
II washed
1.74
KM mg/kg
DS
MKM mg/kg
DS
As 0.4 1.2 0.9 1.3 2.1 2.1 10 25
Ba 526 559 547 670 699 726 200 300
Cd 0.0 0.1 0.0 0.1 0.2 0.1 1 15
Co 2.1 2.7 2.1 1.8 1.4 1.3 15 35
Cr 25.7 32.1 33.2 25.7 14.9 19.5 80 150
Cu 2390 650 463 4760 673 446 80 200
Hg <0.04 4.1 2.2 0.0 4.9 6.0 0 3
Ni 3.9 4.8 3.6 3.4 2.7 2.5 40 120
Pb 8.2 9.2 5.4 9.4 7.2 5.6 50 400
V 46.1 51.1 41.3 29.0 23.9 20.3 100 200
Zn 13.0 34.4 14.2 23.4 30.4 15.2 250 5001 I leached - Solid residue left after batch leaching of soil sample from Site I (acidic leaching)
II leached - Solid residue left after batch leaching of soil sample from Site II (acidic leaching)
I washed 1.7 - Solid residue from Site I left after acidic leaching followed by subsequent washing steps (5) with Milli-Q water (washing), final L/S-value is 1.7
II washed 1.7 - Solid residue from Site II left after acidic leaching followed by subsequent washing steps (5) with Milli-Q water (washing part), final L/S-value is 1.7 The concentration of Cu was reduced in the final residues around 5 times from both sites. Nevertheless, in all studied residues the Cu content is still higher than the MKM guideline. This estimated with the account of soil sample weight loss and measurement insecurity of ±21%.
The concentration of Hg sharply increased after the acidic leaching for both sites. It is likely that Hg was adsorbed from the process water. For Site I, its concentration has decreased from being higher than the MKM guideline to just slightly below it after the washing part. However, the weight reduction and measurement insecurity of ±30%, reported by external laboratory, means that Hg concentration in the final residues is equally likely to be below or above the MKM guideline. Together with soils’ heterogeneity it is hard to make a fair conclusion about the effectiveness of the washing part in reducing of Hg concentration.
The soils from both sites showed no indicative changes in Ba concentration during the whole process of enhanced washing with its concentration measured higher than the MKM. It can be concluded that neither process water nor Milli-Q water is effective in promoting Ba dissociation. According to IPCS (1990), Ba exists in nature as the divalent cation Ba2+ and readily reacts with surrounding elements and compounds to
CHALMERS, Civil and Environmental Engineering, Master’s Thesis 2014:07 36
form different composites. The only compound formed with Ba, with solubility that does not increase with decreasing pH is barium sulfate (Ba SO4). Based on this, it can be concluded that both sites had Ba in form of barium sulfate. This also means that Ba is in a stable form, which is a positive quality when soil residues were evaluated further.
The concentrations of most substances were lower in residues after the washing step then those in residues after the acidic leaching, with some remained unchanged. The washing part was noticeably successful in reducing Cu (1.5 times) and Zn (>2 times) concentrations. According to Dermont, Bergeron and Mercier (2007) the removal efficiency depends on what metal type is to be roved as well as the valence of the element. In both sites the enhanced soil washing showed a reduction in concentration of Cu, Pb and Zn. These metals express cationic qualities, thus their dissolution increases when the solution pH decreases. The same metals showed a good responds to the washing part, by reducing their concentrations further. It can be hypothesized that they were weakly associated due to affect of acidic leaching or in a free form trapped in pores. On the contrary, the solubility of oxyanions of the metalloid such as As decreases when the solution’s pH decreases (Dermont, Bergeron and Mercier, 2007). This may explain why the developed enhanced washing method was ineffective in reducing As concentration. Moreover, there is an increase in As concentration in both sites due to a possible adsorption from process water enhanced by low pH (Mulligan, Yong and Gibbs, 2000). Nevertheless, the concentrations of As in all studied residues remained well below the KM guideline.
Soil matrix weight change To be able to determine the efficiency of the developed enhanced soil washing method, the weight change had to be estimated. As a result, it was found that the total weight loss after the soil was subjected to the soil washing was 11.8 w% for Site I and 7.7 w% for Site II. Additionally, it was assumed that 0.5 w-% was lost not due to process of dissociation but left behind on the laboratory equipment while samples were moved and divided. Consequently, the soil weight losses that were taken for further calculations are as follows:
Site I – 11.3 w% Site II – 7.2 w%
The degree of weight loss of the soil depends on many factors, similar to those defining the efficiency of metal extraction from soils, such as soil geochemistry or extracting reagent used. The calculated weight losses comply with the findings in study by Karlfeldt Fedje et al. (2013), where by using acidic leaching agents the weight loss of 10-15 w% was estimated. Efficiency To give an ample account of the effectiveness of the developed method, two efficiencies were calculated:
1 - The soil cleaning efficiency, reflecting the effectiveness of the method to reduce Cu concentration in the soil (!!): Site I - 81% Site II – 90%
CHALMERS, Civil and Environmental Engineering, Master’s Thesis 2014:07 37
2 - The leaching efficiency (!!) that reflects the ability of the method to receive Cu-rich eluates:
Site I – 69% Site II – 86%
The method achieved a high soil cleaning efficiency in both sites, with higher !! for Site II. The calculated leaching efficiency is showed to be higher for Site II also. Therefore, it can be concluded that the enhanced soil washing method is more effective in leaching Cu for soil from Site II. Even though the 86% !! is reasonably high efficiency it is still lower than the results achieved in study by Karlfeldt Fedje et al. (2013). In the latter, 90 - 100% of Cu was released from some soil samples when process water was used. Dermont, Bergeron and Mercier (2007) concluded that one of the important factors affecting metal removal efficiency by the chemical extraction is soil texture and metals affinity to the soil matrix. Such as one of the possible limiting factors in this study is the high content of clay/silt. From Table 14 it is clear that soils from Site I have higher content of clay (6%) and silt (45.5%) then soils from Site II (3% and 9% correspondingly). Moreover, as stated by Mulligan, Yong and Gibbs (2000) the soil washing technique is most efficient with sandy soils. These statements has been confirmed by the results in this study that showed that fine sand coarse silt soil from Site I have a higher adsorption capacity for Cu contaminant than sand soil from Site II. Nevertheless, according to Dermont, Bergeron and Mercier (2008) one of the factors that may reduce the effectiveness of the chemical leaching is high humic content. Based on the results in Table 14, it can be seen that the humic content in the original soils from Site II is twice as high as that in Site I. Therefore, its not always possible to clearly explain metal removal efficiency since it depends on several aspects and their combinations. pH In Table 13, the changes in pH can be observed after the soil was treated with process water followed by Milli-Q water. Table 13 Comparison of the pH of original soils and final residues from Sites I and Site II.
Site I (Köpmannebro) Site II (Björkhult)
Original soil Final residues Original soil Final residues
4.8 4.3 5.0 3.6
It is evident that soils in both sites became more acidic after the enhanced soil washing, with Site II showing a greater decrease in pH. It can be hypothesised that soil from Site I had a higher buffering capacity then soil from Site II. According to Zoltán (2010) the acid-base buffering capacity of organic-rich materials is usually high. The soils from Site II have humus content twice as high as soils from Site I (Table 14), which contradicts the result in Table 13. On the contrary, the same source states that clay soils have higher buffering capacity than sandy soils; in this study soil from Site I has higher clay content than soil from Site II, see Table 14 (Zoltán, 2010). Once more, it is challenging to give a certain explanation for one soil being more sensitive to acid introduction due to soils’ complex chemical composition and multiple factors affecting its characteristics.
CHALMERS, Civil and Environmental Engineering, Master’s Thesis 2014:07 38
The pH of both soils is <5.5 and therefore can be classified as strongly acidic before and after the treatment (Moody, 2006). However, according to MarkInfo (2007) the majority of soils in Sweden belong to Podzol type, which characterise of low pH, typically around 4. Based on that, it can be stated that although the acidity of soils has decreased due to the effect of acidic process water, the resulted soils’ pH is still within the normal pH profile for Swedish soils. Soil texture The same mechanisms that contribute to the process of metal extraction cause changes in physical qualities of the soil. The original samples and final residues were analysed for soil texture, Table 14. Table 14 Comparison of Humus, Clay, Silt and Sand contents (%) in original soil samples and soil residues from Site I and Site II.
Soil samples Humus, % Clay, % Silt, % Sand, % Name
I original 2.5 6 45.5 46
Clay-ish fine sand/coarse silt,
low humus content
I wash
2
2
44
52
Fine sand and coarse silt, very
low humus content
II original
5.1
3
9
82.9
Slightly clay-ish sand, medium humus content
II wash
7
2
12.5
78.5
Sand, high humus content
The humus content in soils from Site I shows a slight reduction, Appendix II. Additionally, decrease of clay fractions can be observed in both sites. This can be motivated by Dermont, Bergeron and Mercier (2007) that states that leaching with acid have a strong effect on soil structure and leads to up to 50% losses which include soil mineral substances and organic matter. Markedly, the humus content in Site II has increased after the process of acidic washing. This is an unforeseen result with most likely explanation of heterogenic soil nature. Heterogeneity refers to uneven distribution of particles of different sizes and origins within the medium (ITRC, 2012). When evaluating silt content, soil from Site II showed a clear increase. The possible explanation is that soil minerals comprising the larger fractions of soil mineral components such as Fe–Mn oxides were released due to process of dissolution under the effect of process water (Dermont, Bergeron and Mercier, 2007). It can be hypothesised that reduced content of sand may contributed to the increased content of
CHALMERS, Civil and Environmental Engineering, Master’s Thesis 2014:07 39
silt in Site II. The names given to soils according to the SLU (2014) classification system and reflect the changes that took place after the remediation, see Table 14. Soil as Filter and Buffer for Heavy Metals The soil ability to immobilize or neutralize substances by mechanism of physico-chemical adsorption and via metabolism processes was evaluated using the TUSEC manual. The results presented in Table 15. Table 15 Comparison of scores according to the TUSEC method estimated for pre-and post-remedial soils for soil function ‘Soil as filter and buffer for heavy metals’.
Site I original Site I residues Site II original Site II residues
5 5 4 5
According to TUSEC manual the soil from Site I showed ‘very low’ constitution with no quality changes between original samples and the final residues. This means that although the original soil was of a very low ability to buffer and bind/sorb heavy metals, this did not worsen due to the affect of the developed enhanced soil washing.
For Site II the soil’s capacity to buffer and filter heavy metals decreased from ‘low’ to ‘very low’ after the enhanced soil washing. The main reason is soil residues became more acidic with pH decreasing from 5.0 to 3.6 (Table 13). Because the binding ability of clay particles and organic matter is pH-dependent and decreases with decreasing pH-value (Baird and Cann, 2008), the significant reduction in pH in Site II led to lower adsorption and binding abilities.
SEM The metals speciation, using SEM, allowed identifying the changes in major elements such as those forming the mineral inorganic part of the soil and minor elements such as Cu. The results of the findings presented in Table 16. Table 16 Summary showing an average w-% change in some of the soils’ common elements, based on spot analysis, SEM.
Sample Al w-% Si w-% Ca w-% Fe w-%
I orig 5.6 23.2 0.9 3.6
I resid 4.7 21.9 0.8 12.1
II orig 5.4 16.6 0.3 8.6
II resid 5.2 15.7 0.3 4.1
Site I showed to have a greater w-% loss in Al, Si and Ca elements after acidic washing. It can be hypothesised that the process water had a stronger impact on the soil matrix in Site I as it was confirmed by its greater weight loss compared to the Site II. In attempts to explain the sharp rise in Hg content in soil residues for both sites the soils’ mineralogy was assessed. In focus were the major soil constituent elements such as Al, Si, Ca and Fe. The reasonably high content of the Al and Fe (Table 16, the data highlighted in grey) found by SEM signifies that soil matrix composed of clay minerals and iron oxides (Fernández, 2013). Consequently, Fernández (2013) claims that Fe, Mn, Hg and As tend to associate geochemically. Therefore, it can be hypothesized that high content of iron oxides in original samples from both sites had a high affinity towards Hg, which lead to it adsorption from the process water. This
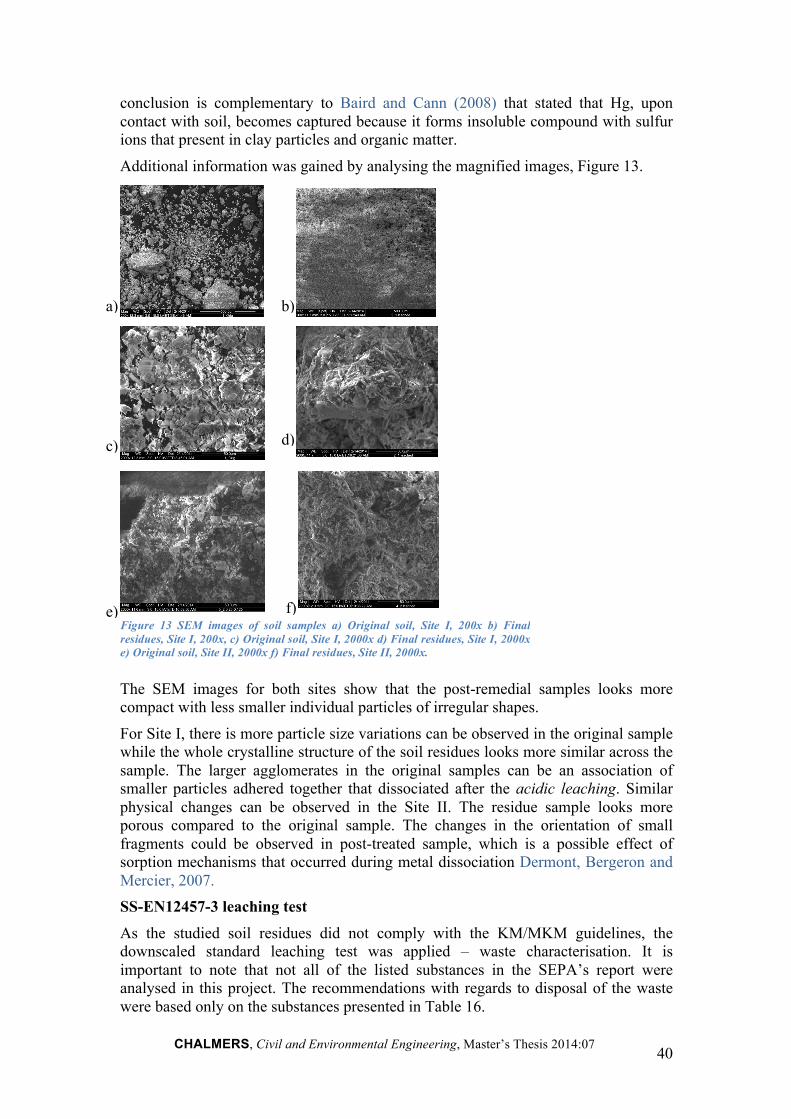
CHALMERS, Civil and Environmental Engineering, Master’s Thesis 2014:07 40
conclusion is complementary to Baird and Cann (2008) that stated that Hg, upon contact with soil, becomes captured because it forms insoluble compound with sulfur ions that present in clay particles and organic matter.
Additional information was gained by analysing the magnified images, Figure 13.
The SEM images for both sites show that the post-remedial samples looks more compact with less smaller individual particles of irregular shapes.
For Site I, there is more particle size variations can be observed in the original sample while the whole crystalline structure of the soil residues looks more similar across the sample. The larger agglomerates in the original samples can be an association of smaller particles adhered together that dissociated after the acidic leaching. Similar physical changes can be observed in the Site II. The residue sample looks more porous compared to the original sample. The changes in the orientation of small fragments could be observed in post-treated sample, which is a possible effect of sorption mechanisms that occurred during metal dissociation Dermont, Bergeron and Mercier, 2007. SS-EN12457-3 leaching test As the studied soil residues did not comply with the KM/MKM guidelines, the downscaled standard leaching test was applied – waste characterisation. It is important to note that not all of the listed substances in the SEPA’s report were analysed in this project. The recommendations with regards to disposal of the waste were based only on the substances presented in Table 16.
a) b)
Figure 13 SEM images of soil samples a) Original soil, Site I, 200x b) Final residues, Site I, 200x, c) Original soil, Site I, 2000x d) Final residues, Site I, 2000x e) Original soil, Site II, 2000x f) Final residues, Site II, 2000x.
d)
f)
c)
e)
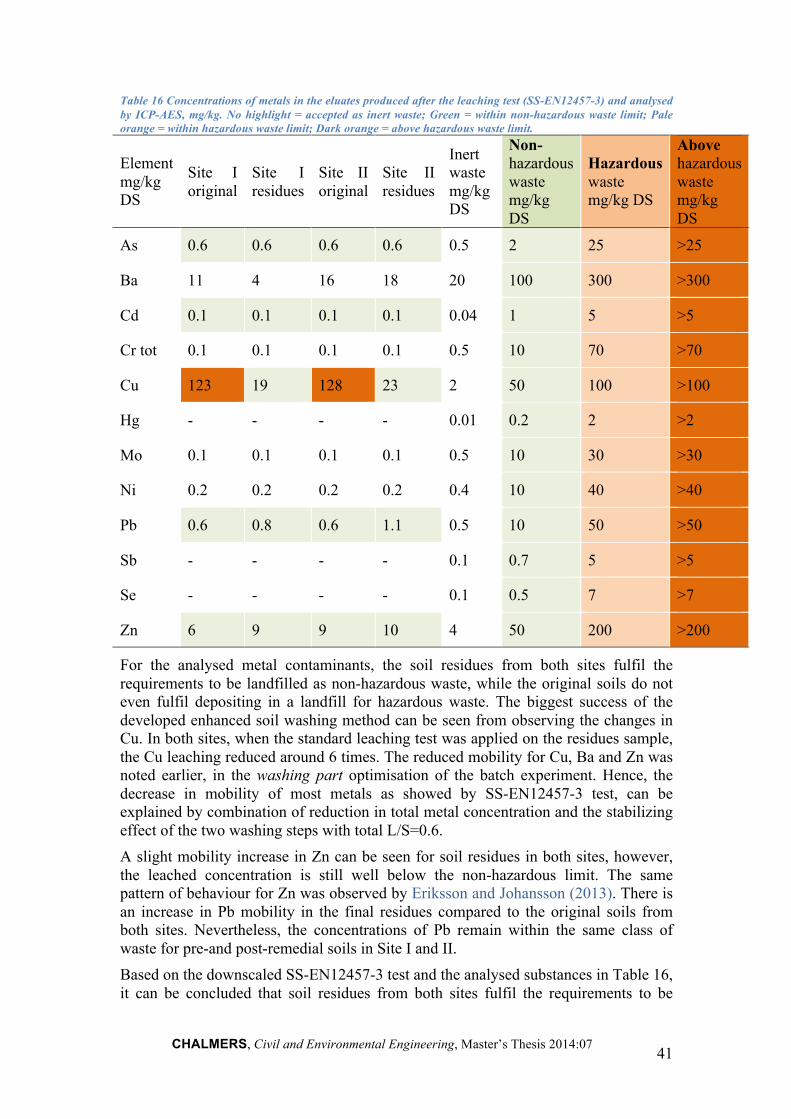
CHALMERS, Civil and Environmental Engineering, Master’s Thesis 2014:07 41
Table 16 Concentrations of metals in the eluates produced after the leaching test (SS-EN12457-3) and analysed by ICP-AES, mg/kg. No highlight = accepted as inert waste; Green = within non-hazardous waste limit; Pale orange = within hazardous waste limit; Dark orange = above hazardous waste limit.
Element mg/kg DS
Site I original
Site I residues
Site II original
Site II residues
Inert waste mg/kg DS
Non-hazardous waste mg/kg DS
Hazardous waste mg/kg DS
Above hazardous waste mg/kg DS
As 0.6 0.6 0.6 0.6 0.5 2 25 >25
Ba 11 4 16 18 20 100 300 >300
Cd 0.1 0.1 0.1 0.1 0.04 1 5 >5
Cr tot 0.1 0.1 0.1 0.1 0.5 10 70 >70
Cu 123 19 128 23 2 50 100 >100
Hg - - - - 0.01 0.2 2 >2
Mo 0.1 0.1 0.1 0.1 0.5 10 30 >30
Ni 0.2 0.2 0.2 0.2 0.4 10 40 >40
Pb 0.6 0.8 0.6 1.1 0.5 10 50 >50
Sb - - - - 0.1 0.7 5 >5
Se - - - - 0.1 0.5 7 >7
Zn 6 9 9 10 4 50 200 >200
For the analysed metal contaminants, the soil residues from both sites fulfil the requirements to be landfilled as non-hazardous waste, while the original soils do not even fulfil depositing in a landfill for hazardous waste. The biggest success of the developed enhanced soil washing method can be seen from observing the changes in Cu. In both sites, when the standard leaching test was applied on the residues sample, the Cu leaching reduced around 6 times. The reduced mobility for Cu, Ba and Zn was noted earlier, in the washing part optimisation of the batch experiment. Hence, the decrease in mobility of most metals as showed by SS-EN12457-3 test, can be explained by combination of reduction in total metal concentration and the stabilizing effect of the two washing steps with total L/S=0.6. A slight mobility increase in Zn can be seen for soil residues in both sites, however, the leached concentration is still well below the non-hazardous limit. The same pattern of behaviour for Zn was observed by Eriksson and Johansson (2013). There is an increase in Pb mobility in the final residues compared to the original soils from both sites. Nevertheless, the concentrations of Pb remain within the same class of waste for pre-and post-remedial soils in Site I and II. Based on the downscaled SS-EN12457-3 test and the analysed substances in Table 16, it can be concluded that soil residues from both sites fulfil the requirements to be
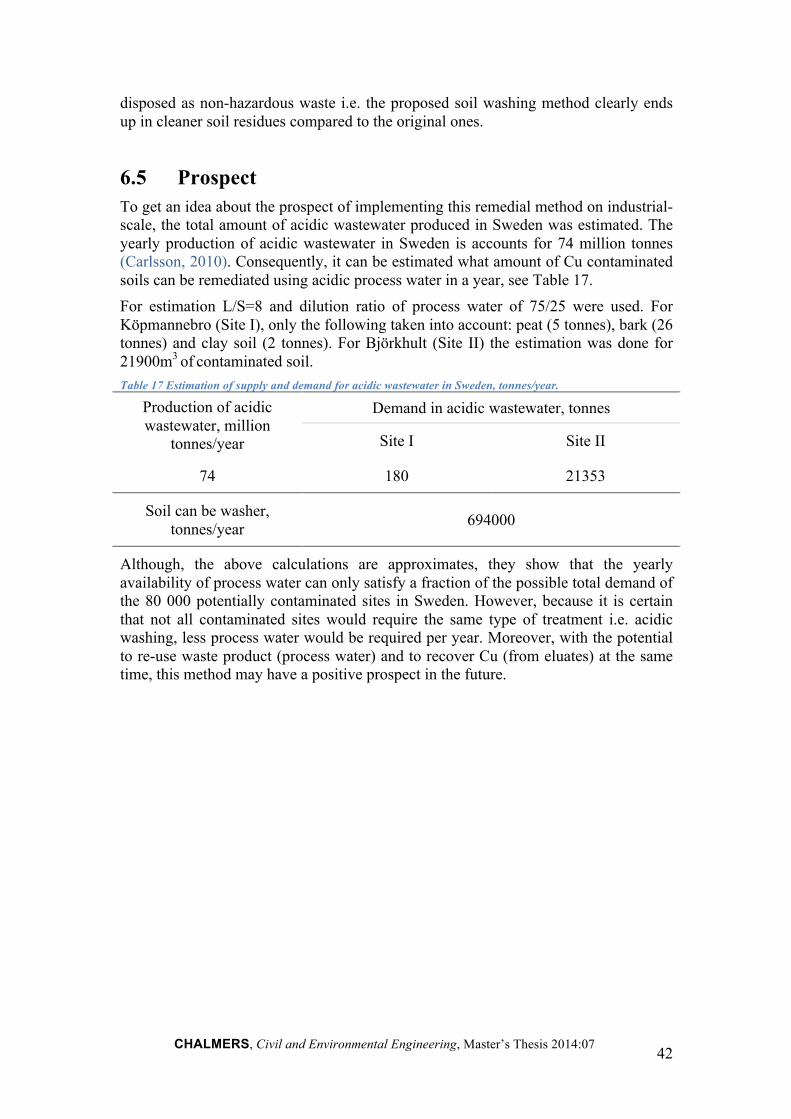
CHALMERS, Civil and Environmental Engineering, Master’s Thesis 2014:07 42
disposed as non-hazardous waste i.e. the proposed soil washing method clearly ends up in cleaner soil residues compared to the original ones.
6.5 Prospect To get an idea about the prospect of implementing this remedial method on industrial-scale, the total amount of acidic wastewater produced in Sweden was estimated. The yearly production of acidic wastewater in Sweden is accounts for 74 million tonnes (Carlsson, 2010). Consequently, it can be estimated what amount of Cu contaminated soils can be remediated using acidic process water in a year, see Table 17. For estimation L/S=8 and dilution ratio of process water of 75/25 were used. For Köpmannebro (Site I), only the following taken into account: peat (5 tonnes), bark (26 tonnes) and clay soil (2 tonnes). For Björkhult (Site II) the estimation was done for 21900m3 of contaminated soil. Table 17 Estimation of supply and demand for acidic wastewater in Sweden, tonnes/year.
Production of acidic wastewater, million
tonnes/year
Demand in acidic wastewater, tonnes
Site I Site II
74 180 21353
Soil can be washer, tonnes/year 694000
Although, the above calculations are approximates, they show that the yearly availability of process water can only satisfy a fraction of the possible total demand of the 80 000 potentially contaminated sites in Sweden. However, because it is certain that not all contaminated sites would require the same type of treatment i.e. acidic washing, less process water would be required per year. Moreover, with the potential to re-use waste product (process water) and to recover Cu (from eluates) at the same time, this method may have a positive prospect in the future.
CHALMERS, Civil and Environmental Engineering, Master’s Thesis 2014:07 43
7 Conclusions Based on the results from the laboratory experiments performed while developing the enhanced soil washing method it can be concluded that soils contaminated with Cu can be treated with acidic process water to significantly (~90%) reduce Cu concentration. By doing so, it is possible to produce Cu-rich eluates with the potential to recover the valuable metal. Also, the use of the method allows producing final residues that are stable enough to be deposited in a landfill for non-hazardous waste, which was not possible with the original soil. Together with an associated reduction in the total volume of the post-treated soil, the use of this technology expected to lead to lower financial burden linked with waste management. Additionally, the following disclosures were made:
• Despite that the final residues had Cu concentration 5 times lower than that in the original soils, they still were not able to comply with the MKM guideline.
• Diluted process water (75/25) was able to leach about the same concentration of Cu as the non-diluted one.
• Hg contained in process water showed an ability to adsorb onto the soil. To avoid this effect it is necessary to include an additional pre-treatment for the acidic process water prior using it as a leachant. Further study of Hg adsorption mechanisms is therefore advised.
• The enhanced soil washing may cause lowering of pH, which can negatively affect the soil’s function as filter and buffer for heavy metals, as described in TUSEC manual. However, in this study, the decrease in buffer ability didn’t promote further leaching of metals from soil matrix based on the standard leaching test.
• Washing with water, facilitates further removal of some metal contaminants, while for other metals it showed not to have any significant effect.
• ‘Clayish fine sand/coarse silt’ and ‘slightly clayish sand’ types of soil respond similarly to the developed enhanced washing method, with the latter leaching more Cu when physical pre-treatment is used.
CHALMERS, Civil and Environmental Engineering, Master’s Thesis 2014:07 44
8 Continuation of the work Additionally, several recommendations can be made for continued study in this field of research:
• Further optimisation of L/S, between 6 and 8, for the acidic leaching should be considered. It is of a great benefit if reduced amount of leachant can yield a higher concentration of Cu.
• To strengthen the findings in this study it is recommended to repeat the washing part (batch experiment) with only one step and L/S=0.6.
• Because the presence of organic compounds influences metal mobility, the effect of organic pollutants on metal separation must be studied. It is possible that addressing this factor may lead to greater metal leaching results.
• For further experiments involving soil washing with process water, the dilution ratio of the latter should be chosen specifically for each treated site.
• The full-scale standard leaching SS-EN-12457-3 test should be repeated with the analysis of organic pollutants included.
• It is recommended to investigate Ba pollutant and opportunity to decrease its concentration simultaneously with Cu.
• To sum up, further work should attempt to improve Cu leaching from soil with a view to achieve the compliance with the MKM guideline without negative effect of Hg adsorption.
CHALMERS, Civil and Environmental Engineering, Master’s Thesis 2014:07 45
References Abumaizar, J., Bergeron and Smith. E., (1999). “Heavy metal contaminants removal by soil washing”. Journal of Hazardous Materials. Metals Removal, 71–86 Ahmad, A.L., Ooi, B.S., 2010. A study on acid reclamation and copper recovery using low pressure nanoltration membrane. Chem. Eng. J. 56, 257e263
Arnér, M., Erjeby-Florell, S., Land, M. (2011) Delrapport Huvudstudie ! Föroreningssituationen, riskbedömning och behov av riskreduktion. Stockholm, WSP Environmetal (Rapport 10104614) Assessment Training Manual. [pdf] New York: Cornell University. Available at: <http://soilhealth.cals.cornell.edu/extension/manual/1basics.pdf> [Accessed 25 April 2014]
Baird, C. & Cann, M. 2008, Environmental chemistry, W.H. Freeman & Co, New York.
Bergil, C., Bydén, S. (1995) Mäta försurning - Undersökningar av mark och vatten. Limmared, Institutionen för tillämpad miljövetenskap vid Göteborgs universitet Bisone, S., Blais, J., Drogui, P., Mercier, G., 2012. Toxic metal removal from polluted soil by acid extraction. Water Air Soil Poll. 223, 3739-3755 Carlsson, B., 2010. Nyttiggörande av rökgasreningsrest (RGR) från avfallsförbränning i Sverige. Linköping: Enviro Miljöteknik AB Dermont, G., Bergeron, M., Mercier, G. and Richer-Laflèche, M. (2008). “Metal-Contaminated Soils: Remediation Practices and Tratment Technologies”. Pract. Period. Hazard. Toxic Radioact. Waste Manage. 12, SPECIAL ISSUE: Metals Removal, 188–209 Dermont, G., Bergeron, M., Mercier, G., Richer-Laflèche, M., (2007). Soil washing for metal removal: A review of physical/chemical technologies and field applications. J. Hazard. Mater. 152, 1-31
Duruibe, J. O., Ogwuegbu, M. O. C. and Egwurugwu, J. N., 2007. Heavy metal pollution and human biotoxic effects. International Journal of Physical Sciences Vol. 2 (5), pp. 112-118 Eriksson, A. and Johansson, P., 2013. Soil Washing: Optimization of acidic leaching of Copper in contaminated soils. Master. Chalmers University of Technology
European Commission, 2014. Soil. [online] Available at: <http://ec.europa.eu/environment/soil/index_en.htm> [Accessed 1 June 2014]
European Copper Institute, 2014. Copper Alliance. [online] Available at: <http://www.copperalliance.eu/about-copper/properties> [Accessed 25 March 2014] Faculty Virginia. Metals in medicine and the environment. Copper from the ground up. [online] Available at: <http://faculty.virginia.edu/metals/cases/dudgeon3.html> [Accessed 20 May 2014]
CHALMERS, Civil and Environmental Engineering, Master’s Thesis 2014:07 46
Fenglian F. and Qi W. (2010) Removal of heavy metal ions from wastewaters: A review. Journal of environmental management. Journal of Environmental Management 92 (2011) 407e418
Fernàndez, C. S. 2013. Remediation of mining and metallurgy Brownfields by means of Physical Separation Procedures. Doctor Degree216, Department of Mining Exploitation and Prospecting Geochemical Instrumentation and Analysis, 2013. SEM. [online] Available at: <http://serc.carleton.edu/research_education/geochemsheets/techniques/SEM.html> [Accessed 12 May 2014]
Gugino, B.K., Idowu, O.J., Schindelbeck, R.R., H.M. van Es, Wolfe, D.W., Moebius-Clune, B.N., Thies, J.E., and Abawi, G.S., 2009. Cornell Soil Health Hach manual, (2009). Datalogging colorimeter handbook – HACH. DR-890. Manual
Investment Mine, 2014. Info Mine [online] Available at: <http://www.infomine.com/investment/metal-prices/copper/5-year/> [Accessed 25 March 2014] IPCS INCHEM, 1990. International programme on chemical safety, Barium. [online] Available at: < http://www.inchem.org/documents/ehc/ehc/ehc107.htm> [Accessed 15 May 2014]
ITRC, 2012. Soil Heterogeneity and Variation in Contaminant Concentrations. [online] Available at: <http://www.itrcweb.org/ISM1/2_2_Soil_Heterogeneity_and_Variation.html> [Accessed 9 June 2014]
Johansson, A. E. P. 2013. Soil Washing: Optimization of Acid Leaching of Copper from Contaminated Soil. Master's, Chalmers University of Technology
Karlfeldt Fedje, K., Yilling, L., Strömvall, A-M. (2013) Remediation of Metal Polluted Hotspot Areas through Enhanced Soil Washing – Evaluation of Leaching Methods Kemakta Konsult AB (2012), Kompletterande huvudstudie för förorenad mark vid f.d. stolpimpregnering på Långö, Köpmannebro, Mellerud kommun, Ar 2012-06, Stockhol
Lehmann, A., David, S., & Stahr, K. (2009). TUSEC - Bilingual-Edition: Technique for soil evaluation and categorization for natural and anthropogenic soils. Stuttgart:Univ. Hohenheim
LME, 2014. London Metal Exchange. [online] Available at: <http://www.lme.com/en-gb/metals/non-ferrous/copper/> [Accessed 25 March 2014]
MarkInfo, 2007. Soil pH. [online] Available at: <http://www.markinfo.slu.se/sve/kem/cnph/ph.html > [Accessed 5 June 2014].
Moody, P., 2006. Understanding soil pH. [e-book] Queensland: Natural Resource Sciences. Available at:<http://www.nrm.qld.gov.au/factsheets/pdf/land/l47.pdf> [Accessed 3 April 2014]
CHALMERS, Civil and Environmental Engineering, Master’s Thesis 2014:07 47
Mulligan, C.N., Yong R.N., Gibbs B.F. (2000) Remediation technologies for metal- contaminated soils and groundwater: an evaluation. Engineering Geology, vol. 60, pp. 193- 207
Nordin,A.2013.Lägesbeskrivning av arbetet med efterbehandling av förorenad områden. 2012. Stockholm: Naturvårdsverket
NFS 2004:10. Naturvårdsverkets föreskrifter om deponering, kriterier och förfaranden för mottagning av avfall vid anläggningar för deponering av avfall. Stockolm:Naturvårdsverket
Ohlsson, Y., Berggren-Kleja, D., Stark, M., Haglund, K., (2011), Förorenade områden - Inventering av effektivitetshinder och kunskapsbehov, SGI-V620, Linköping
SEPA (2009b) Naturvårdsverkets årsrapport 2008. Stockholm. ISBN 978-91-620-8378-6
SEPA (2009c) Riktvärden för förorenad mark modellbeskrivning och vägledning. Bromma. ISBN 978-91-620-5976-7
SIS (2003) Swedish Standards Institute. Characterisation of waste – Leaching – Compliance test for leaching of granular waste, materials and sludges. Part 3. Stockholm. ICS 13.030.10; 13.030.20
Senate Department for Urban Development and the Environment, 2009. Soil functions. [online] Available at: <http://www.stadtentwicklung.berlin.de/umwelt/umweltatlas/edb11203.htm> [Accessed 28 March 2014]
Shammas, N., 2009. Removal of heavy metals from soil in Handbook of advanced industrial and hazardous wastes treatment, in Wang, L., (Eds.), Advances in Industrial and Hazardous Wastes Treatment Taylor & Frances group, LLC, New York
SLU, 2014, Swedish University of Agricultural Sience. [online] Available at: < http://www.slu.se/sv/fakulteter/nj/om-fakulteten/ovrigaenheter/faltforsk/utbildning/dokumentation/jordarter-prover/> [Accessed 5 May 2014]
Swedish Environmental Protection Agency (2013) The Environmental Objectives System. http://www.swedishepa.se (25 Jan. 2013)
Thomas, R. (2004), Practical Guide to ICP-MS. New York, Marcel Dekker
The University of Mississippi, 2009. ICP-MS. [online] Available at: <http://www.olemiss.edu/depts/chemistry/icp-ms/icp-sfms.html> [Accessed 22 May 2014]
USDA (2000) United States Department of Agriculture – Urban Technical Note N3. Heavy metals soil contamination. Auburn:NRCS
CHALMERS, Civil and Environmental Engineering, Master’s Thesis 2014:07 48
Volchko, Y., 2013. SF Box - A tool for evaluating effects on ecological soil functions in remediation projects. Report. Chalmers University of Technology WSP Environmental (2010), Föroreningssituationen, riskbedömning och behov av riskreduktion. Televerket Björkhult, Kinda kommun. 2 ed. Stockholm, Sweden: WSP Environmental
Zoltán, C., 2010. The factors influencing the buffering capacity of soils and their importance in horticultural cultivation. Doctoral Dissertation. The Corvinus University of Budapest
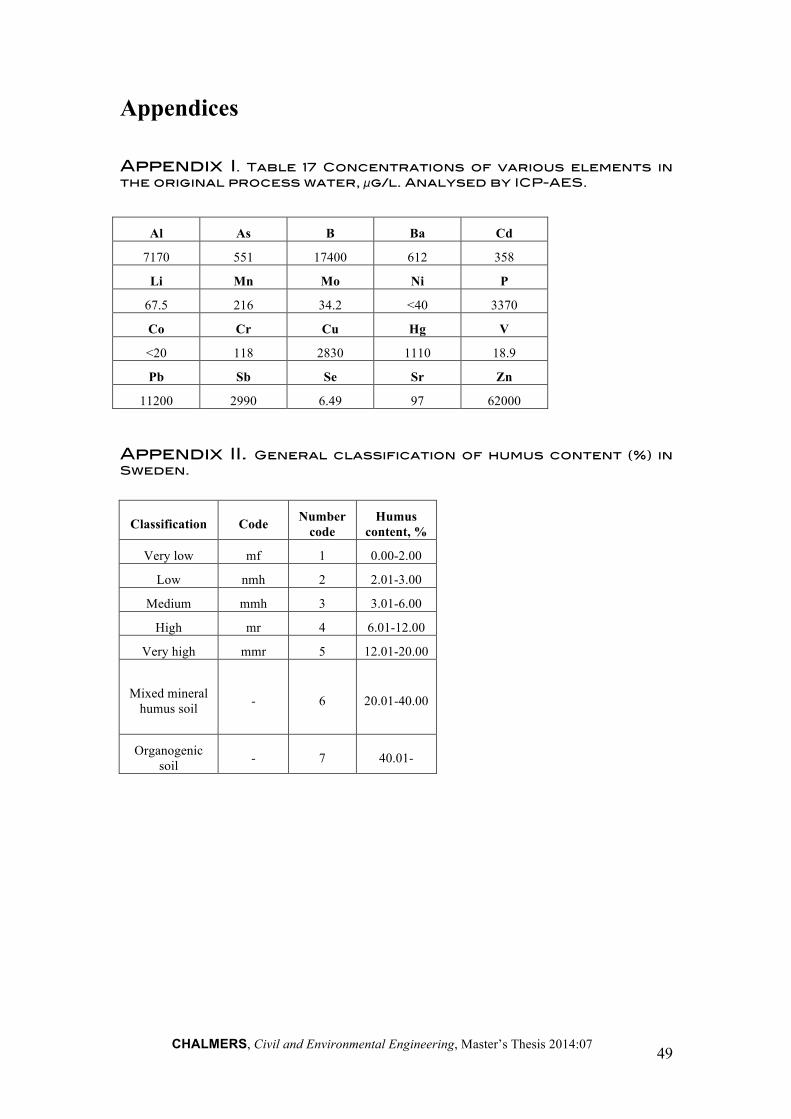
CHALMERS, Civil and Environmental Engineering, Master’s Thesis 2014:07 49
Appendices Appendix I. Table 17 Concentrations of various elements in the original process water, µg/l. Analysed by ICP-AES.
Al As B Ba Cd
7170 551 17400 612 358
Li Mn Mo Ni P
67.5 216 34.2 <40 3370
Co Cr Cu Hg V
<20 118 2830 1110 18.9
Pb Sb Se Sr Zn
11200 2990 6.49 97 62000
Appendix II. General classification of humus content (%) in Sweden.
Classification Code Number code
Humus content, %
Very low mf 1 0.00-2.00
Low nmh 2 2.01-3.00
Medium mmh 3 3.01-6.00
High mr 4 6.01-12.00
Very high mmr 5 12.01-20.00
Mixed mineral humus soil - 6 20.01-40.00
Organogenic soil - 7 40.01-
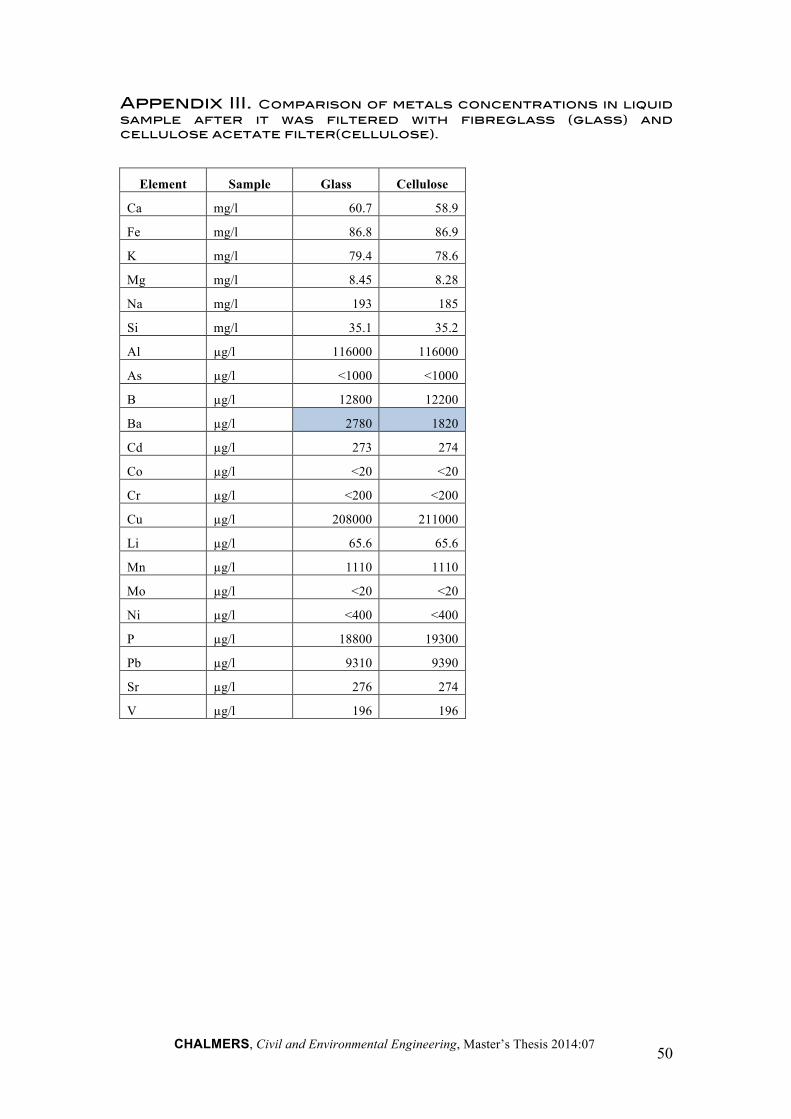
CHALMERS, Civil and Environmental Engineering, Master’s Thesis 2014:07 50
Appendix III. Comparison of metals concentrations in liquid sample after it was filtered with fibreglass (glass) and cellulose acetate filter(cellulose).
Element Sample Glass Cellulose
Ca mg/l 60.7 58.9
Fe mg/l 86.8 86.9
K mg/l 79.4 78.6
Mg mg/l 8.45 8.28
Na mg/l 193 185
Si mg/l 35.1 35.2
Al µg/l 116000 116000
As µg/l <1000 <1000
B µg/l 12800 12200
Ba µg/l 2780 1820
Cd µg/l 273 274
Co µg/l <20 <20
Cr µg/l <200 <200
Cu µg/l 208000 211000
Li µg/l 65.6 65.6
Mn µg/l 1110 1110
Mo µg/l <20 <20
Ni µg/l <400 <400
P µg/l 18800 19300
Pb µg/l 9310 9390
Sr µg/l 276 274
V µg/l 196 196
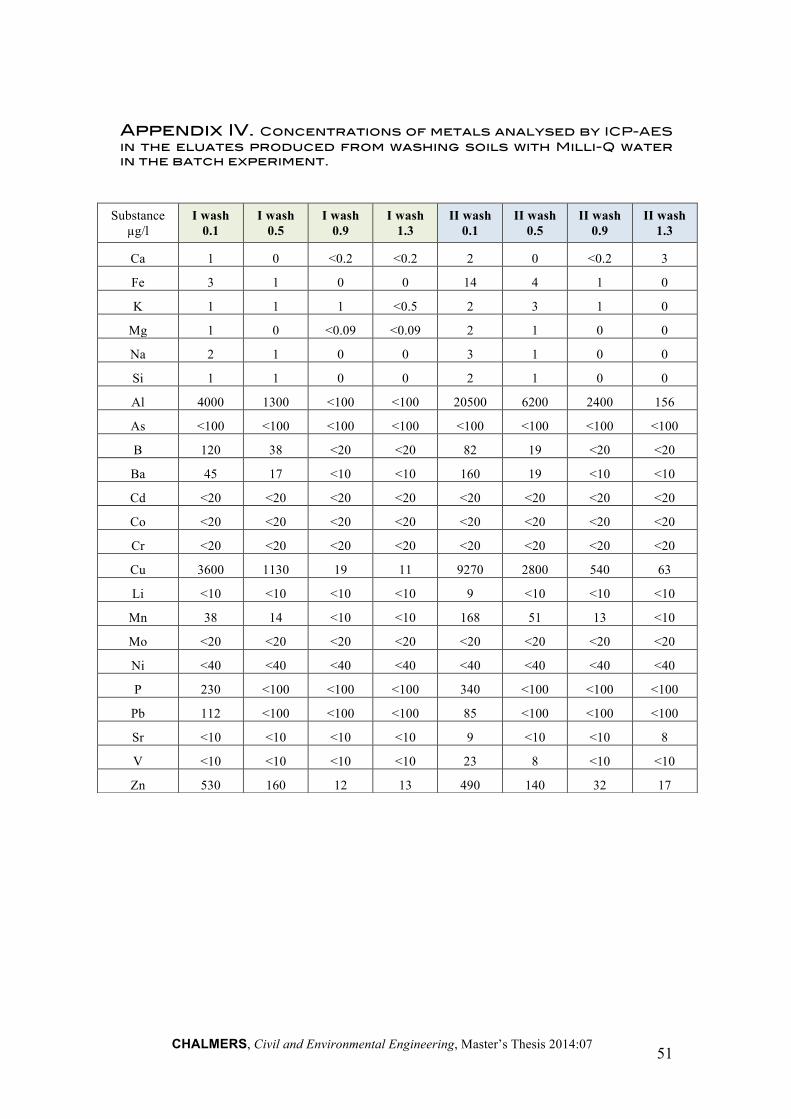
CHALMERS, Civil and Environmental Engineering, Master’s Thesis 2014:07 51
Appendix IV. Concentrations of metals analysed by ICP-AES in the eluates produced from washing soils with Milli-Q water in the batch experiment.
Substance µg/l
I wash 0.1
I wash 0.5
I wash 0.9
I wash 1.3
II wash 0.1
II wash 0.5
II wash 0.9
II wash 1.3
Ca 1 0 <0.2 <0.2 2 0 <0.2 3
Fe 3 1 0 0 14 4 1 0
K 1 1 1 <0.5 2 3 1 0
Mg 1 0 <0.09 <0.09 2 1 0 0
Na 2 1 0 0 3 1 0 0
Si 1 1 0 0 2 1 0 0
Al 4000 1300 <100 <100 20500 6200 2400 156
As <100 <100 <100 <100 <100 <100 <100 <100
B 120 38 <20 <20 82 19 <20 <20
Ba 45 17 <10 <10 160 19 <10 <10
Cd <20 <20 <20 <20 <20 <20 <20 <20
Co <20 <20 <20 <20 <20 <20 <20 <20
Cr <20 <20 <20 <20 <20 <20 <20 <20
Cu 3600 1130 19 11 9270 2800 540 63
Li <10 <10 <10 <10 9 <10 <10 <10
Mn 38 14 <10 <10 168 51 13 <10
Mo <20 <20 <20 <20 <20 <20 <20 <20
Ni <40 <40 <40 <40 <40 <40 <40 <40
P 230 <100 <100 <100 340 <100 <100 <100
Pb 112 <100 <100 <100 85 <100 <100 <100
Sr <10 <10 <10 <10 9 <10 <10 8
V <10 <10 <10 <10 23 8 <10 <10
Zn 530 160 12 13 490 140 32 17
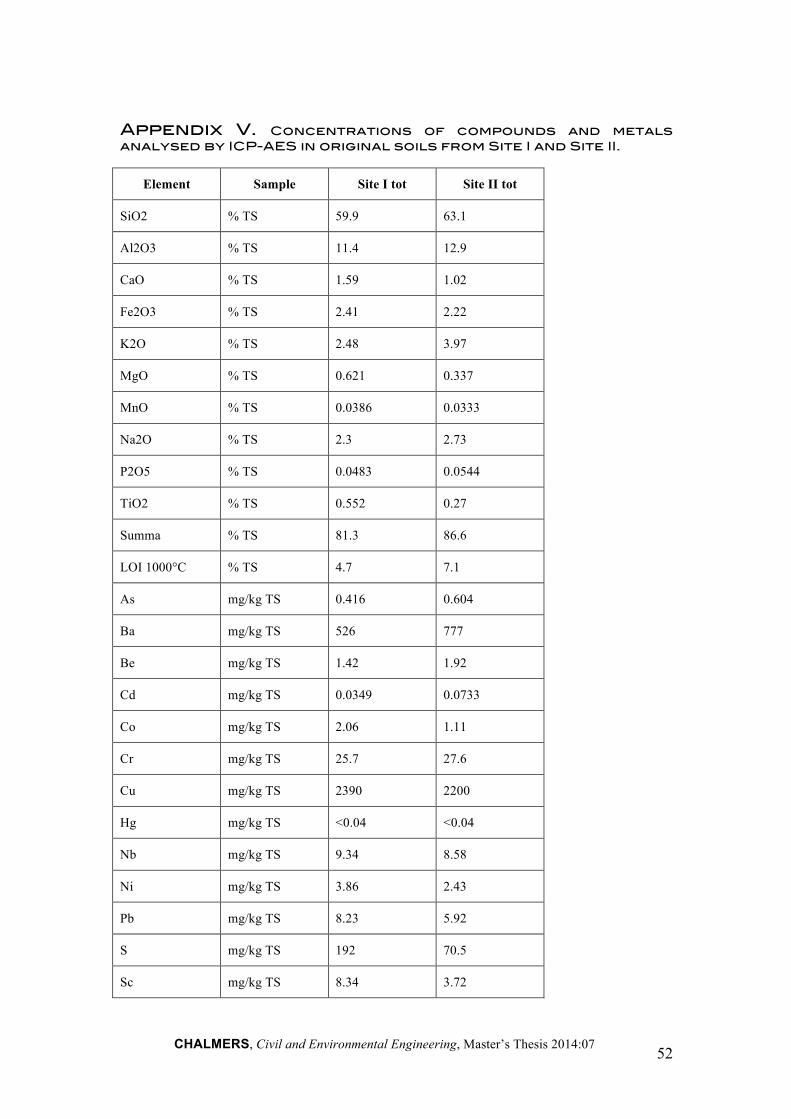
CHALMERS, Civil and Environmental Engineering, Master’s Thesis 2014:07 52
Appendix V. Concentrations of compounds and metals analysed by ICP-AES in original soils from Site I and Site II.
Element Sample Site I tot Site II tot
SiO2 % TS 59.9 63.1
Al2O3 % TS 11.4 12.9
CaO % TS 1.59 1.02
Fe2O3 % TS 2.41 2.22
K2O % TS 2.48 3.97
MgO % TS 0.621 0.337
MnO % TS 0.0386 0.0333
Na2O % TS 2.3 2.73
P2O5 % TS 0.0483 0.0544
TiO2 % TS 0.552 0.27
Summa % TS 81.3 86.6
LOI 1000°C % TS 4.7 7.1
As mg/kg TS 0.416 0.604
Ba mg/kg TS 526 777
Be mg/kg TS 1.42 1.92
Cd mg/kg TS 0.0349 0.0733
Co mg/kg TS 2.06 1.11
Cr mg/kg TS 25.7 27.6
Cu mg/kg TS 2390 2200
Hg mg/kg TS <0.04 <0.04
Nb mg/kg TS 9.34 8.58
Ni mg/kg TS 3.86 2.43
Pb mg/kg TS 8.23 5.92
S mg/kg TS 192 70.5
Sc mg/kg TS 8.34 3.72
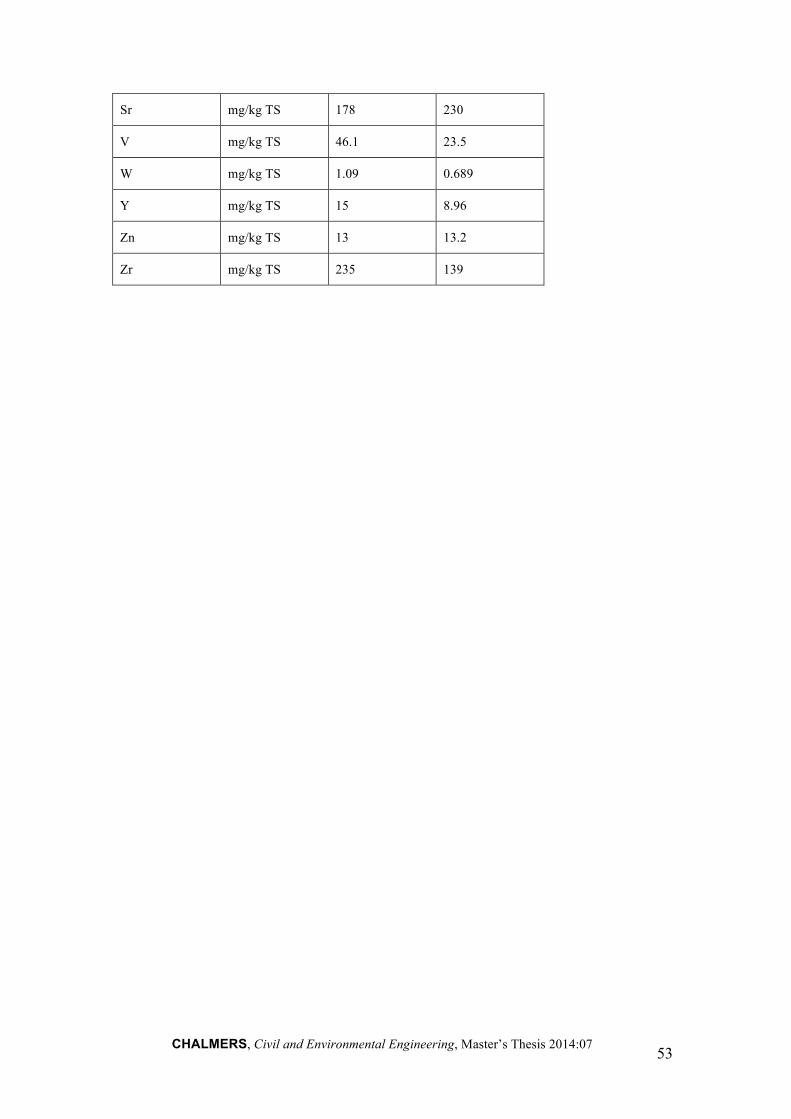
CHALMERS, Civil and Environmental Engineering, Master’s Thesis 2014:07 53
Sr mg/kg TS 178 230
V mg/kg TS 46.1 23.5
W mg/kg TS 1.09 0.689
Y mg/kg TS 15 8.96
Zn mg/kg TS 13 13.2
Zr mg/kg TS 235 139