soil types fundamental soil properties
DESCRIPTION
soil and qualityTRANSCRIPT

Soil Types and Fundamental Soil Properties of a Costa RicanTropical Montane Cloud Forest
Reserva CloudbridgeSan Gerardo de Rivas, Cordillera de Talamancas
Charles SchembreFebruary, 2009
TABLE OF CONTENTS
1. Introduction…………………………………………………………………………… 1
2. Materials and Methods
2.1 Site description………………………………………………………..……... 1
2.2 Soil Morphological Descriptions and Taxonomic Classification……..……... 2
2.3 Chemical Analysis……………………………………………….…………… 2
2.4 Soil Pit Locations……………………………………………………………..3
3. Results and Interpretation
3.1 Field Observations…………………………………………………………… 4
3.2 Soil Morphological Characteristics and Basic Physical Properties………… 4
3.2b Old Growth and Secondary Growth Soil Morphological Comparison…….. 6
3.3 The Soil Types and Classification…………………………………………….8
3.3b Soil Type Discussion………………………………………………………... 9
3.3c Old Growth and Secondary Growth Soil Type Comparison………………... 10
3.4 Chemical Analysis…………………………………………………………… 11
3.4a Site description of the six selected soils for chemical analysis…………….. 11
3.4b Percent Organic Matter and Carbon………………………………………... 14
3.4c Nitrogen and the Carbon-Nitrogen Ratio…………………………………… 15
3.4d Phosphorus and Exchangeable Potassium………………………………….. 16
3.4e Metal Micronutrients Iron, Zinc, Copper, Manganese……………………… 17
3.4f pH…………………………………………………………………………… 17
3.4g Cation exchange capacity (CEC) and percent base saturation (BS %)……... 18
3.4h Temperature…………………………………………………………………. 20
4. Conclusion and Discussion……………………………………………………………20
5. Acknowledgements……………………………………………………………………22
6. References……………………………………………………………………………. 23
7. Appendix Data………………………………………………………………………...25
1. INTRODUCTION
The condition of soil is one the most important factors in the productivity of forest ecosystems and the hydrologic functioning of watersheds. Agricultural practices and operations in the tropics are notoriously correlated with the rapid destruction of forest ecosystems and rapid biodiversity declination of flora and fauna. Tropical Montane Cloud Forests (TMCF) are among one of the most threatened ecosystems in the world due to land clearing for grazing and other agricultural operations (Churchill et al.,1995; Webster, 1995; Rzedowski, 1996; Bruijnzeel and Hamilton, 2000). When forests are cleared, and replaced by grazing, considerable changes occur to the natural physical and chemical properties of the soil. If attentive soil management is lacking the land becomes exhausted and infertile. The result is an abandonment of the land, whereupon new land is cleared and the process of grazing, land exhaustion and abandonment is repeated. When deforested land is abandoned it regenerates in successional stages, which can be easily observed by varying stages of vegetation reestablishment. During this process the soil, in conjunction will regenerate, restoring natural physical properties, chemical processes, and the microbial population. In three different locations in a TMCF a study revealed an increase in soil O-horizon thickness, a decrease in soil pH and a decrease in N/P ratio with increasing age of forest regeneration (Bautista-Cruz and Castillo, 2005).
Soil health, soil biological, physical, and chemical processes are intimately correlated with the quality of plant growth. Acquiring a fundamental knowledge about soil properties is invaluable for success in reforestation management. The reforestation of TMCF in Costa Rica is heightening. However, scarce research has been conducted on soils of these ecosystems (Bautista-Cruz and Castillo, 2005). Acquiring a solid fundamental knowledge about the soils of a given area can be achieved by conducting a soil survey. A soil survey attempts to identify unique soil bodies (Boul et al., 2003) based on their morphological, physical, chemical and biological characteristics using topography, vegetation, climate, parent material and development over time as interpretative tools for locating representative positions on the landscape for soil analysis. Of the available literature on soil identification in TMCF of Costa Rica, Monteverde Cloud Forest Reserve identified Dstrandepts, Histosols and arboreal Histosols (Vance and Nadkarni, 1989); on the Atlantic slopes of the Corderilla de Talamancas between 2800-3000m elevation, Placuands, Hapludands, Humitropepts, and humi-andic regosols were identified based on the FAO classification system (Van Uffelen, 1991; Kennis and De Vries, 1993); and in a Bolivian Lower Tropical Montane Forest (1700-2100 m a.s.l) Dystrudepts were identified as the dominant soil type (Bautista-Cruz and Castillo, 2005).
In this study a general soil analysis was conducted at Reserva Cloudbridge in Costa Rica. The objectives included: a) identifying the soil types of primary growth, secondary growth and a failed plantation site; b) obtaining a fundamental baseline knowledge of the soil chemical properties; and c) to compare the soil properties and morphological characteristics of primary growth versus secondary growth. A comparison analysis of the soils from the three differing vegetation communities provides an understanding of soil succession in conjunction with forest regeneration and illuminates soil properties that are ideal for forest regeneration. This write up is also intended to be an educational tool for Reserva Cloudbridge providing basic definitions and insight to help guide the non-professional soil scientist comfortably through the research.
2. MATERIALS AND METHODS
2.1 Site Description
The study area, Reserva Cloudbridge, is located at 9º28'N and 83º34'W in San Gerardo de
1
Rivas, Costa Rica on the Pacific slopes of the Corderilla de Talamancas. The reserve is approximately 220 hectares (600 acres). Elevation ranges from roughly 1500m to 2600m. Topography is steep ranging from 10-60 percent. Mean annual precipitation is 4370 mm yr-1
(Giddy, 2006). The local geology is Tertiary intrusive rock, granite and rhyolite an extrusive igneous rock (Schruben, 1996). The study was conducted between 1450m to 2100m in Cloudbridge Sur. Cloudbridge Sur is composed of old growth Tropical Montane Cloud Forest vegetation in the higher elevations with patches found at lower elevations and along streams. Alnus acuminata, Cecropia polyphlebia, Cedrela tonduzii, Citharexylum donnell-smithii, Cornus disciflora, Manilkara zapota, Quercus costaricensis, Sapium pachystachys, Ulmus mexicana are among the most conspicuous species of the TMCF old growth. Lower elevations are primarily secondary growth vegetation of natural regeneration and plantations. The most common plantation species include Ulmus mexicana, Cedrela tonduzii, Billia hippocastanum, Persea schiedeana, Quercus rapurahuensis, Inga oerstediana, Ocotea/Nectandra spp., Sapium pachystachis, Viburnum costaricanum, Ehretia latifolia, Alnus acuminata, Cecropia polyphlebia.
Six soil pedons from old growth forest and six soil pedons from secondary growth vegetation were analyzed in the field. The secondary growth vegetation is composed of communities that have been regenerating for 6 yrs and only 2 yrs. Areas that were managed for agriculture were primarily corn, field beans, and cow pasture.
2.2 Soil Morphological Descriptions and Taxonomic Classification
Twelve soil pits were hand dug to a sufficient depth for a soil pedon description. One hundred and fifty centimeters was considered a sufficient depth unless an identifiably significant change in the soil pedon occurred near 150 cm in depth, then a new appropriate depth would be achieved. Often 150 cm was not achievable due to large glacial or river deposited boulders. The width of the pit was made wide enough to allow a person to comfortably perform field descriptions. Parameters for recording and describing the soil morphological characteristics emulated the format provided by the Field Book for Describing and Sampling Soils Version 2.0, issued by the Natural Resource Conservation Service of the United States Department of Agriculture (NRCS-USDA). A soil pedon description sheet was completed for each soil (Appendix). All soil horizons for each soil pedon was collected in zip lock bags for thorough textural and color analysis in the lab. Soils were passed through a 2-mm sieve for textural analysis. Soil texture was determined using the NRCS textural triangle classification. Clay percentage was estimated by using the wire and ribbon method. Clay films were identified using a 10X-hand lens. Color was determined by the Munsel Color Chart. Soil temperature was measure at a depth of 50 cm in soil profile. Slope was measured by a clinometer and aspect was measured determined by a hand compass. Soils were taxonomically classified accordingly to the Keys to Soil Taxonomy 10th Edition issued by the NRCS-USDA.
2.3 Chemical Analysis
A 500-gram sample of each A-horizon and first B-horizon from every soil was collected. Soils 1, 3, 8,10, 11, and 12 were selected for lab analysis. A soil was chosen for lab analysis based on it's unique and or ideal representative characteristics. Ideal characteristics were based on soil depth, distinctiveness of horizonation, organic-horizon depth, and the physical matureness of the corresponding vegetation community. Chemical analysis was conducted at Earth University's Soil and Water laboratory. Potassium (K), Calcium (Ca), Magnesium (Mg), Iron (Fe), Copper (Cu), Zinc (Zn), and Manganese (Mn) were measured by Atomic Absorption; Phosphorus (P) was
2
measured by the Colorimeter Method with Ammonium Molybdate [(NH4)6Mo7O24.4H2O] and
Stannous Chloride (SnCl2); Carbon ( C ) and Nitrogen (N) were measured by a CHN Analyzer (Dumas Method); the Cation Exchange Capacity (CEC) was estimate by extraction with Ammonium Acetate (NH4OAc). Base saturation percentage is expressed by the sum of cations divided by the CEC. The chemical analysis was not analyzed in great detail. The results are intented to illustrate the basic properties of old growth soils and secondary growth soils. No hypotheses were formulated for explaining why and how chemical differences exist between old growth and secondary growth.
2.4 Soil Pit Locations
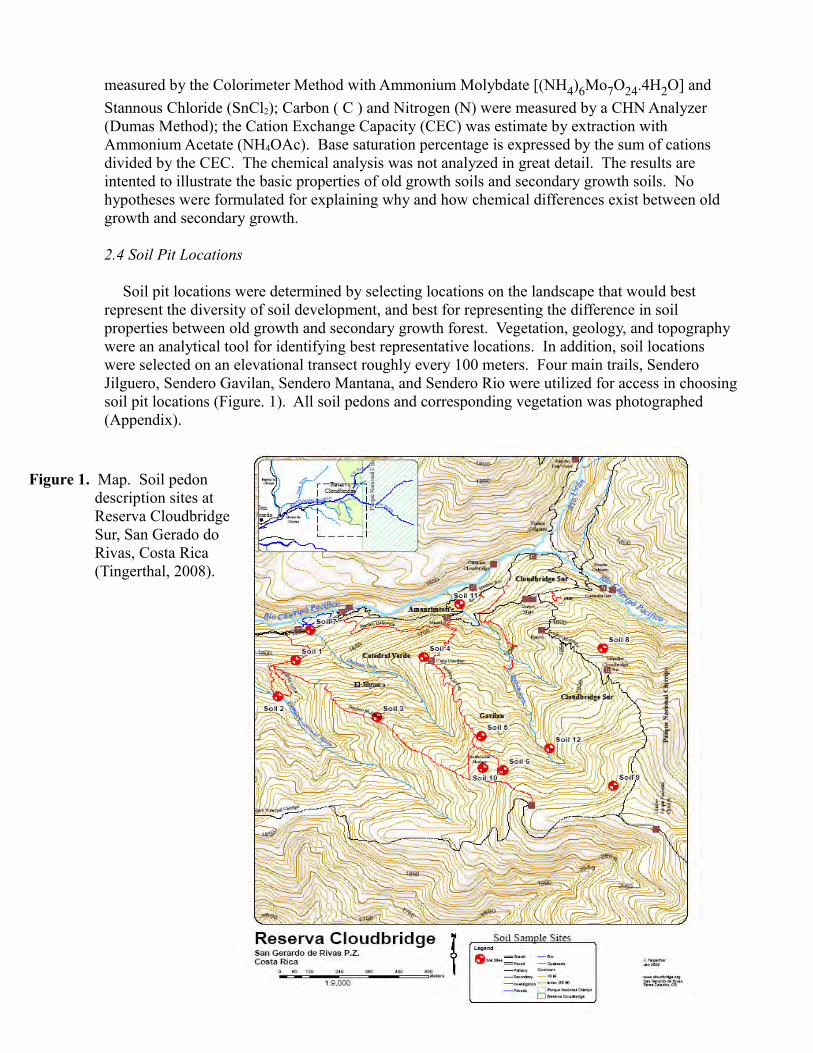
Soil pit locations were determined by selecting locations on the landscape that would best represent the diversity of soil development, and best for representing the difference in soil properties between old growth and secondary growth forest. Vegetation, geology, and topography were an analytical tool for identifying best representative locations. In addition, soil locations were selected on an elevational transect roughly every 100 meters. Four main trails, Sendero Jilguero, Sendero Gavilan, Sendero Mantana, and Sendero Rio were utilized for access in choosing soil pit locations (Figure. 1). All soil pedons and corresponding vegetation was photographed (Appendix).
3
Figure 1. Map. Soil pedon description sites at Reserva Cloudbridge Sur, San Gerado do Rivas, Costa Rica (Tingerthal, 2008).
3. RESULTS AND INTERPRETATION
3.1 Field Observations
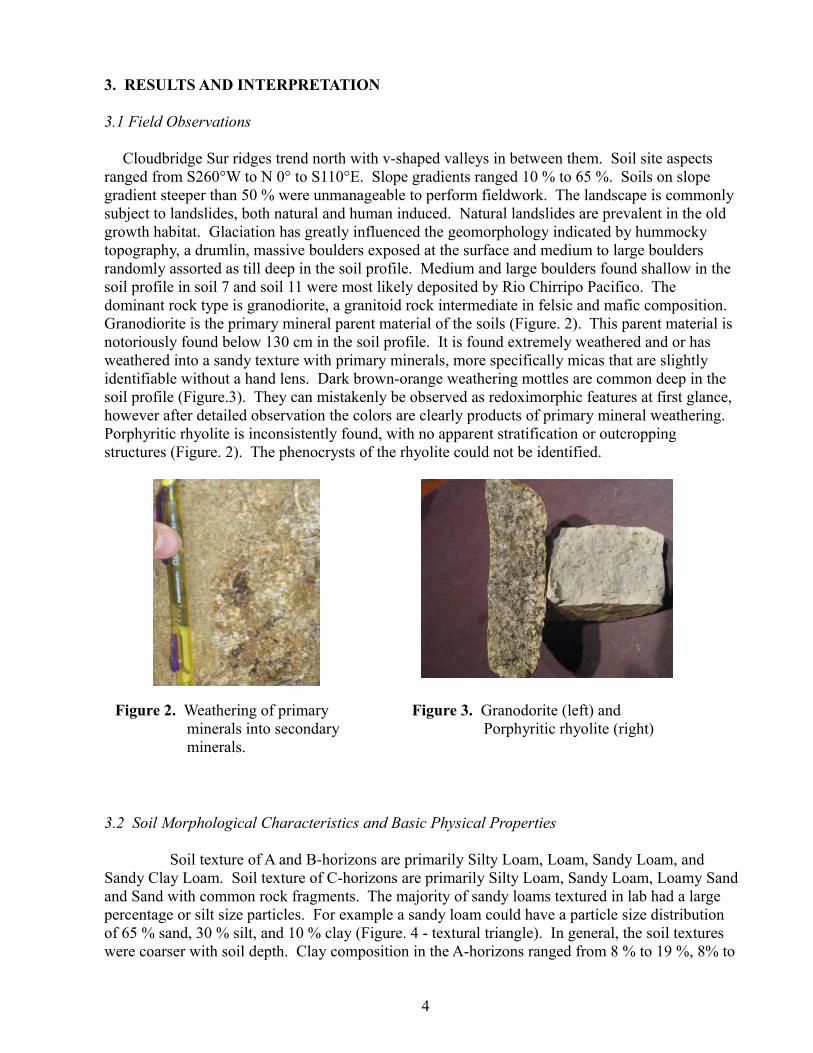
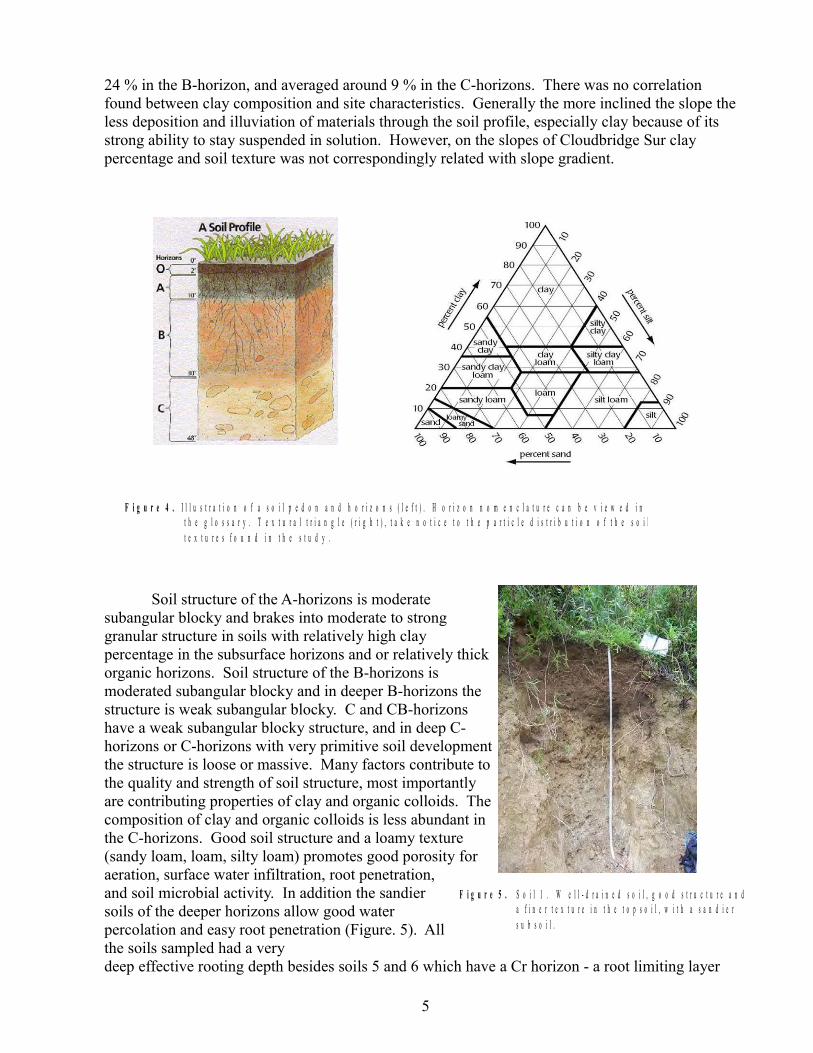
Cloudbridge Sur ridges trend north with v-shaped valleys in between them. Soil site aspects ranged from S260°W to N 0° to S110°E. Slope gradients ranged 10 % to 65 %. Soils on slope gradient steeper than 50 % were unmanageable to perform fieldwork. The landscape is commonly subject to landslides, both natural and human induced. Natural landslides are prevalent in the old growth habitat. Glaciation has greatly influenced the geomorphology indicated by hummocky topography, a drumlin, massive boulders exposed at the surface and medium to large boulders randomly assorted as till deep in the soil profile. Medium and large boulders found shallow in the soil profile in soil 7 and soil 11 were most likely deposited by Rio Chirripo Pacifico. The dominant rock type is granodiorite, a granitoid rock intermediate in felsic and mafic composition. Granodiorite is the primary mineral parent material of the soils (Figure. 2). This parent material is notoriously found below 130 cm in the soil profile. It is found extremely weathered and or has weathered into a sandy texture with primary minerals, more specifically micas that are slightly identifiable without a hand lens. Dark brown-orange weathering mottles are common deep in the soil profile (Figure.3). They can mistakenly be observed as redoximorphic features at first glance, however after detailed observation the colors are clearly products of primary mineral weathering. Porphyritic rhyolite is inconsistently found, with no apparent stratification or outcropping structures (Figure. 2). The phenocrysts of the rhyolite could not be identified.
3.2 Soil Morphological Characteristics and Basic Physical Properties
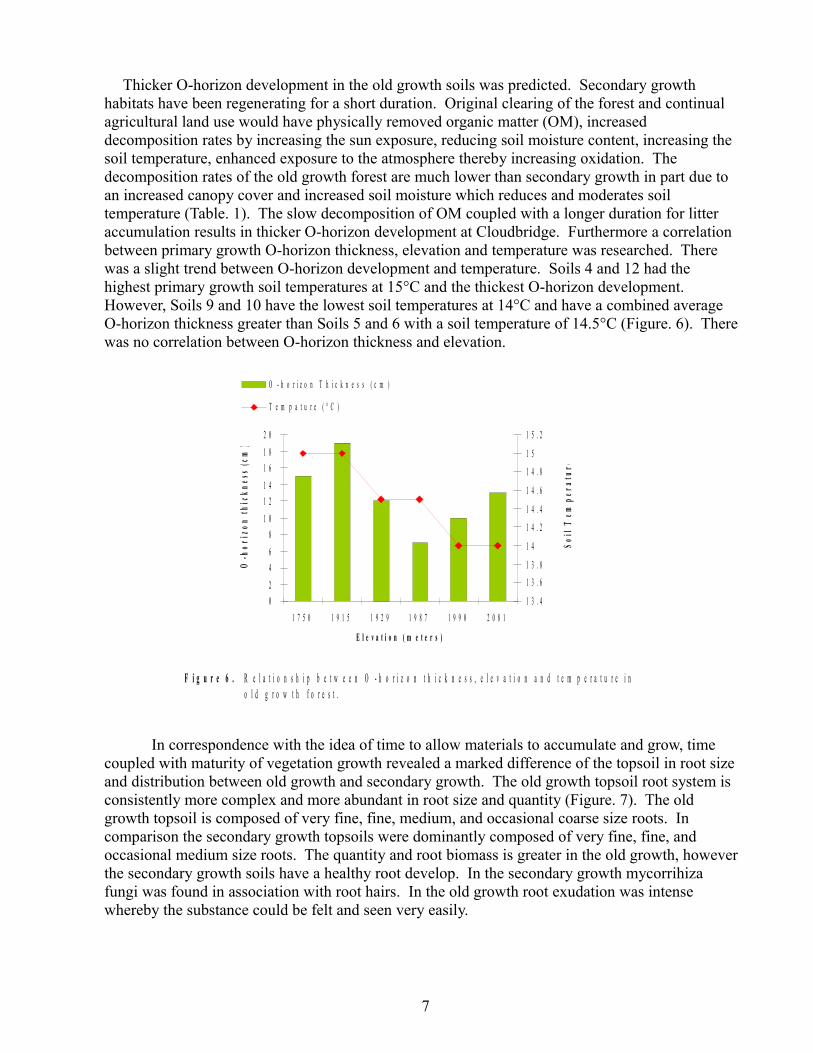
Soil texture of A and B-horizons are primarily Silty Loam, Loam, Sandy Loam, and Sandy Clay Loam. Soil texture of C-horizons are primarily Silty Loam, Sandy Loam, Loamy Sand and Sand with common rock fragments. The majority of sandy loams textured in lab had a large percentage or silt size particles. For example a sandy loam could have a particle size distribution of 65 % sand, 30 % silt, and 10 % clay (Figure. 4 - textural triangle). In general, the soil textures were coarser with soil depth. Clay composition in the A-horizons ranged from 8 % to 19 %, 8% to
4
Figure 2. Weathering of primary minerals into secondary minerals.
Figure 3. Granodorite (left) and Porphyritic rhyolite (right)
24 % in the B-horizon, and averaged around 9 % in the C-horizons. There was no correlation found between clay composition and site characteristics. Generally the more inclined the slope the less deposition and illuviation of materials through the soil profile, especially clay because of its strong ability to stay suspended in solution. However, on the slopes of Cloudbridge Sur clay percentage and soil texture was not correspondingly related with slope gradient.
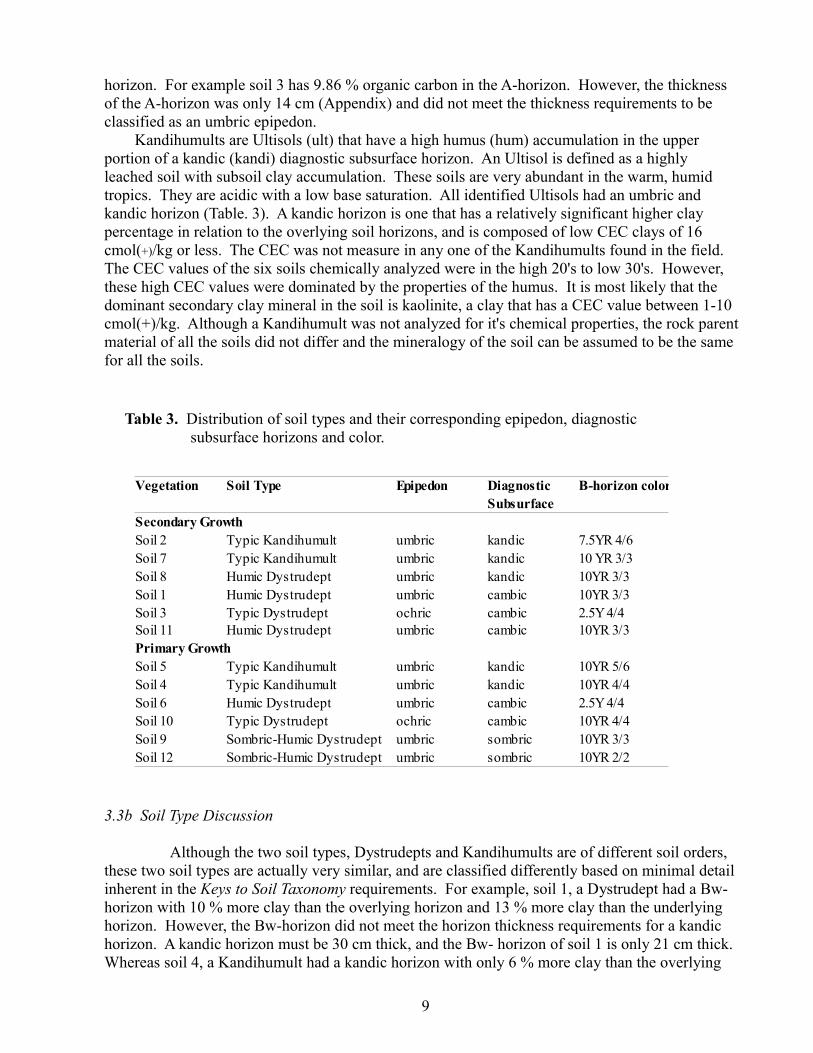
Soil structure of the A-horizons is moderate subangular blocky and brakes into moderate to strong granular structure in soils with relatively high clay percentage in the subsurface horizons and or relatively thick organic horizons. Soil structure of the B-horizons is moderated subangular blocky and in deeper B-horizons the structure is weak subangular blocky. C and CB-horizons have a weak subangular blocky structure, and in deep C-horizons or C-horizons with very primitive soil development the structure is loose or massive. Many factors contribute to the quality and strength of soil structure, most importantly are contributing properties of clay and organic colloids. The composition of clay and organic colloids is less abundant in the C-horizons. Good soil structure and a loamy texture (sandy loam, loam, silty loam) promotes good porosity for aeration, surface water infiltration, root penetration, and soil microbial activity. In addition the sandier soils of the deeper horizons allow good water percolation and easy root penetration (Figure. 5). All the soils sampled had a very deep effective rooting depth besides soils 5 and 6 which have a Cr horizon - a root limiting layer
5
F i g u r e 4 . I l l u s t r a t i o n o f a s o i l p e d o n a n d h o r i z o n s ( l e f t ) . H o r i z o n n o m e n c l a t u r e c a n b e v i e w e d i nt h e g l o s s a r y . T e x t u r a l t r i a n g l e ( r i g h t ) , t a k e n o t i c e t o t h e p a r t i c l e d i s t r i b u t i o n o f t h e s o i lt e x t u r e s f o u n d i n t h e s t u d y .
F i g u r e 5 . S o i l 1 . W e l l - d r a i n e d s o i l , g o o d s t r u c t u r e a n da f i n e r t e x t u r e i n t h e t o p s o i l , w i t h a s a n d i e rs u b s o i l .

(Appendix). The combined properties of the soil texture and structure of the soils have very
important implications for the ecosystem and watershed hydrologic functioning of Cloudbridge. The soils are well drained and have a high to moderately high surface and subsurface hydraulic conductivity, therefore daily precipitation quickly moves through the soil profile into the groundwater, following the steep topography into streams and then into the main drainage, Rio Chirripo Pacifico. Fast drainage and good porosity allow the soils to stay in an aerobic state. No soils pedons observed had aquic properties, which would indicate a rising and falling water table, and periodic anaerobic conditions. However, soil 11 located on the terraces of Rio Chirripo Pacifico was sampled outside of a small meadow-marshland (Figure. 1). In the marshland water is free standing at the soil surface. During the dry season the water table in the marshland most likely drops allowing the surface horizon to function in an aerobic state. Much of the microbial environment and important chemical processes for plant growth function optimally when aerobic conditions persist.
3.2b Old Growth and Secondary Growth Soil Morphological Comparison
The only major morphological difference between old growth and secondary growth soils was the combined thickness of the O-horizons and decomposition stages of the O-horizons. Old growth forests had a mean combined O-horizon thickness of 12.8 cm and the secondary growth had a mean of 9.2 cm. Soil 8 a failed plantation site had an organic horizon of 4 cm (Table. 1).
Old growth soils had at least two O-horizons at different stages of composition and Soil 12 had three O-horizons at differing stages of decomposition (Table. 2). Whereas the secondary soils all had one O-horizon besides Soil 11 located in a meadow-grassland vegetation community, which had three O-horizons at varying stages of decomposition. It is very common for grassland vegetation communities to build thick horizons of organic matter. Other than Soil 12 there were no Oa-horizons found in the secondary growth soils, only Oi and Oe-horizons. Whereas, four out of the six old growth soils have an Oa-horizon.
6
O-horizon sub-desgination Decomposition stagei Slightly decomposed, leaf litter w/ identifiable plant fibers.e Moderately decomposed, plant fibers barely identiifable.a Highly decomposed, plant fibers not identifiable (humus).
Veg. Growth Mean 0-horizon thickness (cm) Mean Soil Temp (°C)Failed Plantation 4 14.5Secondary 9.2 17.3Primary TMCF 12.8 14.5
T a b l e 1 . M e a n O - h o r i z o n o f o l d g r o w t h f o r e s t , s e c o n d a r y f o r e s t , a n d a f a i l e d p l a n t a t i o n .
T a b l e 2 . S u b - d e s i g n a t i o n n o m e n c l a t u r e o f t h e O - h o r i z o n .
Thicker O-horizon development in the old growth soils was predicted. Secondary growth habitats have been regenerating for a short duration. Original clearing of the forest and continual agricultural land use would have physically removed organic matter (OM), increased decomposition rates by increasing the sun exposure, reducing soil moisture content, increasing the soil temperature, enhanced exposure to the atmosphere thereby increasing oxidation. The decomposition rates of the old growth forest are much lower than secondary growth in part due to an increased canopy cover and increased soil moisture which reduces and moderates soil temperature (Table. 1). The slow decomposition of OM coupled with a longer duration for litter accumulation results in thicker O-horizon development at Cloudbridge. Furthermore a correlation between primary growth O-horizon thickness, elevation and temperature was researched. There was a slight trend between O-horizon development and temperature. Soils 4 and 12 had the highest primary growth soil temperatures at 15°C and the thickest O-horizon development. However, Soils 9 and 10 have the lowest soil temperatures at 14°C and have a combined average O-horizon thickness greater than Soils 5 and 6 with a soil temperature of 14.5°C (Figure. 6). There was no correlation between O-horizon thickness and elevation.
In correspondence with the idea of time to allow materials to accumulate and grow, time coupled with maturity of vegetation growth revealed a marked difference of the topsoil in root size and distribution between old growth and secondary growth. The old growth topsoil root system is consistently more complex and more abundant in root size and quantity (Figure. 7). The old growth topsoil is composed of very fine, fine, medium, and occasional coarse size roots. In comparison the secondary growth topsoils were dominantly composed of very fine, fine, and occasional medium size roots. The quantity and root biomass is greater in the old growth, however the secondary growth soils have a healthy root develop. In the secondary growth mycorrihiza fungi was found in association with root hairs. In the old growth root exudation was intense whereby the substance could be felt and seen very easily.
7
0
2
4
6
8
1 0
1 2
1 4
1 6
1 8
2 0
1 7 5 0 1 9 1 5 1 9 2 9 1 9 8 7 1 9 9 0 2 0 8 1
E l e v a t i o n ( m e t e r s )
O-h
ori
zon
thi
ckne
ss (
cm)
1 3 . 4
1 3 . 6
1 3 . 8
1 4
1 4 . 2
1 4 . 4
1 4 . 6
1 4 . 8
1 5
1 5 . 2
Soil
Tem
pera
ture
O - h o r i z o n T h i c k n e s s ( c m )
T e m p a t u r e ( ° C )
F i g u r e 6 . R e l a t i o n s h i p b e t w e e n O - h o r i z o n t h i c k n e s s , e l e v a t i o n a n d t e m p e r a t u r e i no l d g r o w t h f o r e s t .

3.3 The Soil Types and Classification
Two soil types were identified in Cloudbridge Sur: Dystrudepts and Kandihumults (Table.4). Dystrudepts are Inceptisols (ept) formed in an Udic (ud) moisture regime and are highly leached of basic cations resulting in a low base saturation (Dystr). (Base saturation and other chemical properties are discussed in the chemical property section below). Inceptisols are defined as mineral soils with weak sub soil development. (Boul et al., 2003). Weak sub soil development lacks abundant illuviation of material. Inceptisols are characteristic of having a cambic diagnostic subsurface horizon. A cambic horizon is a result of physical alterations, chemical transformations, and removals (Soil Survey Staff, 2006). It is a horizon that is undergoing many pedogenic processes, including accumulation of illuviated materials, but does not have a significant degree of accumulation to meet the requirements of any other diagonistic subsurface horizon. Inceptisols are commonly found in cool, wet climates, on steep terrain and form over parent material that is resistant to weathering. Grandiorite, the dominant rock type in the studied area is composed of very weather resistant minerals of quartz and potassium feldspars, and weatherable minerals of biotite and hornblende.
Dystrudepts were further classified as either a Typic Dystrudept or a Humic Dystrudept (Table.4). A Humic Dystrudept is an Inceptisol that has an umbric epipedon (diagnostic surface horizon). The umbric epipedon is a dark horizon with a Munsel color of a value and chroma of 3 or less, and a significant composition of organic carbon (humus). Soils 9 and 11 are Humic Dystrudepts that have a Sombric horizon - an accumulation of illuviated humus in a subsurface horizon (B-horizon). A Sombric horizon is an exception to the Inceptisol definition in being devoid of illuviated material. Sombric horizons are generally restricted to cool, moist soils in mountains in tropical or subtropical climates (Soil Survey Staff, 2006). The Keys to Soil Taxonomy does not have a unique naming classification for a Dystrudept with a sombric horizon. For purpose of differentiation clarity, Soils 9 and 11 will be referred to as Sombric-Humic Dystrudepts. Typic Dystrudepts are Inceptisols that had an ochric epipedon and do not have an umbric epipedon. An ochric epipedon differs from an umbric in that the color is too light, or the horizon is dark enough but is too thin. It is important to note the soils that did not meet the Humic (umbric) qualifications were not devoid of organic horizons or organic carbon in the surface
8
F i g u r e 7 . O l d g r o w t h a n d s e c o n d a r y g r o w t h t o p s o i l a n d r o o t s y s t e m , S o i l 4 ( l e f t ) , S o i l 1 ( r i g h t ) .
horizon. For example soil 3 has 9.86 % organic carbon in the A-horizon. However, the thickness of the A-horizon was only 14 cm (Appendix) and did not meet the thickness requirements to be classified as an umbric epipedon.
Kandihumults are Ultisols (ult) that have a high humus (hum) accumulation in the upper portion of a kandic (kandi) diagnostic subsurface horizon. An Ultisol is defined as a highly leached soil with subsoil clay accumulation. These soils are very abundant in the warm, humid tropics. They are acidic with a low base saturation. All identified Ultisols had an umbric and kandic horizon (Table. 3). A kandic horizon is one that has a relatively significant higher clay percentage in relation to the overlying soil horizons, and is composed of low CEC clays of 16 cmol(+)/kg or less. The CEC was not measure in any one of the Kandihumults found in the field. The CEC values of the six soils chemically analyzed were in the high 20's to low 30's. However, these high CEC values were dominated by the properties of the humus. It is most likely that the dominant secondary clay mineral in the soil is kaolinite, a clay that has a CEC value between 1-10 cmol(+)/kg. Although a Kandihumult was not analyzed for it's chemical properties, the rock parent material of all the soils did not differ and the mineralogy of the soil can be assumed to be the same for all the soils.
3.3b Soil Type Discussion
Although the two soil types, Dystrudepts and Kandihumults are of different soil orders, these two soil types are actually very similar, and are classified differently based on minimal detail inherent in the Keys to Soil Taxonomy requirements. For example, soil 1, a Dystrudept had a Bw-horizon with 10 % more clay than the overlying horizon and 13 % more clay than the underlying horizon. However, the Bw-horizon did not meet the horizon thickness requirements for a kandic horizon. A kandic horizon must be 30 cm thick, and the Bw- horizon of soil 1 is only 21 cm thick. Whereas soil 4, a Kandihumult had a kandic horizon with only 6 % more clay than the overlying
9
Vegetation Soil Type Diagnostic B-horizon colorSubsurface
Secondary GrowthSoil 2 7.5YR 4/6Soil 7 10 YR 3/3Soil 8 10YR 3/3Soil 1 10YR 3/3Soil 3 2.5Y 4/4Soil 11 10YR 3/3Primary GrowthSoil 5 10YR 5/6Soil 4 10YR 4/4Soil 6 2.5Y 4/4Soil 10 10YR 4/4Soil 9 10YR 3/3Soil 12 10YR 2/2
Epipedon
Typic Kandihumult umbric kandicTypic Kandihumult umbric kandicHumic Dystrudept umbric kandicHumic Dystrudept umbric cambicTypic Dystrudept ochric cambicHumic Dystrudept umbric cambic
Typic Kandihumult umbric kandicTypic Kandihumult umbric kandicHumic Dystrudept umbric cambicTypic Dystrudept ochric cambicSombric-Humic Dystrudept umbric sombricSombric-Humic Dystrudept umbric sombric
Table 3. Distribution of soil types and their corresponding epipedon, diagnostic subsurface horizons and color.

horizon and 5 % more clay in the underlying horizon, but met the kandic horizon requirements because it was 41 cm thick (Table. 3). If a soil has a kandic horizon it can not be an Inceptisol.
Ultisols are soils that represent more matured soil development than an Inceptisol, and are generally thought to be found on older more stable landscapes than Inceptisols. The steep slopes of the area and noticeably fresh landslides illustrate that the landscape of the Reserve is geomorphologically active. Hillslope processes of creep, erosion and landslides actively keep soil materials moving and weathering causing morphological features to be developed and destroyed throughout space and time (Boul et al., 2003). The Ultisols that were identified are perhaps located on portions of the mountain that have been relatively stable for some time. The Ultisols identified are not characteristic of mature Ultisols. They have relatively low clay percentages, and were not characteristic of a deep red color that is quintessential to Ultisols of the warm humid climates. However, the Ultisols at Cloudbridge had slightly redder B-horizons than those of the Inceptisols (Table. 3).
It appears that the soils are in between a transitional stage of development from a mature Inceptisol to a young Ultisol. It has been noted that “in many cases the direction of soil development is evident, and one can predict that an Inceptisol will ultimately become and Ultisol” (Boul et al., 2003). In addition, Inceptisols with more-developed cambic horizons, those that have little to no present clay films are found in more mature Dystrydepts. Clay films were not identifiable in the Inceptisols, indicating that plagioclase minerals have been practically all weathered in the cambic horizon and further implicating that the Dystrudepts at Cloudbridge are in a mature state and with time and landscape stability, could develop into Ultisols.
3.3c Old Growth and Secondary Growth Soil Type Comparison
There was no correlation between the soil types and the stage of vegetation growth. This was expected. It was more strongly hypothesized that soil types would vary accordingly to landscape position. However, Soil 9 and Soil 12 were very unique from the rest of the soils in that they had
10
Horizon Boundary TextureDepth (cm) Class % Clay
Soil 1Oe 5 ~ ~A 16 SL 12AB 35 SL 14BW 56 SCL 24CB 76 LS 7C1 115 S 6C2 170 S 6
Soil 4Oi 3 ~ ~Oa 15 ~ ~A 35 L 18Bt 53 L 24
BC(t) 76 L 24BC L 19100+
Table 4. Morphological differences between a Dystrudept (Soil 1) and a Kandihimult (Soil 4)
developed a Sombric horizon. Preliminary investigation and preparation for this research developed a hypothesis predicting that in old growth forest it would be most likely to find Sombric horizons or other horizons that had an abundant accumulation of organic matter or sesquioxides. Illuviated sesquioxides was not found.
In particular, Soil 12's location felt and appeared to be of pristine old growth. The old growth habitat of Soil 12 appeared to be a little more dense than other analyzed old growth areas, and at the time of study it's location was engulfed in an evaporation mist, while the rest of the reserve was free of clouds. Interestingly, Soils 9 and 12 are on relatively steep slopes, 44% and 37% respectively, and have thick O-horizon development. Apparently the landscape has been stable long enough to accumulate appreciable illuviated organic humus into the subsurface. Although it was stated early that Inceptisols may be developing into young Ultisols, the research results clearly reveal that the ultimate state of the soil for the old growth forest in the present climatic conditions is a Sombric-Humic Dystrudept. This stage of soil development should be perceived as a state of equilibrium with the local environmental conditions when human impact is absent. In other words a Sombric-Humic Dystrudept is the optimal maturity stage for the soils in old growth cloud forest habitat at Reserva Cloudbridge.
3.4 Chemical Analysis
3.4a Site description of the six selected soils for chemical analysis
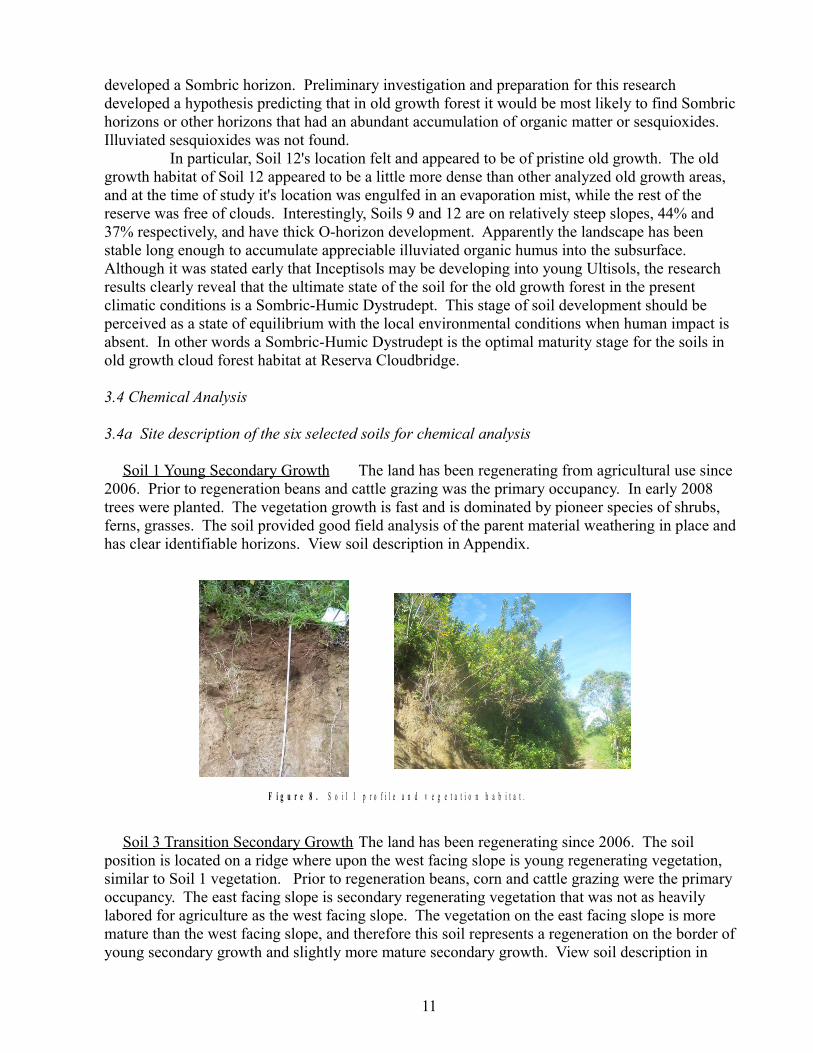
Soil 1 Young Secondary Growth The land has been regenerating from agricultural use since 2006. Prior to regeneration beans and cattle grazing was the primary occupancy. In early 2008 trees were planted. The vegetation growth is fast and is dominated by pioneer species of shrubs, ferns, grasses. The soil provided good field analysis of the parent material weathering in place and has clear identifiable horizons. View soil description in Appendix.
Soil 3 Transition Secondary Growth The land has been regenerating since 2006. The soil position is located on a ridge where upon the west facing slope is young regenerating vegetation, similar to Soil 1 vegetation. Prior to regeneration beans, corn and cattle grazing were the primary occupancy. The east facing slope is secondary regenerating vegetation that was not as heavily labored for agriculture as the west facing slope. The vegetation on the east facing slope is more mature than the west facing slope, and therefore this soil represents a regeneration on the border of young secondary growth and slightly more mature secondary growth. View soil description in
11
F i g u r e 8 . S o i l 1 p r o f i l e a n d v e g e t a t i o n h a b i t a t .
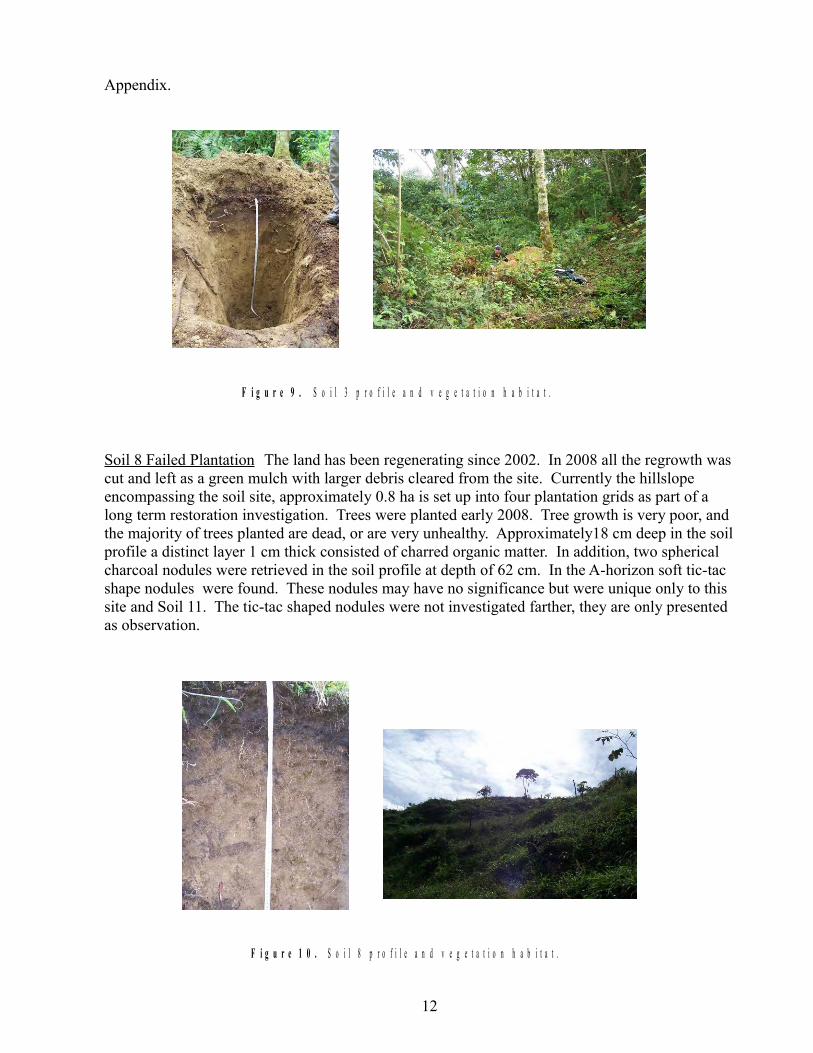
Appendix.
Soil 8 Failed Plantation The land has been regenerating since 2002. In 2008 all the regrowth was cut and left as a green mulch with larger debris cleared from the site. Currently the hillslope encompassing the soil site, approximately 0.8 ha is set up into four plantation grids as part of a long term restoration investigation. Trees were planted early 2008. Tree growth is very poor, and the majority of trees planted are dead, or are very unhealthy. Approximately18 cm deep in the soil profile a distinct layer 1 cm thick consisted of charred organic matter. In addition, two spherical charcoal nodules were retrieved in the soil profile at depth of 62 cm. In the A-horizon soft tic-tac shape nodules were found. These nodules may have no significance but were unique only to this site and Soil 11. The tic-tac shaped nodules were not investigated farther, they are only presented as observation.
12
F i g u r e 9 . S o i l 3 p r o f i l e a n d v e g e t a t i o n h a b i t a t .
F i g u r e 1 0 . S o i l 8 p r o f i l e a n d v e g e t a t i o n h a b i t a t .
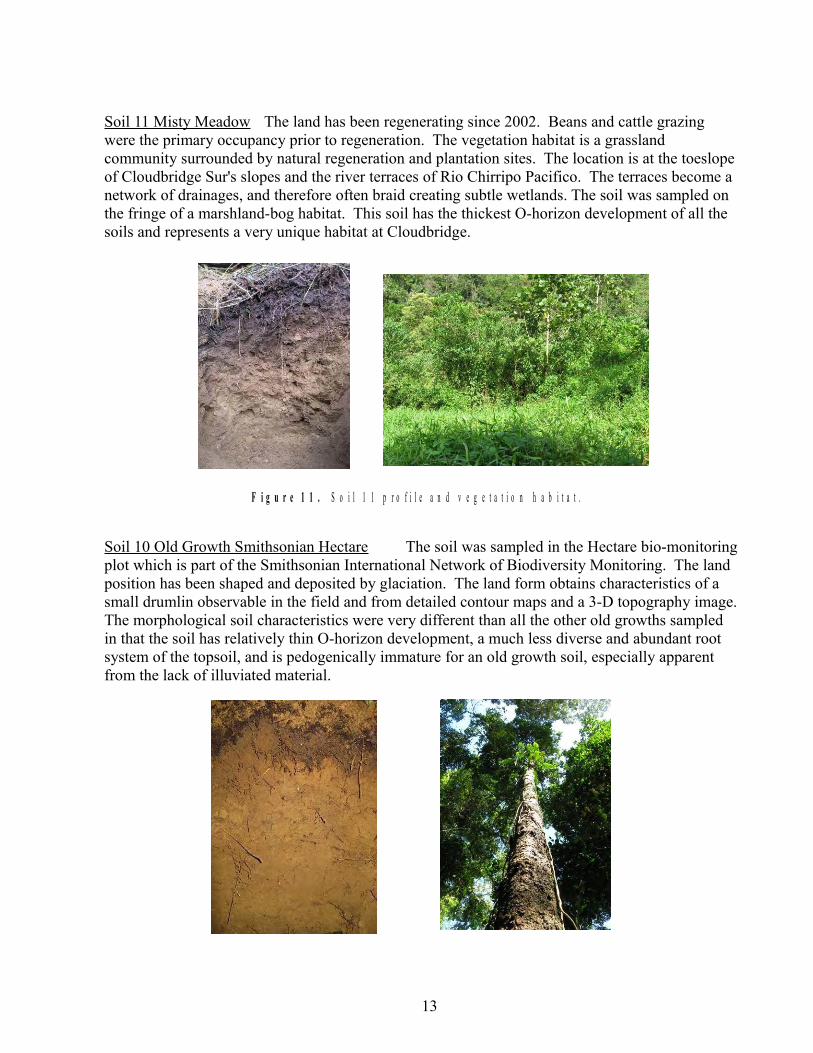
Soil 11 Misty Meadow The land has been regenerating since 2002. Beans and cattle grazing were the primary occupancy prior to regeneration. The vegetation habitat is a grassland community surrounded by natural regeneration and plantation sites. The location is at the toeslope of Cloudbridge Sur's slopes and the river terraces of Rio Chirripo Pacifico. The terraces become a network of drainages, and therefore often braid creating subtle wetlands. The soil was sampled on the fringe of a marshland-bog habitat. This soil has the thickest O-horizon development of all the soils and represents a very unique habitat at Cloudbridge.
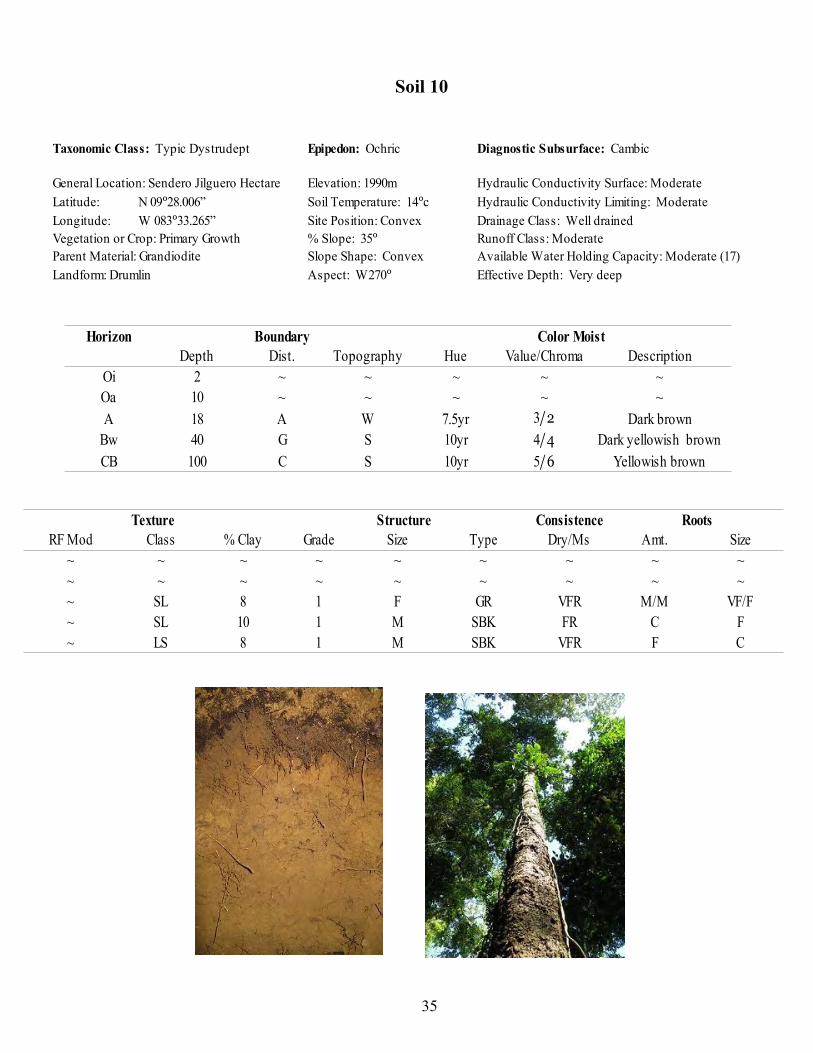
Soil 10 Old Growth Smithsonian Hectare The soil was sampled in the Hectare bio-monitoring plot which is part of the Smithsonian International Network of Biodiversity Monitoring. The land position has been shaped and deposited by glaciation. The land form obtains characteristics of a small drumlin observable in the field and from detailed contour maps and a 3-D topography image. The morphological soil characteristics were very different than all the other old growths sampled in that the soil has relatively thin O-horizon development, a much less diverse and abundant root system of the topsoil, and is pedogenically immature for an old growth soil, especially apparent from the lack of illuviated material.
13
F i g u r e 1 1 . S o i l 1 1 p r o f i l e a n d v e g e t a t i o n h a b i t a t .
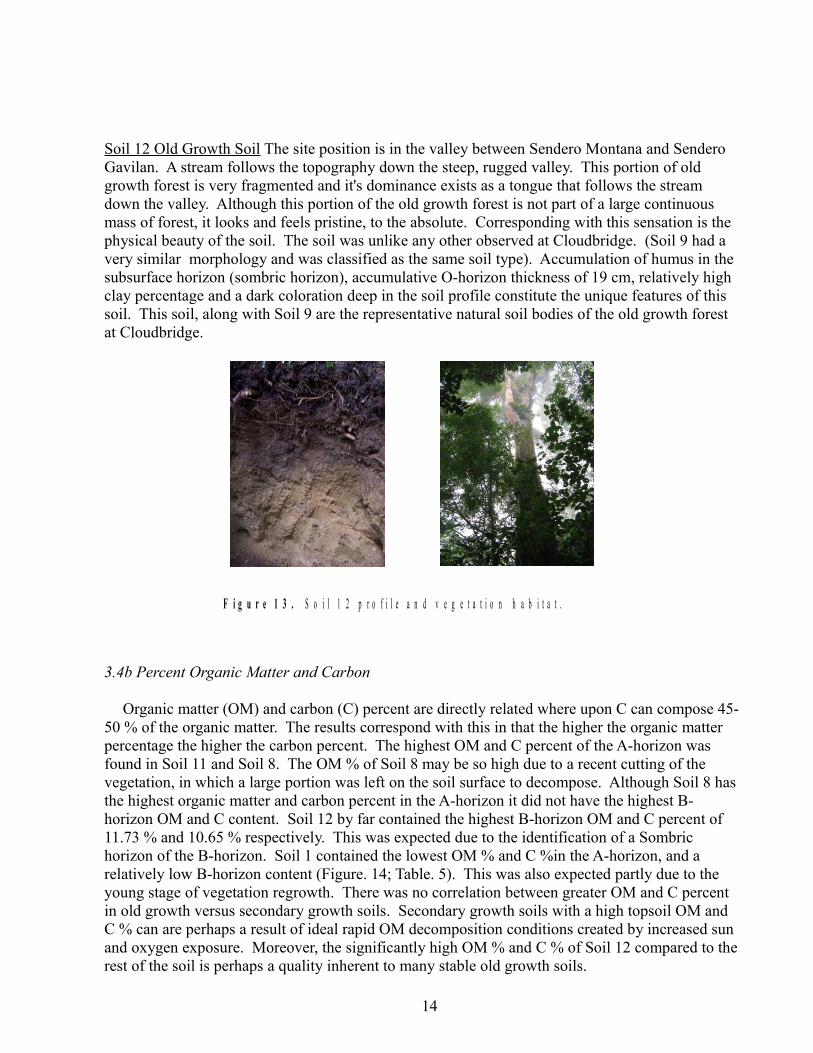
Soil 12 Old Growth Soil The site position is in the valley between Sendero Montana and Sendero Gavilan. A stream follows the topography down the steep, rugged valley. This portion of old growth forest is very fragmented and it's dominance exists as a tongue that follows the stream down the valley. Although this portion of the old growth forest is not part of a large continuous mass of forest, it looks and feels pristine, to the absolute. Corresponding with this sensation is the physical beauty of the soil. The soil was unlike any other observed at Cloudbridge. (Soil 9 had a very similar morphology and was classified as the same soil type). Accumulation of humus in the subsurface horizon (sombric horizon), accumulative O-horizon thickness of 19 cm, relatively high clay percentage and a dark coloration deep in the soil profile constitute the unique features of this soil. This soil, along with Soil 9 are the representative natural soil bodies of the old growth forest at Cloudbridge.
3.4b Percent Organic Matter and Carbon
Organic matter (OM) and carbon (C) percent are directly related where upon C can compose 45-50 % of the organic matter. The results correspond with this in that the higher the organic matter percentage the higher the carbon percent. The highest OM and C percent of the A-horizon was found in Soil 11 and Soil 8. The OM % of Soil 8 may be so high due to a recent cutting of the vegetation, in which a large portion was left on the soil surface to decompose. Although Soil 8 has the highest organic matter and carbon percent in the A-horizon it did not have the highest B-horizon OM and C content. Soil 12 by far contained the highest B-horizon OM and C percent of 11.73 % and 10.65 % respectively. This was expected due to the identification of a Sombric horizon of the B-horizon. Soil 1 contained the lowest OM % and C %in the A-horizon, and a relatively low B-horizon content (Figure. 14; Table. 5). This was also expected partly due to the young stage of vegetation regrowth. There was no correlation between greater OM and C percent in old growth versus secondary growth soils. Secondary growth soils with a high topsoil OM and C % can are perhaps a result of ideal rapid OM decomposition conditions created by increased sun and oxygen exposure. Moreover, the significantly high OM % and C % of Soil 12 compared to the rest of the soil is perhaps a quality inherent to many stable old growth soils.
14
F i g u r e 1 3 . S o i l 1 2 p r o f i l e a n d v e g e t a t i o n h a b i t a t .
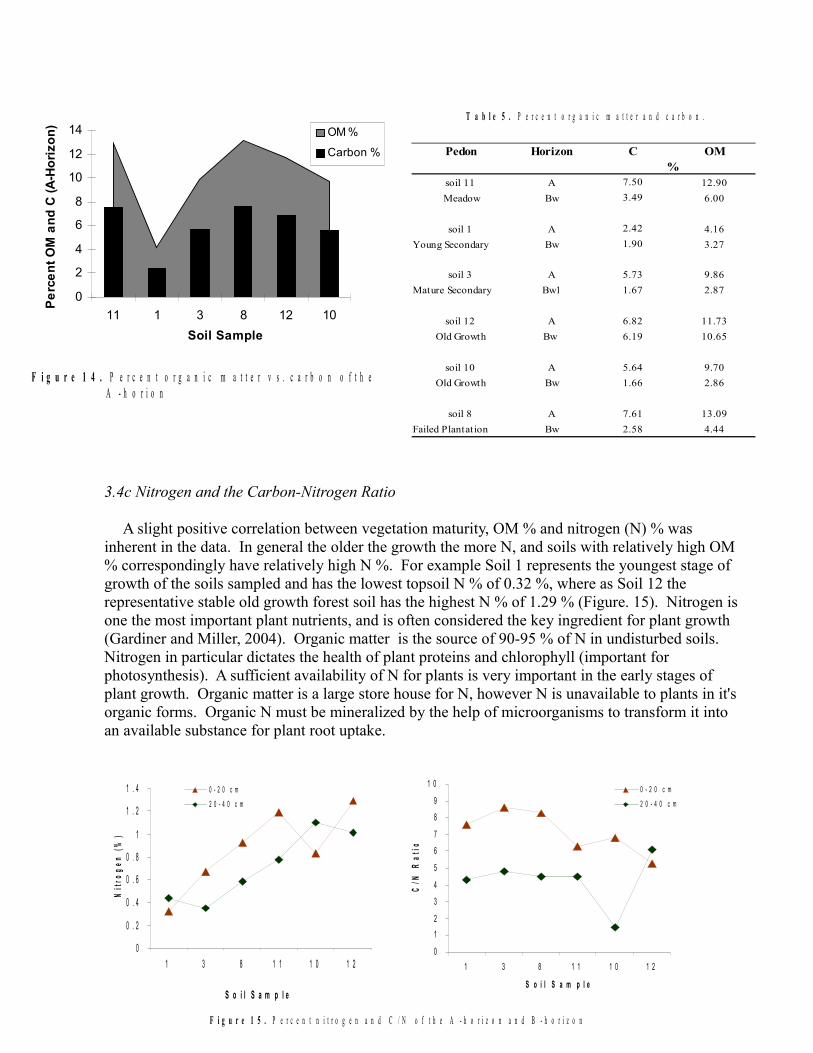
3.4c Nitrogen and the Carbon-Nitrogen Ratio
A slight positive correlation between vegetation maturity, OM % and nitrogen (N) % was inherent in the data. In general the older the growth the more N, and soils with relatively high OM % correspondingly have relatively high N %. For example Soil 1 represents the youngest stage of growth of the soils sampled and has the lowest topsoil N % of 0.32 %, where as Soil 12 the representative stable old growth forest soil has the highest N % of 1.29 % (Figure. 15). Nitrogen is one the most important plant nutrients, and is often considered the key ingredient for plant growth (Gardiner and Miller, 2004). Organic matter is the source of 90-95 % of N in undisturbed soils. Nitrogen in particular dictates the health of plant proteins and chlorophyll (important for photosynthesis). A sufficient availability of N for plants is very important in the early stages of plant growth. Organic matter is a large store house for N, however N is unavailable to plants in it's organic forms. Organic N must be mineralized by the help of microorganisms to transform it into an available substance for plant root uptake.
15
Pedon Horizon C OM%
soil 11 A 7.50 12.90
Meadow Bw 3.49 6.00
soil 1 A 2.42 4.16
Young Secondary Bw 1.90 3.27
soil 3 A 5.73 9.86
Mature Secondary Bw1 1.67 2.87
soil 12 A 6.82 11.73
Old Growth Bw 6.19 10.65
soil 10 A 5.64 9.70
Old Growth Bw 1.66 2.86
soil 8 A 7.61 13.09
Failed Plantation Bw 2.58 4.44
0
1
2
3
4
5
6
7
8
9
1 0
1 3 8 1 1 1 0 1 2
S o i l S a m p l e
C/N
Ra
tio
0 - 2 0 c m
2 0 - 4 0 c m
T a b l e 5 . P e r c e n t o r g a n i c m a t t e r a n d c a r b o n .
F i g u r e 1 4 . P e r c e n t o r g a n i c m a t t e r v s . c a r b o n o f t h eA - h o r i o n
0
0 . 2
0 . 4
0 . 6
0 . 8
1
1 . 2
1 . 4
1 3 8 1 1 1 0 1 2
S o i l S a m p l e
Nit
rog
en
(%
)
0 - 2 0 c m
2 0 - 4 0 c m
F i g u r e 1 5 . P e r c e n t n i t r o g e n a n d C / N o f t h e A - h o r i z o n a n d B - h o r i z o n
0
2
4
6
8
10
12
14
11 1 3 8 12 10
Soil Sample
Pe
rce
nt
OM
an
d C
(A
-Ho
rizo
n)
OM %
Carbon %
0
2
4
6
8
1 0
1 2
1 4
1 6
1 3 8 1 1 1 0 1 2
S o i l S a m p l e
Ph
osp
ho
rus
Co
mp
osi
tio
n (
pp
m)
0 - 2 0 c m
2 0 - 4 0 c m
0 . 0 0
0 . 0 5
0 . 1 0
0 . 1 5
0 . 2 0
0 . 2 5
0 . 3 0
0 . 3 5
1 3 8 1 1 1 0 1 2
S o i l S a m p l e
Po
tas
siu
m (
cm
ol+
/kg
so
il)
0 - 2 0 c m
2 0 - 4 0 c m
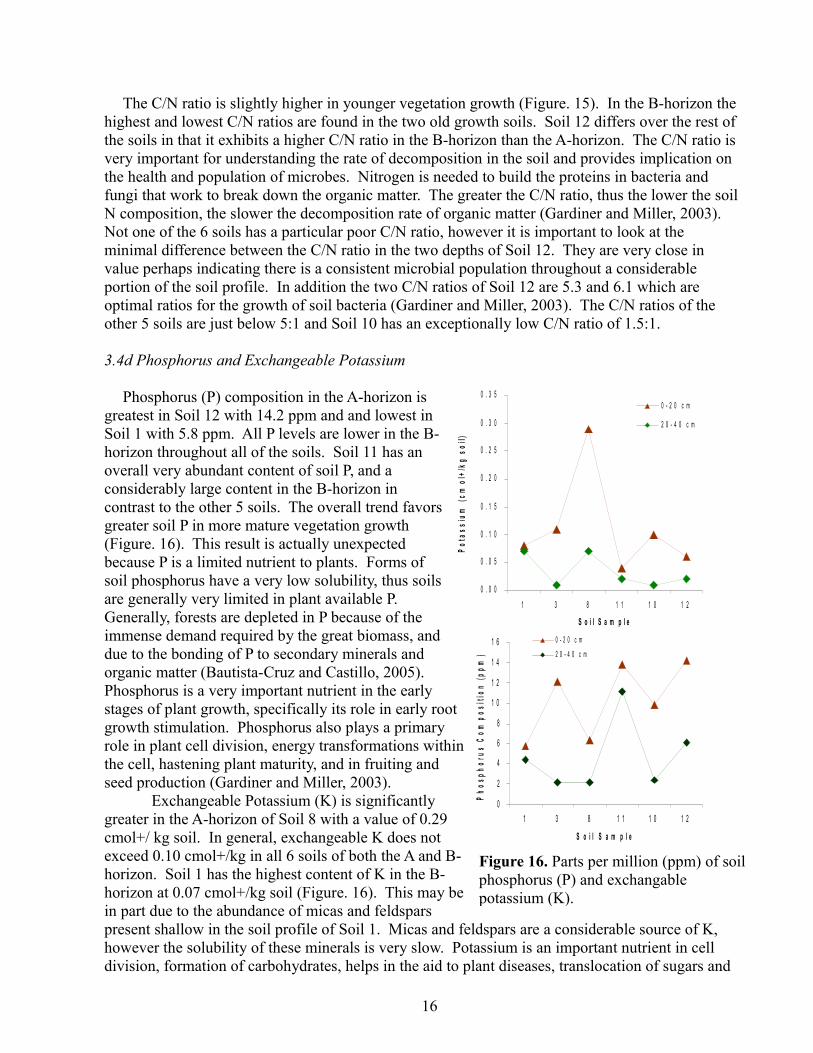
Figure 16. Parts per million (ppm) of soil phosphorus (P) and exchangable potassium (K).
The C/N ratio is slightly higher in younger vegetation growth (Figure. 15). In the B-horizon the highest and lowest C/N ratios are found in the two old growth soils. Soil 12 differs over the rest of the soils in that it exhibits a higher C/N ratio in the B-horizon than the A-horizon. The C/N ratio is very important for understanding the rate of decomposition in the soil and provides implication on the health and population of microbes. Nitrogen is needed to build the proteins in bacteria and fungi that work to break down the organic matter. The greater the C/N ratio, thus the lower the soil N composition, the slower the decomposition rate of organic matter (Gardiner and Miller, 2003). Not one of the 6 soils has a particular poor C/N ratio, however it is important to look at the minimal difference between the C/N ratio in the two depths of Soil 12. They are very close in value perhaps indicating there is a consistent microbial population throughout a considerable portion of the soil profile. In addition the two C/N ratios of Soil 12 are 5.3 and 6.1 which are optimal ratios for the growth of soil bacteria (Gardiner and Miller, 2003). The C/N ratios of the other 5 soils are just below 5:1 and Soil 10 has an exceptionally low C/N ratio of 1.5:1.
3.4d Phosphorus and Exchangeable Potassium
Phosphorus (P) composition in the A-horizon is greatest in Soil 12 with 14.2 ppm and and lowest in Soil 1 with 5.8 ppm. All P levels are lower in the B-horizon throughout all of the soils. Soil 11 has an overall very abundant content of soil P, and a considerably large content in the B-horizon in contrast to the other 5 soils. The overall trend favors greater soil P in more mature vegetation growth (Figure. 16). This result is actually unexpected because P is a limited nutrient to plants. Forms of soil phosphorus have a very low solubility, thus soils are generally very limited in plant available P. Generally, forests are depleted in P because of the immense demand required by the great biomass, and due to the bonding of P to secondary minerals and organic matter (Bautista-Cruz and Castillo, 2005). Phosphorus is a very important nutrient in the early stages of plant growth, specifically its role in early root growth stimulation. Phosphorus also plays a primary role in plant cell division, energy transformations within the cell, hastening plant maturity, and in fruiting and seed production (Gardiner and Miller, 2003).
Exchangeable Potassium (K) is significantly greater in the A-horizon of Soil 8 with a value of 0.29 cmol+/ kg soil. In general, exchangeable K does not exceed 0.10 cmol+/kg in all 6 soils of both the A and B-horizon. Soil 1 has the highest content of K in the B-horizon at 0.07 cmol+/kg soil (Figure. 16). This may be in part due to the abundance of micas and feldspars present shallow in the soil profile of Soil 1. Micas and feldspars are a considerable source of K, however the solubility of these minerals is very slow. Potassium is an important nutrient in cell division, formation of carbohydrates, helps in the aid to plant diseases, translocation of sugars and
16
enzyme action (Gardiner and Miller, 2003).
3.4e Metal Micronutrients Iron, Zinc, Copper, Manganese
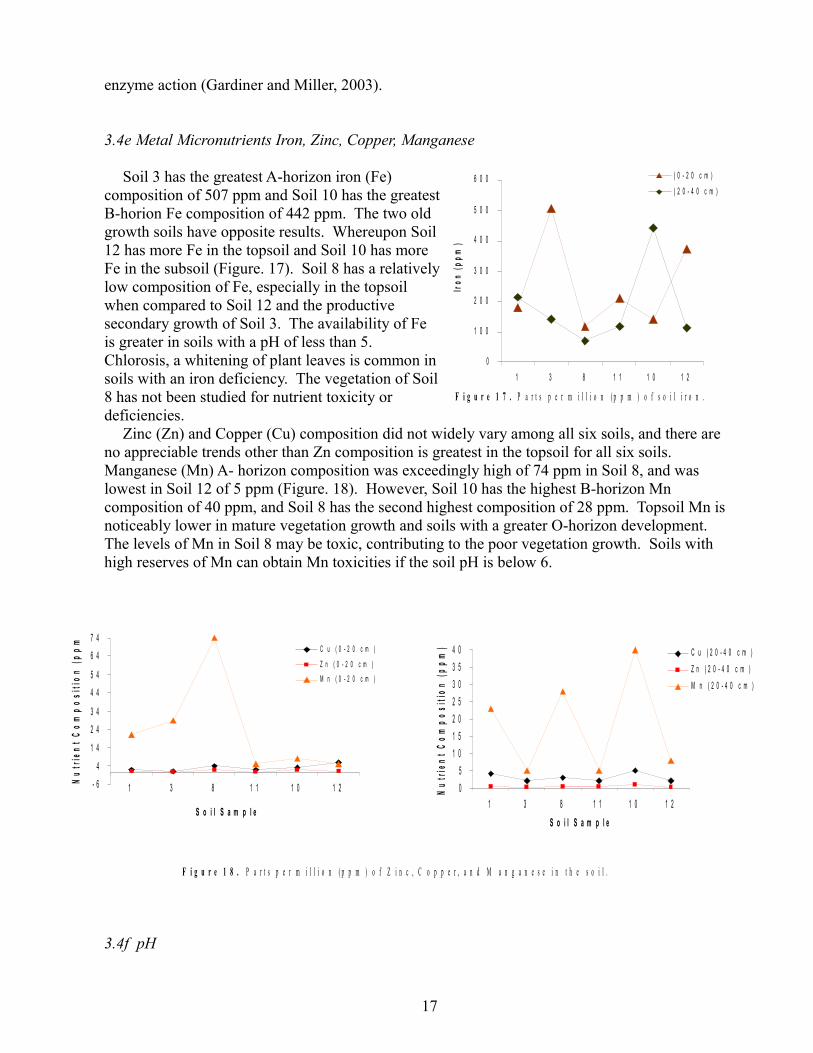
Soil 3 has the greatest A-horizon iron (Fe) composition of 507 ppm and Soil 10 has the greatest B-horion Fe composition of 442 ppm. The two old growth soils have opposite results. Whereupon Soil 12 has more Fe in the topsoil and Soil 10 has more Fe in the subsoil (Figure. 17). Soil 8 has a relatively low composition of Fe, especially in the topsoil when compared to Soil 12 and the productive secondary growth of Soil 3. The availability of Fe is greater in soils with a pH of less than 5. Chlorosis, a whitening of plant leaves is common in soils with an iron deficiency. The vegetation of Soil 8 has not been studied for nutrient toxicity or deficiencies.
Zinc (Zn) and Copper (Cu) composition did not widely vary among all six soils, and there are no appreciable trends other than Zn composition is greatest in the topsoil for all six soils. Manganese (Mn) A- horizon composition was exceedingly high of 74 ppm in Soil 8, and was lowest in Soil 12 of 5 ppm (Figure. 18). However, Soil 10 has the highest B-horizon Mn composition of 40 ppm, and Soil 8 has the second highest composition of 28 ppm. Topsoil Mn is noticeably lower in mature vegetation growth and soils with a greater O-horizon development. The levels of Mn in Soil 8 may be toxic, contributing to the poor vegetation growth. Soils with high reserves of Mn can obtain Mn toxicities if the soil pH is below 6.
3.4f pH
17
0
1 0 0
2 0 0
3 0 0
4 0 0
5 0 0
6 0 0
1 3 8 1 1 1 0 1 2
S o i l S a m p l e
Iro
n (
pp
m)
( 0 - 2 0 c m )
( 2 0 - 4 0 c m )
- 6
4
1 4
2 4
3 4
4 4
5 4
6 4
7 4
1 3 8 1 1 1 0 1 2
S o i l S a m p l e
Nu
trie
nt
Co
mp
osi
tio
n (
pp
m)
C u ( 0 - 2 0 c m )
Z n ( 0 - 2 0 c m )
M n ( 0 - 2 0 c m )
0
5
1 0
1 5
2 0
2 5
3 0
3 5
4 0
1 3 8 1 1 1 0 1 2
S o i l S a m p l e
Nu
trie
nt
Co
mp
osi
tio
n (
pp
m)
C u ( 2 0 - 4 0 c m )
Z n ( 2 0 - 4 0 c m )
M n ( 2 0 - 4 0 c m )
F i g u r e 1 7 . P a r t s p e r m i l l i o n ( p p m ) o f s o i l i r o n .
F i g u r e 1 8 . P a r t s p e r m i l l i o n ( p p m ) o f Z i n c , C o p p e r , a n d M a n g a n e s e i n t h e s o i l .
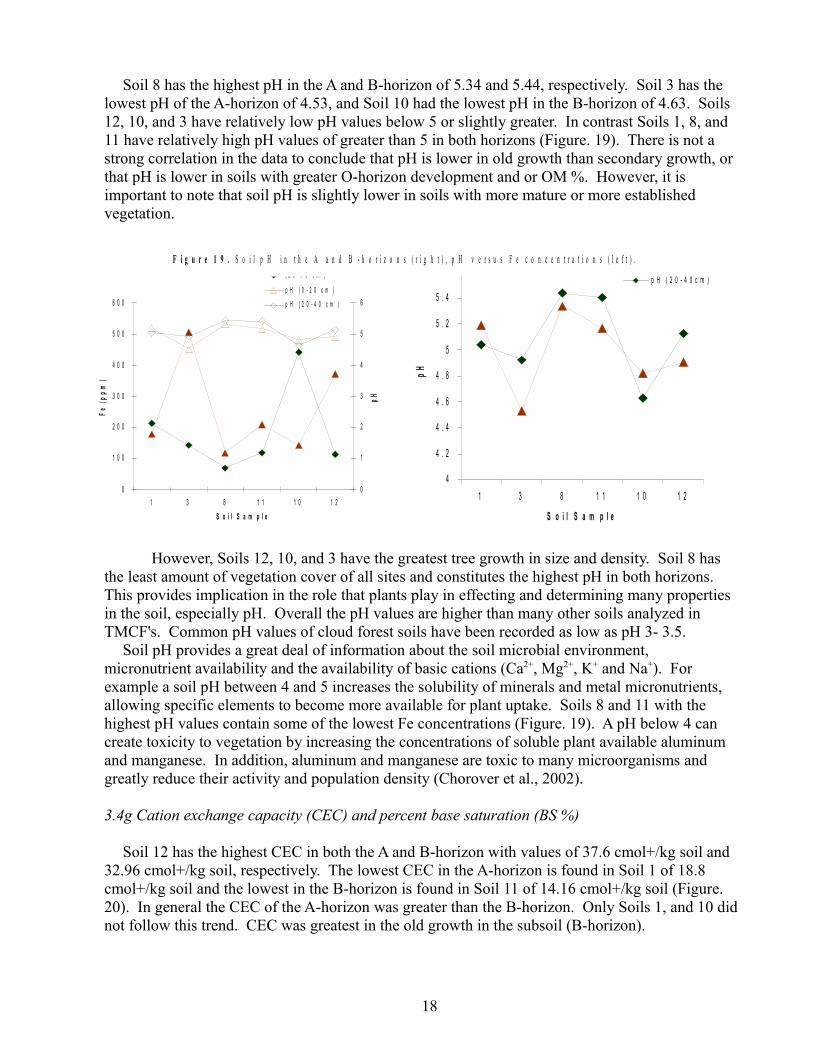
Soil 8 has the highest pH in the A and B-horizon of 5.34 and 5.44, respectively. Soil 3 has the lowest pH of the A-horizon of 4.53, and Soil 10 had the lowest pH in the B-horizon of 4.63. Soils 12, 10, and 3 have relatively low pH values below 5 or slightly greater. In contrast Soils 1, 8, and 11 have relatively high pH values of greater than 5 in both horizons (Figure. 19). There is not a strong correlation in the data to conclude that pH is lower in old growth than secondary growth, or that pH is lower in soils with greater O-horizon development and or OM %. However, it is important to note that soil pH is slightly lower in soils with more mature or more established vegetation.
However, Soils 12, 10, and 3 have the greatest tree growth in size and density. Soil 8 has the least amount of vegetation cover of all sites and constitutes the highest pH in both horizons. This provides implication in the role that plants play in effecting and determining many properties in the soil, especially pH. Overall the pH values are higher than many other soils analyzed in TMCF's. Common pH values of cloud forest soils have been recorded as low as pH 3- 3.5.
Soil pH provides a great deal of information about the soil microbial environment, micronutrient availability and the availability of basic cations (Ca2+, Mg2+, K+ and Na+). For example a soil pH between 4 and 5 increases the solubility of minerals and metal micronutrients, allowing specific elements to become more available for plant uptake. Soils 8 and 11 with the highest pH values contain some of the lowest Fe concentrations (Figure. 19). A pH below 4 can create toxicity to vegetation by increasing the concentrations of soluble plant available aluminum and manganese. In addition, aluminum and manganese are toxic to many microorganisms and greatly reduce their activity and population density (Chorover et al., 2002).
3.4g Cation exchange capacity (CEC) and percent base saturation (BS %)
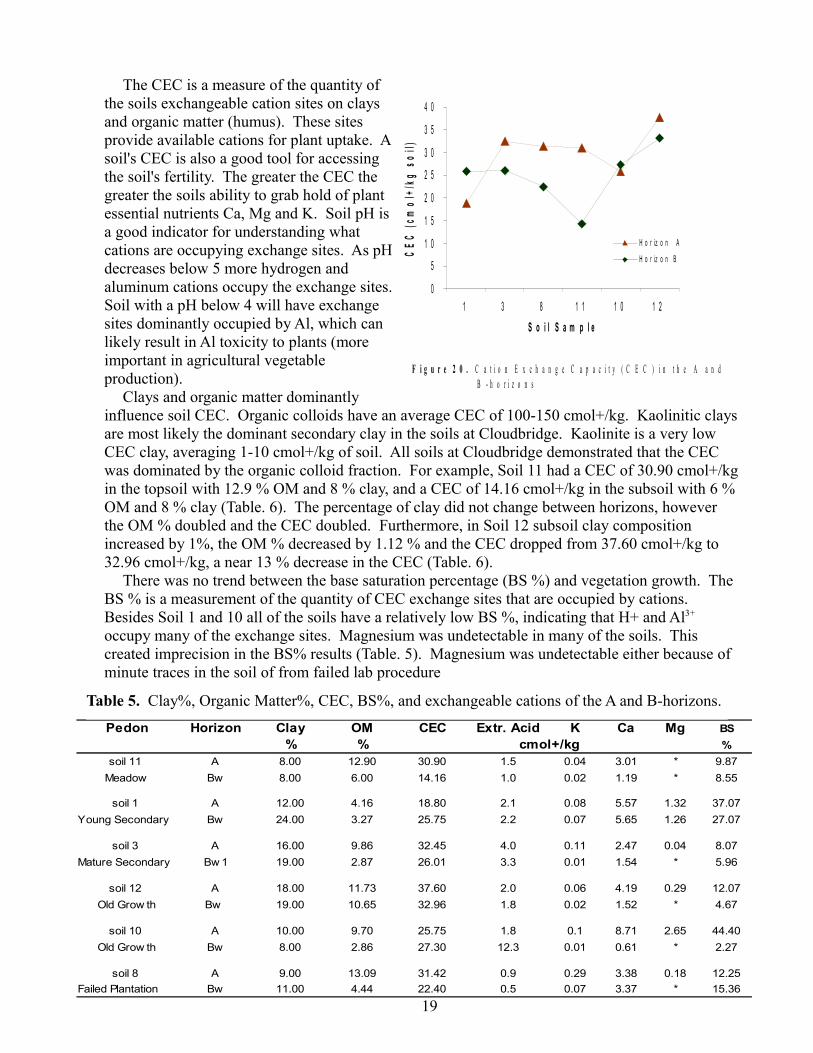
Soil 12 has the highest CEC in both the A and B-horizon with values of 37.6 cmol+/kg soil and 32.96 cmol+/kg soil, respectively. The lowest CEC in the A-horizon is found in Soil 1 of 18.8 cmol+/kg soil and the lowest in the B-horizon is found in Soil 11 of 14.16 cmol+/kg soil (Figure. 20). In general the CEC of the A-horizon was greater than the B-horizon. Only Soils 1, and 10 did not follow this trend. CEC was greatest in the old growth in the subsoil (B-horizon).
18
4
4 . 2
4 . 4
4 . 6
4 . 8
5
5 . 2
5 . 4
5 . 6
1 3 8 1 1 1 0 1 2
S o i l S a m p l e
pH
p H ( 0 - 2 0 c m )
p H ( 2 0 - 4 0 c m )
0
1 0 0
2 0 0
3 0 0
4 0 0
5 0 0
6 0 0
1 3 8 1 1 1 0 1 2
S o i l S a m p l e
Fe
(pp
m)
0
1
2
3
4
5
6
pH
( 0 - 2 0 c m )
( 2 0 - 4 0 c m )
p H ( 0 - 2 0 c m )
p H ( 2 0 - 4 0 c m )
F i g u r e 1 9 . S o i l p H i n t h e A a n d B - h o r i z o n s ( r i g h t ) , p H v e r s u s F e c o n c e n t r a t i o n s ( l e f t ) .
F i g u r e 2 0 . C a t i o n E x c h a n g e C a p a c i t y ( C E C ) i n t h e A a n dB - h o r i z o n s
The CEC is a measure of the quantity of the soils exchangeable cation sites on clays and organic matter (humus). These sites provide available cations for plant uptake. A soil's CEC is also a good tool for accessing the soil's fertility. The greater the CEC the greater the soils ability to grab hold of plant essential nutrients Ca, Mg and K. Soil pH is a good indicator for understanding what cations are occupying exchange sites. As pH decreases below 5 more hydrogen and aluminum cations occupy the exchange sites. Soil with a pH below 4 will have exchange sites dominantly occupied by Al, which can likely result in Al toxicity to plants (more important in agricultural vegetable production).
Clays and organic matter dominantly influence soil CEC. Organic colloids have an average CEC of 100-150 cmol+/kg. Kaolinitic clays are most likely the dominant secondary clay in the soils at Cloudbridge. Kaolinite is a very low CEC clay, averaging 1-10 cmol+/kg of soil. All soils at Cloudbridge demonstrated that the CEC was dominated by the organic colloid fraction. For example, Soil 11 had a CEC of 30.90 cmol+/kg in the topsoil with 12.9 % OM and 8 % clay, and a CEC of 14.16 cmol+/kg in the subsoil with 6 % OM and 8 % clay (Table. 6). The percentage of clay did not change between horizons, however the OM % doubled and the CEC doubled. Furthermore, in Soil 12 subsoil clay composition increased by 1%, the OM % decreased by 1.12 % and the CEC dropped from 37.60 cmol+/kg to 32.96 cmol+/kg, a near 13 % decrease in the CEC (Table. 6).
There was no trend between the base saturation percentage (BS %) and vegetation growth. The BS % is a measurement of the quantity of CEC exchange sites that are occupied by cations. Besides Soil 1 and 10 all of the soils have a relatively low BS %, indicating that H+ and Al3+
occupy many of the exchange sites. Magnesium was undetectable in many of the soils. This created imprecision in the BS% results (Table. 5). Magnesium was undetectable either because of minute traces in the soil of from failed lab procedure
19
0
5
1 0
1 5
2 0
2 5
3 0
3 5
4 0
1 3 8 1 1 1 0 1 2
S o i l S a m p l e
CE
C (
cmo
l+/k
g s
oil
)
H o r iz o n A
H o r iz o n B
Pedon Horizon Clay OM CEC Extr. Acid K Ca Mg BS
% % cmol+/kg %
soil 11 A 8.00 12.90 30.90 1.5 0.04 3.01 * 9.87
Meadow Bw 8.00 6.00 14.16 1.0 0.02 1.19 * 8.55
soil 1 A 12.00 4.16 18.80 2.1 0.08 5.57 1.32 37.07
Young Secondary Bw 24.00 3.27 25.75 2.2 0.07 5.65 1.26 27.07
soil 3 A 16.00 9.86 32.45 4.0 0.11 2.47 0.04 8.07
Mature Secondary Bw 1 19.00 2.87 26.01 3.3 0.01 1.54 * 5.96
soil 12 A 18.00 11.73 37.60 2.0 0.06 4.19 0.29 12.07
Old Grow th Bw 19.00 10.65 32.96 1.8 0.02 1.52 * 4.67
soil 10 A 10.00 9.70 25.75 1.8 0.1 8.71 2.65 44.40
Old Grow th Bw 8.00 2.86 27.30 12.3 0.01 0.61 * 2.27
soil 8 A 9.00 13.09 31.42 0.9 0.29 3.38 0.18 12.25
Failed Plantation Bw 11.00 4.44 22.40 0.5 0.07 3.37 * 15.36
Table 5. Clay%, Organic Matter%, CEC, BS%, and exchangeable cations of the A and B-horizons.
3.4h Temperature
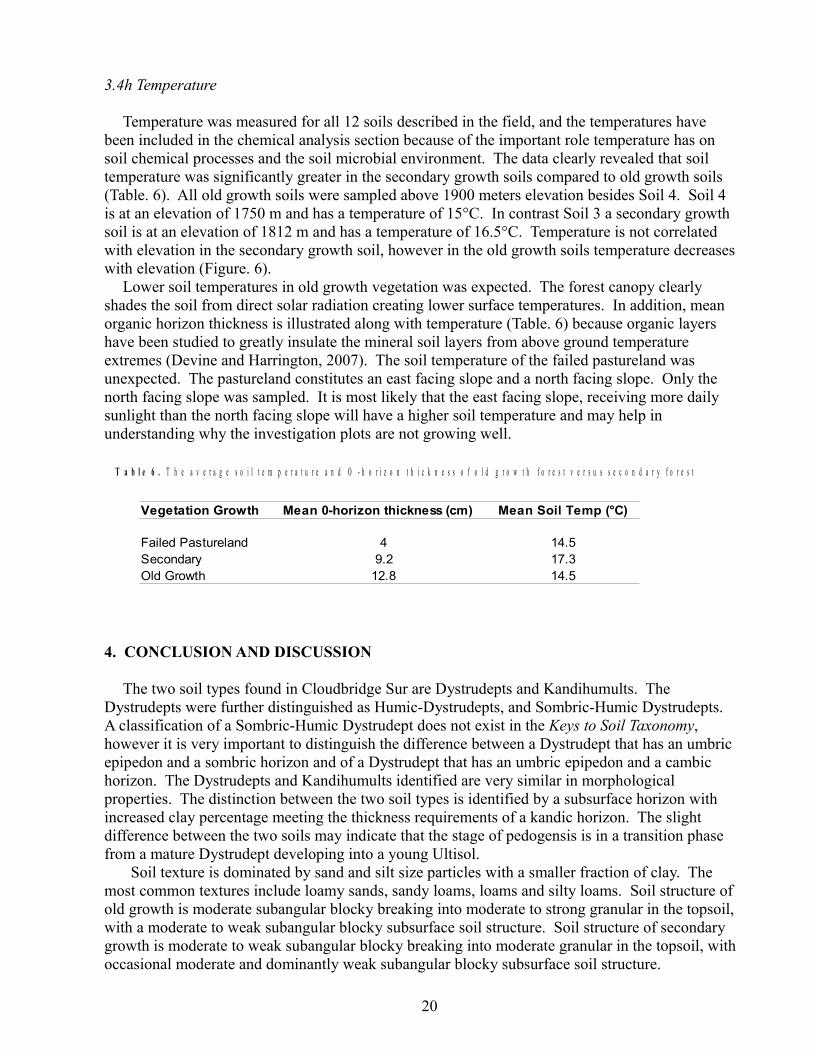
Temperature was measured for all 12 soils described in the field, and the temperatures have been included in the chemical analysis section because of the important role temperature has on soil chemical processes and the soil microbial environment. The data clearly revealed that soil temperature was significantly greater in the secondary growth soils compared to old growth soils (Table. 6). All old growth soils were sampled above 1900 meters elevation besides Soil 4. Soil 4 is at an elevation of 1750 m and has a temperature of 15°C. In contrast Soil 3 a secondary growth soil is at an elevation of 1812 m and has a temperature of 16.5°C. Temperature is not correlated with elevation in the secondary growth soil, however in the old growth soils temperature decreases with elevation (Figure. 6).
Lower soil temperatures in old growth vegetation was expected. The forest canopy clearly shades the soil from direct solar radiation creating lower surface temperatures. In addition, mean organic horizon thickness is illustrated along with temperature (Table. 6) because organic layers have been studied to greatly insulate the mineral soil layers from above ground temperature extremes (Devine and Harrington, 2007). The soil temperature of the failed pastureland was unexpected. The pastureland constitutes an east facing slope and a north facing slope. Only the north facing slope was sampled. It is most likely that the east facing slope, receiving more daily sunlight than the north facing slope will have a higher soil temperature and may help in understanding why the investigation plots are not growing well.
4. CONCLUSION AND DISCUSSION
The two soil types found in Cloudbridge Sur are Dystrudepts and Kandihumults. The Dystrudepts were further distinguished as Humic-Dystrudepts, and Sombric-Humic Dystrudepts. A classification of a Sombric-Humic Dystrudept does not exist in the Keys to Soil Taxonomy, however it is very important to distinguish the difference between a Dystrudept that has an umbric epipedon and a sombric horizon and of a Dystrudept that has an umbric epipedon and a cambic horizon. The Dystrudepts and Kandihumults identified are very similar in morphological properties. The distinction between the two soil types is identified by a subsurface horizon with increased clay percentage meeting the thickness requirements of a kandic horizon. The slight difference between the two soils may indicate that the stage of pedogensis is in a transition phase from a mature Dystrudept developing into a young Ultisol.
Soil texture is dominated by sand and silt size particles with a smaller fraction of clay. The most common textures include loamy sands, sandy loams, loams and silty loams. Soil structure of old growth is moderate subangular blocky breaking into moderate to strong granular in the topsoil, with a moderate to weak subangular blocky subsurface soil structure. Soil structure of secondary growth is moderate to weak subangular blocky breaking into moderate granular in the topsoil, with occasional moderate and dominantly weak subangular blocky subsurface soil structure.
20
Vegetation Growth Mean 0-horizon thickness (cm) Mean Soil Temp (°C)
Failed Pastureland 4 14.5Secondary 9.2 17.3Old Growth 12.8 14.5
T a b l e 6 . T h e a v e r a g e s o i l t e m p e r a t u r e a n d O - h o r i z o n t h i c k n e s s o f o l d g r o w t h f o r e s t v e r s u s s e c o n d a r y f o r e s t
The most pronounce morphological difference between old growth and secondary growth soils is the development of O-horizon thickness. Old growth soils have an average O-horizon thickness greater than secondary growth soils. The thickness of O-horizon development is directly related to soil temperature. On average soils with thicker O-horizon development have lower soil temperatures. In correlation, old growth soil temperatures are significantly lower than secondary growth soils.
Percent OM and C in the subsoil was found to be more abundant in mature, stable vegetation, and or in soils that were undisturbed. Topsoil OM % and C % varied among soils, and there is no correlation between greater composition of OM and C of the topsoil in old growth versus secondary growth vegetation. Nitrogen percent is greatest in soils of old growth and soils with thick O-horizon development. The C/N ratio is greater in the topsoil for all soils other then Soil 12 (old growth), and the C/N ratio is slightly greater in young secondary growth soils.
Metal micronutrient composition in both horizons is similar in every soil other than Soil 8 (failed regeneration). Soil 8 contains significantly higher concentrations of manganese and relatively low concentrations of iron in both horizons. These micronutrient abnormalities in Soil 8 may be contributing to the poor vegetation growth of the plantation site. Soil pH ranged between 5.44 and 4.63. The pH of Soil 8 was the highest of all soils, another potential contributing factor of poor plant growth, especially considering the lower pH values of the old growth soils. There is no trend in the data that indicates a correlation in soil pH between old growth versus secondary growth. However, pH is relatively low in soils with greater tree size and density. Both old growth soils had some of the lowest pH values, but Soil 3 (mature secondary growth) had the overall lowest pH value.
CEC is greatest in Soil 12, and was highest in soils with relatively abundant clay and organic matter. In general CEC was greatest in old growth soils and soils with more mature vegetation. All soils have a low base saturation. There is no trend between BS % and vegetation growth.
The chemical data provides some basic differences and similarities between the old growth and secondary growth habitats. It also illustrates some differences between successful and poor forest regeneration. One could also compare the soil properties of differing stages of regeneration maturity, for example using Soil 1 and Soil 3. The data can be interpreted in many different ways, and many correlations could be found when emphasizing to do so. Again the chemical analysis for this research was intended to provide a fundamental understanding of the basic chemical properties inherited in old growth and secondary growth soils. The old growth soils, Soil 12 and 10 exhibited very different results in both their morphological and chemical analysis. These differences are not errors in the research. These two sites are very different geomorphologically and serve as a great tool for understanding the diversity of soil conditions and landscape diversity that the old growth forest inhabits. However, with time and stability of the landscape of Soil 10, the soil may develop the properties of Soil 12.
The accumulation of subsoil humus (sombric horizon) in Soil 12 indicates a mature stage of development. A Sombric-Humic Dystrudept, constituting the undisturbed old growth habitat may be considered the ultimate stage of soil development with current local environmental conditions. At this stage of development the soil and the above ground conditions (climate, vegetation, erosion) are in a stage of equilibrium. As secondary growth vegetation continues to mature it should not be assumed that the soil will develop into a Sombric-Humic Dystrudept. This understanding is especially important when analyzing landscapes with different erosional processes and episodes. In view sight, as climate changes, and with the unpredictable succession of the secondary growth, the soil in conjunction will continue to change with the ecosystem working diligently to find equilibrium with nature.
21
ACKNOWLEDGEMENTS
I want to highlight and especially recognize the hard work put into this project by my fiancée Tiffany Gray. Tiffany was my field assistant throughout the whole project. Her contributions included the majority of photography, GPS coordination, database entry, field note taking, equipment managing, creative thinking, positive mental support and unprecedented enthusiasm to hike the treacherous terrain of Cloudbridge everyday for the environmental and soil science world. Thank you Tiffany.
Much appreciation is granted to the Soil and Water Laboratory at Earth University for conducting the lab analysis. Dr. Ramon Leon, a professor of plant protection at the Earth University connected me with the laboratory. Without his help, getting lab analysis done would have been much more difficult. He took his time to meet with Tiffany and I at the University and guided us around, enabling us to feel very comfortable and welcomed at the University. Thank you Dr. Ramon Leon your efforts in making this project complete.
Special thanks to Eric Kang for his positive support every morning and his general knowledge and his ability to make individuals feel very welcomed to the reserve. Thank you Tom Gode for your general knowledge and willingness to help at all times. Thank you Amy Gode for you super positive support, resources, and willingness to help at all times. Special thanks to Alexis Delevett, your intelligent humor and stimulating conversations made every night at the reserve interesting - thank you for you support mentally and your help digging soil pits. And last but not least I want to send much gratitude and appreciation to the locals of San Gerardo de Rivas for being so welcoming of Tiffany and I. Thank you to all the workers of Reserva Cloudbridge who were so patient and kind, especially when communicating to me en espanol.
22

REFERENCES
Bautista-Cruz, A., and R.F. Castillo. 2005. Soil Changes During Secondary Succession in a Tropical Cloud Forest Area. The Soil Science Society of America Journal. 69: 906-914.
Boul, S.W., R.C. Graham, P.A. McDaniel and R.J. Southard. 2003. Soil Genesis and Classification. 5th
ed. Blackwell Publishing Company, Iowa, US.
Bruijnzeel, L.A., and E.J. Veneklaas. 1998. Climatic Conditions and Tropical Montane Forest Productivity: The fog has not lifted yet. The Ecological Society of America. 79:3-9.
Chorover, J., J. Harsh and E. Nizeyimana. 2002. Soil Mineralogy with Environmental Applications. Allophane and Imogolite. SSSA Book Series, no. 7.
Churchill, S.P., H. Balslev, E. Forero, and J.L. Luteyn. 1995. Biodiversity and conservation of neotropical montane forest. The New York Botanical Garden, NY.
Coyne, M. 1999. Soil Microbiology. An Exploratory Approach. Delmar Publishers, Albany, NY, US.
Devine, W.D., and Harrington, C.A., 2007. Influence of harvest residues and vegetation on microsite soil and air temperatures in a young conifer plantation. Agricultural and Forest Meteorology. 145:125-138.
Gardiner, D.T., and R.W. Miller, 2003. Soils in Our Environment. 10th ed. Pearsons Education Inc, New Jeresey, US.
Giddy, I. 2006. The Cloudbridge Nature Reserve- Research Reports. Rainfall and Temperature. Available at http://cloudbridge.org/rainfall.htm (verified 24 March 2006).
Giddy, I. 2006. The Cloudbridge Nature Reserve- Background and Ecology. Available at http://cloudbridge.org/context.htm (verified 24 March 2006).
Kennis, P.A.F. and De Vries, R. A. J. 1993. Trends in diversity in mature and recovering montane Quercus forest, Coderillera de Talamanca, Costa Rica. Thesis, Amsterdam University and Nijmegen Catholic University, Amsterdam-Nijmegen. 97 pp.
Schruben, P.G. 1996. Geology and Resource Assessment of Costa Rica at 1:500,00 scale. A digital representation of maps of the U.S. Geological Survey’s 1987 Folio I-1865: U.S. Geological Survey Digital data Series DDS-19, U.S. Geological Survey, Reston, Virginia.
Soil Survey Staff. 2006. Keys to Soil Taxonomy. 10th ed. U.S. Gov. Print. Office, Washington, DC.
Tingerthal, J. 2008. The Cloudbridge Nature Reserve. GIS Soils Map.
23

Van Uffelen, J.G. 1991. A geological, geomorphological and soil transect study of the Chirripo massif and adjecent areas, Coderillera de Talamanca, Costa Rica, Thesis, Wageningen Agricultural University, Wageningen. 72pp.
Vance, E.D., and N.M. Nadkarni. 1989. Microbial biomass and activity in canopy organic matter and the forest floor of a tropical cloud forest. Soil Biol. Biochem. 22: 677-684.
Webster, G.L. 1995. The panorama of neotropical cloud forests. p. 53–77. In S.P. Churchill et al. (ed.) Biodiversity and conservation of neotropical montane forest. The New York Botanical Garden, NY.
24
APPEDNDIX
Field and Laboratory Data
Original Earth University Laboratory Chemical Analysis Data
Extractantes: Olsen modificado / KCl 1N
25
LABORATORIO DE SUELOS Y AGUASINFORME DE ANÁLISIS DE SUELOFecha: noviembre 27 del 2008Cliente: Charles Schembre
IDENTIFICACIÓN pH/ agua Ac. Ext. K Ca Mg P Fe Cu Zn Mn C N C/N MO CICcmol/L
soil 1 A 5.19 2.1 0.08 5.57 1.32 5.8 179 2 1 21 2.42 0.32 7.56 4.16 18.80soil 1 B 5.04 2.2 0.07 5.65 1.26 4.4 215 4 0 23 1.90 0.44 4.32 3.27 25.75soil 3 A 4.53 4.0 0.11 2.47 0.04 12.1 507 1 1 29 5.73 0.67 8.55 9.86 32.45sol 3 B 4.92 3.3 0.01 1.54 * 2.2 142 2 0 5 1.67 0.35 4.77 2.87 26.01soil 8 A 5.34 0.9 0.29 3.38 0.18 6.3 119 4 2 74 7.61 0.92 8.27 13.09 31.42soil 8 B 5.44 0.5 0.07 3.37 * 2.2 70 3 0 28 2.58 0.58 4.45 4.44 22.40soil 10 B 4.63 12.3 0.01 0.61 * 2.4 442 5 1 40 1.66 1.10 1.51 2.86 27.30soil 10 A 4.82 1.8 0.1 8.71 2.65 9.8 142 3 2 8 5.64 0.83 6.8 9.70 25.75soil 11 A 5.17 1.5 0.04 3.01 * 13.8 210 2 1 5 7.50 1.19 6.3 12.90 30.90soil 11 B 5.41 1.0 0.02 1.19 * 11.1 118 2 0 5 3.49 0.77 4.53 6.00 14.16soil 12 A 4.91 2.0 0.06 4.19 0.29 14.2 372 6 1 5 6.82 1.29 5.29 11.73 37.60soil 12 B 5.13 1.8 0.02 1.52 * 6.1 114 2 0 8 6.19 1.01 6.13 10.65 32.96
cmol+/L ppm %
Herberth Arrieta VargasAdministrador Laboratorio de Suelos y Aguas
Universidad EARTH
Campus Tel:(506) 713-0000/Fax (506) 713-0001/Apartado postal 4442-1000. San José, Costa Rica/http://www.earth.ac.cr
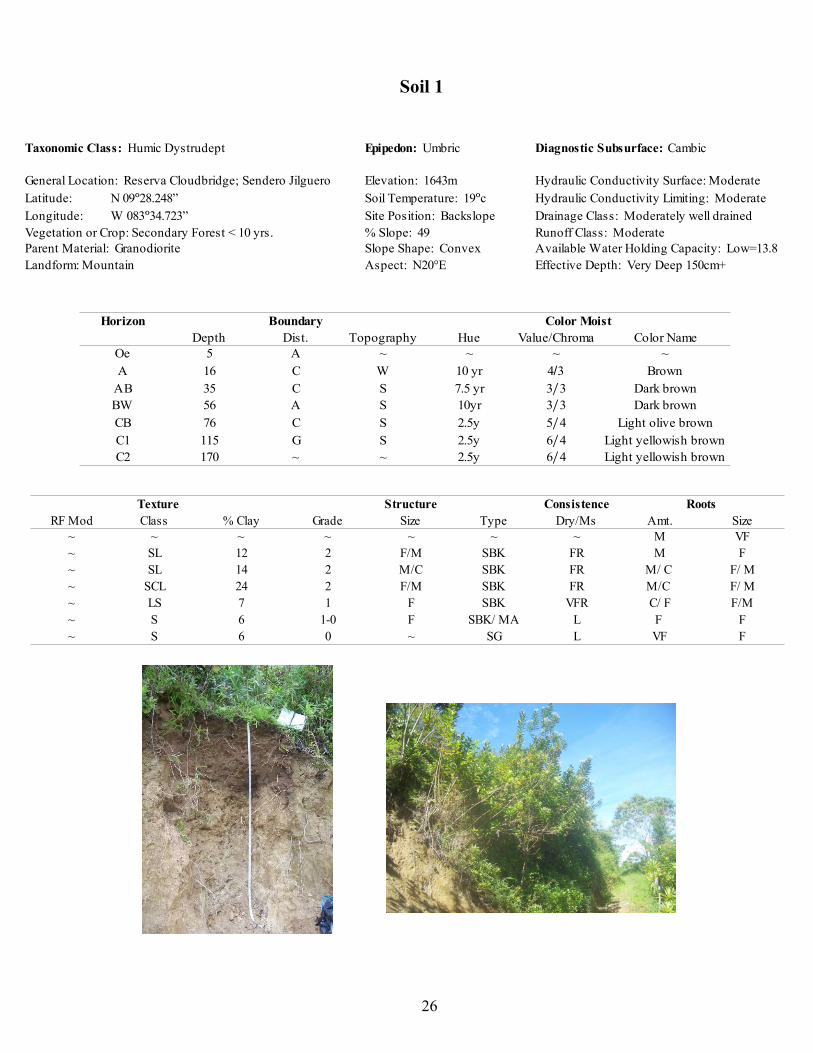
Soil 1
26
General Location: Reserva Cloudbridge; Sendero Jilguero Elevation: 1643m Hydraulic Conductivity Surface: Moderate
Latitude: Hydraulic Conductivity Limiting: Moderate
Longitude: Site Position: Backslope Drainage Class: Moderately well drainedVegetation or Crop: Secondary Forest < 10 yrs. % Slope: 49 Runoff Class: ModerateParent Material: Granodiorite Slope Shape: Convex Available Water Holding Capacity: Low=13.8Landform: Mountain Aspect: N20°E Effective Depth: Very Deep 150cm+
Taxonomic Class: Humic Dystrudept Epipedon: Umbric Diagnostic Subsurface: Cambic
N 09°28.248” Soil Temperature: 19°c
W 083°34.723”
Horizon Boundary Color MoistDepth Dist. Topography Hue Value/Chroma Color Name
Oe 5 A ~ ~ ~ ~A 16 C W 10 yr Brown
AB 35 C S 7.5 yr Dark brownBW 56 A S 10yr Dark brown
CB 76 C S 2.5y Light olive brownC1 115 G S 2.5y Light yellowish brownC2 170 ~ ~ 2.5y Light yellowish brown
4/33/33/3
5/46/46/4
Texture Structure Consistence RootsRF Mod Class % Clay Grade Size Type Dry/Ms Amt. Size
~ ~ ~ ~ ~ ~ ~ M VF~ SL 12 2 F/M SBK FR M F~ SL 14 2 M/C SBK FR M/ C F/ M~ SCL 24 2 F/M SBK FR M/C F/ M~ LS 7 1 F SBK VFR C/ F F/M~ S 6 1-0 F SBK/ MA L F F~ S 6 0 ~ SG L VF F
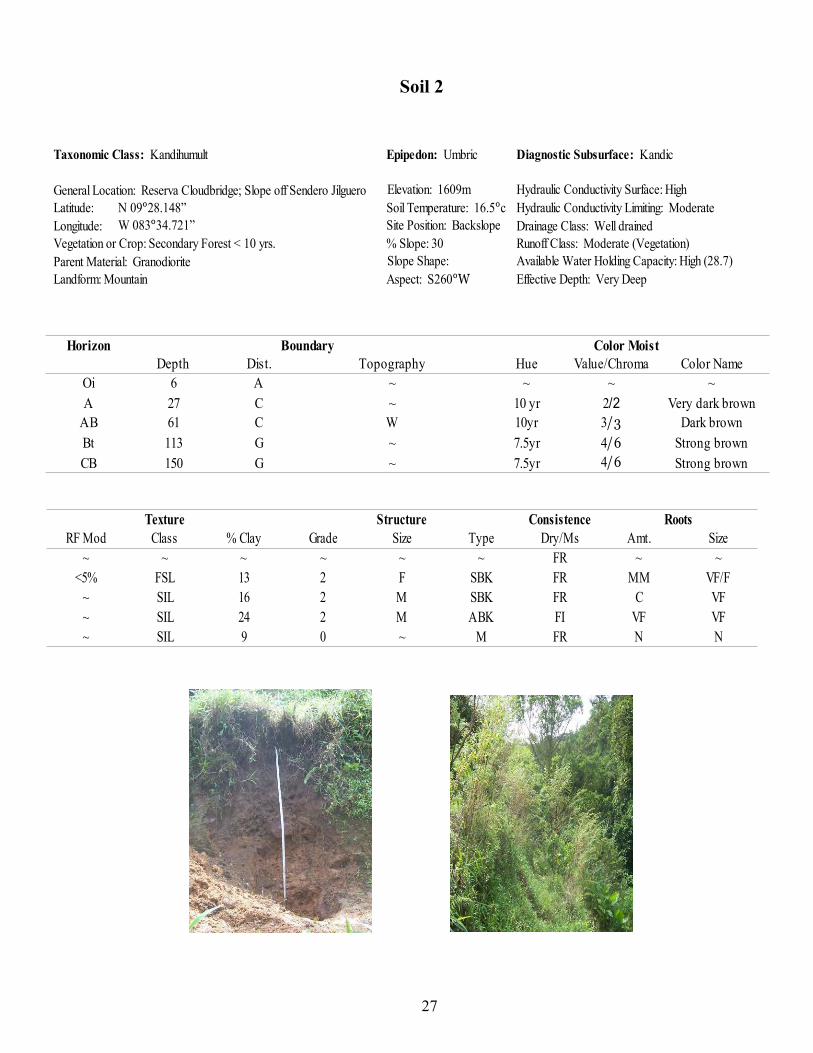
Soil 2
27
Elevation: 1609m Hydraulic Conductivity Surface: HighLatitude: Hydraulic Conductivity Limiting: ModerateLongitude: Drainage Class: Well drainedVegetation or Crop: Secondary Forest < 10 yrs. Runoff Class: Moderate (Vegetation)
Slope Shape: Available Water Holding Capacity: High (28.7)Effective Depth: Very Deep
Taxonomic Class: Kandihumult Epipedon: Umbric Diagnostic Subsurface: Kandic
General Location: Reserva Cloudbridge; Slope off Sendero JilgueroN 09°28.148” Soil Temperature: 16.5°cW 083°34.721” Site Position: Backslope
% Slope: 30Parent Material: GranodioriteLandform: Mountain Aspect: S260°W
Horizon Boundary Color MoistDepth Dist. Topography Hue Value/Chroma Color Name
Oi 6 A ~ ~ ~ ~A 27 C ~ 10 yr Very dark brown
AB 61 C W 10yr Dark brown
Bt 113 G ~ 7.5yr Strong brownCB 150 G ~ 7.5yr Strong brown
2/23/34/64/6
Texture Structure Consistence RootsRF Mod Class % Clay Grade Size Type Dry/Ms Amt. Size
~ ~ ~ ~ ~ ~ FR ~ ~<5% FSL 13 2 F SBK FR MM VF/F
~ SIL 16 2 M SBK FR C VF~ SIL 24 2 M ABK FI VF VF~ SIL 9 0 ~ M FR N N

Soil 3
28
Elevation: 1812m Hydraulic Conductivity Surface: ModerateLatitude: Hydraulic Conductivity Limiting: ModerateLongitude: Site Position: Shoulder Drainage Class: Well drainedVegetation or Crop: Secondary Growth % Slope: 10 Runoff Class: Low (Vegetation)
Slope Shape: Convex Available Water Holding Capacity: Moderate (16.9)Effective Depth: Very Deep
Taxonomic Class: Typic Dystrudept Epipedon: Ochric Diagnostic Subsurface: Cambic
General Location: Reserva Cloudbridge; Sendero JilgueroN 09°28.136” Soil Temperature: 16.5°cW 083°34.542”
Parent Material: GranodioriteLandform: Mountain Aspect: N350°E
Horizon Boundary Color MoistDepth Dist. Topography Hue Value/Chroma Color Name
5 ~ ~ ~ ~ ~A 19 ~ ~ 10 yr Very dark brown
BW1 34 ~ ~ 2.5y Olive brownCB1 88 ~ ~ 2.5y Light olive brown
CB2 115 ~ ~ 2.5y Light yellowish brown
Oi2/24/45/46/4
Texture Structure Consistence RootsRF Mod Class % Clay Grade Size Type Dry/Ms Amt. Size
~ ~ ~ ~ ~ ~ ~ ~ ~~ L 16 2 1 SBK VFR C C~ FSL 19 2 1 SBK VFR F/VF F/M~ LS 9 1 1 SBK VFR C/F F/C~ LS 9 1 1 SBK VFR V/F F
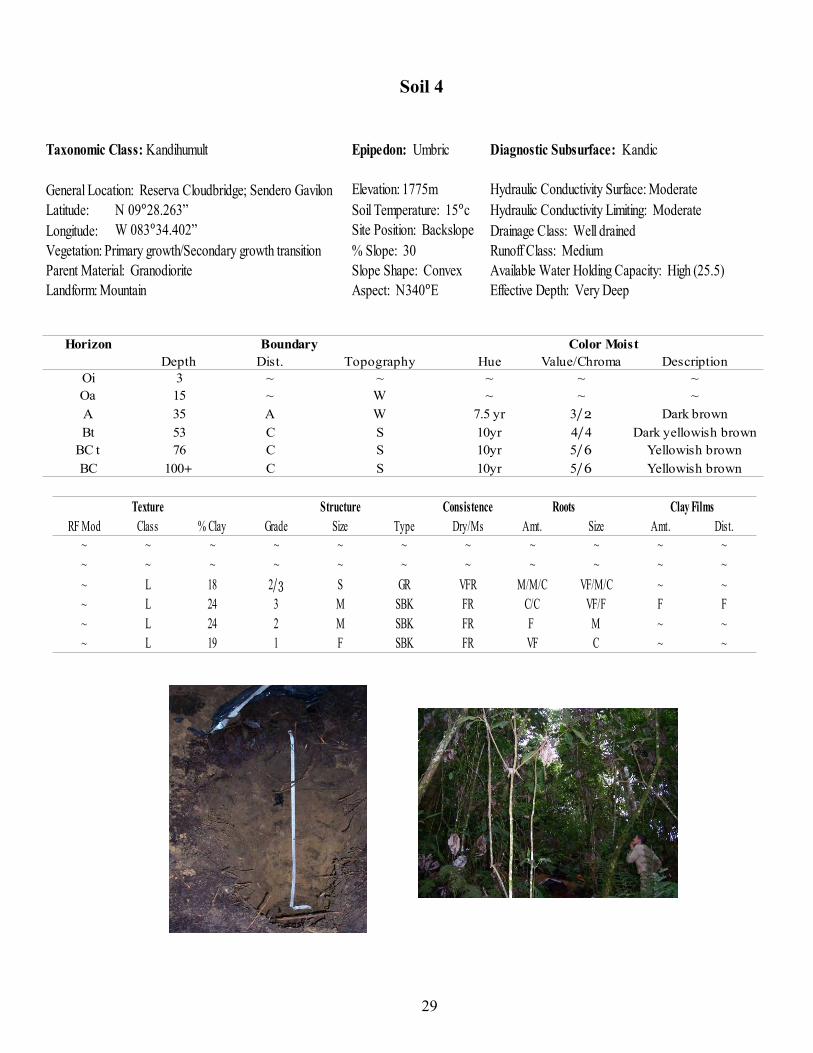
Soil 4
29
Elevation: 1775m Hydraulic Conductivity Surface: ModerateLatitude: Hydraulic Conductivity Limiting: ModerateLongitude: Drainage Class: Well drainedVegetation: Primary growth/Secondary growth transition % Slope: 30 Runoff Class: Medium
Slope Shape: Convex Available Water Holding Capacity: High (25.5)Effective Depth: Very Deep
Taxonomic Class: Kandihumult Epipedon: Umbric Diagnostic Subsurface: Kandic
General Location: Reserva Cloudbridge; Sendero GavilonN 09°28.263” Soil Temperature: 15°cW 083°34.402” Site Position: Backslope
Parent Material: GranodioriteLandform: Mountain Aspect: N340°E
Texture Structure Consistence Roots Clay FilmsRF Mod Class % Clay Grade Size Type Dry/Ms Amt. Size Amt. Dist.
~ ~ ~ ~ ~ ~ ~ ~ ~ ~ ~~ ~ ~ ~ ~ ~ ~ ~ ~ ~ ~
~ L 18 S GR VFR M/M/C VF/M/C ~ ~~ L 24 3 M SBK FR C/C VF/F F F~ L 24 2 M SBK FR F M ~ ~~ L 19 1 F SBK FR VF C ~ ~
2/3
Horizon Boundary Color MoistDepth Dist. Topography Hue Value/Chroma Description
Oi 3 ~ ~ ~ ~ ~Oa 15 ~ W ~ ~ ~
A 35 A W 7.5 yr Dark brown
Bt 53 C S 10yr Dark yellowish brown76 C S 10yr Yellowish brown
BC C S 10yr Yellowish brown
3/24/4
BC t 5/6100+ 5/6
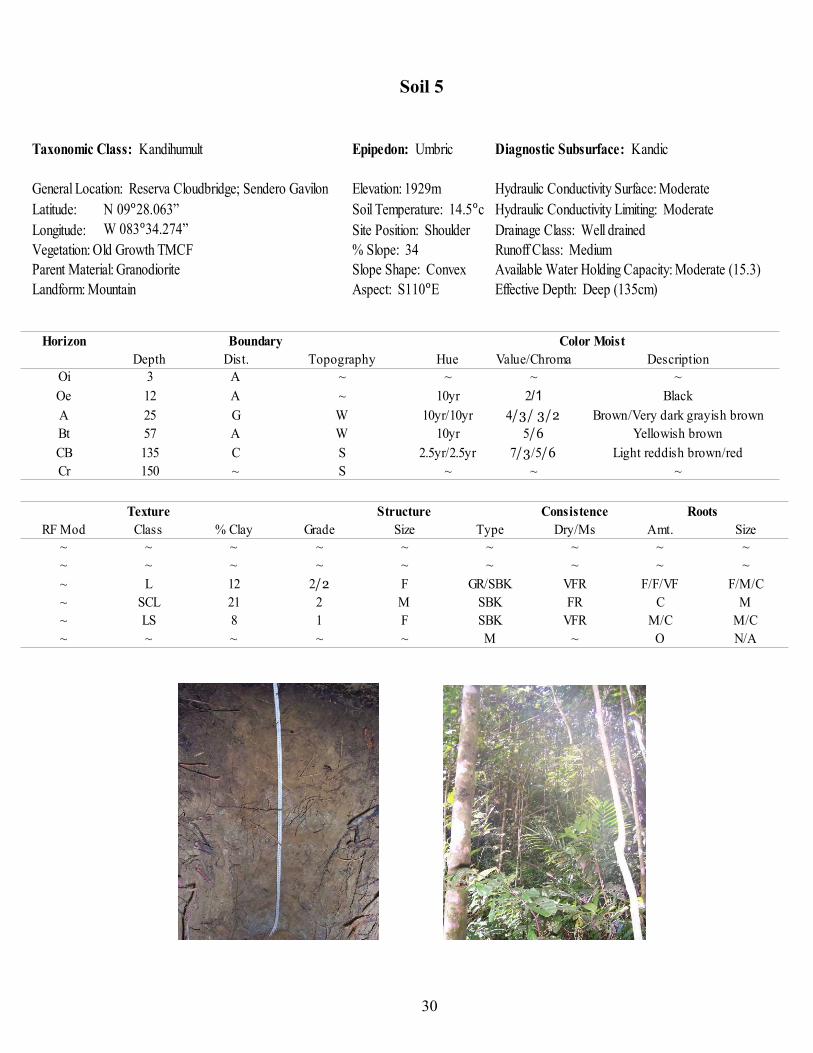
Soil 5
30
General Location: Reserva Cloudbridge; Sendero Gavilon Elevation: 1929m Hydraulic Conductivity Surface: ModerateLatitude: Hydraulic Conductivity Limiting: ModerateLongitude: Site Position: Shoulder Drainage Class: Well drainedVegetation: Old Growth TMCF % Slope: 34 Runoff Class: MediumParent Material: Granodiorite Slope Shape: Convex Available Water Holding Capacity: Moderate (15.3)Landform: Mountain Effective Depth: Deep (135cm)
Taxonomic Class: Kandihumult Epipedon: Umbric Diagnostic Subsurface: Kandic
N 09°28.063” Soil Temperature: 14.5°cW 083°34.274”
Aspect: S110°E
Horizon Boundary Color MoistDepth Dist. Topography Hue Value/Chroma Description
Oi 3 A ~ ~ ~ ~Oe 12 A ~ 10yr Black
A 25 G W 10yr/10yr Brown/Very dark grayish brownBt 57 A W 10yr Yellowish brownCB 135 C S 2.5yr/2.5yr Light reddish brown/redCr 150 ~ S ~ ~ ~
2/14/3/ 3/2
5/67/3/5/6
Texture Structure Consistence RootsRF Mod Class % Clay Grade Size Type Dry/Ms Amt. Size
~ ~ ~ ~ ~ ~ ~ ~ ~~ ~ ~ ~ ~ ~ ~ ~ ~
~ L 12 F GR/SBK VFR F/F/VF F/M/C~ SCL 21 2 M SBK FR C M~ LS 8 1 F SBK VFR M/C M/C~ ~ ~ ~ ~ M ~ O N/A
2/2
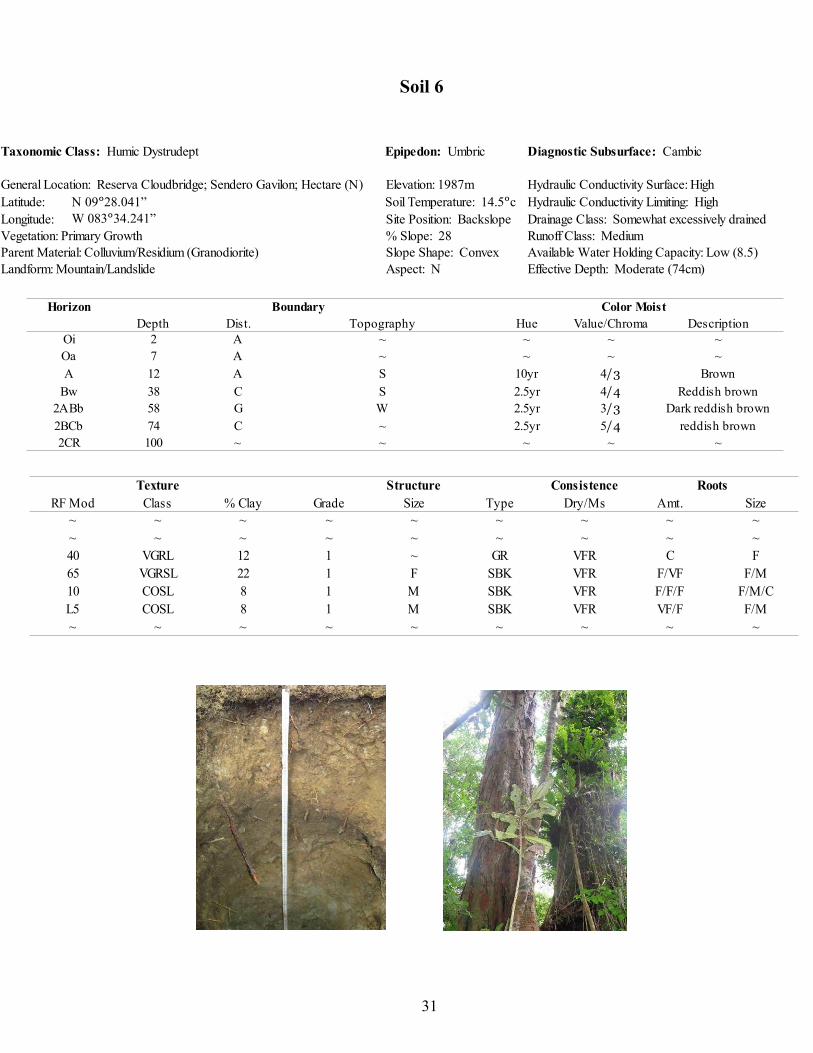
Soil 6
31
General Location: Reserva Cloudbridge; Sendero Gavilon; Hectare (N) Elevation: 1987m Hydraulic Conductivity Surface: HighLatitude: Hydraulic Conductivity Limiting: HighLongitude: Site Position: Backslope Drainage Class: Somewhat excessively drainedVegetation: Primary Growth % Slope: 28 Runoff Class: MediumParent Material: Colluvium/Residium (Granodiorite) Slope Shape: Convex Available Water Holding Capacity: Low (8.5)Landform: Mountain/Landslide Aspect: N Effective Depth: Moderate (74cm)
Taxonomic Class: Humic Dystrudept Epipedon: Umbric Diagnostic Subsurface: Cambic
N 09°28.041” Soil Temperature: 14.5°cW 083°34.241”
Horizon Boundary Color MoistDepth Dist. Topography Hue Value/Chroma Description
Oi 2 A ~ ~ ~ ~Oa 7 A ~ ~ ~ ~
A 12 A S 10yr Brown
Bw 38 C S 2.5yr Reddish brown2ABb 58 G W 2.5yr Dark reddish brown
2BCb 74 C ~ 2.5yr reddish brown2CR 100 ~ ~ ~ ~ ~
4/34/43/35/4
Texture Structure Consistence RootsRF Mod Class % Clay Grade Size Type Dry/Ms Amt. Size
~ ~ ~ ~ ~ ~ ~ ~ ~~ ~ ~ ~ ~ ~ ~ ~ ~40 VGRL 12 1 ~ GR VFR C F65 VGRSL 22 1 F SBK VFR F/VF F/M10 COSL 8 1 M SBK VFR F/F/F F/M/CL5 COSL 8 1 M SBK VFR VF/F F/M~ ~ ~ ~ ~ ~ ~ ~ ~
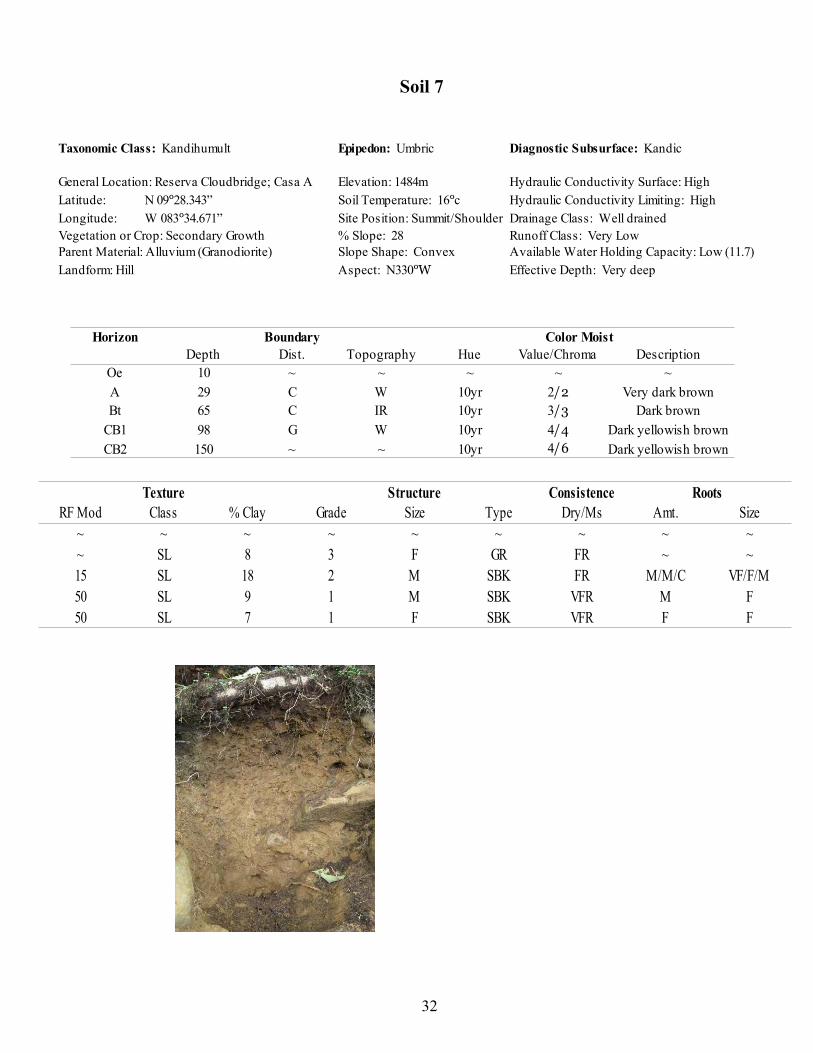
Soil 7
32
Horizon Boundary Color MoistDepth Dist. Topography Hue Value/Chroma Description
Oe 10 ~ ~ ~ ~ ~
A 29 C W 10yr Very dark brownBt 65 C IR 10yr Dark brown
CB1 98 G W 10yr Dark yellowish brown
CB2 150 ~ ~ 10yr Dark yellowish brown
2/23/34/44/6
Texture Structure Consistence RootsRF Mod Class % Clay Grade Size Type Dry/Ms Amt. Size
~ ~ ~ ~ ~ ~ ~ ~ ~~ SL 8 3 F GR FR ~ ~15 SL 18 2 M SBK FR M/M/C VF/F/M50 SL 9 1 M SBK VFR M F50 SL 7 1 F SBK VFR F F
General Location: Reserva Cloudbridge; Casa A Elevation: 1484m Hydraulic Conductivity Surface: High
Latitude: Hydraulic Conductivity Limiting: High
Longitude: Site Position: Summit/Shoulder Drainage Class: Well drainedVegetation or Crop: Secondary Growth % Slope: 28 Runoff Class: Very LowParent Material: Alluvium (Granodiorite) Slope Shape: Convex Available Water Holding Capacity: Low (11.7)
Landform: Hill Effective Depth: Very deep
Taxonomic Class: Kandihumult Epipedon: Umbric Diagnostic Subsurface: Kandic
N 09°28.343” Soil Temperature: 16°c
W 083°34.671”
Aspect: N330°W

Soil 8
33
General Location: Stephan's Plantation Elevation: 1873m Hydraulic Conductivity Surface: High
Latitude: Hydraulic Conductivity Limiting: HighLongitude: Site Position: Backslope Drainage Class: Excessively drainedVegetation or Crop: Failed Plantation % Slope: 44 Runoff Class: HighParent Material: Granodiorite Slope Shape: Convex Available Water Holding Capacity: Moderate (17.6)
Landform: Moutain Effective Depth: Very deep
Taxonomic Class: Humic Dystrudept Epipedon: Umbric Diagnostic Subsurface: Cambic
N 09°28.312” Soil Temperature: 14.5°cW 083°34.059”
Aspect: N350°W
Horizon Boundary Color MoistDepth Dist. Topography Hue Value/Chroma Description
Oe 4 A ~ ~ ~ ~
A 18 C W 10yr Very dark brownBw 52 C S 2.5y Dark olive brown
CB1 83 C S 2.5y Olive brown
CB2 125 C S 2.5y Light olive brown
2/23/34/45/4
Texture Structure Consistence RootsRF Mod Class % Clay Grade Size Type Dry/Ms Amt. Size
~ ~ ~ ~ ~ ~ ~ ~ ~~ SL 9 3 F/M GR VFR M/M F/VF~ SL 11 2 M SBK VFR M/M VF/F~ LS 8 1 M SBK VFR F/C VF/F~ LS 8 1 M SBK VFR F/F F/M
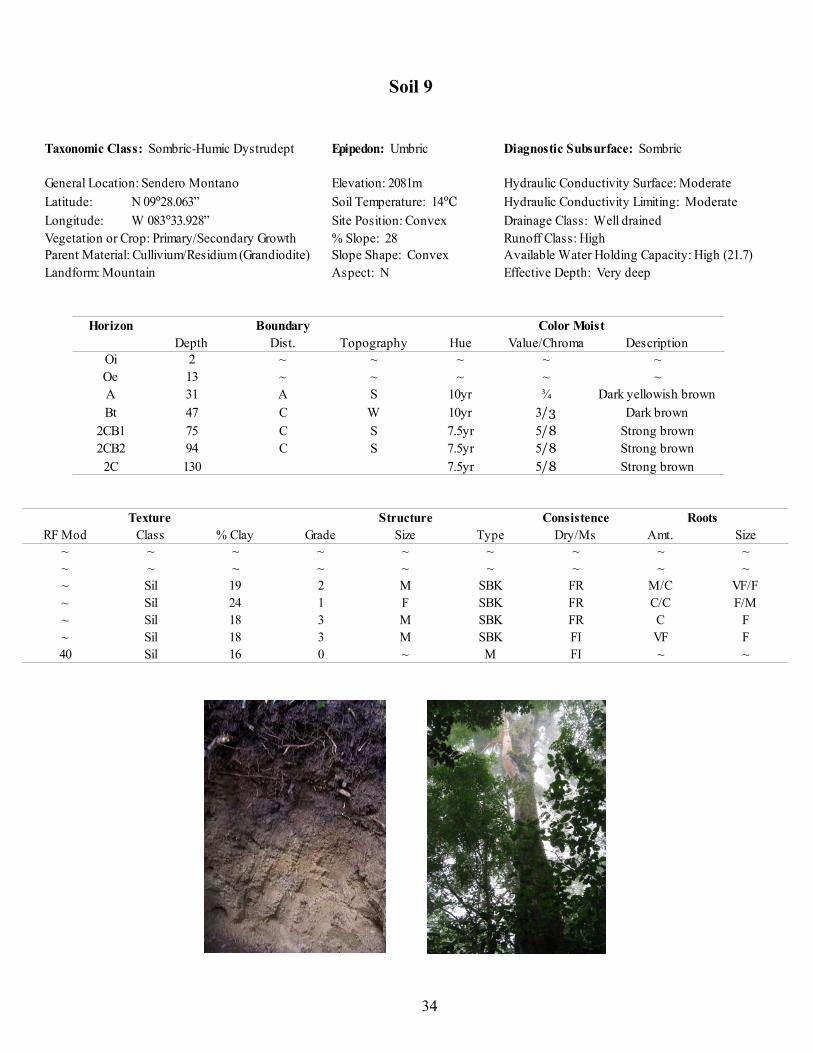
Soil 9
34
General Location: Sendero Montano Elevation: 2081m Hydraulic Conductivity Surface: ModerateLatitude: Hydraulic Conductivity Limiting: ModerateLongitude: Site Position: Convex Drainage Class: Well drainedVegetation or Crop: Primary/Secondary Growth % Slope: 28 Runoff Class: HighParent Material: Cullivium/Residium (Grandiodite) Slope Shape: Convex Available Water Holding Capacity: High (21.7)Landform: Mountain Aspect: N Effective Depth: Very deep
Taxonomic Class: Sombric-Humic Dystrudept Epipedon: Umbric Diagnostic Subsurface: Sombric
N 09°28.063” Soil Temperature: 14°CW 083°33.928”
Horizon Boundary Color MoistDepth Dist. Topography Hue Value/Chroma Description
Oi 2 ~ ~ ~ ~ ~Oe 13 ~ ~ ~ ~ ~A 31 A S 10yr ¾ Dark yellowish brownBt 47 C W 10yr Dark brown
2CB1 75 C S 7.5yr Strong brown2CB2 94 C S 7.5yr Strong brown
2C 130 7.5yr Strong brown
3/35/85/85/8
Texture Structure Consistence RootsRF Mod Class % Clay Grade Size Type Dry/Ms Amt. Size
~ ~ ~ ~ ~ ~ ~ ~ ~~ ~ ~ ~ ~ ~ ~ ~ ~~ Sil 19 2 M SBK FR M/C VF/F~ Sil 24 1 F SBK FR C/C F/M~ Sil 18 3 M SBK FR C F~ Sil 18 3 M SBK FI VF F40 Sil 16 0 ~ M FI ~ ~
Soil 10
35
General Location: Sendero Jilguero Hectare Elevation: 1990m Hydraulic Conductivity Surface: Moderate
Latitude: Hydraulic Conductivity Limiting: ModerateLongitude: Site Position: Convex Drainage Class: Well drainedVegetation or Crop: Primary Growth Runoff Class: ModerateParent Material: Grandiodite Slope Shape: Convex Available Water Holding Capacity: Moderate (17)Landform: Drumlin Effective Depth: Very deep
Taxonomic Class: Typic Dystrudept Epipedon: Ochric Diagnostic Subsurface: Cambic
N 09°28.006” Soil Temperature: 14°cW 083°33.265”
% Slope: 35°
Aspect: W270°
Horizon Boundary Color MoistDepth Dist. Topography Hue Value/Chroma Description
Oi 2 ~ ~ ~ ~ ~Oa 10 ~ ~ ~ ~ ~
A 18 A W 7.5yr Dark brownBw 40 G S 10yr Dark yellowish brownCB 100 C S 10yr Yellowish brown
3/24/45/6
Texture Structure Consistence RootsRF Mod Class % Clay Grade Size Type Dry/Ms Amt. Size
~ ~ ~ ~ ~ ~ ~ ~ ~~ ~ ~ ~ ~ ~ ~ ~ ~~ SL 8 1 F GR VFR M/M VF/F~ SL 10 1 M SBK FR C F~ LS 8 1 M SBK VFR F C

Soil 11
36
General Location: Sendero Rio Elevation: 1642m Hydraulic Conductivity Surface: High
Latitude: Hydraulic Conductivity Limiting: High
Longitude: Site Position: Toe slope Drainage Class: Well drainedVegetation or Crop: Knee high grasses /Forbs Runoff Class: LowParent Material: Granodiorite Slope Shape: Convex Available Water Holding Capacity: Moderate (16.4)
Landform: Mountain Effective Depth: Very deep
Taxonomic Class: Humic Dystrudept Epipedon: Umbric Diagnostic Subsurface: Cambic
N 09°28.415” Soil Temperature: 17°c
W 083°33.289”% Slope: 14°
Aspect: N310W°
Horizon Boundary Color MoistDepth Dist. Topography Hue Value/Chroma Description
Oi 6 A ~ Mat of identified decomposing grassOe 14 A ~ Moderate decomposed fibers are identifiableOa 20 A ~ Highly decomposed; No fibers or grasses are identifiable
A 33 G S 10yrBw 53 G S 10yr ¾CB G S 10yr
2/2
90+ 4/4
Texture Structure Consistence RootsRF Mod Class % Clay Grade Size Type Dry/Ms Amt. Size
SL 8 1 M SBK FR M VFSL 8 1 M SBK FR C F
35 LS 8 1 F SBK VFR C F
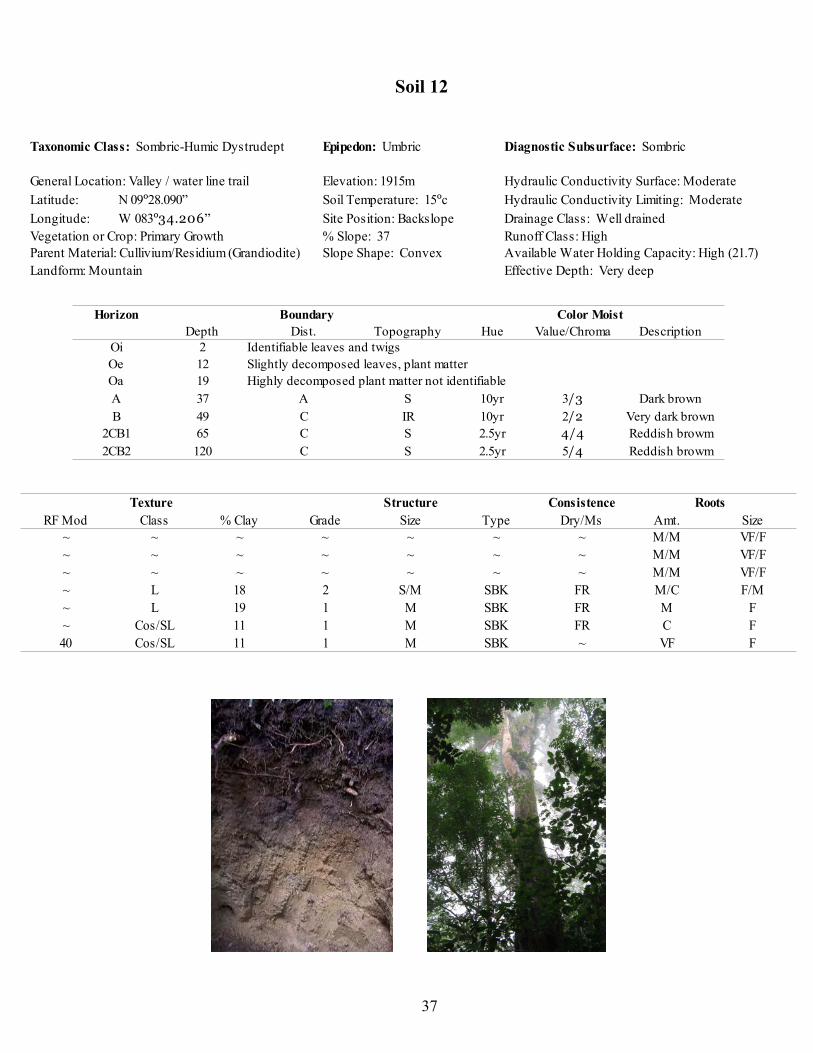
Soil 12
37
General Location: Valley / water line trail Elevation: 1915m Hydraulic Conductivity Surface: ModerateLatitude: Hydraulic Conductivity Limiting: ModerateLongitude: Site Position: Backslope Drainage Class: Well drainedVegetation or Crop: Primary Growth % Slope: 37 Runoff Class: HighParent Material: Cullivium/Residium (Grandiodite) Slope Shape: Convex Available Water Holding Capacity: High (21.7)Landform: Mountain Effective Depth: Very deep
Taxonomic Class: Sombric-Humic Dystrudept Epipedon: Umbric Diagnostic Subsurface: Sombric
N 09°28.090” Soil Temperature: 15°cW 083°34.206”
Horizon Boundary Color MoistDepth Dist. Topography Hue Value/Chroma Description
2 Identifiable leaves and twigs12 Slightly decomposed leaves, plant matter19 Highly decomposed plant matter not identifiable
A 37 A S 10yr Dark brownB 49 C IR 10yr Very dark brown
2CB1 65 C S 2.5yr2CB2 120 C S 2.5yr
OiOeOa
3/32/24/4 Reddish browm5/4 Reddish browm
Texture Structure Consistence RootsRF Mod Class % Clay Grade Size Type Dry/Ms Amt. Size
~ ~ ~ ~ ~ ~ ~ M/M VF/F~ ~ ~ ~ ~ ~ ~ M/M VF/F~ ~ ~ ~ ~ ~ ~ M/M VF/F~ L 18 2 S/M SBK FR M/C F/M~ L 19 1 M SBK FR M F~ Cos/SL 11 1 M SBK FR C F40 Cos/SL 11 1 M SBK ~ VF F