soil-structure interaction studies: research and...
TRANSCRIPT
Soil-Structure Interaction Studies: Research and
Practice Arun J. Valsangkar
University of New Brunswick & Jacques Whitford Stantec Limited, Fredericton, New Brunswick, Canada ABSTRACT Earlier research in soil-structure interaction studies was mostly theoretical in nature with solutions presented for a number of boundary value problems based either on soil continuum models or discrete spring idealization for soil. In more recent years, numerical modeling has been used to analyze many complex soil-structure interaction problems for which earlier closed form solutions were inapplicable. In this presentation, results of some of the research carried out in the field of soil-structure interaction at the University of New Brunswick are presented. In view of the complex nature of the problem, the research approach adopted combines instrumentation and monitoring of prototype structures, physical modeling and numerical analysis. The presentation includes research on: (a) raft foundation and slabs on grade; and (b) soil-arching in induced trench rigid culverts. The main focus of this research has been to critically evaluate commonly used design approaches. RÉSUMÉ En général, les recherches antérieures sur les interactions sol-structure ont été plus souvent que non des études théoriques en nature avec les solutions présentées pour un nombre de problèmes limites basées soit sur la supposition que le sol est un continuum élastoplastique ou l’idéalisation du sol avec des modèles discrets de ressort. Au cours des dernières années, la modélisation numérique a été utilisée pour analyser de multiples cas complexes d’interaction sol-structure où la résolution analytique développé antérieurement était inapplicable. Dans cette présentation, les résultats de certaines recherches menées dans le domaine de l'interaction sol-structure à l'Université du Nouveau-Brunswick sont présentés. Compte tenu de la nature complexe du problème, l'approche de recherche adoptée combine l'instrumentation et la surveillance de structures et de prototypes, la modélisation physique et l'analyse numérique. La présentation comprend des travaux de recherche sur: (a) l’utilisation de radier et des dalles sur le sol, et (b) l’effet de voûte pour les installations de tranchée induites pour les ponceaux rigides. L'objectif principal de cette recherche a été d'évaluer de manière critique la conception des approches utilisées couramment. 1.0 INTRODUCTION The presentation will cover the following two topics:
(a) structural mat foundations and fiber reinforced
slabs on grade; and (b) soil arching in induced trench rigid culverts. The soil-structure interaction issues pertaining to the
structural raft behavior are illustrated with two case studies. Both of these case studies resulted initially from consulting assignments but subsequently lead to research pertaining to in depth evaluation of commonly used design approach. Results of physical modeling are also presented to discuss the design issues pertaining to the fiber reinforced slabs on grade.
The effect of positive and negative arching on the earth pressures exerted on rigid culverts has been an active topic of research for almost 60 years or more. The detailed analysis for induced trench culverts was presented by Spangler & Handy (1973) and this simple approach formed the basis of design of such culverts for a number of years. However, in spite of a long history of induced trench construction, the design and construction of these culverts has remained controversial. Many jurisdictions in North America do not use this method, but this design has been very successfully used in the Province of New Brunswick. In order to validate the design and construction of induced trench culverts, an
inspection program of such culverts in New Brunswick was undertaken by New Brunswick Department of Transportation. Following this review, two prototype structures were instrumented and monitored along with extensive series of centrifuge tests. The results of prototype monitoring and physical modeling were supplemented with numerical analysis to understand soil-structure interaction of induced trench culvert construction. 2.0 STRUCTURAL RAFT BEHAVIOUR The first case study deals with a structural raft supporting a multistory structure in downtown Fredericton, New Brunswick (Landva et al. 1988). The soil stratigraphy in the downtown area typically consists of ± 3 m of heterogeneous fill overlying a ± 30 m thick layer of uniform coarse sand that is underlain by a 30 m thick layer classified as clayey silt/silty clay. The soil below 36 m depth consists of interchanging layers of stiff clay and dense sand underlain by glacial till. The groundwater table was observed to be at a depth of 3 m. In addition to drilling several boreholes at the site, flat dilatometer and self-boring pressure meter tests were performed at the site to determine geotechnical parameters of clayey silt/silty clay. Detailed geotechnical properties for silty clay/clayey silt are presented in Landva et al. (1988).
1
GeoHalifax2009/GéoHalifax2009

The Bank of Montreal building is nine storied high with one level of underground parking and is founded on a structural raft foundation as shown in Figure 1. The building is a reinforced concrete frame structure with precast concrete panel cladding. Figure 1 also shows the soil stratigraphy and perimeter sheet piling used for supporting excavation carried out for the construction of underground parking.
The raft foundation of the building is approximately rectangular in shape with overall dimensions of 50.3 x 39.6 m (Figure 2). The raft is 1.0 m thick and has two way reinforcements both at the top and bottom. The building also has a two-storey portion which is 18.2 m x 6.7 m in plan and is supported on a 300 mm thick reinforced raft that thickens to 500 mm at the perimeter to support walls. The two-storey supporting raft is hinge connected to the main raft to accommodate differential settlements due to significant variation in loading between two sections.
Figure 1. Cross section along column line 3.
In order to monitor the performance of the main raft foundation, the following instrumentation was installed: (i) nine pneumatic earth pressure cells to measure contact pressure below raft; (ii) four pneumatic piezometers to measure pore pressures in the clayey silt layer; and (iii) various settlement points installed on the raft and in the clayey silt layer. Figure 2 shows the plan layout of the instrumentation.
In this presentation only observed versus predicted contact pressures and settlements are discussed. The data pertaining to bottom heave and pore pressures are presented in Landva et al. (1988) and Alkins (1983).
Figure 2. Plan of raft and location of instrumentation.
The predicted trends of contact pressure and settlements along column lines J are presented in Figure 3. The predicted settlement and contact pressures in this figure are based on the analysis carried out by the structural consultants for the project using Winkler model hypothesis. Figure 3 also shows the measured contact pressures and settlements along column line J. It is noted that the trends predicted based on Winkler model are opposite to those observed in the field.
A two-dimensional finite element analysis of the raft was also carried out to determine the settlements and maximum bending movements in the raft (Landva et al. 1988). The soil sub-grade modulus was assigned a value of 64 kPa/cm as assumed by the structural consultant of the project. Figure 4 shows the contour plan of observed raft settlements. The predicted settlements are shown in Figure 5 and as can be seen, these compare poorly with the observed settlements. To account for the contribution of soil stiffness outside the edges of the raft, it is suggested to double the subgrade modulus by a factor of two (Bowles, 1996). Figure 6 shows predicted settlements by doubling the sub-grade modules value along the perimeter of the raft and this change results in relatively better correspondence between the predicted and observed settlements.
2
GeoHalifax2009/GéoHalifax2009
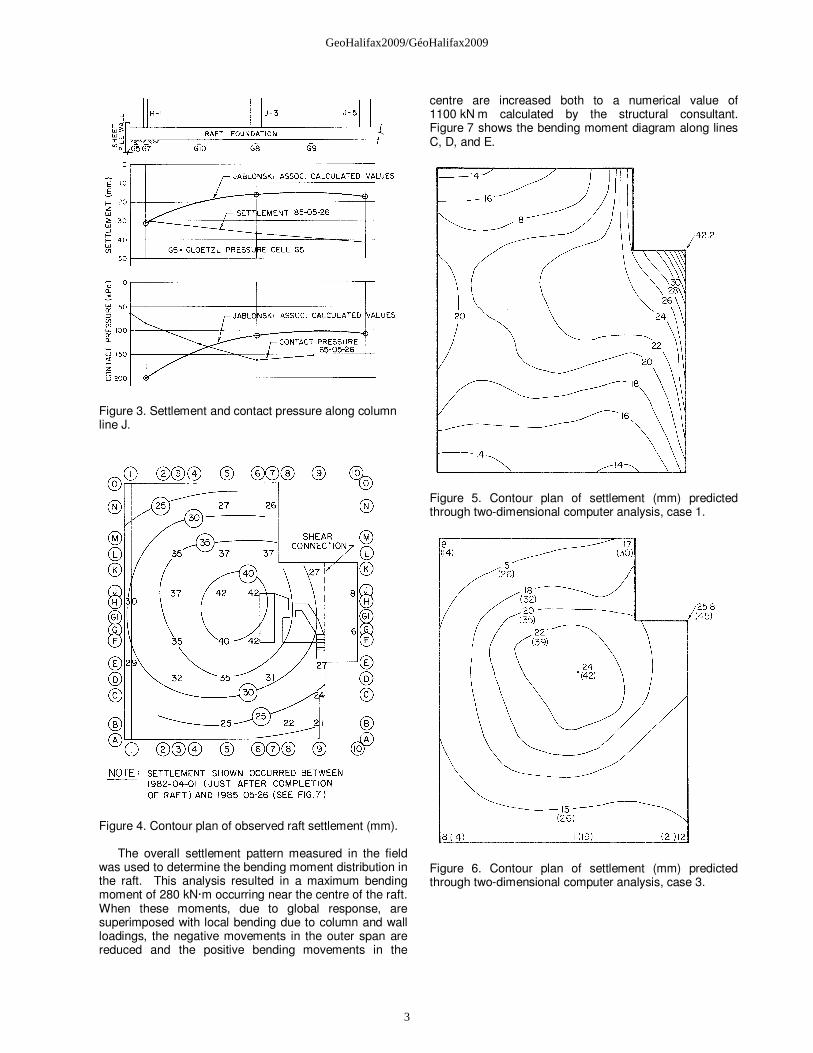
Figure 3. Settlement and contact pressure along column line J.
Figure 4. Contour plan of observed raft settlement (mm).
The overall settlement pattern measured in the field was used to determine the bending moment distribution in the raft. This analysis resulted in a maximum bending moment of 280 kN·m occurring near the centre of the raft. When these moments, due to global response, are superimposed with local bending due to column and wall loadings, the negative movements in the outer span are reduced and the positive bending movements in the
centre are increased both to a numerical value of 1100 kN m calculated by the structural consultant. Figure 7 shows the bending moment diagram along lines C, D, and E.
Figure 5. Contour plan of settlement (mm) predicted through two-dimensional computer analysis, case 1.
Figure 6. Contour plan of settlement (mm) predicted through two-dimensional computer analysis, case 3.
3
GeoHalifax2009/GéoHalifax2009
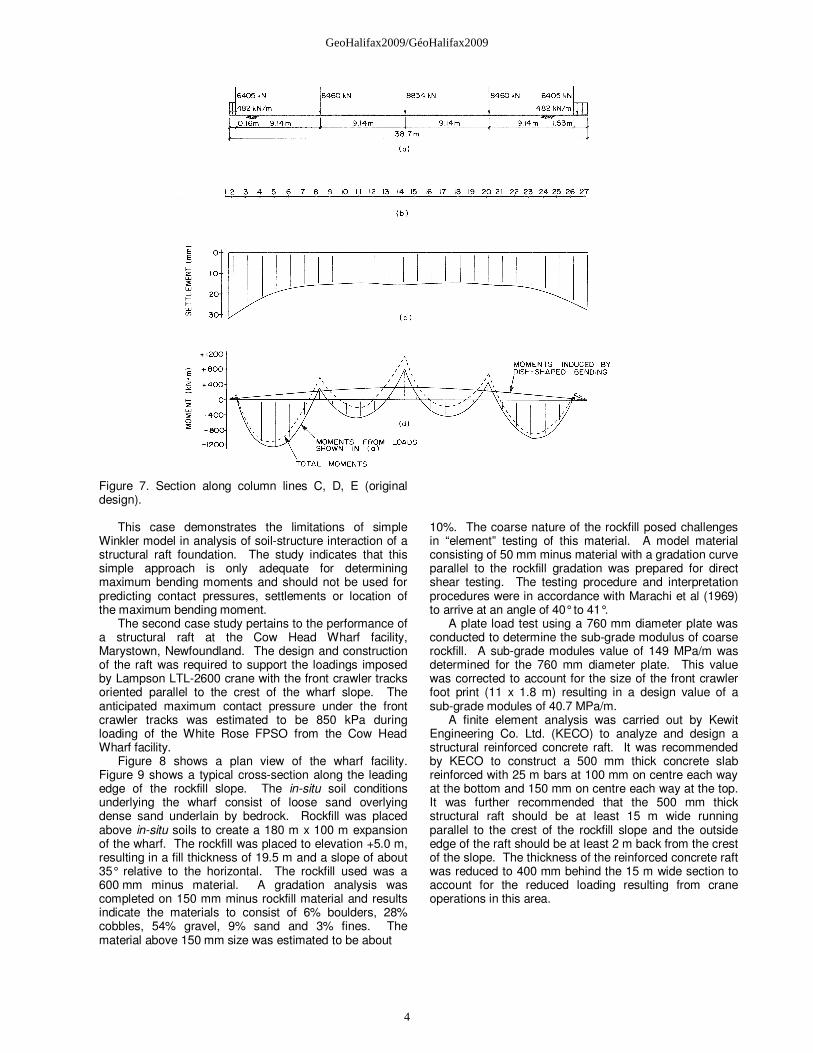
Figure 7. Section along column lines C, D, E (original design).
This case demonstrates the limitations of simple Winkler model in analysis of soil-structure interaction of a structural raft foundation. The study indicates that this simple approach is only adequate for determining maximum bending moments and should not be used for predicting contact pressures, settlements or location of the maximum bending moment.
The second case study pertains to the performance of a structural raft at the Cow Head Wharf facility, Marystown, Newfoundland. The design and construction of the raft was required to support the loadings imposed by Lampson LTL-2600 crane with the front crawler tracks oriented parallel to the crest of the wharf slope. The anticipated maximum contact pressure under the front crawler tracks was estimated to be 850 kPa during loading of the White Rose FPSO from the Cow Head Wharf facility.
Figure 8 shows a plan view of the wharf facility. Figure 9 shows a typical cross-section along the leading edge of the rockfill slope. The in-situ soil conditions underlying the wharf consist of loose sand overlying dense sand underlain by bedrock. Rockfill was placed above in-situ soils to create a 180 m x 100 m expansion of the wharf. The rockfill was placed to elevation +5.0 m, resulting in a fill thickness of 19.5 m and a slope of about 35° relative to the horizontal. The rockfill used was a 600 mm minus material. A gradation analysis was completed on 150 mm minus rockfill material and results indicate the materials to consist of 6% boulders, 28% cobbles, 54% gravel, 9% sand and 3% fines. The material above 150 mm size was estimated to be about
10%. The coarse nature of the rockfill posed challenges in “element” testing of this material. A model material consisting of 50 mm minus material with a gradation curve parallel to the rockfill gradation was prepared for direct shear testing. The testing procedure and interpretation procedures were in accordance with Marachi et al (1969) to arrive at an angle of 40° to 41°.
A plate load test using a 760 mm diameter plate was conducted to determine the sub-grade modulus of coarse rockfill. A sub-grade modules value of 149 MPa/m was determined for the 760 mm diameter plate. This value was corrected to account for the size of the front crawler foot print (11 x 1.8 m) resulting in a design value of a sub-grade modules of 40.7 MPa/m.
A finite element analysis was carried out by Kewit Engineering Co. Ltd. (KECO) to analyze and design a structural reinforced concrete raft. It was recommended by KECO to construct a 500 mm thick concrete slab reinforced with 25 m bars at 100 mm on centre each way at the bottom and 150 mm on centre each way at the top. It was further recommended that the 500 mm thick structural raft should be at least 15 m wide running parallel to the crest of the rockfill slope and the outside edge of the raft should be at least 2 m back from the crest of the slope. The thickness of the reinforced concrete raft was reduced to 400 mm behind the 15 m wide section to account for the reduced loading resulting from crane operations in this area.
4
GeoHalifax2009/GéoHalifax2009
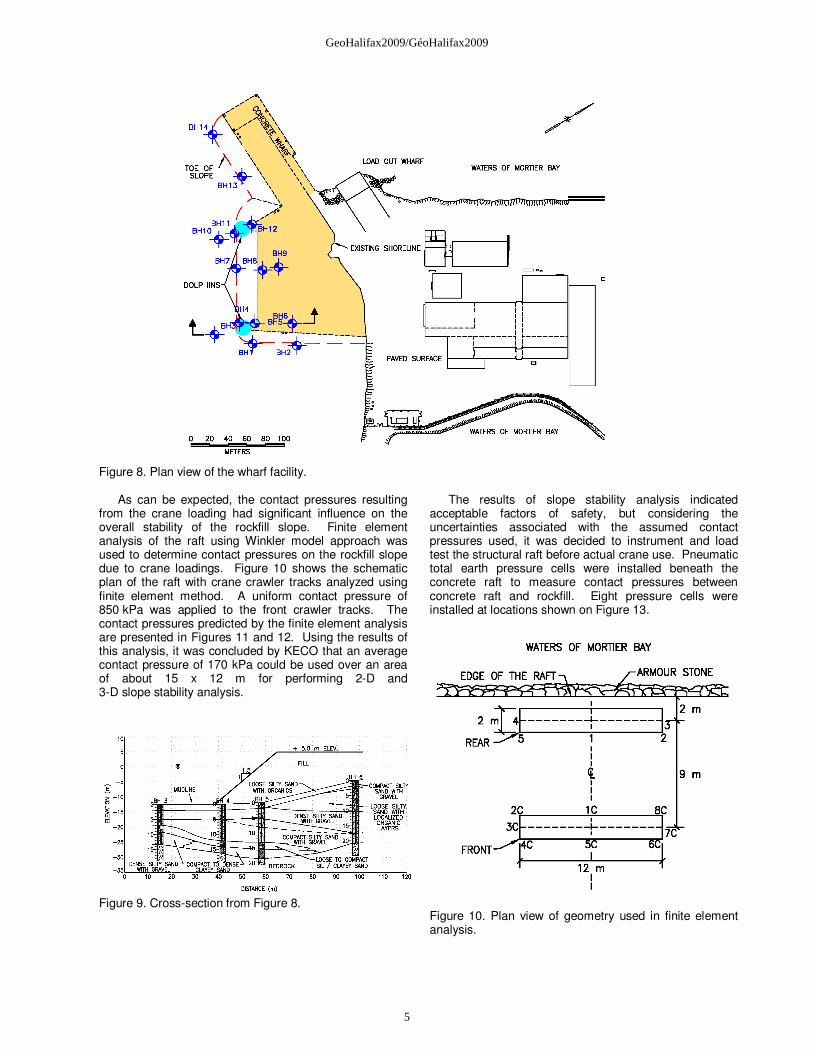
Figure 8. Plan view of the wharf facility.
As can be expected, the contact pressures resulting
from the crane loading had significant influence on the overall stability of the rockfill slope. Finite element analysis of the raft using Winkler model approach was used to determine contact pressures on the rockfill slope due to crane loadings. Figure 10 shows the schematic plan of the raft with crane crawler tracks analyzed using finite element method. A uniform contact pressure of 850 kPa was applied to the front crawler tracks. The contact pressures predicted by the finite element analysis are presented in Figures 11 and 12. Using the results of this analysis, it was concluded by KECO that an average contact pressure of 170 kPa could be used over an area of about 15 x 12 m for performing 2-D and 3-D slope stability analysis.
Figure 9. Cross-section from Figure 8.
The results of slope stability analysis indicated
acceptable factors of safety, but considering the uncertainties associated with the assumed contact pressures used, it was decided to instrument and load test the structural raft before actual crane use. Pneumatic total earth pressure cells were installed beneath the concrete raft to measure contact pressures between concrete raft and rockfill. Eight pressure cells were installed at locations shown on Figure 13.
Figure 10. Plan view of geometry used in finite element analysis.
5
GeoHalifax2009/GéoHalifax2009
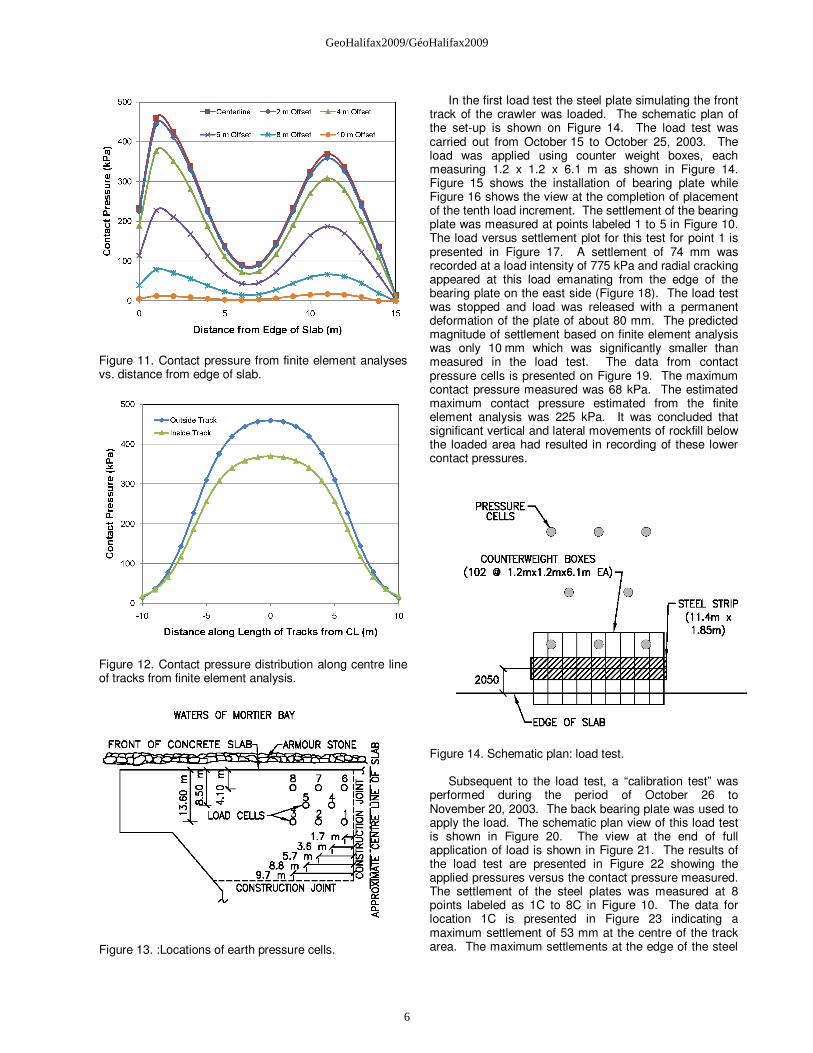
Figure 11. Contact pressure from finite element analyses vs. distance from edge of slab.
Figure 12. Contact pressure distribution along centre line of tracks from finite element analysis.
Figure 13. :Locations of earth pressure cells.
In the first load test the steel plate simulating the front track of the crawler was loaded. The schematic plan of the set-up is shown on Figure 14. The load test was carried out from October 15 to October 25, 2003. The load was applied using counter weight boxes, each measuring 1.2 x 1.2 x 6.1 m as shown in Figure 14. Figure 15 shows the installation of bearing plate while Figure 16 shows the view at the completion of placement of the tenth load increment. The settlement of the bearing plate was measured at points labeled 1 to 5 in Figure 10. The load versus settlement plot for this test for point 1 is presented in Figure 17. A settlement of 74 mm was recorded at a load intensity of 775 kPa and radial cracking appeared at this load emanating from the edge of the bearing plate on the east side (Figure 18). The load test was stopped and load was released with a permanent deformation of the plate of about 80 mm. The predicted magnitude of settlement based on finite element analysis was only 10 mm which was significantly smaller than measured in the load test. The data from contact pressure cells is presented on Figure 19. The maximum contact pressure measured was 68 kPa. The estimated maximum contact pressure estimated from the finite element analysis was 225 kPa. It was concluded that significant vertical and lateral movements of rockfill below the loaded area had resulted in recording of these lower contact pressures.
Figure 14. Schematic plan: load test. Subsequent to the load test, a “calibration test” was
performed during the period of October 26 to November 20, 2003. The back bearing plate was used to apply the load. The schematic plan view of this load test is shown in Figure 20. The view at the end of full application of load is shown in Figure 21. The results of the load test are presented in Figure 22 showing the applied pressures versus the contact pressure measured. The settlement of the steel plates was measured at 8 points labeled as 1C to 8C in Figure 10. The data for location 1C is presented in Figure 23 indicating a maximum settlement of 53 mm at the centre of the track area. The maximum settlements at the edge of the steel
6
GeoHalifax2009/GéoHalifax2009
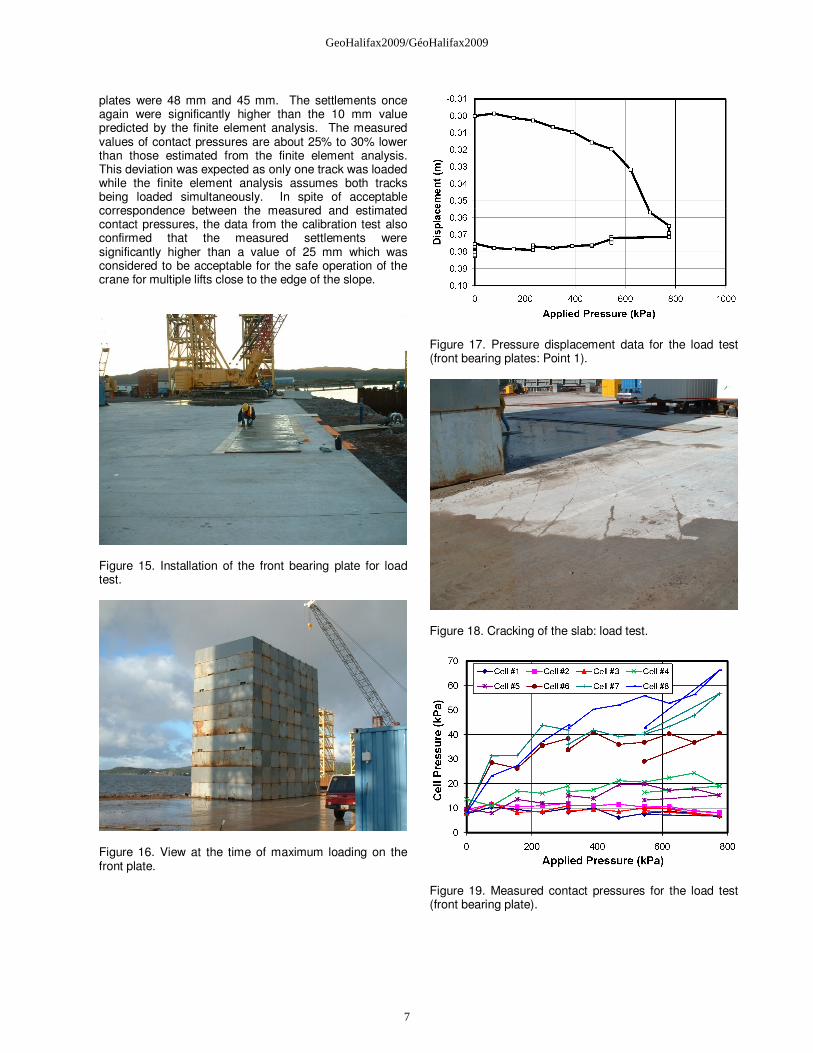
plates were 48 mm and 45 mm. The settlements once again were significantly higher than the 10 mm value predicted by the finite element analysis. The measured values of contact pressures are about 25% to 30% lower than those estimated from the finite element analysis. This deviation was expected as only one track was loaded while the finite element analysis assumes both tracks being loaded simultaneously. In spite of acceptable correspondence between the measured and estimated contact pressures, the data from the calibration test also confirmed that the measured settlements were significantly higher than a value of 25 mm which was considered to be acceptable for the safe operation of the crane for multiple lifts close to the edge of the slope.
Figure 15. Installation of the front bearing plate for load test.
Figure 16. View at the time of maximum loading on the front plate.
Figure 17. Pressure displacement data for the load test (front bearing plates: Point 1).
Figure 18. Cracking of the slab: load test.
Figure 19. Measured contact pressures for the load test (front bearing plate).
7
GeoHalifax2009/GéoHalifax2009
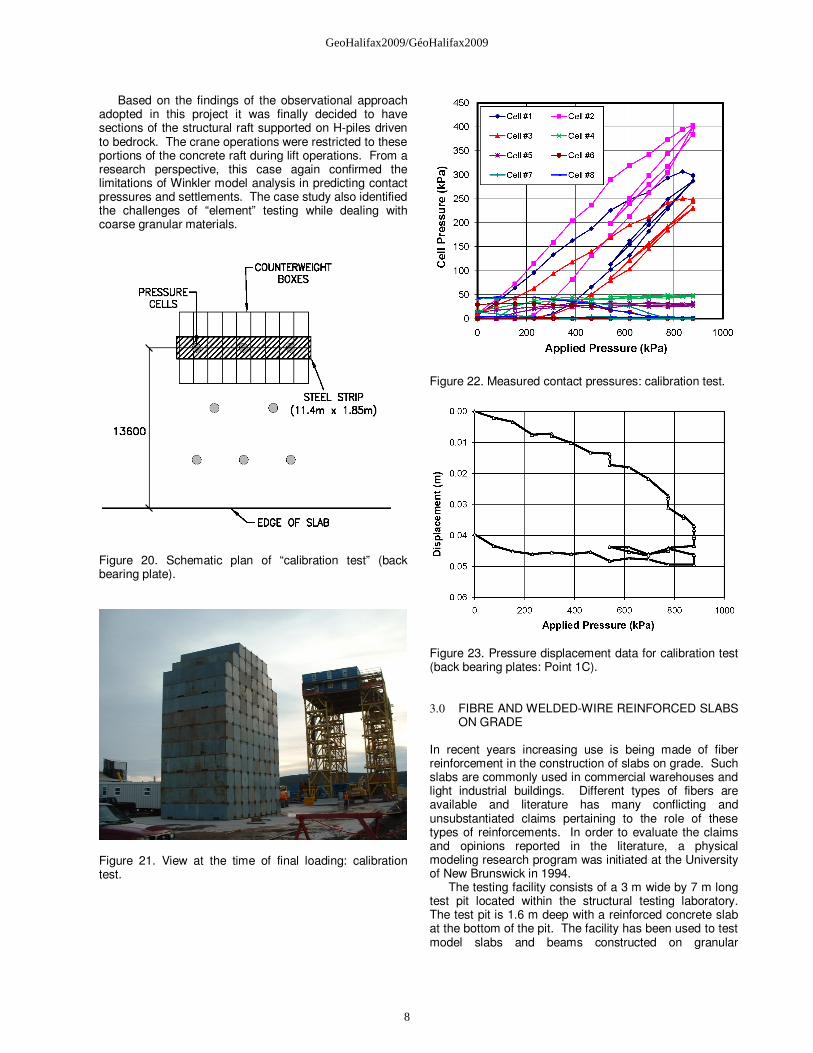
Based on the findings of the observational approach adopted in this project it was finally decided to have sections of the structural raft supported on H-piles driven to bedrock. The crane operations were restricted to these portions of the concrete raft during lift operations. From a research perspective, this case again confirmed the limitations of Winkler model analysis in predicting contact pressures and settlements. The case study also identified the challenges of “element” testing while dealing with coarse granular materials.
Figure 20. Schematic plan of “calibration test” (back bearing plate).
Figure 21. View at the time of final loading: calibration test.
Figure 22. Measured contact pressures: calibration test.
Figure 23. Pressure displacement data for calibration test (back bearing plates: Point 1C). 3.0 FIBRE AND WELDED-WIRE REINFORCED SLABS
ON GRADE In recent years increasing use is being made of fiber reinforcement in the construction of slabs on grade. Such slabs are commonly used in commercial warehouses and light industrial buildings. Different types of fibers are available and literature has many conflicting and unsubstantiated claims pertaining to the role of these types of reinforcements. In order to evaluate the claims and opinions reported in the literature, a physical modeling research program was initiated at the University of New Brunswick in 1994.
The testing facility consists of a 3 m wide by 7 m long test pit located within the structural testing laboratory. The test pit is 1.6 m deep with a reinforced concrete slab at the bottom of the pit. The facility has been used to test model slabs and beams constructed on granular
8
GeoHalifax2009/GéoHalifax2009
subgrade (Irving 1996 and Briggs 2007). Twenty one model slabs of dimensions 2.5 m x 2.5 m x 150 mm were tested under a central load distributed over a 100 x 100 mm bearing plate. The type of reinforcement, edge restraint conditions of the slab and compaction of the subgrade supporting the slabs were varied in the testing program. The findings from the slab testing program have been reported by Bischoff et al. (2003) and are summarized in this presentation.
High performance steel fibers and fibrillated polypropylene fibers were used to provide nominal reinforcement at 0.1% and moderate reinforcement at 0.4% by volume. A single top layer (located 50 mm below the top face) and double layer (50 mm from top and bottom faces) of welded wire mesh reinforcement (WWR) was also used to reinforce the model slab. A plain reinforced concrete slab was also tested for reference purposes. The low dosage of steel fiber (SFRC) mix is typically not used in slabs but was included for comparison with the low dosage polypropylene fiber reinforced concrete (PFRC). Mesh reinforcement was selected to give comparable toughness of SFRC slab. Tests were carried out on either loose or compacted subgrade with subgrade modules values for 300 mm diameter plate of 15 and 75 MN/m3.
Ready mix concrete was used for all tests and the details of the mix design are presented in Bischoff et. al (2003). Control cylinders (150 mm diameter by 300 mm) and flexural beams (152 x 152 x 530 mm) were also tested for each slab to determine compressive strength (fc), flexural strength (fr) under three point loading and residual strength factor (R10,150). The details of the test program and mechanical properties of the concrete are reported in Bischoff et al. (2003).
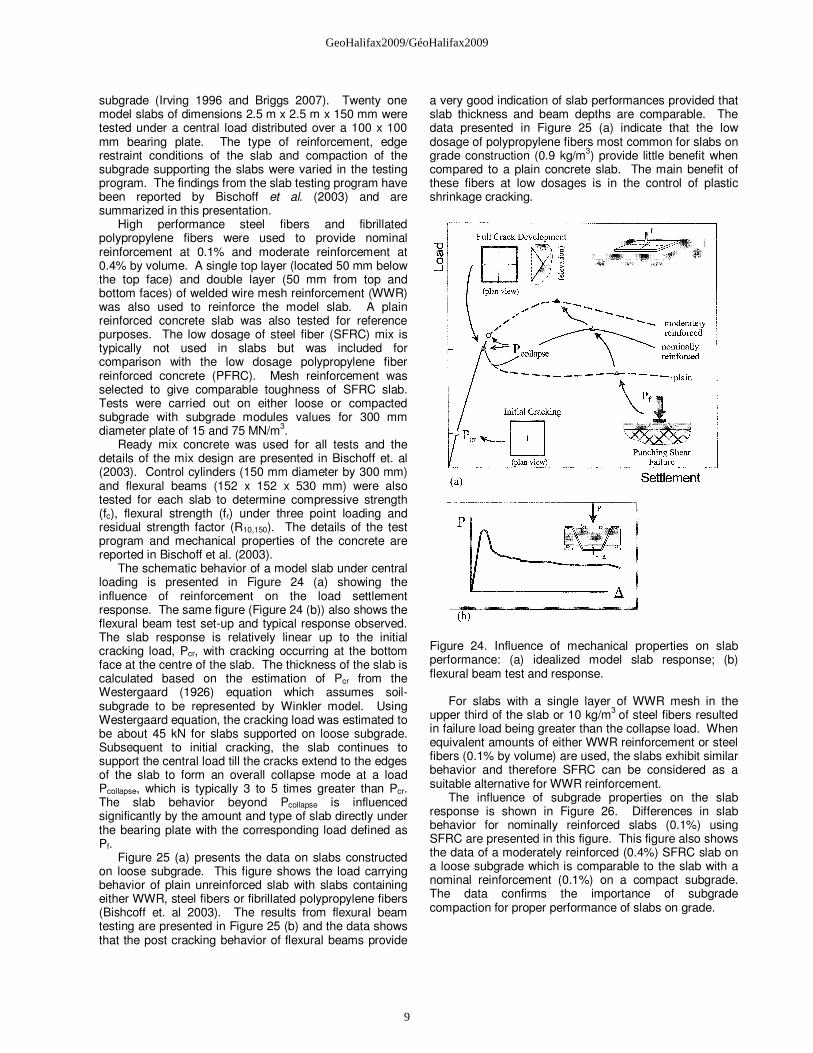
The schematic behavior of a model slab under central loading is presented in Figure 24 (a) showing the influence of reinforcement on the load settlement response. The same figure (Figure 24 (b)) also shows the flexural beam test set-up and typical response observed. The slab response is relatively linear up to the initial cracking load, Pcr, with cracking occurring at the bottom face at the centre of the slab. The thickness of the slab is calculated based on the estimation of Pcr from the Westergaard (1926) equation which assumes soil-subgrade to be represented by Winkler model. Using Westergaard equation, the cracking load was estimated to be about 45 kN for slabs supported on loose subgrade. Subsequent to initial cracking, the slab continues to support the central load till the cracks extend to the edges of the slab to form an overall collapse mode at a load Pcollapse, which is typically 3 to 5 times greater than Pcr. The slab behavior beyond Pcollapse is influenced significantly by the amount and type of slab directly under the bearing plate with the corresponding load defined as Pf.
Figure 25 (a) presents the data on slabs constructed on loose subgrade. This figure shows the load carrying behavior of plain unreinforced slab with slabs containing either WWR, steel fibers or fibrillated polypropylene fibers (Bishcoff et. al 2003). The results from flexural beam testing are presented in Figure 25 (b) and the data shows that the post cracking behavior of flexural beams provide
a very good indication of slab performances provided that slab thickness and beam depths are comparable. The data presented in Figure 25 (a) indicate that the low dosage of polypropylene fibers most common for slabs on grade construction (0.9 kg/m3) provide little benefit when compared to a plain concrete slab. The main benefit of these fibers at low dosages is in the control of plastic shrinkage cracking.
Figure 24. Influence of mechanical properties on slab performance: (a) idealized model slab response; (b) flexural beam test and response.
For slabs with a single layer of WWR mesh in the
upper third of the slab or 10 kg/m3 of steel fibers resulted in failure load being greater than the collapse load. When equivalent amounts of either WWR reinforcement or steel fibers (0.1% by volume) are used, the slabs exhibit similar behavior and therefore SFRC can be considered as a suitable alternative for WWR reinforcement.
The influence of subgrade properties on the slab response is shown in Figure 26. Differences in slab behavior for nominally reinforced slabs (0.1%) using SFRC are presented in this figure. This figure also shows the data of a moderately reinforced (0.4%) SFRC slab on a loose subgrade which is comparable to the slab with a nominal reinforcement (0.1%) on a compact subgrade. The data confirms the importance of subgrade compaction for proper performance of slabs on grade.
9
GeoHalifax2009/GéoHalifax2009
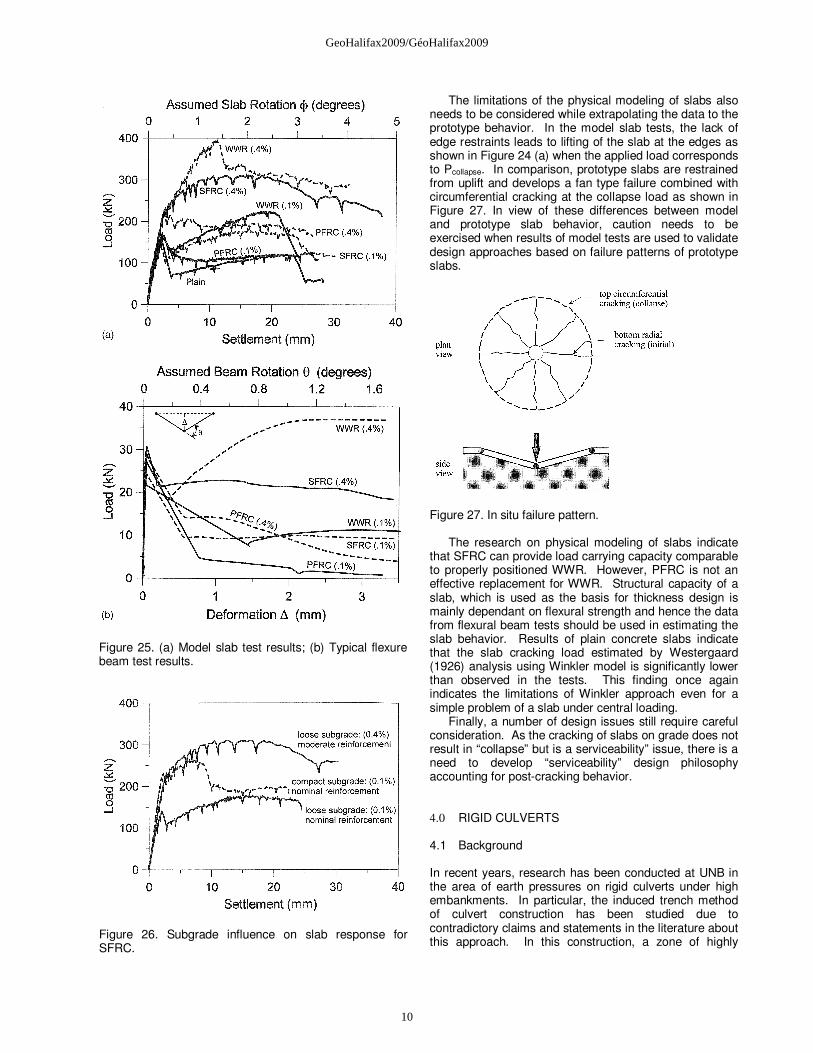
Figure 25. (a) Model slab test results; (b) Typical flexure beam test results.
Figure 26. Subgrade influence on slab response for SFRC.
The limitations of the physical modeling of slabs also needs to be considered while extrapolating the data to the prototype behavior. In the model slab tests, the lack of edge restraints leads to lifting of the slab at the edges as shown in Figure 24 (a) when the applied load corresponds to Pcollapse. In comparison, prototype slabs are restrained from uplift and develops a fan type failure combined with circumferential cracking at the collapse load as shown in Figure 27. In view of these differences between model and prototype slab behavior, caution needs to be exercised when results of model tests are used to validate design approaches based on failure patterns of prototype slabs.
Figure 27. In situ failure pattern.
The research on physical modeling of slabs indicate
that SFRC can provide load carrying capacity comparable to properly positioned WWR. However, PFRC is not an effective replacement for WWR. Structural capacity of a slab, which is used as the basis for thickness design is mainly dependant on flexural strength and hence the data from flexural beam tests should be used in estimating the slab behavior. Results of plain concrete slabs indicate that the slab cracking load estimated by Westergaard (1926) analysis using Winkler model is significantly lower than observed in the tests. This finding once again indicates the limitations of Winkler approach even for a simple problem of a slab under central loading.
Finally, a number of design issues still require careful consideration. As the cracking of slabs on grade does not result in “collapse” but is a serviceability” issue, there is a need to develop “serviceability” design philosophy accounting for post-cracking behavior. 4.0 RIGID CULVERTS 4.1 Background In recent years, research has been conducted at UNB in the area of earth pressures on rigid culverts under high embankments. In particular, the induced trench method of culvert construction has been studied due to contradictory claims and statements in the literature about this approach. In this construction, a zone of highly
10
GeoHalifax2009/GéoHalifax2009
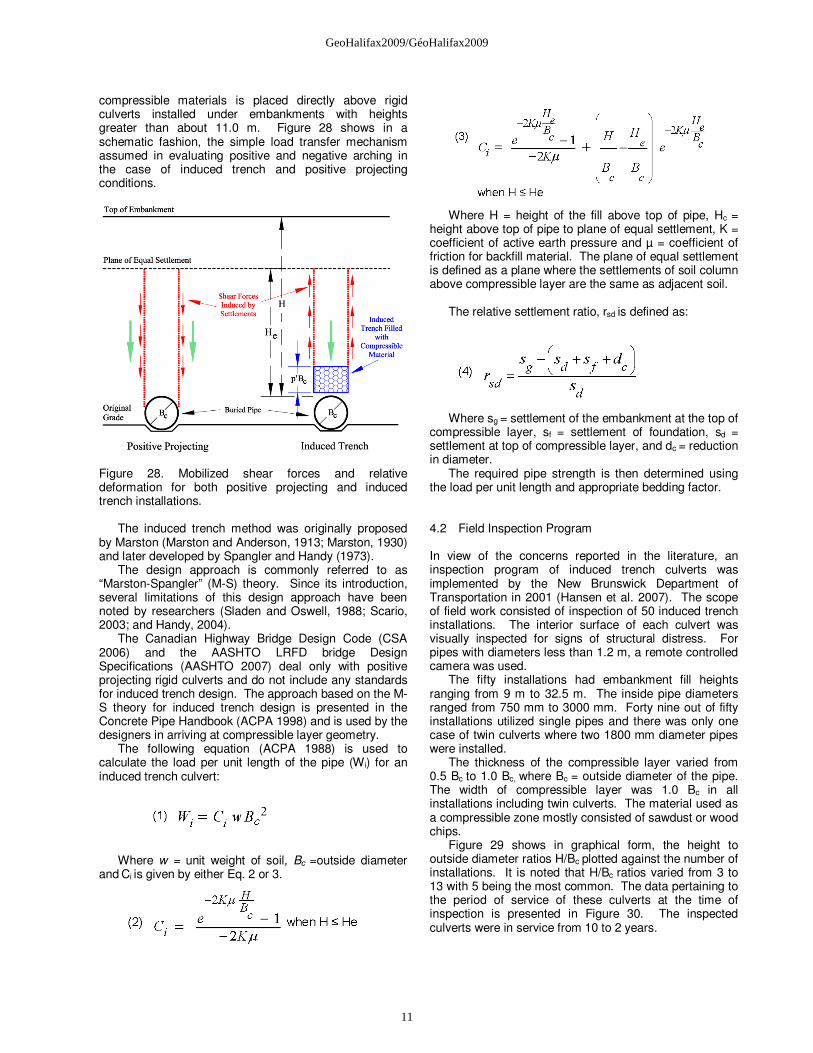
compressible materials is placed directly above rigid culverts installed under embankments with heights greater than about 11.0 m. Figure 28 shows in a schematic fashion, the simple load transfer mechanism assumed in evaluating positive and negative arching in the case of induced trench and positive projecting conditions.
Figure 28. Mobilized shear forces and relative deformation for both positive projecting and induced trench installations.
The induced trench method was originally proposed
by Marston (Marston and Anderson, 1913; Marston, 1930) and later developed by Spangler and Handy (1973).
The design approach is commonly referred to as “Marston-Spangler” (M-S) theory. Since its introduction, several limitations of this design approach have been noted by researchers (Sladen and Oswell, 1988; Scario, 2003; and Handy, 2004).
The Canadian Highway Bridge Design Code (CSA 2006) and the AASHTO LRFD bridge Design Specifications (AASHTO 2007) deal only with positive projecting rigid culverts and do not include any standards for induced trench design. The approach based on the M-S theory for induced trench design is presented in the Concrete Pipe Handbook (ACPA 1998) and is used by the designers in arriving at compressible layer geometry.
The following equation (ACPA 1988) is used to calculate the load per unit length of the pipe (Wi) for an induced trench culvert:
Where w = unit weight of soil, Bc =outside diameter
and Ci is given by either Eq. 2 or 3.
Where H = height of the fill above top of pipe, Hc =
height above top of pipe to plane of equal settlement, K = coefficient of active earth pressure and µ = coefficient of friction for backfill material. The plane of equal settlement is defined as a plane where the settlements of soil column above compressible layer are the same as adjacent soil.
The relative settlement ratio, rsd is defined as:
Where sg = settlement of the embankment at the top of
compressible layer, sf = settlement of foundation, sd = settlement at top of compressible layer, and dc = reduction in diameter.
The required pipe strength is then determined using the load per unit length and appropriate bedding factor.
4.2 Field Inspection Program
In view of the concerns reported in the literature, an inspection program of induced trench culverts was implemented by the New Brunswick Department of Transportation in 2001 (Hansen et al. 2007). The scope of field work consisted of inspection of 50 induced trench installations. The interior surface of each culvert was visually inspected for signs of structural distress. For pipes with diameters less than 1.2 m, a remote controlled camera was used.
The fifty installations had embankment fill heights ranging from 9 m to 32.5 m. The inside pipe diameters ranged from 750 mm to 3000 mm. Forty nine out of fifty installations utilized single pipes and there was only one case of twin culverts where two 1800 mm diameter pipes were installed.
The thickness of the compressible layer varied from 0.5 Bc to 1.0 Bc, where Bc = outside diameter of the pipe. The width of compressible layer was 1.0 Bc in all installations including twin culverts. The material used as a compressible zone mostly consisted of sawdust or wood chips.
Figure 29 shows in graphical form, the height to outside diameter ratios H/Bc plotted against the number of installations. It is noted that H/Bc ratios varied from 3 to 13 with 5 being the most common. The data pertaining to the period of service of these culverts at the time of inspection is presented in Figure 30. The inspected culverts were in service from 10 to 2 years.
11
GeoHalifax2009/GéoHalifax2009
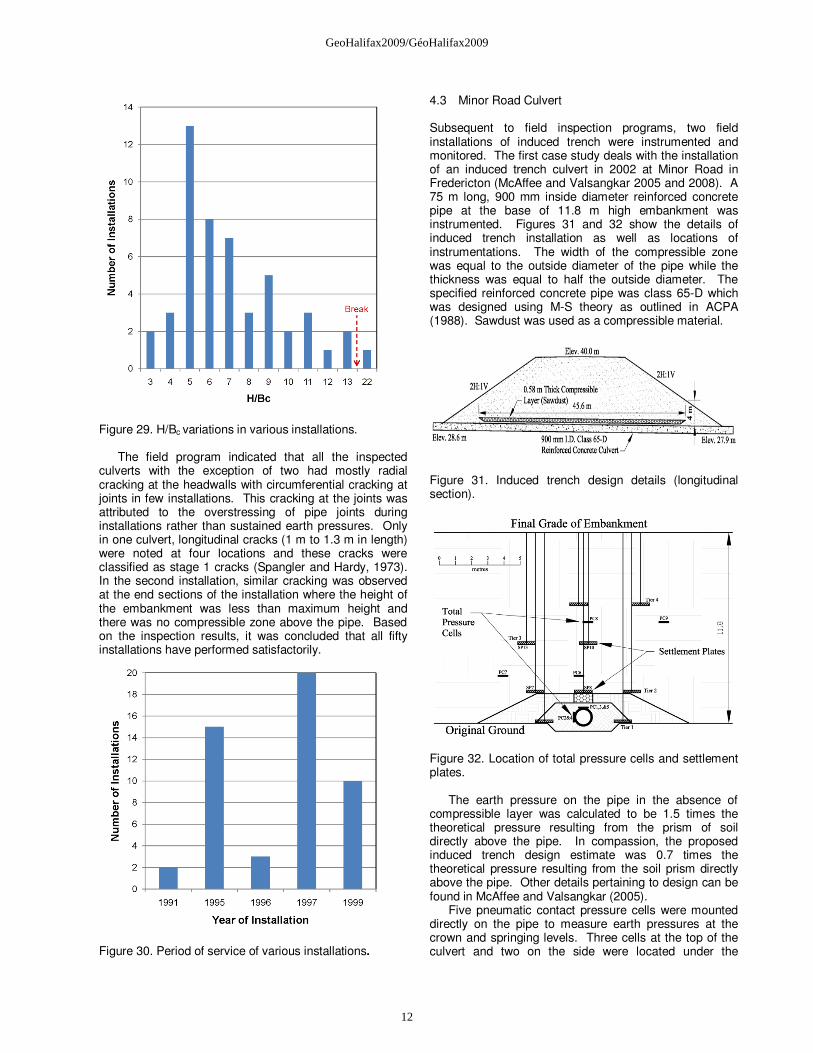
Figure 29. H/Bc variations in various installations.
The field program indicated that all the inspected culverts with the exception of two had mostly radial cracking at the headwalls with circumferential cracking at joints in few installations. This cracking at the joints was attributed to the overstressing of pipe joints during installations rather than sustained earth pressures. Only in one culvert, longitudinal cracks (1 m to 1.3 m in length) were noted at four locations and these cracks were classified as stage 1 cracks (Spangler and Hardy, 1973). In the second installation, similar cracking was observed at the end sections of the installation where the height of the embankment was less than maximum height and there was no compressible zone above the pipe. Based on the inspection results, it was concluded that all fifty installations have performed satisfactorily.
Figure 30. Period of service of various installations.
4.3 Minor Road Culvert
Subsequent to field inspection programs, two field installations of induced trench were instrumented and monitored. The first case study deals with the installation of an induced trench culvert in 2002 at Minor Road in Fredericton (McAffee and Valsangkar 2005 and 2008). A 75 m long, 900 mm inside diameter reinforced concrete pipe at the base of 11.8 m high embankment was instrumented. Figures 31 and 32 show the details of induced trench installation as well as locations of instrumentations. The width of the compressible zone was equal to the outside diameter of the pipe while the thickness was equal to half the outside diameter. The specified reinforced concrete pipe was class 65-D which was designed using M-S theory as outlined in ACPA (1988). Sawdust was used as a compressible material.
Figure 31. Induced trench design details (longitudinal section).
Figure 32. Location of total pressure cells and settlement plates.
The earth pressure on the pipe in the absence of
compressible layer was calculated to be 1.5 times the theoretical pressure resulting from the prism of soil directly above the pipe. In compassion, the proposed induced trench design estimate was 0.7 times the theoretical pressure resulting from the soil prism directly above the pipe. Other details pertaining to design can be found in McAffee and Valsangkar (2005).
Five pneumatic contact pressure cells were mounted directly on the pipe to measure earth pressures at the crown and springing levels. Three cells at the top of the culvert and two on the side were located under the
12
GeoHalifax2009/GéoHalifax2009
centerline and crest of the embankment at its maximum height. Four additional earth pressure cells were installed within the embankment at heights of 2.0 and 5.3 m above the crown to measure earth pressures within the column of soil directly above the compressible layer and area outside of this column. Sixteen settlement plates were installed at various locations as shown in Figure 32.
The data from contact pressures and earth pressure cells is presented in Figure 33. The measured contact and earth pressures are normalized with respect to the overburden pressure and are plotted against the elevation of the embankment. The overburden pressures were calculated using measured densities during embankment construction.
The earth pressures at the crown (contact pressure cells PC1, PC3, and PC5) recorded pressures that ranged between 0.24 and 0.36 times the overburden pressure. The lateral pressures measured at the springing level ranged from 0.39 to 0.49 times the overburden pressure at that depth. The earth pressure cells located within the embankment measured pressures close to or a small reduction below overburden pressure.
Figure 33. Data from total pressure cells. Ko coefficient of earth pressure at rest.
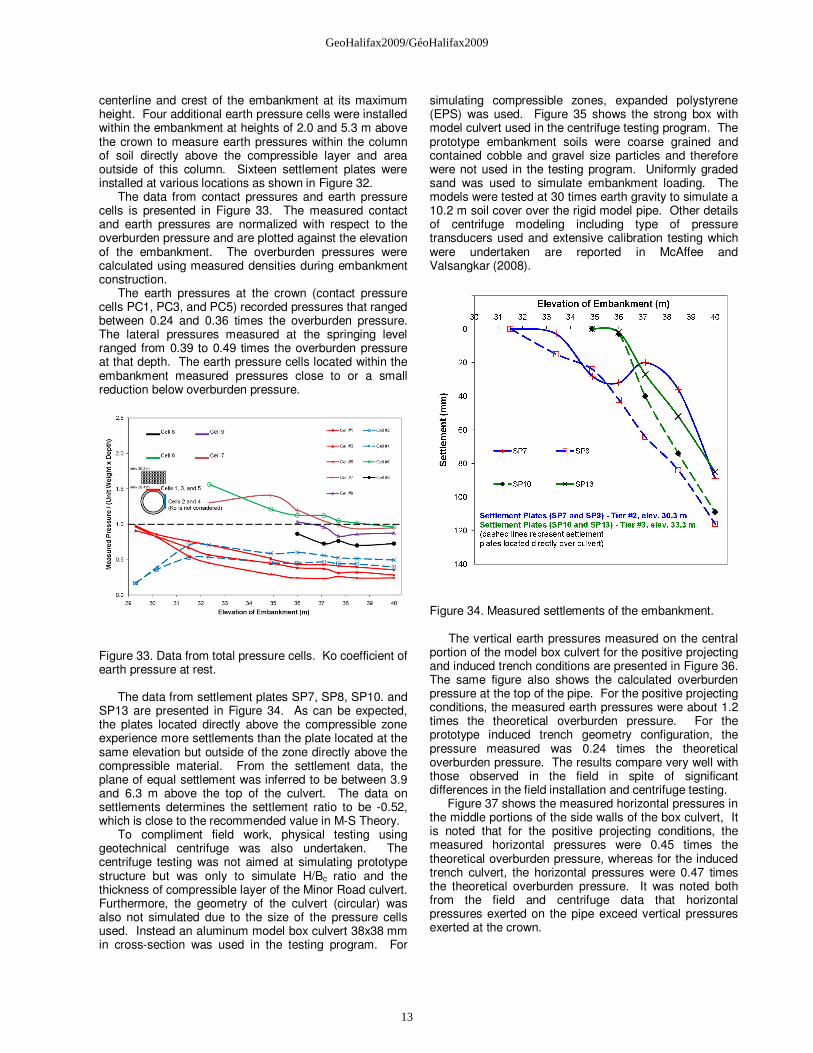
The data from settlement plates SP7, SP8, SP10. and
SP13 are presented in Figure 34. As can be expected, the plates located directly above the compressible zone experience more settlements than the plate located at the same elevation but outside of the zone directly above the compressible material. From the settlement data, the plane of equal settlement was inferred to be between 3.9 and 6.3 m above the top of the culvert. The data on settlements determines the settlement ratio to be -0.52, which is close to the recommended value in M-S Theory.
To compliment field work, physical testing using geotechnical centrifuge was also undertaken. The centrifuge testing was not aimed at simulating prototype structure but was only to simulate H/Bc ratio and the thickness of compressible layer of the Minor Road culvert. Furthermore, the geometry of the culvert (circular) was also not simulated due to the size of the pressure cells used. Instead an aluminum model box culvert 38x38 mm in cross-section was used in the testing program. For
simulating compressible zones, expanded polystyrene (EPS) was used. Figure 35 shows the strong box with model culvert used in the centrifuge testing program. The prototype embankment soils were coarse grained and contained cobble and gravel size particles and therefore were not used in the testing program. Uniformly graded sand was used to simulate embankment loading. The models were tested at 30 times earth gravity to simulate a 10.2 m soil cover over the rigid model pipe. Other details of centrifuge modeling including type of pressure transducers used and extensive calibration testing which were undertaken are reported in McAffee and Valsangkar (2008).
Figure 34. Measured settlements of the embankment.
The vertical earth pressures measured on the central
portion of the model box culvert for the positive projecting and induced trench conditions are presented in Figure 36. The same figure also shows the calculated overburden pressure at the top of the pipe. For the positive projecting conditions, the measured earth pressures were about 1.2 times the theoretical overburden pressure. For the prototype induced trench geometry configuration, the pressure measured was 0.24 times the theoretical overburden pressure. The results compare very well with those observed in the field in spite of significant differences in the field installation and centrifuge testing.
Figure 37 shows the measured horizontal pressures in the middle portions of the side walls of the box culvert, It is noted that for the positive projecting conditions, the measured horizontal pressures were 0.45 times the theoretical overburden pressure, whereas for the induced trench culvert, the horizontal pressures were 0.47 times the theoretical overburden pressure. It was noted both from the field and centrifuge data that horizontal pressures exerted on the pipe exceed vertical pressures exerted at the crown.
13
GeoHalifax2009/GéoHalifax2009
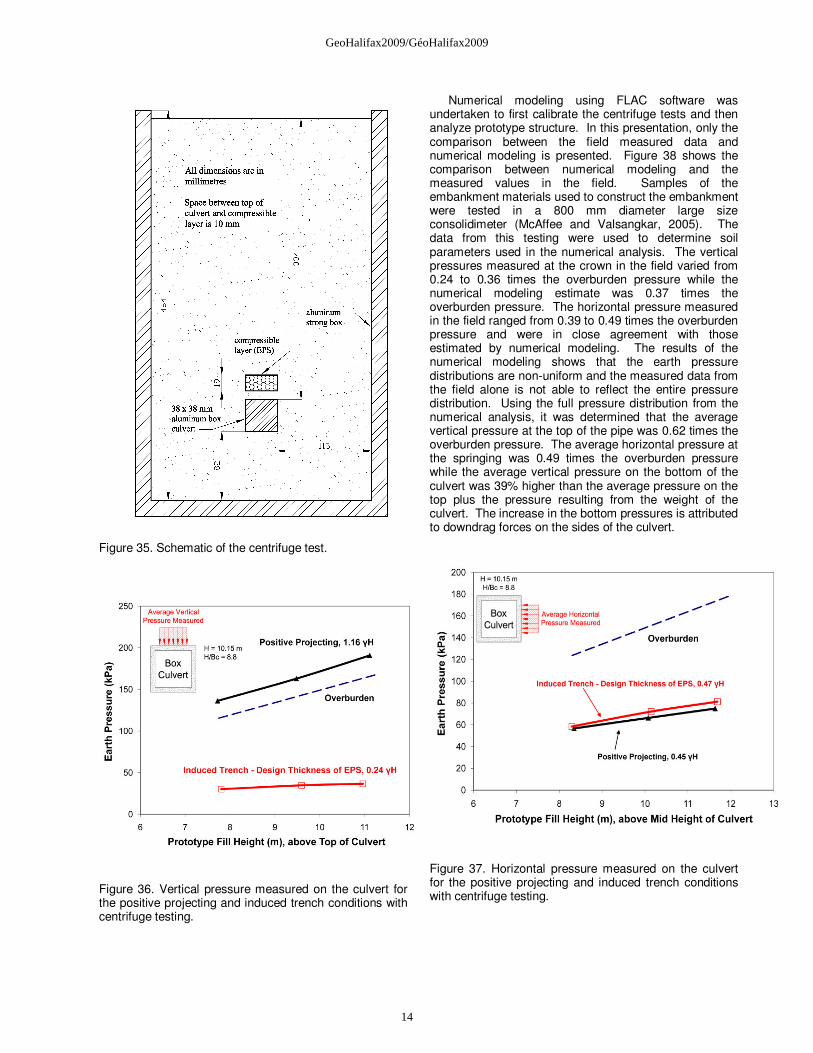
Figure 35. Schematic of the centrifuge test.
Figure 36. Vertical pressure measured on the culvert for the positive projecting and induced trench conditions with centrifuge testing.
Numerical modeling using FLAC software was undertaken to first calibrate the centrifuge tests and then analyze prototype structure. In this presentation, only the comparison between the field measured data and numerical modeling is presented. Figure 38 shows the comparison between numerical modeling and the measured values in the field. Samples of the embankment materials used to construct the embankment were tested in a 800 mm diameter large size consolidimeter (McAffee and Valsangkar, 2005). The data from this testing were used to determine soil parameters used in the numerical analysis. The vertical pressures measured at the crown in the field varied from 0.24 to 0.36 times the overburden pressure while the numerical modeling estimate was 0.37 times the overburden pressure. The horizontal pressure measured in the field ranged from 0.39 to 0.49 times the overburden pressure and were in close agreement with those estimated by numerical modeling. The results of the numerical modeling shows that the earth pressure distributions are non-uniform and the measured data from the field alone is not able to reflect the entire pressure distribution. Using the full pressure distribution from the numerical analysis, it was determined that the average vertical pressure at the top of the pipe was 0.62 times the overburden pressure. The average horizontal pressure at the springing was 0.49 times the overburden pressure while the average vertical pressure on the bottom of the culvert was 39% higher than the average pressure on the top plus the pressure resulting from the weight of the culvert. The increase in the bottom pressures is attributed to downdrag forces on the sides of the culvert.
Figure 37. Horizontal pressure measured on the culvert for the positive projecting and induced trench conditions with centrifuge testing.
14
GeoHalifax2009/GéoHalifax2009
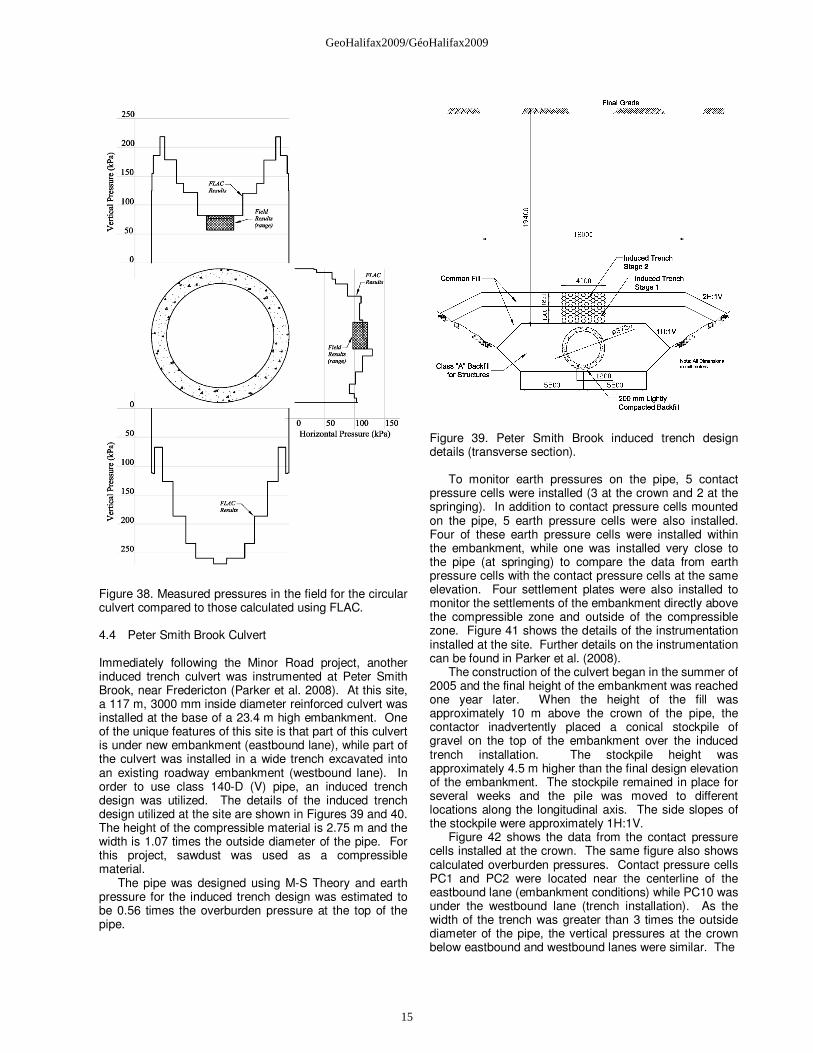
Figure 38. Measured pressures in the field for the circular culvert compared to those calculated using FLAC. 4.4 Peter Smith Brook Culvert Immediately following the Minor Road project, another induced trench culvert was instrumented at Peter Smith Brook, near Fredericton (Parker et al. 2008). At this site, a 117 m, 3000 mm inside diameter reinforced culvert was installed at the base of a 23.4 m high embankment. One of the unique features of this site is that part of this culvert is under new embankment (eastbound lane), while part of the culvert was installed in a wide trench excavated into an existing roadway embankment (westbound lane). In order to use class 140-D (V) pipe, an induced trench design was utilized. The details of the induced trench design utilized at the site are shown in Figures 39 and 40. The height of the compressible material is 2.75 m and the width is 1.07 times the outside diameter of the pipe. For this project, sawdust was used as a compressible material.
The pipe was designed using M-S Theory and earth pressure for the induced trench design was estimated to be 0.56 times the overburden pressure at the top of the pipe.
Figure 39. Peter Smith Brook induced trench design details (transverse section).
To monitor earth pressures on the pipe, 5 contact pressure cells were installed (3 at the crown and 2 at the springing). In addition to contact pressure cells mounted on the pipe, 5 earth pressure cells were also installed. Four of these earth pressure cells were installed within the embankment, while one was installed very close to the pipe (at springing) to compare the data from earth pressure cells with the contact pressure cells at the same elevation. Four settlement plates were also installed to monitor the settlements of the embankment directly above the compressible zone and outside of the compressible zone. Figure 41 shows the details of the instrumentation installed at the site. Further details on the instrumentation can be found in Parker et al. (2008).
The construction of the culvert began in the summer of 2005 and the final height of the embankment was reached one year later. When the height of the fill was approximately 10 m above the crown of the pipe, the contactor inadvertently placed a conical stockpile of gravel on the top of the embankment over the induced trench installation. The stockpile height was approximately 4.5 m higher than the final design elevation of the embankment. The stockpile remained in place for several weeks and the pile was moved to different locations along the longitudinal axis. The side slopes of the stockpile were approximately 1H:1V.
Figure 42 shows the data from the contact pressure cells installed at the crown. The same figure also shows calculated overburden pressures. Contact pressure cells PC1 and PC2 were located near the centerline of the eastbound lane (embankment conditions) while PC10 was under the westbound lane (trench installation). As the width of the trench was greater than 3 times the outside diameter of the pipe, the vertical pressures at the crown below eastbound and westbound lanes were similar. The
15
GeoHalifax2009/GéoHalifax2009
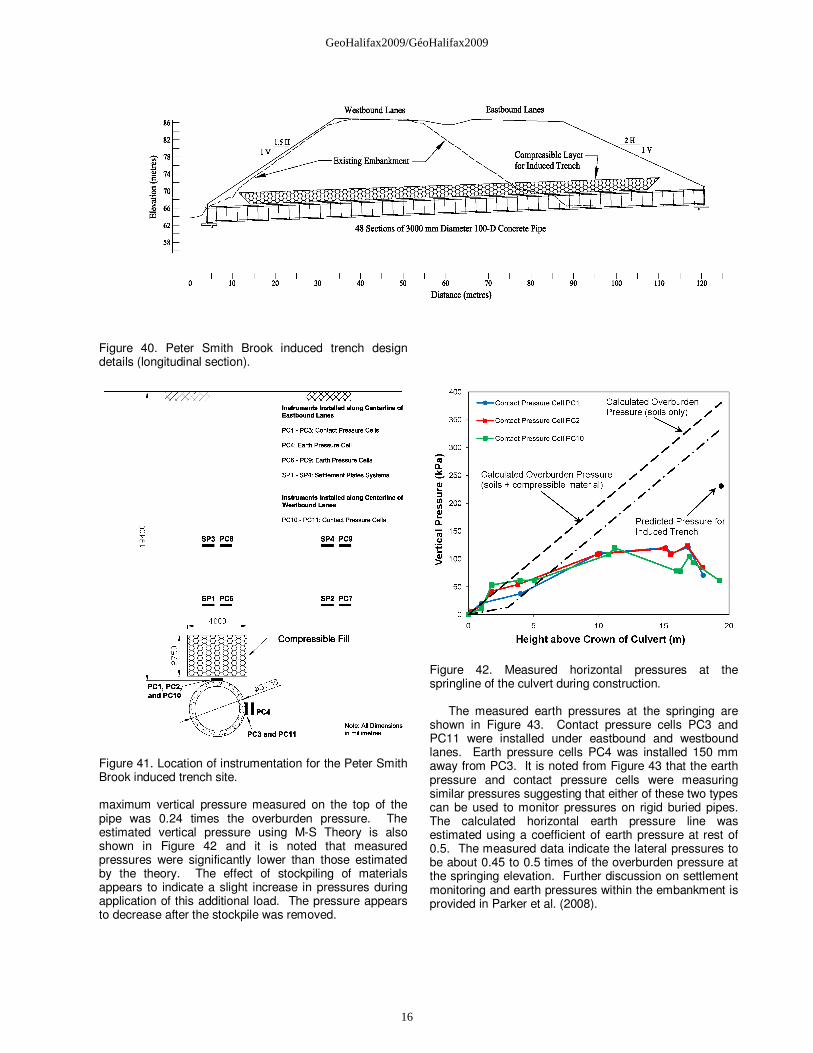
Figure 40. Peter Smith Brook induced trench design details (longitudinal section).
Figure 41. Location of instrumentation for the Peter Smith Brook induced trench site.
maximum vertical pressure measured on the top of the pipe was 0.24 times the overburden pressure. The estimated vertical pressure using M-S Theory is also shown in Figure 42 and it is noted that measured pressures were significantly lower than those estimated by the theory. The effect of stockpiling of materials appears to indicate a slight increase in pressures during application of this additional load. The pressure appears to decrease after the stockpile was removed.
Figure 42. Measured horizontal pressures at the springline of the culvert during construction.
The measured earth pressures at the springing are
shown in Figure 43. Contact pressure cells PC3 and PC11 were installed under eastbound and westbound lanes. Earth pressure cells PC4 was installed 150 mm away from PC3. It is noted from Figure 43 that the earth pressure and contact pressure cells were measuring similar pressures suggesting that either of these two types can be used to monitor pressures on rigid buried pipes. The calculated horizontal earth pressure line was estimated using a coefficient of earth pressure at rest of 0.5. The measured data indicate the lateral pressures to be about 0.45 to 0.5 times of the overburden pressure at the springing elevation. Further discussion on settlement monitoring and earth pressures within the embankment is provided in Parker et al. (2008).
16
GeoHalifax2009/GéoHalifax2009
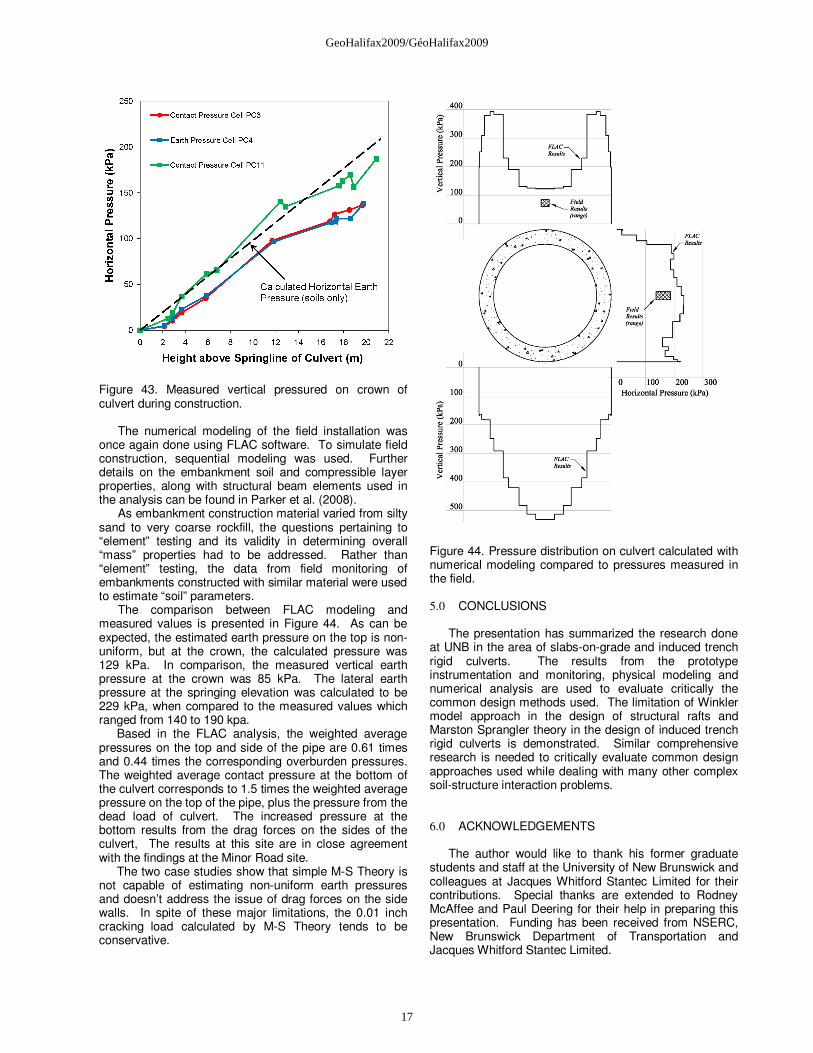
Figure 43. Measured vertical pressured on crown of culvert during construction.
The numerical modeling of the field installation was
once again done using FLAC software. To simulate field construction, sequential modeling was used. Further details on the embankment soil and compressible layer properties, along with structural beam elements used in the analysis can be found in Parker et al. (2008).
As embankment construction material varied from silty sand to very coarse rockfill, the questions pertaining to “element” testing and its validity in determining overall “mass” properties had to be addressed. Rather than “element” testing, the data from field monitoring of embankments constructed with similar material were used to estimate “soil” parameters.
The comparison between FLAC modeling and measured values is presented in Figure 44. As can be expected, the estimated earth pressure on the top is non-uniform, but at the crown, the calculated pressure was 129 kPa. In comparison, the measured vertical earth pressure at the crown was 85 kPa. The lateral earth pressure at the springing elevation was calculated to be 229 kPa, when compared to the measured values which ranged from 140 to 190 kpa.
Based in the FLAC analysis, the weighted average pressures on the top and side of the pipe are 0.61 times and 0.44 times the corresponding overburden pressures. The weighted average contact pressure at the bottom of the culvert corresponds to 1.5 times the weighted average pressure on the top of the pipe, plus the pressure from the dead load of culvert. The increased pressure at the bottom results from the drag forces on the sides of the culvert, The results at this site are in close agreement with the findings at the Minor Road site.
The two case studies show that simple M-S Theory is not capable of estimating non-uniform earth pressures and doesn’t address the issue of drag forces on the side walls. In spite of these major limitations, the 0.01 inch cracking load calculated by M-S Theory tends to be conservative.
Figure 44. Pressure distribution on culvert calculated with numerical modeling compared to pressures measured in the field.
5.0 CONCLUSIONS
The presentation has summarized the research done at UNB in the area of slabs-on-grade and induced trench rigid culverts. The results from the prototype instrumentation and monitoring, physical modeling and numerical analysis are used to evaluate critically the common design methods used. The limitation of Winkler model approach in the design of structural rafts and Marston Sprangler theory in the design of induced trench rigid culverts is demonstrated. Similar comprehensive research is needed to critically evaluate common design approaches used while dealing with many other complex soil-structure interaction problems.
6.0 ACKNOWLEDGEMENTS
The author would like to thank his former graduate students and staff at the University of New Brunswick and colleagues at Jacques Whitford Stantec Limited for their contributions. Special thanks are extended to Rodney McAffee and Paul Deering for their help in preparing this presentation. Funding has been received from NSERC, New Brunswick Department of Transportation and Jacques Whitford Stantec Limited.
17
GeoHalifax2009/GéoHalifax2009

7.0 REFERENCES AASHTO. 2007. LRFD Bridge Design Specifications. 4th
ed. American Association of State Highway and Transportation Officials, Washington, D.C.
ACPA. 1998. Concrete pipe handbook. American
Concrete Pipe Association, Vienna, Va. Alkins, J.C. 1983. The Performance of a Raft Foundation
Supporting a Multi-storey Structure. M.Sc.E. Thesis, Department of Civil Engineering, University of New Brunswick, Fredericton, N.B.
Bischoff, P.H., Valsangkar, A.J. and Irving, J., 2003. Use
of Fibers and Welded-wired Reinforcement in Construction of Slabs on Ground. Practice Periodical Structural and Construction, ASCE, 8 (1): 41-46.
Bowles, J.E., 1996. Foundation Analysis and Design. 5th
Edition, McGraw-Hill, New York, N.Y. Briggs, M. 2006. Soil Structure Interaction of Steel Fiber
Reinforced Concrete Beams on Grade. M.Sc.E. Thesis, Department of Civil Engineering, University of New Brunswick, Fredericton, N.B.
CSA. 2006. CAN/CSA-S6-06 Canadian Highway Bridge
Design Code. Canadian Standards Association, Mississauga, O.N.
Handy, R.L. 2004. Anatomy of an error. Journal of
Geotechnical and Geoenvironmental Engineering (ASCE), 130(7): 768-771.
Hansen, P., Miller, L., Valsangkar, A.J., Bourque, S., and
MacLeod, T. 2007. Performance of Induced Trench Culverts in New Brunswick. Annual Conference of Transportation Association of Canada, Saskatoon, Saskatchewan.
Irving, J. 1999. Soil Structure Interaction of Fiber
Reinforced Concrete Floor Slabs on Grade. M.Sc.E. Thesis, Department of Civil Engineering, University of New Brunswick, Fredericton, N.B.
Landva, A.O., Valsangkar, A.J., Alkins, J.C. and
Charalambons, P.D. 1988. Canadian Geotechnical Journal, 25(1), 138-149.
Marston, A. 1930. The Theory of External Loads on
Closed Conduits in the Light of the Latest Experiments. Bulletin 96, Iowa Engineering Experiment Station, Iowa State College, Ames, Iowa.
Marston, A. and Anderson, A.O. 1913, The Theory of
Loads on Pipes and Ditches and Tests of Cement and Clay Drain Tile and Sewer Pipe. Bulletin 31. Iowa Engineering Experiment Station, Iowa State College, Ames, Iowa.
Marachi, M.D., Chan, C.K., Seed, H.B., and Duncan, J.M. 1969. Strength and Deformation Characteristics of Rockfill Materials. Report No. TE-69-5 to State of California Department of Water Resources, University of California, Department of Civil Engineering, Institute of Transportation and Traffic Engineering.
McAffee, R.P. and Valsangkar, A.J. 2005 Performance of
an Induced Trench Installation. Transportation and Research Record, 1936: 230-237.
McAffee, R.P. and Valsangkar, A.J., 2008. Field
Performance, Centrifuge Testing, and Numerical Modelling of an Induced Trench Installation. Canadian Geotechnical Journal, 45: 85-101.
Parker, B.A., McAffee, R.P., and Valsangkar, A.J. 2008.
Field Performance and Analysis of a 3.0 Diameter Induced Trench Culvert and a 19.4 High Soil Cover. Transportation Research Record, 2045: 68-78.
Scario, J.H. 2003. Reappraisal of Marton’s Formula,
Journal of Transportation Engineering (ASCE), 129(6): 703-712.
Sladen, J.A. and Oswell, J.M. 1988. The Induced Trench
Method – a Critical Review and Case History. Canadian Geotechnical Journal, 25: 541-549.
Spangler, M.G. and Handy, R.L. 1973. Soil Engineering,
3rd Edition. Intext Press Inc., New York, N.Y. Wetergaard, H.M. 1926. Stresses in Concrete Pavements
Completed by Theoretical Analysis. Public Roads, 7(2): 25-35.
18
GeoHalifax2009/GéoHalifax2009