soil resistivity as related to underground corrosion and cathodic
TRANSCRIPT
JOURNAL OF RESEARCH of the National Bureau of Standards- Co Engineering and Instrumentation Vol. 69C, No. I, January- March 1965
Soil Resistivity as Related to Underground Corrosion and Cathodic Protection
w. J. Schwerdtfeger (August 4, 1964)
Corrosion data discussed ill this paper arc based upon m eas urements made on about 4500 specimens of commonly used plain wrou ght ferrous mat ri al which had been buried in back-filled Lrenches at 86 National Bureau of Standards sites for periods up to 17 years. The soils ran ge d in resist ivi ty from 50 to 54,000 !1-cm a nd in p H f rom 2.6 to 10.2.
Maximum pit depths at 5 years of ex posure a re taken from pi t depth-t ime curves and the curves arc also extrapolated t o probable pit depths at 30 years for each of the 86 sites. Furthermore, data Oil t he s pecime ns are adju st ed to max imum pi t depths that might be expected on a larger area, equivalent to t hat of the exterior surface of a 20 ft length of 8 in . ull coated wrought ferrous pipe. Maximum penetration ratcs a nd pit depths arc presented with r espect to soil resist ivit.v a nd pH.
\Veight losses which rcs ulted from about 2 years of underground exposure a rc converted to corrosion current densit ies a lld after this period of expos ure current densit ies arc calculated from the slopes of weight loss-time curves for each site. On t he basis of r atios of protective current t o corrosion current obtai ned from polari zation curves on steel spec imens underground and in soils in the labo ratory, t he corrosio n current densities can be adjusted to approximate current densit ies necessary for cathod ic protection .
1. Introduction
Between the years 1922 and 1952 the Nationftl Bureau of Standftrds exposed tbousttnds of metallic specimens at numerous underground sites throughout the United States. Corrosion rates of O\Ter 300 vftrieties of protected and unprotected metals and alloys were evaluated about every 2 years for exposw-e periods as long as 17 years. The accumulated corrosion data were compiled by Romanoff [IV The engineering significance of early NBS data pertaining to some co mmonly used wTought ferrous materials from the original 47 test sites WftS discussed in considerable detail by Logan [2]. The present paper is similar but includes data from about 40 additional sites and, based on the total available data, offers suggestions 011 the current densit ies probably required for cathodic protection.
In this paper, in addition to extrapolating the average maximum pit depths to 30 years as Logan [2] did, the weight losses of the specimens are converted to corrosion current densities. From these data the approximate current densities required for the cathodic protection of bare underground surfaces can be estimated. Although, based on NBS data, there is no precise relationship between the corrosi \Tity and resistivity of soils, a general relationship is now revealed by the total ftccumulated data. This is also indicated by the data of Scott [3]. Recently, Schaschl and .Marsh [4] discussed t he effect of resisti \rity on the corrosion rates of steel in aqueous environments and showed that for resistivities above 400 Q-cm, the corrosion rate bears an inverse relation to the resistivity of the electrolyte. Thus, a study is undertaken of the influence of soil resistivity, a meaSLll'ement readily made in the field. The combined relation of pH and soil resistiv-
I Figures in brackets indicate the literature refe rences at the end of this paper.
71
ity to corrosion rate was also investigated. The metftls to which our data apply are confined to open-hearth iron , hand-puddled and mechanically puddled wrought irons, open-hearth and Bessemer steels, all witho ut added alloying constituents.
2. Corrosiveness of Soils
The corrosiveness of a soil might be defined as its destructi \Te or deteriorating effect on a metallic surface, ftS mea ured by weight loss and pit depth.
A soil Cftll be potentially cOl'l'osi \'e and yet have a negligible effect on phin ferrous mftterials. This was recently shown by Romanoff [5] as a result of his examination of steel pilings (pulled) exposed from 7 to 40 years in a variety of soils some of which hadresisti \'ities as low as 300 Q-cm. No appreciable amount of corrosion was obselTed on pile surfaces adjacent to soils into which the piles had been dri\Ten below the water table, referred to as "undisturbed" soil. This type of exposLll'e is in contrast to the soil exposure of metftls in back-filled trenches, referred to as "disturbed" soil. On driven piling, t he corrosion rate decreases rapidly as the initially. available oxygen is depleted by the corrosion process and the accessibili ty of more is limited. In distm·bed soils oxygen is more readily replenished and the soil is only very slowly restored to its natural state. This gives rise to differential aeration and then the corrosiveness of the soil depends largely on its physicftl and chemical properties. Properties of the soils to be considered have already been described [1].
The most severe corrosion usually takes place at low elevations in poorly drained disturbed soils, such as clays and tidal marshes, where, although also poorly aerated, the differential-aeration effects are large because of soil shrinkage. Then too, salts accumulate in these areas and increase the conduc-
tivity of th.e soil . Th~ pH of such soils is usually neutral or I? the. alkalme range. In contrast, the least corrOSIve sOlIs are well aerated well drained an~ seem to be in areas of high annu~l precipitation ~hlCh causes the salts to be washed away and mcreases the soil resistivity. The pH is usually between 4 and 7.
3. Effect of Area and Duration of Exposure
The data used in this paper are mostly for accumulated exposure periods of 12 and 14 years. In some soils the accumulated periods are 7 and 17 years. The exposed area of each specimen was about 0.4 ft 2.
It is of importance to know the effect of larcrer areas and longer periods of exposure. These v~riabIes have been considered by previous investigators [6,7]. Years ago, Scott [6] observed that pit depth is a function of the area of metal exposed. Based on National Bureau of Standards data and on data from pipelines, a linear relation was obtained when the logarithm of the average of the deepest pits (se,:"eral specimen~) on a given area was plotted agamst the logarIthm of the area for increasing areas. Thus, for a modest extrapolation of the area Scott suggested the empirical equation, '
log P = a log A+log b, or P = bAu, (1)
where P is the average maximum pit depth on the ~roposed area A, ~xponent a is the slope of the best Imear pl.ot , and b IS the average maximum pit depth for a umt area. The useful form of this equation is,
P Z/Pl = (A 2/A I )a or PZ= P I (A2/A 1)U, (2)
where PI is the averag~ maximum pit depth on a known area AI, and P2 IS the extrapolated or calculated average maximum pit depth on some assumed area Az for the length of exposure time. Scott suggested as a standard area that of the exterior of a 20 ft length of 8 in. diam pipe which is about 45 .16 ft 2 .. The v.alues for. the exponent, a, applicable to Spe?lmenS m 47 . sOlIs have been given by Logan , Ewmg, and DenISon [7]. Based on their data the avera~e value. of a= 0.1 5 has been suggested for use ~th all ~oils, as the exponent is apparently not assocIated WIth any known soil property [81.
The effect of length of exposure time on rates of corrosion underground is better known than is the effect. of area exposed. For example, it is well known that III some soils, after a few years, corrosion seems to ?ease. The effect of duration of exposure on corrOSIOn rates depends on chemical and physical propert~es of the s?ils. Here again , it was observed that a lmear relatIOn ~ppears to apply reasonably well b~tween the logarIthm of the average of maximum PIt. d~pths and the logarithm of the exposure period . ThIS IS expressed by the equation,
log P = n log T + log k, or p = kTn, (3)
~here P is. the average maximum pi t depth at some tIme T , n IS the slope of the line of best fit , and k is
72
the .average maximum pit depth for a unit of time. Agam, the useful form of the relation becomes ,
where PI i~ the average maximum pit depth for the shor~er pen?d of exposure TI , and P 2 is the average ma~nmum pIt dep.th at some longer time Tz. Logan , ~wlllg, and Demson r7] divided 47 NBS soil sites mto 4 groups based on aeration and on drainacre r~nging from well-aerated sands and sandy loams \~ tIdal m~rshes . The exponent, n, was derived for each soil group and r anged from n = 0.19 for soils having goo~ aeration to n=0.68 for soils with very poor aeratIOn, such as clays and tidal marshes. More recently, Scott [9] has proposed that the average !'ate of corrosion underground is inversely proportIOnal to the square root of the duration of exposure time, that is, in eq (3), n = 0. 5.
4. Discussion of the Data
4 .1. Maximum Pit Depths
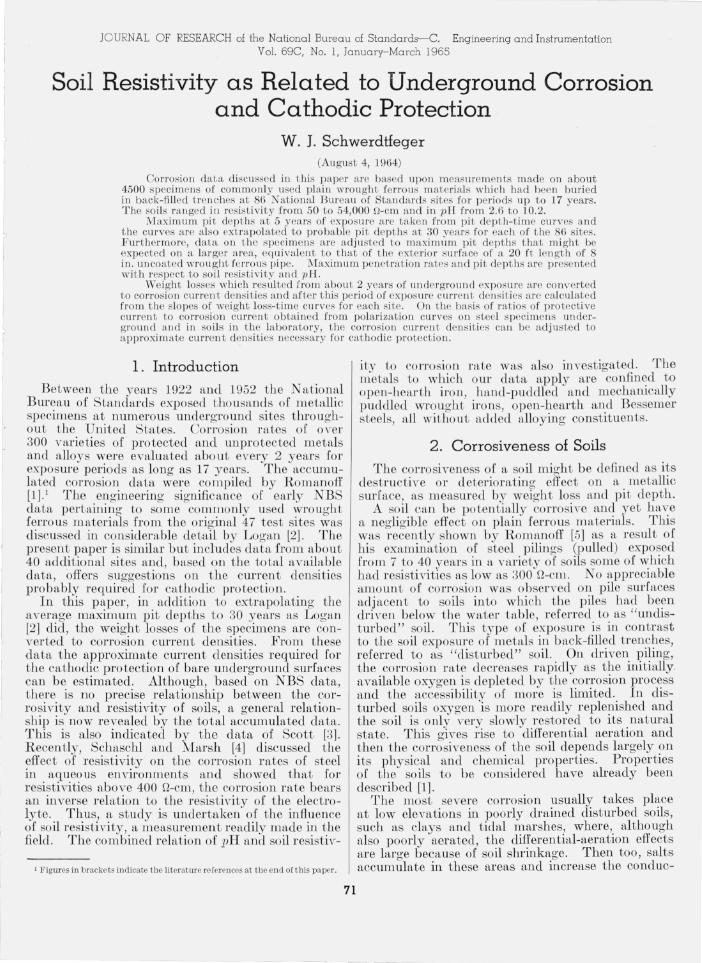
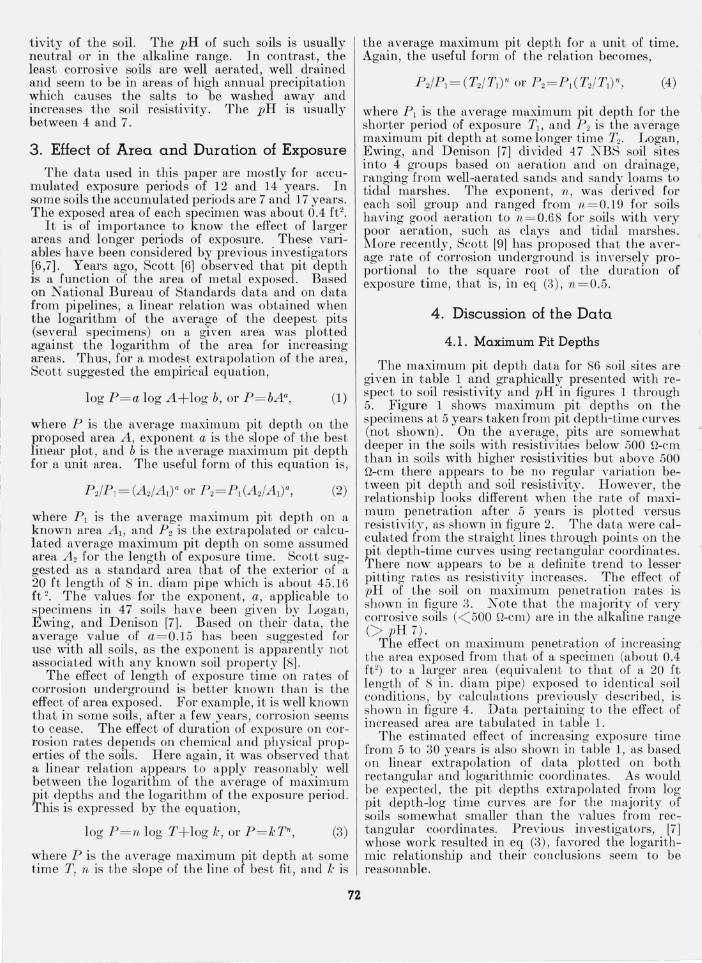
. The. maximum pit depth data for 86 soil sites are gIven III table 1 and graphically presented with respecFt .to soil resistivity an.d pH in figures 1 through 5. .' lgure 1 shows maXImum pit depths on the speCImens at 5 years taken from pit depth-time curves (not sh.own). On the average, pits are somewhat deeper III the soils with resistivities below 500 n-cm than in soils with higher resistivities but above 500 n-cm th.erc appears to be no regular variation bet wee!l pIt. depth an~ soil resistivity. However , the relatIOnshIp looks dIfferent when the rate of ma,,1.mu.m. ~enetration a~ter 5 years is plotted versus reSIstIvIty, as shown III figure 2. The data were calc,:!l ated fro~ the straight lines through points on the pIt depth-tIme curves using rectangular coordinates. There now appears to be a definite trend to lesser pitting rates as resistivity increases. The effect of pH of. the soil on maximum penetration rates is ShOWl~ III fig;ure 3. Note that ~he majority of very COITOSlve SOlIs « 500 n-cm) are III the alkaline rancre (> pH7). 0
The effect on maximum penetration of increasino'
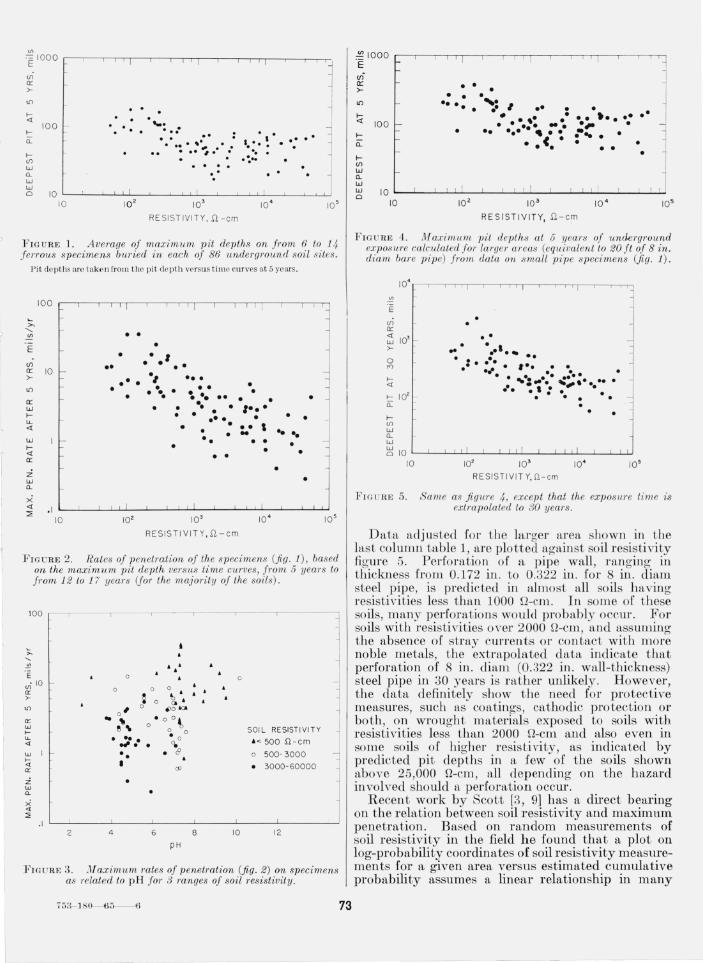
~he area exposed from tha.t of a specimen (about 0.4 ft2) to a l arger area (eqUIvalent to t hat of a 20 ft length of 8 in. diam pipe) exposed to identical soil conditions, by cfl1culations previously described is ~hown in figure 4. Data pertaining to t he effect of Illcreased area are tabulated in table 1. . The estimated eJ!ect of increa~ing exposure time from 5 to 30 years IS also shown 111 table 1 as based on linear extrapolation of data plotted ' on both rectangular and logarithmic coordinates. As would b~ expected, t~e pit depths extrapolated from log pIt depth-log tune curves are for t he majority of soils somewhat smaller than the values from rectangular coordinates: Previous investigators, [7] whose work resulted 11l eq (3), favored t he loo'arithmic relationship and their conclusions seem 0 to be reasonable.
V> E 1000
j vi a:: >-
I It) . . 1 f-<t
100 .... ~
f- .... .. . . .. ,. , .... <l. . ... ,. .
•• "i .- : . . . .. . f- . ~ .. <J1 . W · . . <l. .. W W
I 0 10 10 10 ' 10 ' 10 ' 10'
RESIS T IVI TY, .a -em
FIGUR E 1. Avera(le of max'';mum pit depths on fTom 6 to 14 f errous specimens bltried in each of 86 underground soi l sites.
Pit deptlls are taken from the pit depth versus time curves at 5 years.
10 0 I I I
~ ...... .:!2 • • E • - • -' <J) •• • •• a:: 10 r- ., ->- .. - •• •
• • • -It) • • • • ~ e • • • • •• • • • a:: -. w • • , ... f- • • • lL . -. • • <t - • .- S • .. .. • • w I r- •• • - -f- • • <t • . a::
i. • w • <l.
X-I I <t . 1
, :::2'
10' 10' 10 ' 10 ' 10
RE SIS T IVI T Y, .a - em
FIGURE 2. Rates of penetration oJ the specimens (fig. 1), based on the maximum p'';t depth versus time curves, f rom 5 yew's to fTom 12 to 17 yew's (Jor the majority of the soils),
100
'>-"-~
' f' vi 10 a:: >-
'" a:: w f-u. <t w I f-<! a:: :i. w a.
X <t ::E
. 1 2
o
o
~ 0
. .:, .. -.. •
4
• • . 0 0
'b • 0
co • .,0 ""
6
pH
0
•
8 10
T
SOIL RESISTIVIT Y .< 500 .Il.-em
o 500· 3000
• 3000- 600 00
12
FIG URE 3. JI ax imwn rates of pen etration (fig. 2) on specimens as related to pH for 3 ranges of soiil'esistivity,
7 53-J SO~65--~G
I I
73
.:!21000 'E en a:: • • >- • • • • to -... ,. , • •• •• • • f- . . ,. . • • • t •• •• • • <t 100 . ... - ... .,. •
~ f- • •• -.- , .. .... •
• C. • • <l. - • •
- . • f-<J1 W <l. W w 10 I I I 0
10 10' 10' 10 ' 105
RESISTIVITY, .a-em
FIG URE 4. !II aximu1n pit depths at 5 yeaTS of unMTgl'ound ex posure calculated Jor lal'gcr areas (equ'';valent to 20 f t of 8 in. diwn bare pi pe) /1"O'In data on .small pipe specimen s (fig . 1) .
10'
C!!
E vi a:: <t
10' w >-0 ".,
f-<t
f- lO' -a:: f-<J)
W a. w w
10 0
10
.. .. . ...... .. .-. -. .- . -" . ,e. .. _ ... . ... -: ..... ..::,. ,. -.... ... ..':-.
1 I
10' 10 ' 10 ' 10 '
R ESISTI VIT Y, D.-em
F I G UHE 5. S ame as figure 4, except that the exposure time is extm polated to 30 years .
Data adjusted for the larger area shown in t he last column table 1, are plotted against soil resistivity figure 5. Perforation of a pipe wall, r anging in thickness from 0.172 in. to 0.322 in. for 8 in. diam steel pipe, is predicted in almost all soils h aving resisti vities less than 1000 D-cm. In some of t hese soils, many perforations would probably occur . For soils with resistivit ies over 2000 rl-cm, and assuming the absence of stray currents or co ntact with more noble metals, the extrapolated data indicate t hat perforation of 8 in. diam (0. 322 in. wall-t hickness) steel pipe in 30 years is rather unlikely. However , the data definitely show t he need for protective meaSID'es, such as coatings, cathodic protection or both, on wrought materials exposed to soils with resistivities less t han 2000 rl-cm and also even in some soils of higher resistivity, as indicated by predicted pit depths in a few of the soils shown above 25,000 rl-cm, all depending on t he hazard involved should a perforation occm.
R ecen t work by Scott [3, 9] has a direct bearing on the relation between soil resistivity and maximum penetration. Based on random measmements of soil resistivity in the field h e found that a plot on log-probability coordinates of soil resistivity measurements for a given area versus estimated cumulative probability assumes a linear relationship in many
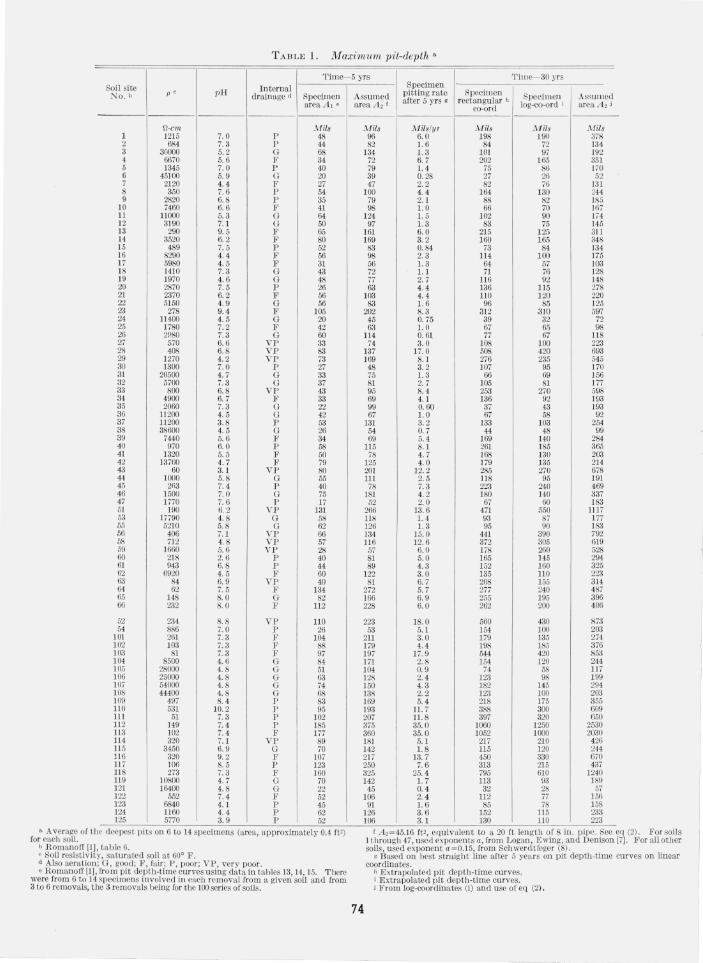
TABLE 1. Maximum pit-depth '
Time- 5 yrs 'rime-3~ yrs Soil site Internal No. b p ' p H drainage d Specimen
area Al e
fl-cm Mils 1 1215 7.0 P 48 2 684 7.3 P 44 3 30000 5.2 G 68 4 6670 5.6 F 34 5 1345 7.0 P 40 6 45100 5.9 G 20 7 2120 4.4 F 27 8 350 7.6 P 54 9 2820 6.8 P 35
10 7460 6.6 F 41 11 11000 5.3 G 64 12 3190 7.1 G 50 13 290 9.5 F 65 14 3520 6.2 F 80 15 489 7.5 P 52 16 8290 4.4 F 56 17 5980 4. 5 F 31 18 1410 7. 3 G 43 19 ) 970 4.6 G 48 20 2870 7.5 P 26 21 2370 6.2 F 56 22 5) 50 4.9 G 56 23 278 9.4 F 105 24 11400 4.5 G 20 25 1780 7.2 J<' 42 26 2980 7.3 G 60 27 570 6.6 VP 33 28 408 6. 8 VP 83 29 1270 4.2 VP 73 30 1300 7.0 P 27 :ll 20500 4. 7 G 33 32 5700 7.3 G 37 33 800 6.8 VP 43 34 4900 6.7 F 33 35 2060 7. 3 G 22 36 11200 4.5 G 42 37 11200 3.8 P 53 38 38600 4.5 G 26 39 7440 5.6 J<' 34 40 970 6.0 P 58 41 1320 5.5 F 50 42 13700 4.7 l' 79 43 60 3.1 VP 80 44 1000 5.8 G 55 45 2(i3 7.4 P 40 46 1500 7. 0 G 75 47 1770 7.6 P 17 51 190 6.2 VP 131 53 17790 4.8 G 58 55 5210 5.8 G 62 56 406 7. 1 VP 66 58 712 4.8 VP 57 59 1660 5. 6 VP 28 60 218 2.6 P 40 61 943 6.8 P 44 62 6920 4. 5 J<' 60 63 84 6.9 VP 40 64 62 7.5 J<' 134 65 148 8.0 G 82 66 232 8.0 l' H2
52 234 8.8 VP 110 54 886 7. 0 P 26
101 261 7.3 Ie 104 102 103 7.3 ]e 88 103 81 7.3 }' 97 104 8500 4.6 G 84 105 28000 4.8 G 51 106 25000 4. 8 G 63 107 54000 4.8 G 74 108 44400 4.8 G 68 109 497 8. 4 P 83 110 531 10.2 P 95 III 51 7. 3 P 102 112 149 7.4 P 185 113 102 7.4 Ie 177 114 320 7.1 VP 89 lL\ 3450 6.9 G 70 116 320 9. 2 F 107 117 106 8.5 P 123 118 273 7. 3 F 160 119 10800 4.7 G 70 ]21 16400 4. 8 G 22 122 552 7.4 Ie 52 ) 23 6840 4.1 P 45 124 1160 4.4 P 62 125 5770 3.9 P 52
• Average of the deepest PIts on 6 to 14 speCImens (area, approxImately 0.4 fF) for each soil.
b Romanoff [1] , table 6. e Soil resistivity, saturated soil at 60° F. d Also aeration; 0, goo d; F, fai r; P, poor; VP , very poor. o Romanoff [1], fro m pi t depth·time cur ves using data in tables 13, 14. 15. There
were from 6 to 14 specimens involved in each removal from a given soil and from 3 to 6 removals, the 3 r emovals being for the 100 series of soils.
Specimen Assumed pitt ing rate S pecimen Specim en Assumed a fter 5 yr s g rect.angular h areaA 2 f co-ord log.co-ord i areaA2 j
Mils Mils /vr l\lils lV il. Mils 96 6.0 198 190 378 82 1.6 84 72 134
134 1.3 101 97 192 72 6.7 202 165 351 79 1.4 75 86 170 39 0.28 27 26 52 47 2.2 82 76 131
100 4.4 164 130 244 79 2. 1 88 82 185 98 1.0 66 70 167
124 1. 5 102 90 174 97 1.3 83 75 ]4.\
161 6. 0 215 125 311 169 3.2 160 165 348
83 0.84 73 84 134 98 2.3 114 100 175 56 1.3 64 57 103 72 1.1 71 76 128 77 2.7 116 92 148 63 4.4 136 115 278
103 4. 4 110 120 220 83 1.6 96 85 125
202 8.3 312 310 597 45 0.75 39 32 72 63 1.0 67 65 98
114 0.61 77 67 118 74 3.0 108 100 223
137 17.0 508 420 693 169 8. 1 276 235 545
48 3.2 107 95 170 75 1.3 66 69 156 81 2.7 105 81 177 9.) 8. 4 253 270 598 69 4.1 136 92 J93 99 0.60 37 43 J93 67 1.0 67 58 92
131 3.2 133 103 254 54 0.7 44 48 99 69 5.4 169 140 284
115 8.1 261 185 365 78 4. 7 168 )30 203
125 4.0 179 135 214 201 12.2 285 270 678 HI 2.5 118 95 191 78 7.3 223 240 469
181 4.2 180 140 337 52 2. 0 67 60 183
266 13.6 471 550 1117 118 1.4 93 87 177 126 1.3 95 90 183 134 15.0 441 390 792 H 6 12.6 372 305 619
57 6.0 178 260 528 81 5.0 165 145 294 89 4.3 152 160 325
122 3.0 135 HO 223 81 6.7 208 155 314
272 5.7 2i7 240 487 166 6. 9 255 195 396 228 6.0 262 200 406
223 18. 0 560 430 873 53 5.1 154 100 203
2H 3.0 179 135 274 179 4.4 198 185 376 197 17.9 644 420 853 171 2.8 154 120 244 104 0.9 74 58 117 128 2. 4 123 98 199 150 4.3 182 145 294 138 2.2 123 100 203 169 5.4 218 175 355 193 H . 7 388 300 609 207 11. 8 397 320 650 375 35.0 1060 1250 2530 360 35.0 1052 1000 2030 181 5.1 217 210 426 142 1.8 115 120 244 217 13.7 450 330 670 250 7.6 313 215 437 325 25. 4 795 610 1240 142 1.7 113 93 189
45 0.4 32 28 .\7 106 2. 4 112 77 156
91 1. 6 85 78 158 126 3.6 152 115 233 106 3. 1 130 110 223
~
r A 2= 45.16 ft ', eq m valent to a 20 ft length of 8 ill. pIpe . bOe eq (2) . For soils !through 47, u sed exponents a, from Logan. Ewing, and Denison [7]. For a!lother soils, used exponent a=0.15, from Schwerdtfeger (8).
g Based on best straigh t line after 5 years on pit depth-time curves on linear
74
coordinates. h Extrapolated pi t depth-time curves. i Extrapolated pit dept h-time curves. j From log-coordina tes (i) and use of eq (2).
1 C
I 1
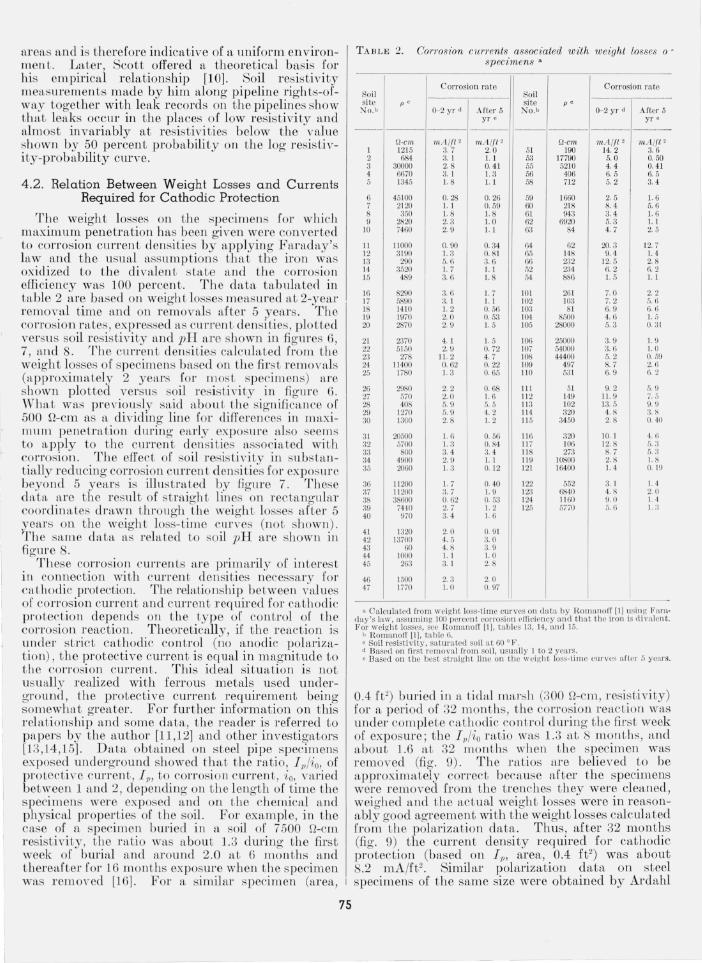
are,Ls a nd is therefore indicative of a uniform environ- TABLE 2. Corrosion currents associated with weight losses o ' men t. LaLer, Scott offered a theoret ical basis for specimens a
his empirical relationship [10]. Soil resistivity mettsurements made by him along pipeline rights-ofway together with leak records on the pipelines show that leaks occur in the places of low resis tivity and alm ost invariably at resisti lTit ies below the value shown by 50 percent probability on the log r esistivity-probability curve.
4.2 . Relation Between Weight Losses and Currents Required for Cathodic Protection
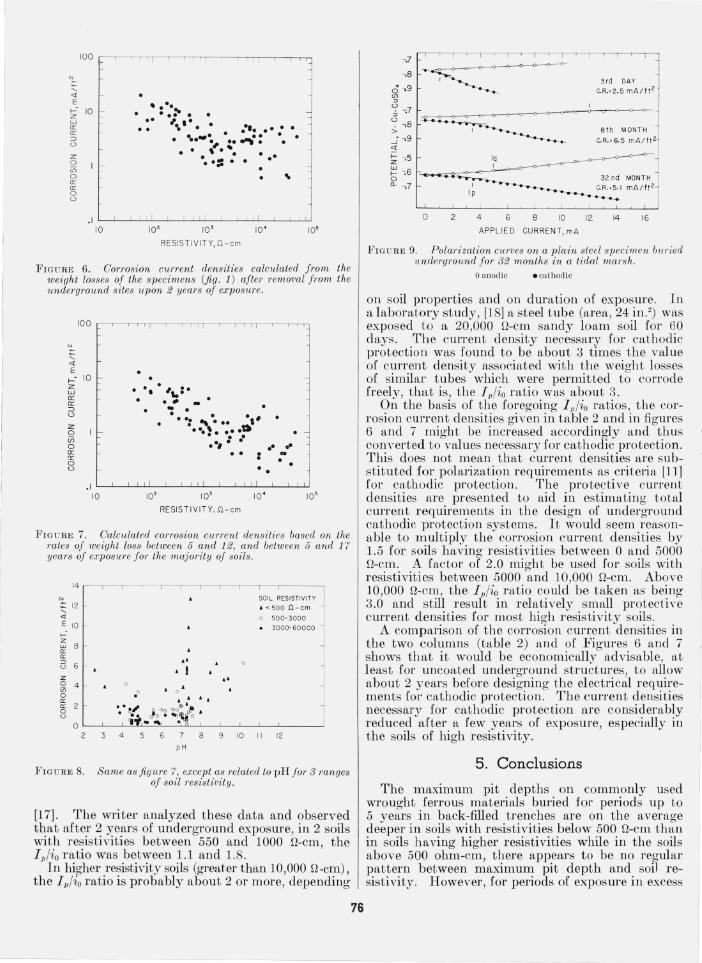
The weight losses on the specimens for which maximum penetration has been gi ven were co n ITer ted to corrosion curren t densities by applying Faraday'S law and the usual ass ump tions that the iron was oxidized to the di valent state a nd the corrosion effi ciency was 100 percent. The data tab ulated in tlLble 2 are based on weigh t losses measured at 2-year removal time ftnd on remo vals afte r 5 years. Th e co rros ion rates, expressed as current densities, plotted versu s soil resis tivity ,1nd pH ar e shown in fi gures 6, 7, and 8. The current densitie.s calculated from the weight losses of pecimens based on the fLrs t rem ovals (ttpproximately 2 years for m ost specim ens) are shown plotted versus soil resistivity in figure 6. Wha t was previously said abou t Lhe significance 01" 500 Q-cm as a dividing lin e I"or difrerences in maximum penetration dming e,U"ly exposure also seems to apply to the currellt densities associated with corrosion. The effect of soil resis tivity in substantially reducing corrosion curren t densi ties for exposure beyond 5 years is illustrated by figu re 7. These data a re t he r esult of straight lin es on rectangular coordin ates drawn through the weigh t losses a fter 5 years on the weight loss-time curves (not shown). The sa me data as related to soil pH a re shown in figure 8.
These corrosion currents are primarily of in teresL ill connection wit h current densities necessar y for caL hodic protection. The relationsilip between "<llu es 01" corrosion current and cunent required for cathocli (; protection depends on the type of control of t he cOlTosiol1 r eaction. Theoretically , if the reaction is under strict cathodic cont rol (no anodic polarization), t he protective curren t is eqmtl in magnitude to tile corrosion current. This ideal si tuation is not usually realized with ferrous metals used underground , the protective current requirement being somewhat greater. For fmther information on this relatio nship and some data, the reader is r eferred to pa pers by the author [11 ,12] and other investigators [13, 14,15]. D ata obtain ed on steel pipe specimens exposed und erground showed that the ratio, I 1,/io, of protectilTe current, I p , to corrosion current, io, varied between 1 and 2, depending Oil the length of time the specimens were exposed and on t he chemical and physical properties of t he soil . For example, in the case of a specimen buried in a soil of 7500 Q-cm resistivity, t he ratio W,lS abo ut 1.3 during the first week of buri:ll and aroun d 2.0 at 6 months and t hereafLer for 16 m ont bs exposure when t he specimen was I·emoved [16] . For a similar specimen (area,
75
Corrosion rate Corrosion rate Soil ------ Soil site p ' site p '
N o. b 0- 2 y r d After 5 N O, b 0- 2 y r d After 5 y r e yr e
----------- -----------f!-cm mA /fl' mA/ft ' fl -cm mA/fl' mA/fl '
1 12 15 3. i 2.0 51 190 14.2 3.6 2 (lS4 3. 1 1.1 53 17i90 5.0 0.50 3 30000 2.8 0.41 55 5210 4. 4 041 4 6670 3. I 1. 3 56 406 6.5 6.5 5 1345 1. 8 1.1 58 712 5.2 3. 4
6 45100 0.28 0. 26 59 J660 2.5 1.6 7 2120 1.1 0. 59 (;() 218 8. 4 5.6
:350 1.8 1. 8 61 9·]3 3. 4 1.6 9 2820 23 1. 0 62 6920 5.3 1.1
10 74(;() 2.9 1.1 (i3 84 4. 7 2.5
11 11000 0.90 0.34 64 62 20.3 12.7 12 3190 l. 3 0.8 1 65 148 9.4 1.4 13 290 5. () :l.6 6G 232 12.5 2.8 14 3520 l. 7 l.1 52 Zl4 (i. 2 6.2 15 489 3. G 1. 8 54 886 1. 5 1.1
16 8290 3 G 1. 7 101 261 7.0 2.2 L7 5890 :l. 1 1.1 102 103 7.2 f), li J8 141 0 1.2 0.56 103 81 6.9 f) . Ii I!! 1970 2.0 0.5:1 I(}I 8500 4.6 I. .) 20 2870 2. 9 l. 5 105 28000 .5.3 o.:n 21 2370 4. I 1. 5 106 25000 :1. 9 1.!) 22 5 L50 2. 9 0.72 107 54000 :3. G l. 0 2:3 278 J I. 2 4.7 108 44400 5.2 O . . I!! 24 11400 062 0. 22 J09 497 8.7 2. (; 25 li80 1. :3 0. 65 11 0 53 t 6. 9 n.2
26 2980 2. 2 O. (lS III 51 9.2 5. !)
27 570 2.0 l. (i LI 2 149 11. 9 7.5 28 408 5.9 5.5 11 3 102 J3.5 9. !I 2n 1270 5.9 4.2 J 14 :320 4.8 :1.8 :l0 L300 2.8 1. 2 115 :1450 2.8 0.411
31 20500 1. 6 0.50 11 (; 320 10. I 4. (l :12 5700 1. :3 0.84 LL 7 106 J2.8 5. :~
33 SOO :1. 4 3. 4 LL S 273 8.7 5. :{ 34 4900 2.9 1.1 119 10SOO 2. S 1. 8 35 2OGO 1. :3 0.1 2 J2 L 1&100 1. 4 o. IU
:16 11 200 1. 7 0. 40 122 552 3. I 1.4 :17 11 200 3.7 1. 9 IZ1 6840 4.8 2. 0 as :)S(iOO O. G2 0.53 124 II (;() 9.0 I. -I :19 74·10 2.7 1.2 125 5770 5. () 1. :1 40 970 3. 4 I.G
41 1:320 2.0 0. 91 42 13700 4.5 3.0 43 GO 4.8 :1.9 44 1000 I. L 1. 0 45 263 3. I 2. S
46 1500 2. :1 20 47 L?iO 1.0 o 97
!~ Calculated from weight loss·Limc curves on data by ilom anofr II I t1s ill ~ Ii'ara~ d a.y's law, assuming 100 pcrcent corrosion eni ciency a nd Lha. t the iron is cti valent. For weight losses, sec Roma ll oO' 11] , t a.b les J3, 14, Hnd 15.
b Roman off [11 . table 6. e Soil reSistivity, sa turated soil at. GO OF . d Based on first re lll ova l from soil , usua ll y 1 to 2 years. e Based on the best stra ight line on the wright loss-tim e cur ves afiel' 5 years.
0.4 f t2) buried in a. tidal il1,ush (300 Q-cm, r esist.ivity) for a period of 32 mont hs, t he corrosion reaction WItS under co mplete eathodic co ntrol during the fLl"st week of exposure; the I p/io ratio W,lS 1.3 at 8 months, and abo ut 1.6 at 32 mont hs when t he specimen was removed (fig. 9) . The r aLios are believed to be approximately correct becttllse a fter the specimens were r emoved (rom the trenches they were cleaned, weighed and the ,tctual weigh t losses were in reasonably good agreement with the weight losses calculated from t he polarization data. Thus, after 32 months (fLg. 9) t he curr ent density require~ for cathodic protection (based on I p , area, 0.4 ft2) was about 8.2 mA/ft2. Similar polarization data on steel specimens of the same size were obtained by Ardahl
100 1
N_
:::: <l E ...... r-: 10 z ... • w .. .. ..... . a:: "I .... . a::
....... e ...... : • ::> • 0 ,' ... • . . Z . . .. 0 I - . . :: . . ifi 0 .. a:: a:: 0 0
.1 , 1 , I , I
10 10 ' 10 ' 10 ' la' RE SIST IVI T Y, D -em
FIG U RE 6. Corrosion CU1Tent densities calcu lated jrom the weight losses oj the specimens (fig. 1) ajter removal jrom the underground sites u pon 2 years oj exposw ·e .
100
N
"-<l E
f--' 10 z w a:: a:: ::> 0
z 0 ifi 0 a:: a:: 0 0
.1 10
••• I .. :· . -.. . .. _: ~ e. .. .,_ . e.!. _:.~ . .. . ., .- .. .. . . .
10' 10' 10 ' 10'
RESISTIVITY. D-em
FIGU RE 7. Oalculated corrosion CWTent densities based on the rates of weight loss between 5 and 12, and between 5 and 17 years of eXpOSlt1'e f0 1' the maj ority of soi ls .
N
:: 12 "<l
E 10 -~: z w 8 a: a: (3 6
z Q 4 en o a: a: 2 o u
4
o .
6
.' • t "
8 9 10 pH
SOIL RESISTIVIT Y
' <500 n-em o 500· 3000
• 3000- 60 0 00
I I 12
FIGURE 8. Same as fi gure 7, except as re lated to pH for 3 ranges of soil resistivity.
[17]. The writer analyzed these data and observed that after 2 years of underground exposure, in 2 soils with resistivities between 550 and 1000 !I-cm, the 1pjio ratio was between 1.1 and 1.8.
In higher resistivity soils (great.er than 10,000 !I-cm) , the 1p/io ratio is probably about 2 or more, depending
76
a 2
I
I P
4 6 8 10
APPLIE D CURRENT, mA
3 rd DAY
G. R., 2.5 m A /f t2
I o 0 0 :r--o--
12
8t h MONTH
C.R.'6.S mA / ft 2
32 nd MONTH
C.R.'S.l mA / ft 2
14 16
FIGU R E 9. Polal'i zation curves on a plain stee l specimen bu ried 1m derground jor 32 months in a tidal marsh.
o anodic . cathodi c
on soil properties and on duration of exposure. In a laboratory study, [18] a steel tube (area, 24 in.2) was exposed to a 20,000 !I-cm sandy loam soil for 60 days. The current density necessary for cathodic protection was found to be about 3 times the value of current density associated with the weigh t losses of similar tubes which were permitted to corrode freely, that is, the 1p /iD ratio was about 3.
On the basis of the foregoing 1p/io ratios , the corrosion current densities given in table 2 and in figures 6 and 7 might be increased accordingly and thus converted to values necessary for cathodic protection . This does not mean that current densities are substituted for polarization requirements as criteria [11] for cathodic protection. The protective current densities are presented to aid in estimating total current requirements in the design of underground cathodic protection systems. It would seem reasonable to multiply the corrosion current densities by 1.5 for soils having resistivities between 0 and 5000 !I-cm . A factor of 2.0 might be used for soils with resistivities between 5000 and 10,000 !I-cm. Above 10,000 !I-cm, the 1p/io ratio could be taken as being 3.0 and still result in relatively small protective current densities for most high resistivity soils.
A comparison of the corrosion CUlTent densities in the two columns (table 2) and of Figures 6 and 7 shows that it would be economically advisable, at least for uncoated underground structures, to allow about 2 years before designing the electrical requirements for cathodic protection. The current densities necessary for cathodic protection are considerably reduced after a few years of exposure, especially in the soils of high resistivity.
5. Conclusions
The maximum pit depths on commonly used wrought ferrous materials bmied for periods up to 5 years in back-filled trenches are on the average deeper in soils with resistivities below 500 !I-cm than in soils having higher resistivities while in the soils above 500 ohm-cm, there appears to be no regular pattern between maximum pit depth and soil resistivity. However, for periods of expos me in excess
~
I
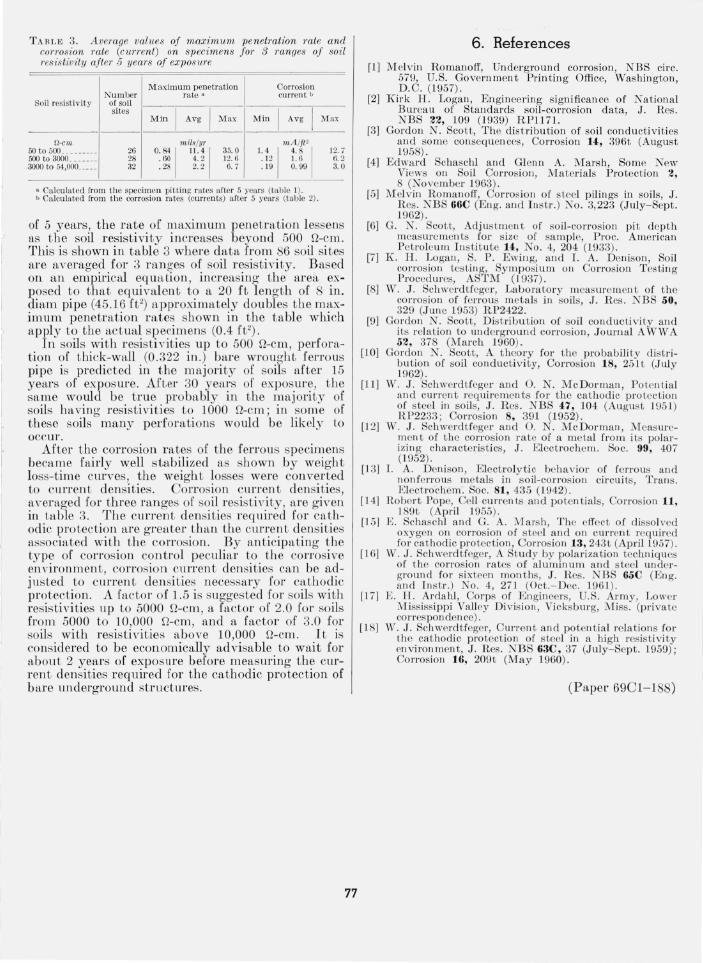
TABLE 3. Average value8 of maximum penetration rate and con'osion rate (current) on specimen8 jar 3 mnges oj soil resistivity after 5 years of exposure
Maximum penetration Corrosion N umber ra.te a current b
Soil resistivity of soil sites
I I I I Min Avg Max Min Avg ,"lax
n-cm mils/yr 1. 4 1 m1./t 1 50 to 500 ......... 26
0. 84 1 11.4 1 35.0 12.7 500 to 3000 ....... 28 . 60 4. 2 12. G . 12 I. 6 6.2 3000 to 54,000 ..... 32 .28 2.2 G.7 . 19 0.99 3. 0
• Calculated from t he specimen pittiug rates after 5 years (table 1). b Calculated from the corrosion rates (currents) after 5 years (table 2).
of 5 years, the rate of maximum penetration lessens as t.he soil resistivity increases heyond 500 Q-cm. This is shown in table 3 where data from 86 soil sites are averaged for 3 ranges of soil resistivity. Based on an empirical equa tion , increasing the area exposed to that equivalent to a 20 ft length of 8 in. diam pipe (45.16 ft2) appro)"'imately doubles the maximum penetration rates shown in the table which apply to the actual specimens (0.4 ft 2) .
In soils with r esistivities up to 500 Q-cm, perforation of thick-wall (0.322 in. ) bare wrought ferrous pipe is predicted in tbemajority of soils after 15 years of exposure. After 30 years of exposure, the same would be true probably in the majority of soils having resistiviti es to 1000 Q-cm; in some of t hese soils many perforations would be likely Lo occur.
After the corrosion rates of the ferrous specimens became fairly well s tabilized as shown by weight loss-time curves, the weight losses were converted to current densities. Corrosion current densi ties, a\Teraged for t hree ranges of soil resistivity, are given in table 3. The current densities req uired for cathodic pro tection are greater than the curren t densities associated with the corrosion. By anticipating the type of corrosion con trol peculiar to the cOlTosi ve en vironment, corrosio n curren t densities can be adj usted to curren t densities necessary for cathodic protection. A factor of 1.5 is suggested for soils wit h resisti vities up to 5000 Q-cm, a factor of 2.0 for soils from 5000 to 10,000 D-cm, and a factor of 3.0 for soils with resistivities above 10,000 Q-cm. It is considered to be economically advisable to wait for about 2 years of exposure before measuring the curren t densities required [or the cathodic protection of bare II ndergrollnd structures.
77
6 . References
[I] Melvin Romanoff, Underground corrosion, N BS circ. 579, U.S. Government Printing Office, Washington , D. C. (1957).
[2] Kirk H. Logan, E ngineering significance of National Bureau of Standards soil-corrosion data , J . Res. NBS 22, 109 (1939) RP1l71.
[3] Gordon N. Scott, The di stribu tion of soil conductivities and so me consequences, Corrosion 140, 396t (August 1955) .
[4] Edwa rd Schaschl an d Glenn A. Marsh, Some New Views on So il Corrosiotl, :Materials Protection 2, 8 (November 1963) .
[5] Mcl vin Romanoff, Co rrosio n of steel pilings in soils, J. Res. N BS 66C (Eng. and Instr. ) No. 3,223 (July-Sept . 1962).
[6] G. N . Scott, Adjustment of so il-co rrosion pit depth measurements for s ize of sa mple, Proc. American Petroleum Instit ute 140, No.4, 204 (1933).
[7] Ie H . Logan, S. P . Ewing, and 1. A. Denison, Soil co rros ion test in g, Sy mposium on Corrosion Testin g Procedures, AST1VI (J 937).
[S] ' V. J. Sc hwerdtfeger, Laboratory meas ure men t of the co rros ion of fel'l'ous metals in SOils, J. Res. N BS 50, 329 (June 1953) RP2422.
[9] Gordon N. Scott, Distribu t ion of soil conductivity an d its relation to underground corros ion , J ournal A W'V A 52, 37S (March 1960) .
[10] Gordon N . Scott, A t heory for t he probability distribution of soil conductivi ty, COl'l'osion 18, 25lt (July 1962).
[11] W. J . Schwerd tfeger and O. N. McDor rnan, Po tential and current requirements for t he cathodic protection of steel in so ils, J . Res. NBS 407, 104 (August 195 1) RP2233 ; Co rrosion 8, 391 (1952).
[12] W. J . Sc hwe rd tfeger and O. N. Mc Dorman, :Meas urement of t he corrosion ra te of a metal from its polarizin g characteristics, J . Electrochem. Soc. 99, 407 (1952) .
[l3] 1. A. Denison, Electrolytic bc'hav ior of ferrous and non ferrous metals in so il-corros ion circui ts, Trans. Electrochem. Soc. 81,4:35 (1942).
[14] Robert Pope, Cell curren ts and poten t ials, Corrosion 11, IS9t (April 1955).
[15] E. Schaschl a nd G. A. Mars h, The effect of dissolved oxygen on co rrosion of steel and on curren t required for cathodic protection, Co rrosion 13, 243t (Apl'iI1957).
[16] 'vV. J . Schwerdtfeger, A Study by polarization techn iques of the co rrosion rates of alumin um and steel underground for sixteen months, J . Res . NBS 65C (Eng. and Instr.) No.4, 271 (Oct.- Dec. 1961).
[17] E. II . Ardahl, Corps of Engineers, U.S. Army, Lower Mississ ippi Vall ey Di vis ion , Vicksb urg, M iss. (private correspondence) .
[IS] 'V . J . Schwerd tfeger, Current and potential relations for t he cathodic protection of steel in a high resistivity environment, J. Res. NBS 63C, 37 (July- Sept. 1959); Corrosion 16, 209t (May 1960).
(P aper 69Cl- 188)