soil resistivity analysis -borssele woz v1.1 - table of ... · soil resistivity which will only be...
TRANSCRIPT
POSITION PAPER
STAKE HOLDER CONSULTATION PROCESS OFFSHORE GRID NL
Type: Position paper
Work stream Technical
Topic: T.11 Overplanting
Filename ONL 15-083-T11_Overplanting_PP_v3
Version 3 - Public release
Pages 14
QUALITY CONTROL
Prepared: Daniël Vree
Reviewed: Frank de Vries 29.02.2016
Approved: Frank Wester 29.02.2016
Release
Table of Contents
1. BACKGROUND MATERIAL ......................................................................................................................... 2
2. SCOPE AND CONSIDERATIONS................................................................................................................ 2
3. ACTIVE POWER TRANSFER THROUGH THE TENNET OFFSHORE GRID ............................................ 4
3.1 Export cable design (220kV) (Status V1, dd 10-04-2015) .................................................................. 4
4. ADDITIONAL CALCULATIONS ON DYNAMIC LOADING OF THE EXPORT CABLES ........................... 5
4.1 Introduction (V2 – 13-10-2015) ........................................................................................................... 5
4.2 Update 01 - 29-2-2016 - based on results of initial geotechnical survey (V3) .................................... 6
Analysis of soil data of the initial geotechnical survey ......................................................................................................... 6
Update of the dynamic ampacity calculations for 380MW: basis for the calculations ........................................................... 7
Update of the dynamic ampacity calculations for 380MW: calculations results .................................................................. 10
5. EXPORT CABLE LOAD MANAGEMENT .................................................................................................. 11
6. POSITION OF TENNET .............................................................................................................................. 12
7. IMPACT ON COST ..................................................................................................................................... 13
8. FURTHER UPDATES (STATUS AS OF 29-2-2016) .................................................................................. 13
9. ANNEX A: SOIL RESISTIVITY ANALYSIS - OFFSHORE CABLE ROUTE FROM LANDFALL TO
BORSSELE ALPHA AND BETA ........................................................................................................... 14
Disclaimer: the content of this paper is disclosed for information purposes only. In no way does this paper constitute rights for
(potential) Connected Parties, or bind TenneT legally.
TenneT TSO B.V.
DATE 01.03.2016
PAGE 2 of 14
1. Background material
Literature used:
N.A.
2. Scope and considerations
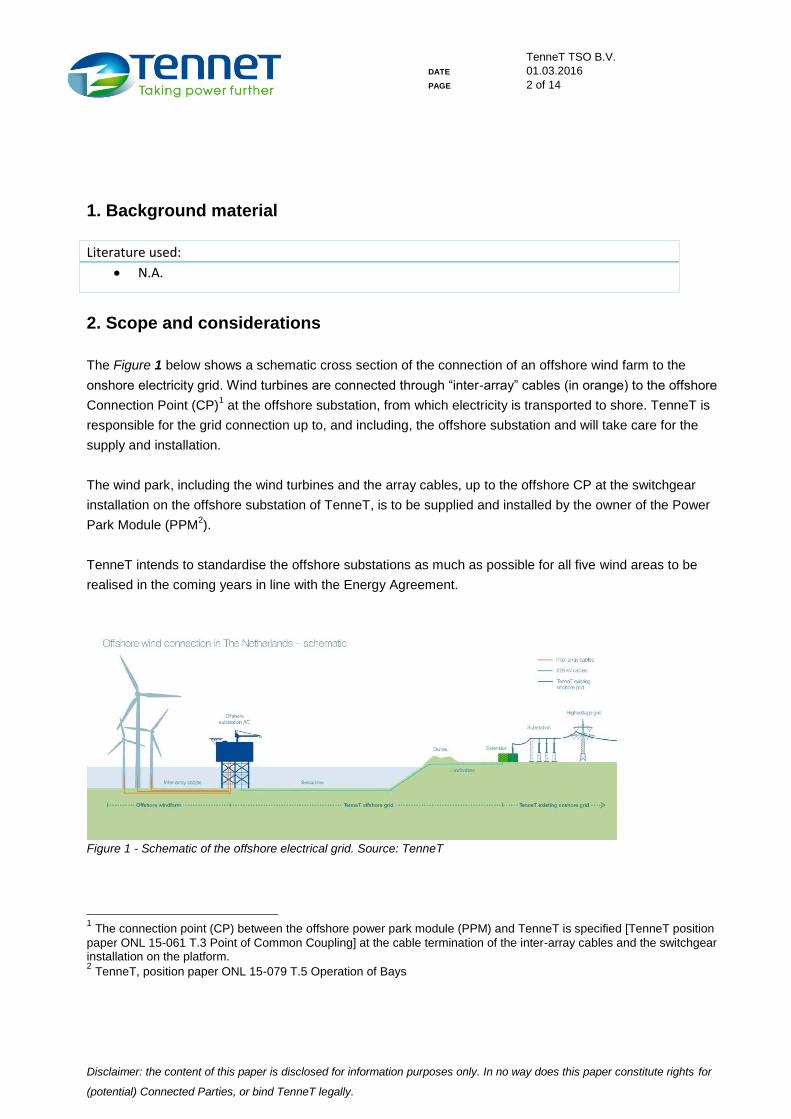
The Figure 1 below shows a schematic cross section of the connection of an offshore wind farm to the
onshore electricity grid. Wind turbines are connected through “inter-array” cables (in orange) to the offshore
Connection Point (CP)1 at the offshore substation, from which electricity is transported to shore. TenneT is
responsible for the grid connection up to, and including, the offshore substation and will take care for the
supply and installation.
The wind park, including the wind turbines and the array cables, up to the offshore CP at the switchgear
installation on the offshore substation of TenneT, is to be supplied and installed by the owner of the Power
Park Module (PPM2).
TenneT intends to standardise the offshore substations as much as possible for all five wind areas to be
realised in the coming years in line with the Energy Agreement.
Figure 1 - Schematic of the offshore electrical grid. Source: TenneT
1 The connection point (CP) between the offshore power park module (PPM) and TenneT is specified [TenneT position
paper ONL 15-061 T.3 Point of Common Coupling] at the cable termination of the inter-array cables and the switchgear installation on the platform. 2 TenneT, position paper ONL 15-079 T.5 Operation of Bays
Disclaimer: the content of this paper is disclosed for information purposes only. In no way does this paper constitute rights for
(potential) Connected Parties, or bind TenneT legally.
TenneT TSO B.V.
DATE 01.03.2016
PAGE 3 of 14
Overplanting
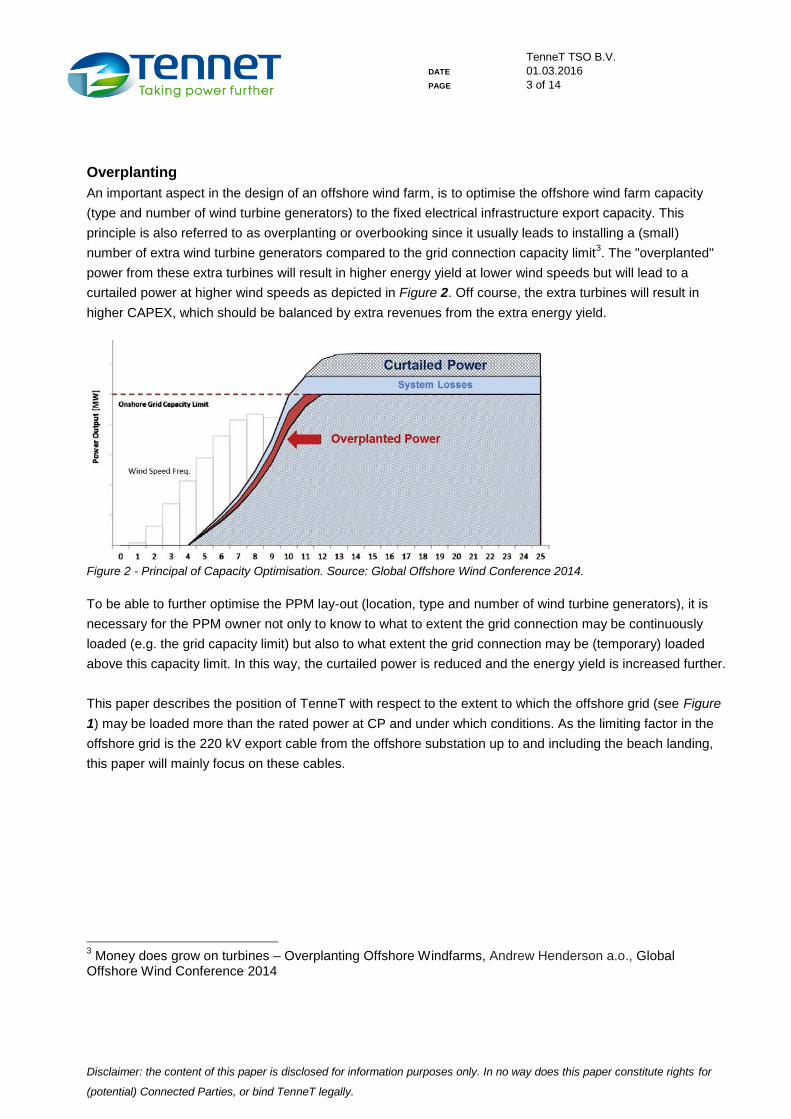
An important aspect in the design of an offshore wind farm, is to optimise the offshore wind farm capacity
(type and number of wind turbine generators) to the fixed electrical infrastructure export capacity. This
principle is also referred to as overplanting or overbooking since it usually leads to installing a (small)
number of extra wind turbine generators compared to the grid connection capacity limit3. The "overplanted"
power from these extra turbines will result in higher energy yield at lower wind speeds but will lead to a
curtailed power at higher wind speeds as depicted in Figure 2. Off course, the extra turbines will result in
higher CAPEX, which should be balanced by extra revenues from the extra energy yield.
Figure 2 - Principal of Capacity Optimisation. Source: Global Offshore Wind Conference 2014.
To be able to further optimise the PPM lay-out (location, type and number of wind turbine generators), it is
necessary for the PPM owner not only to know to what to extent the grid connection may be continuously
loaded (e.g. the grid capacity limit) but also to what extent the grid connection may be (temporary) loaded
above this capacity limit. In this way, the curtailed power is reduced and the energy yield is increased further.
This paper describes the position of TenneT with respect to the extent to which the offshore grid (see Figure
1) may be loaded more than the rated power at CP and under which conditions. As the limiting factor in the
offshore grid is the 220 kV export cable from the offshore substation up to and including the beach landing,
this paper will mainly focus on these cables.
3 Money does grow on turbines – Overplanting Offshore Windfarms, Andrew Henderson a.o., Global
Offshore Wind Conference 2014
Disclaimer: the content of this paper is disclosed for information purposes only. In no way does this paper constitute rights for
(potential) Connected Parties, or bind TenneT legally.
TenneT TSO B.V.
DATE 01.03.2016
PAGE 4 of 14
3. Active power transfer through the TenneT offshore grid
The offshore grid design will be based on the parameters as listed in Table 1.
Table 1 - TenneT NL offshore grid parameters
Grid parameter Value
Grid capacity per PPM at offshore CP: 350MW
Number of PPM per offshore platform: 2
Reactive power exchange at CP under normal conditions: Max +/- 0,1 p.u. (+/- 35 Mvar)
Nominal voltage level onshore / offshore: 225 / 230kV +/- 1%
To determine if more than 700MW (2 * 350MW) of active power (P) can be transferred through the offshore
grid, TenneT makes an assessment of the capability of the 220 kV export cables (next paragraph) based on
the parameters shown above. If there is additional capacity found in the design which allows the 220 kV
export cables to transfer more than 700MW of active power, TenneT will assure that other grid components
will also be capable to transfer this extra power.
According to RfG, PPMs will be required to contribute to the primary voltage regulation with more reactive
power than shown in Table 1. It is assumed that these circumstances (Q > 35Mvar or Q < -35Mvar) will be
limited in time and therefore will not significantly influence the thermal loading of the cables.
3.1 Export cable design (220kV) (Status V1, dd 10-04-2015)
A preliminary 220 kV export cable design study was commissioned by TenneT for a capacity of 700MW in
steady state condition according to the IEC 60287. Although the exact soil conditions are not yet known, the
results of this design show that under a wide range of the thermal resistivity of the soil, typical cable designs
are available.
Furthermore, within this study dynamic load calculations on the 220 kV export cables have been performed
using actual wind data over a measuring period of three and a half years. The calculations have been used
to assess possibilities for optimisation of cable dimensioning. The calculations are based on various cable
types (variation in conductor type and cross section), a range of thermal resistivity values of the soil and two
different installation locations (near offshore platform at one meter under seabed and near shore at three
meters under seabed).
The results of the dynamic load calculations show that for an optimized cable design (at 700MW design
capacity), the transmission of 10% additional active power is allowable, but not guaranteed, provided the
following conditions are met:
- Voltage at nominal voltage as defined in Table 1;
- Soil resistivity over the whole trajectory 0,7 K.m/W as a maximum
Simulation results show that on a few occasions the maximum allowable conductor temperature would be
exceeded and curtailment is necessary (provided that all wind turbine generators are in operation). These
Disclaimer: the content of this paper is disclosed for information purposes only. In no way does this paper constitute rights for
(potential) Connected Parties, or bind TenneT legally.
TenneT TSO B.V.
DATE 01.03.2016
PAGE 5 of 14
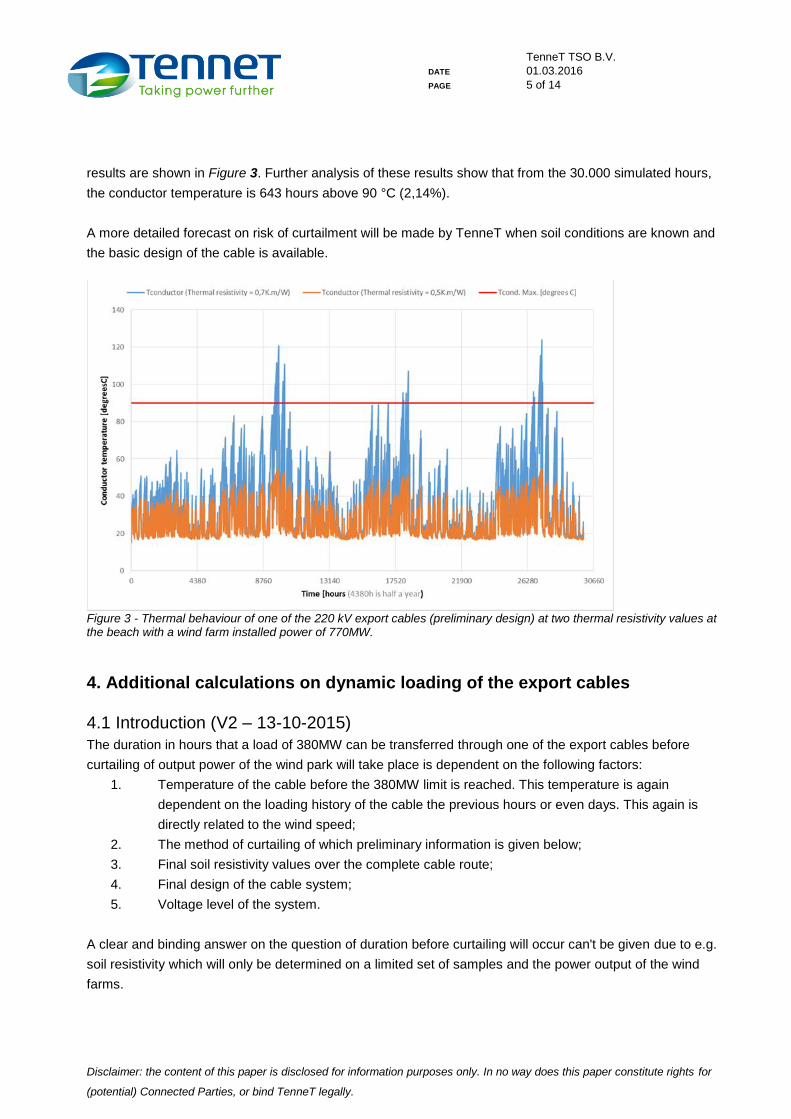
results are shown in Figure 3. Further analysis of these results show that from the 30.000 simulated hours,
the conductor temperature is 643 hours above 90 °C (2,14%).
A more detailed forecast on risk of curtailment will be made by TenneT when soil conditions are known and
the basic design of the cable is available.
Figure 3 - Thermal behaviour of one of the 220 kV export cables (preliminary design) at two thermal resistivity values at the beach with a wind farm installed power of 770MW.
4. Additional calculations on dynamic loading of the export cables
4.1 Introduction (V2 – 13-10-2015)
The duration in hours that a load of 380MW can be transferred through one of the export cables before
curtailing of output power of the wind park will take place is dependent on the following factors:
1. Temperature of the cable before the 380MW limit is reached. This temperature is again
dependent on the loading history of the cable the previous hours or even days. This again is
directly related to the wind speed;
2. The method of curtailing of which preliminary information is given below;
3. Final soil resistivity values over the complete cable route;
4. Final design of the cable system;
5. Voltage level of the system.
A clear and binding answer on the question of duration before curtailing will occur can't be given due to e.g.
soil resistivity which will only be determined on a limited set of samples and the power output of the wind
farms.
Disclaimer: the content of this paper is disclosed for information purposes only. In no way does this paper constitute rights for
(potential) Connected Parties, or bind TenneT legally.
TenneT TSO B.V.
DATE 01.03.2016
PAGE 6 of 14
However, TenneT made dynamic loading capability calculations based on assumptions on wind speeds, soil
resistivity and cable design. In this position paper and V14 some results of these calculations have been
given5.
When soil resistivity measurement results (which are part of the geotechnical survey) are available to
TenneT, TenneT will update its calculations for the Borssele case which will lead to a better estimate. This
update is expected to be finished end of January 2016. Within these calculations, the following calculations
will be made for the worst case location on the cable route (hot spot):
1. Time until the conductor reaches 90 °C at 380MW load with a starting conductor temperature
(t=0) related to a continuous loading of the cable before (t<0) of 350MW and 0MW;
2. Time until the conductor reaches 90 °C at 365MW load with a starting conductor temperature
(t=0) related to a continuous loading of the cable before (t<0) of 350MW and 0MW.
These simulation results (which are still estimates) can be used in the business case calculations of the
offshore wind park developers.
4.2 Update 01 - 29-2-2016 - based on results of initial geotechnical survey (V3)
Analysis of soil data of the initial geotechnical survey
In January 2016 the final report of the first geotechnical survey has been received by TenneT. The final
report ['Factual Report Geotechnical Investigation, 15-01-2016'] is available on request via
[email protected]. In this survey 115 boreholes are included with a target depth of seabed – 6m including
measurements of the thermal conductivity of 10cm samples per each 1m. Most boreholes ended between
seabed – 5m and seabed – 6m.
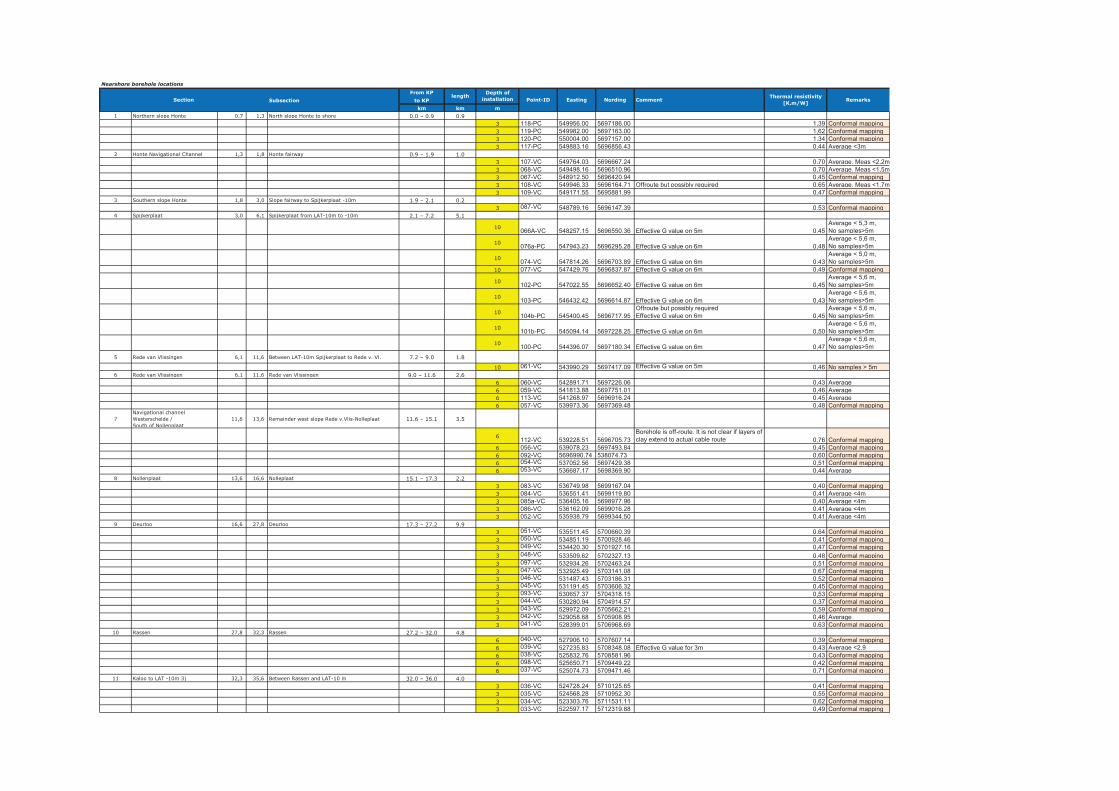
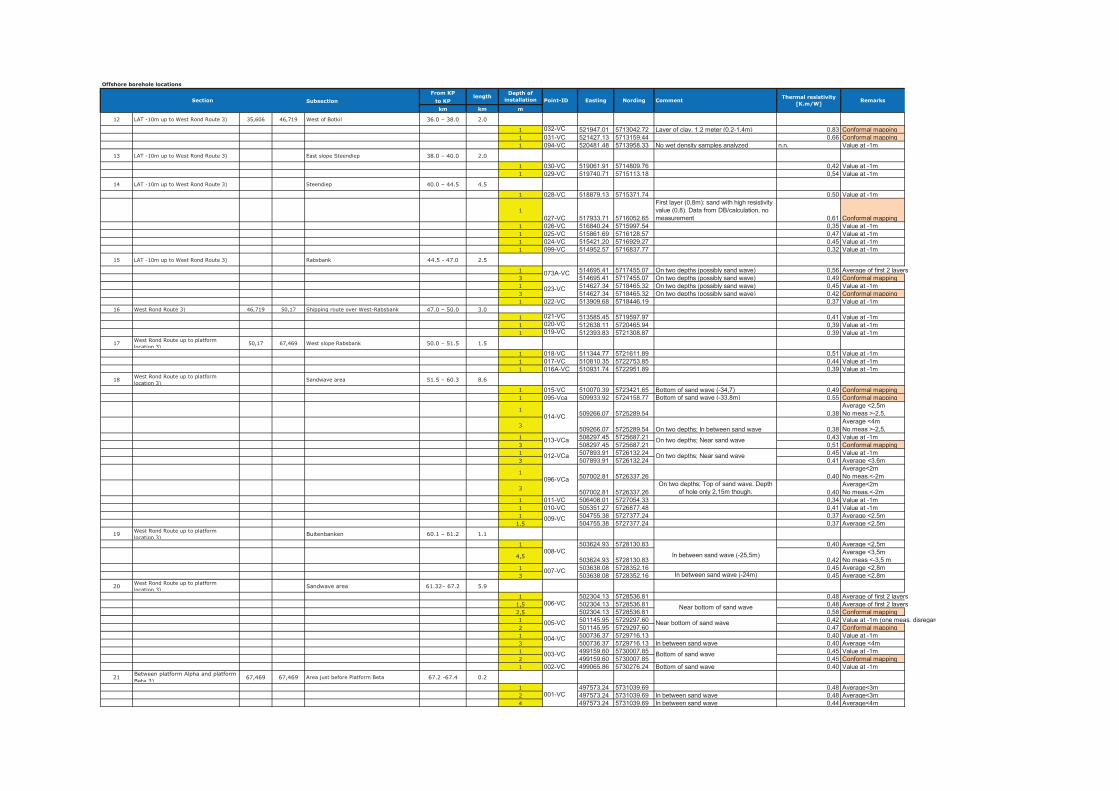
The raw data of this final survey report has been processed where for each borehole the effective thermal
resistivity value (G) has been determined on the target depth of burial (DOB) using the conformal mapping
methodology as stipulated in [Cigré ELECTRA nr 98, The calculation of the effective external thermal
resistance of cables laid in materials having different thermal resistivities, 1985]. These effective thermal
resistivity (G) values are included in Annex A. The target DOB per route section (which can also be found in
the table of Annex A) has preliminary been determined by TenneT based on expected permit requirements
and preliminary results of the morphological study and may change during the ongoing route engineering
works.
Based on the data of the final survey report and Annex A, the areas with the highest thermal resistivity
values have been listed in Table 2, where also a short description is included per area.
4 http://www.tennet.eu/nl/fileadmin/afbeeldingen/grid-projects/Net_iop_zee/Ronde_2/ONL_15-083-
T11_Overplanting_PP_v1.pdf 5 KNMI1 measuring pole 321 Europlatform (coordinates 10044; 447580), measuring dates 1-1-2001 until 3-
6-2004, data was converted from 29.1m height to a height of 107m.
Disclaimer: the content of this paper is disclosed for information purposes only. In no way does this paper constitute rights for
(potential) Connected Parties, or bind TenneT legally.
TenneT TSO B.V.
DATE 01.03.2016
PAGE 7 of 14
Table 2 – Areas with highest thermal resistivity values along the Borssele cable route
Location Target
DOB [m]
Effective G
[K.m/W]
Description
Mudflats 3 1,6 The thermal resistivity which is found in the mudflats area
is the result of layers of peat and clay. If the target DOB
would be decreased to 1,2m (land equivalent), the
effective resistivity value will decrease to 1,3 K.m/W.
Spijkerplaat 20 0,7 At this moment, an estimate of the effective thermal
resistivity on 20 meters has been assumed. Although the
target DOB in the Spijkerplaat is now preliminary set at
10m, the morphological study indicates that in the future a
coverage up to 20m can be expected and this value has
to be taken into account in the cable design.
Rede van
Vlissingen
6 0,8 At KP11-KP13 layers of clay have been identified at the
southern part of the cable route. Only limited
measurements are available (on route BH92 and off-route
BH111, BH112), but based on these measurements, clay
must be taken into account which results in the given
thermal resistivity value.
West of Botkil 1 0,9 In this area clayey soil has been found.
Offshore below
sand wave
8 0,5 Based on the current survey data, effective thermal
resistivity on the bottom of the sand wave is estimated to
be 0,5 [K.m/W]. Due to the migration of sand waves and
as the cables will be installed at a level below the bottom
of these sand waves, cables may in the future be covered
by a full sand wave with heights up to 8m.
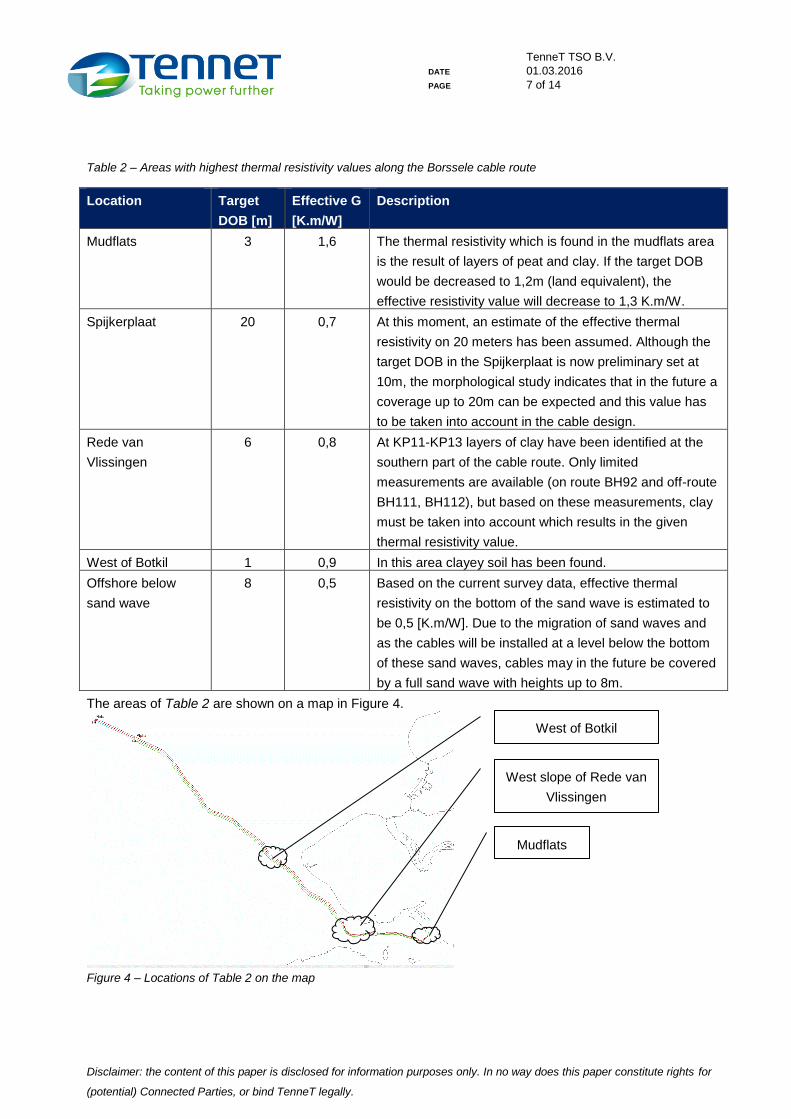
The areas of Table 2 are shown on a map in Figure 4.
Figure 4 – Locations of Table 2 on the map
Mudflats
West slope of Rede van
Vlissingen
West of Botkil
Disclaimer: the content of this paper is disclosed for information purposes only. In no way does this paper constitute rights for
(potential) Connected Parties, or bind TenneT legally.
TenneT TSO B.V.
DATE 01.03.2016
PAGE 8 of 14
Update of the dynamic ampacity calculations for 380MW6: basis for the calculations
Soil conditions
In the previous issue of this position paper the following assumption was made on the thermal resistivity
along the cable route:
- Thermal resistivity over the whole trajectory 0,7 K.m/W as a maximum
From Table 2 it can be concluded that this is not the case in three of the areas (Mudflats, Rede van
Vlissingen, West of Botkil). Also the future coverage of 20 meters at the Spijkerplaat was not taken into
account at that time. Below it is described how the new results are taken into account in the basis for the
dynamic ampacity calculations of this update.
As currently a) cable/route engineering is still in progress and b) an additional survey is being carried out,
this basis for calculation may change significantly. Therefore, this update is only an intermediate update
where in some cases no calculations have been done (Mudflats) or calculations for two different scenario's
(Spijkerplaat / Rede van Vlissingen). See chapter 8 on when the final update will become available.
Mudflats: The thermal resistivity of the mudflats area is so high that backfill must be considered. Backfill is a
mitigating measure where thermal resistivity is improved by embedding the cable in sand with a better
thermal resistivity value than the original soil. At this moment, the feasibility of this option is under
investigation., both technically as permit wise. Therefore, this area has not been taken into account within
this update of the dynamic ampacity calculations, but will be taken into account in the final update. However,
at this moment it is expected that with the right backfill design, ampacity issues can be mitigated.
Spijkerplaat: The value in Table 2 of the effective thermal resistivity of the extreme future burial condition at
the Spijkerplaat of 20 meters has been used as the basis for the dynamic ampacity calculations of this
update. When results of the current survey (see chapter 8) will become available, the effective thermal
resistivity value for this case will be calculated from actual soil measurements and may then change
significantly. Therefore, the results of the calculations on this area must be treated as preliminary. As an
example, also calculations for an effective thermal resistivity of 0,6 K.m/W have been made.
Rede van Vlissingen: At the areas where clay has been found, the target DOB will be decreased to the
minimum DOB required by permit which is seabed – 3m for this area. For this area both of the following
cases have been used as a basis for the dynamic ampacity calculations:
- DOB of 6m with effective G-value of 0,8 [K.m/W] (original case of Table 2)
- DOB of 3m with effective G-value of 0,7 [K.m/W] (case with following assumptions: a) DOB is
decreased, b) trench will be dredged and c) sand will be used for filling the dredged trench).
West of Botkil / sand waves: For the offshore part of the cables the West of Botkil area was determined to
be the worst case situation based on the (static) ampacity calculations for 350MW and has been used for
this update of the dynamic ampacity calculations.
6 In V3 of this position paper, the maximum power of 380 MW is aligned with the development framework for
the offshore grid as prescribed by the Ministry of Economic Affairs
Disclaimer: the content of this paper is disclosed for information purposes only. In no way does this paper constitute rights for
(potential) Connected Parties, or bind TenneT legally.
TenneT TSO B.V.
DATE 01.03.2016
PAGE 9 of 14
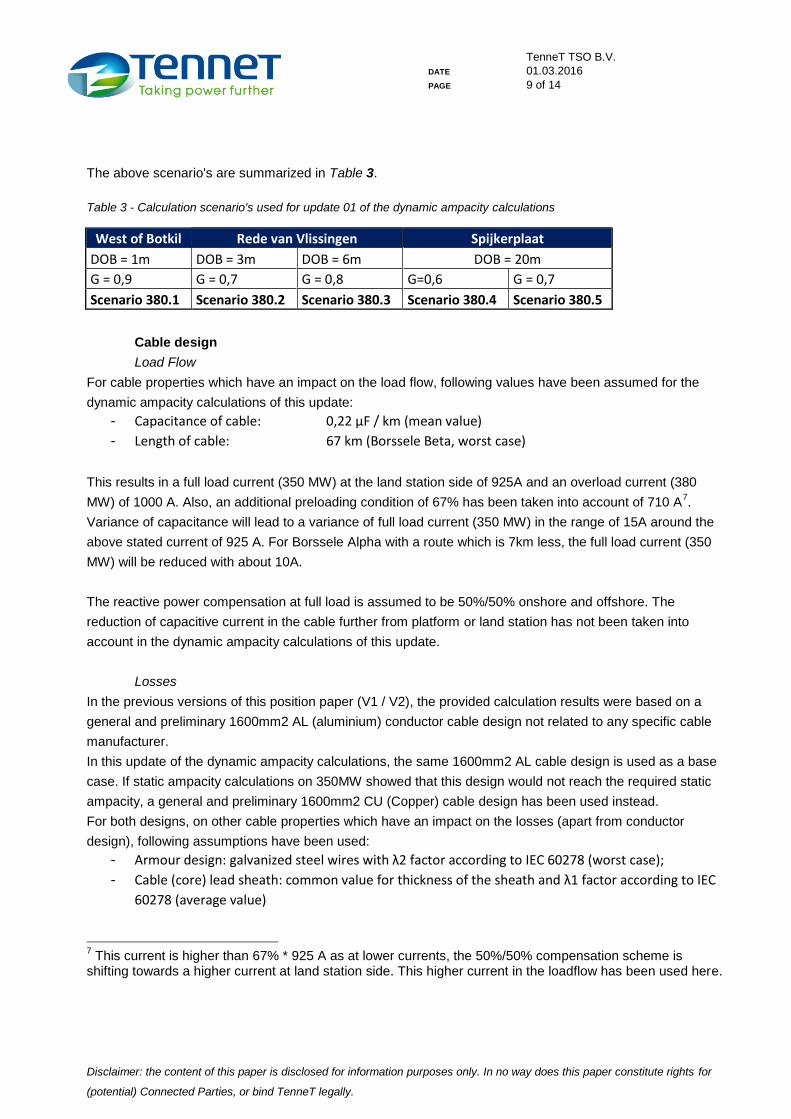
The above scenario's are summarized in Table 3.
Table 3 - Calculation scenario's used for update 01 of the dynamic ampacity calculations
West of Botkil Rede van Vlissingen Spijkerplaat
DOB = 1m DOB = 3m DOB = 6m DOB = 20m
G = 0,9 G = 0,7 G = 0,8 G=0,6 G = 0,7
Scenario 380.1 Scenario 380.2 Scenario 380.3 Scenario 380.4 Scenario 380.5
Cable design
Load Flow
For cable properties which have an impact on the load flow, following values have been assumed for the
dynamic ampacity calculations of this update:
- Capacitance of cable: 0,22 µF / km (mean value)
- Length of cable: 67 km (Borssele Beta, worst case)
This results in a full load current (350 MW) at the land station side of 925A and an overload current (380
MW) of 1000 A. Also, an additional preloading condition of 67% has been taken into account of 710 A7.
Variance of capacitance will lead to a variance of full load current (350 MW) in the range of 15A around the
above stated current of 925 A. For Borssele Alpha with a route which is 7km less, the full load current (350
MW) will be reduced with about 10A.
The reactive power compensation at full load is assumed to be 50%/50% onshore and offshore. The
reduction of capacitive current in the cable further from platform or land station has not been taken into
account in the dynamic ampacity calculations of this update.
Losses
In the previous versions of this position paper (V1 / V2), the provided calculation results were based on a
general and preliminary 1600mm2 AL (aluminium) conductor cable design not related to any specific cable
manufacturer.
In this update of the dynamic ampacity calculations, the same 1600mm2 AL cable design is used as a base
case. If static ampacity calculations on 350MW showed that this design would not reach the required static
ampacity, a general and preliminary 1600mm2 CU (Copper) cable design has been used instead.
For both designs, on other cable properties which have an impact on the losses (apart from conductor
design), following assumptions have been used:
- Armour design: galvanized steel wires with λ2 factor according to IEC 60278 (worst case);
- Cable (core) lead sheath: common value for thickness of the sheath and λ1 factor according to IEC
60278 (average value)
7 This current is higher than 67% * 925 A as at lower currents, the 50%/50% compensation scheme is
shifting towards a higher current at land station side. This higher current in the loadflow has been used here.
Disclaimer: the content of this paper is disclosed for information purposes only. In no way does this paper constitute rights for
(potential) Connected Parties, or bind TenneT legally.
TenneT TSO B.V.
DATE 01.03.2016
PAGE 10 of 14
J-tube
The J-tube is not found to be a critical part of the cable system. With the base case of 1600mm2 AL, the
steady state rated current in the J-tube is well above 1000 A. This is based on the following conditions:
- Wind speed of > 10 m/s;
- Solar radiation of 602 W/m2 (max intensity of 1000 W/m2 and an angle of 53°);
- Ambient temperature of 30 °C.
Grid connection limitations
With respect to the overloading of the grid connection system, the 380 MW shall be seen as an absolute
maximum as other grid components such as the main transformers have much shorter thermal time
constants. If more than 380 MW is being generated by the WPO, the curtailment level 3 is applicable as
described in chapter 5 (actual curtailment of the power output of the wind park by TenneT). In this case a
certain time delay will be taken into account which will be related to the amount of exceedance of the 380
MW limit.
Update of the dynamic ampacity calculations for 380MW: calculations results
In V2 of the position paper, following was stated (see paragraph 4.1):
Within these calculations, the following calculations will be made for the worst case location on the cable
route (hot spot):
1. Time until the conductor reaches 90 °C at 380MW load with a starting conductor temperature (t=0)
related to a continuous loading of the cable before (t<0) of 350MW and 0MW;
2. Time until the conductor reaches 90 °C at 365MW load with a starting conductor temperature (t=0)
related to a continuous loading of the cable before (t<0) of 350MW and 0MW
In this update of the dynamic calculations, only the 380MW case has been studied, but five scenario's
instead of one scenario have been assessed as well as three different preloading conditions (instead of two).
The preloading condition of 67% / 710 A has been added to reflect an average loading of the cable which
may be expected over a long time with a wind farm loading profile. Also, a preloading time of one year has
been used for the 67% and 100% conditions to assure a starting temperature which is nearby the steady
state conductor temperature when calculated according the IEC 60267. The dynamic calculations for this
update have been made according to the IEC 60853.
Disclaimer: the content of this paper is disclosed for information purposes only. In no way does this paper constitute rights for
(potential) Connected Parties, or bind TenneT legally.
TenneT TSO B.V.
DATE 01.03.2016
PAGE 11 of 14
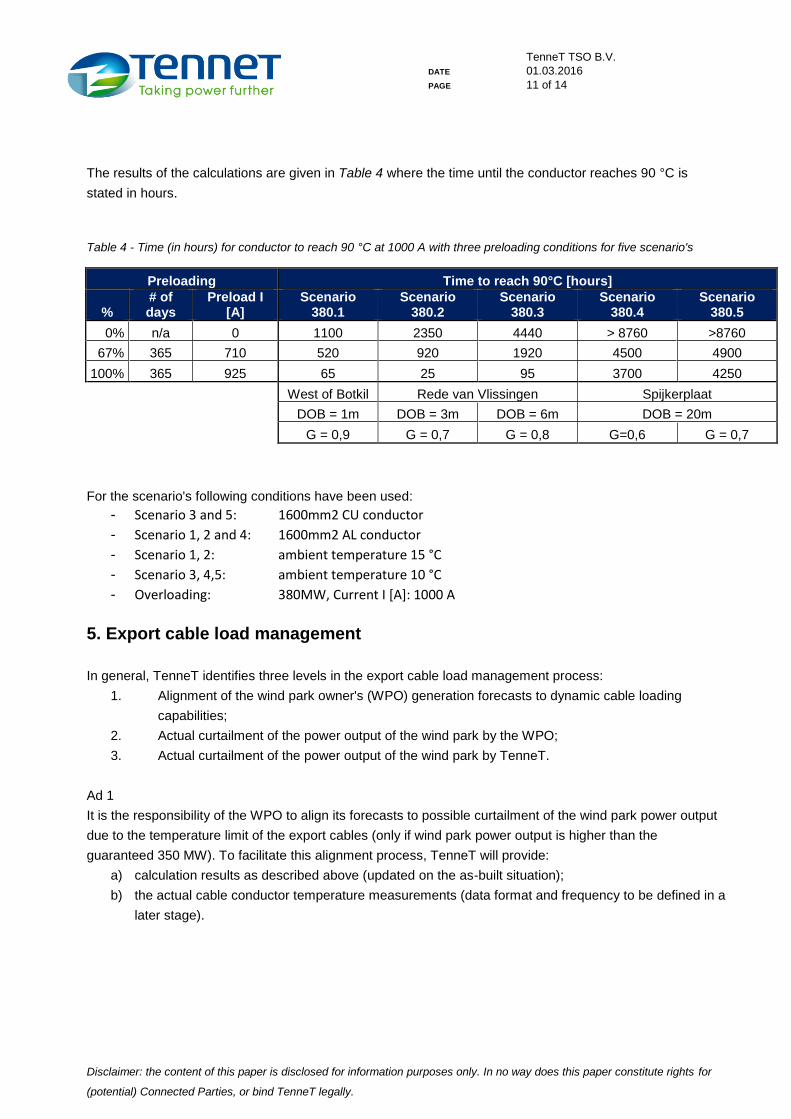
The results of the calculations are given in Table 4 where the time until the conductor reaches 90 °C is
stated in hours.
Table 4 - Time (in hours) for conductor to reach 90 °C at 1000 A with three preloading conditions for five scenario's
Preloading Time to reach 90°C [hours]
% # of days
Preload I [A]
Scenario 380.1
Scenario 380.2
Scenario 380.3
Scenario 380.4
Scenario 380.5
0% n/a 0 1100 2350 4440 > 8760 >8760
67% 365 710 520 920 1920 4500 4900
100% 365 925 65 25 95 3700 4250
West of Botkil Rede van Vlissingen Spijkerplaat
DOB = 1m DOB = 3m DOB = 6m DOB = 20m
G = 0,9 G = 0,7 G = 0,8 G=0,6 G = 0,7
For the scenario's following conditions have been used:
- Scenario 3 and 5: 1600mm2 CU conductor
- Scenario 1, 2 and 4: 1600mm2 AL conductor
- Scenario 1, 2: ambient temperature 15 °C
- Scenario 3, 4,5: ambient temperature 10 °C
- Overloading: 380MW, Current I [A]: 1000 A
5. Export cable load management
In general, TenneT identifies three levels in the export cable load management process:
1. Alignment of the wind park owner's (WPO) generation forecasts to dynamic cable loading
capabilities;
2. Actual curtailment of the power output of the wind park by the WPO;
3. Actual curtailment of the power output of the wind park by TenneT.
Ad 1
It is the responsibility of the WPO to align its forecasts to possible curtailment of the wind park power output
due to the temperature limit of the export cables (only if wind park power output is higher than the
guaranteed 350 MW). To facilitate this alignment process, TenneT will provide:
a) calculation results as described above (updated on the as-built situation);
b) the actual cable conductor temperature measurements (data format and frequency to be defined in a
later stage).
Disclaimer: the content of this paper is disclosed for information purposes only. In no way does this paper constitute rights for
(potential) Connected Parties, or bind TenneT legally.
TenneT TSO B.V.
DATE 01.03.2016
PAGE 12 of 14
Ad 2
If the conductor temperature will increase above a certain threshold value (value to be determined per
project), WPO will receive a warning signal from TenneT. WPO shall start at that moment (at the latest) with
the curtailment of the wind park power output, down to 350MW. If this curtailment is not started or is not
sufficient and conductor temperature will increase above a second threshold value (close to but below 90
degrees Celsius, to be determined per project), WPO will receive a second and final warning signal from
TenneT. Immediately after this second signal has been released, TenneT has the right to proceed to the
third level as described below.
The warning signals are considered to be the official legally binding information provided by TenneT to the
WPO. The cable conductor temperature measurements as described under level 1 are provided by TenneT
as an extra service and will be for information only.
Ad 3
When the second warning signal has been released, WPO shall immediately reduce the power output to a
maximum of 350 MW. TenneT will at that time monitor conductor temperature and power output
continuously. If the reduction of power by the WPO is not sufficient, TenneT will have the right to curtail
under 350MW by switching off one of the strings of the wind park without any further notice.
With the three levels described above, an export cable load management process has been introduced that
enables the WPO to manage its generation forecasts and actual power output curtailment while at the other
hand it is assured that the export cable conductor temperature will never increase above 90 degrees Celsius.
6. Position of TenneT
Above considerations lead TenneT to the following position:
TenneT is inclined towards allowing the PPMs to transmit 8% above their rated power (350MW), which is
30MW extra, with the requirement for PPM's to curtail their produced power, in case the 220 kV export
cables reach their maximum allowable temperature limits8. Details on curtailment of the PPMs will be
addressed to in the 'Customer Connection Agreements (ATO)'.
The calculations results of paragraph 4.2 are only valid for Borssele. For the Hollandse Kust (Zuid) tender,
TenneT will give an update based on specific Hollandse Kust (Zuid) soil data.
TenneT has decreased the allowed additional rated power from 10% (V2) to 8% (V3) in order to align this
allowable addition with the development framework for the offshore grid as prescribed by the Ministry of
Economic Affairs.
8 Operational limits of sea and land cables will be monitored continuously by temperature sensing systems.
Disclaimer: the content of this paper is disclosed for information purposes only. In no way does this paper constitute rights for
(potential) Connected Parties, or bind TenneT legally.
TenneT TSO B.V.
DATE 01.03.2016
PAGE 13 of 14
7. Impact on cost
At this point in time the impact on costs cannot be analysed quantitatively, as this requires detailed
knowledge (assumptions) on both wind farm layout, turbine choice and dynamic loading strategies.
8. Further updates (status as of 29-2-2016)
At this moment a second survey is being carried out for additional information on thermal resistivity due to
the following reasons:
- Determination of thermal resistivity in highly mobile areas (Spijkerplaat, Nollenplaat) up to a depth
of 10m (Nollenplaat) and 20m (Spijkerplaat);
- Better assessment of the other areas listed in Table 2: West of Botkil and Rede van Vlissingen.
The results of this additional survey will be used for a final update of this position paper. Also, 365 MW
scenario's will be included in that update.
This update is expected first half of April 2016.

Disclaimer: the content of this paper is disclosed for information purposes only. In no way does this paper constitute rights for
(potential) Connected Parties, or bind TenneT legally.
TenneT TSO B.V.
DATE 01.03.2016
PAGE 14 of 14
9. Annex A: Soil resistivity analysis - Offshore cable route from landfall to Borssele Alpha and Beta
Table with effective soil resistivity values.
From KP
Subsection to KP
km km m
1 Northern slope Honte 0,7 1,3 North slope Honte to shore 0.0 – 0.9 0.9
3 118-PC 549956.00 5697186.00 1,39 Conformal mapping
3 119-PC 549982.00 5697163.00 1,62 Conformal mapping
3 120-PC 550004.00 5697157.00 1,34 Conformal mapping
3 117-PC 549883.16 5696856.43 0,44 Average <3m
2 Honte Navigational Channel 1,3 1,8 Honte fairway 0.9 – 1.9 1.0
3 107-VC 549764.03 5696667.24 0,70 Average. Meas <2,2m
3 068-VC 549498.16 5696510.96 0,70 Average. Meas <1,5m
3 067-VC 548912.50 5696420.94 0,45 Conformal mapping
3 108-VC 549946.33 5696164.71 Offroute but possibly required 0,65 Average. Meas <1,7m
3 109-VC 549171.55 5695881.99 0,47 Conformal mapping
3 Southern slope Honte 1,8 3,0 Slope fairway to Spijkerplaat -10m 1.9 – 2.1 0.2
3 548789.16 5696147.39 0,53 Conformal mapping
4 Spijkerplaat 3,0 6,1 Spijkerplaat from LAT-10m to -10m 2.1 – 7.2 5.1
10066A-VC 548257.15 5696550.36 Effective G value on 5m 0,45
Average < 5,3 m,
No samples>5m
10076a-PC 547943.23 5696295.28 Effective G value on 6m 0,48
Average < 5,6 m,
No samples>5m
10074-VC 547814.26 5696703.89 Effective G value on 6m 0,43
Average < 5,0 m,
No samples>5m
10 077-VC 547429.76 5696837.87 Effective G value on 6m 0,49 Conformal mapping
10102-PC 547022.55 5696652.40 Effective G value on 6m 0,45
Average < 5,6 m,
No samples>5m
10103-PC 546432.42 5696614.87 Effective G value on 6m 0,43
Average < 5,6 m,
No samples>5m
10104b-PC 545400.45 5696717.95
Offroute but possibly required
Effective G value on 6m 0,45
Average < 5,6 m,
No samples>5m
10101b-PC 545094.14 5697228.25 Effective G value on 6m 0,50
Average < 5,6 m,
No samples>5m
10100-PC 544396.07 5697180.34 Effective G value on 6m 0,47
Average < 5,6 m,
No samples>5m
5 Rede van Vlissingen 6,1 11,6 Between LAT-10m Spijkerplaat to Rede v. Vl. 7.2 – 9.0 1.8
10 543990.29 5697417.09 0,46 No samples > 5m
6 Rede van Vlissingen 6,1 11,6 Rede van Vlissingen 9.0 – 11.6 2.6
6 060-VC 542891.71 5697226.06 0,43 Average
6 059-VC 541813.88 5697751.01 0,46 Average
6 113-VC 541268.97 5696916.24 0,45 Average
6 057-VC 539973.36 5697369.48 0,48 Conformal mapping
7
Navigational channel
Westerschelde /
South of Nollenplaat
11,6 13,6 Remainder west slope Rede v.Vlis-Nolleplaat 11.6 – 15.1 3.5
6112-VC 539228.51 5696705.73 0,76 Conformal mapping
6 056-VC 539078.23 5697493.84 0,45 Conformal mapping
6 092-VC 5696990.74 538074.73 0,60 Conformal mapping
6 537052.56 5697429.38 0,51 Conformal mapping
6 536687.17 5698369.90 0,44 Average
8 Nollenplaat 13,6 16,6 Nolleplaat 15.1 – 17.3 2.2
3 083-VC 536749.98 5699167.04 0,40 Conformal mapping
3 084-VC 536551.41 5699119.80 0,41 Average <4m
3 085a-VC 536405.16 5698977.96 0,40 Average <4m
3 086-VC 536162.09 5699016.28 0,41 Average <4m
3 052-VC 535938.79 5699344.50 0,41 Average <4m
9 Deurloo 16,6 27,8 Deurloo 17.3 – 27.2 9.9
3 535511.45 5700660.39 0,64 Conformal mapping
3 534851.19 5700928.46 0,41 Conformal mapping
3 534420.30 5701927.16 0,47 Conformal mapping
3 533509.62 5702327.13 0,48 Conformal mapping
3 532934.26 5702463.24 0,51 Conformal mapping
3 532925.49 5703141.08 0,67 Conformal mapping
3 531487.43 5703186.31 0,52 Conformal mapping
3 531191.45 5703606.32 0,45 Conformal mapping
3 530657.37 5704318.15 0,53 Conformal mapping
3 530280.94 5704914.57 0,37 Conformal mapping
3 529972.09 5705662.21 0,59 Conformal mapping
3 529058.68 5705908.95 0,46 Average
3 528399.01 5706968.69 0,63 Conformal mapping
10 Rassen 27,8 32,3 Rassen 27.2 – 32.0 4.8
6 527906.10 5707607.14 0,39 Conformal mapping
6 527235.83 5708348.08 Effective G value for 3m 0,43 Average <2,9
6 525832.76 5708581.96 0,43 Conformal mapping
6 525650.71 5709449.22 0,42 Conformal mapping
6 525074.73 5709471.46 0,71 Conformal mapping
11 Kaloo to LAT -10m 3) 32,3 35,6 Between Rassen and LAT-10 m 32.0 – 36.0 4.0
3 036-VC 524728.24 5710125.65 0,41 Conformal mapping
3 035-VC 524568.28 5710952.30 0,55 Conformal mapping
3 034-VC 523303.76 5711531.11 0,62 Conformal mapping
3 033-VC 522597.17 5712319.88 0,49 Conformal mapping
039-VC
038-VC
098-VC
037-VC
Section
044-VC
043-VC
042-VC
041-VC
040-VC
097-VC
047-VC
046-VC
045-VC
093-VC
Point-ID
Nearshore borehole locations
048-VC
051-VC
050-VC
049-VC
CommentThermal resistivity
[K.m/W]Remarks
054-VC
Easting Nording
053-VC
lengthDepth of
installation
087-VC
061-VC Effective G value on 5m
Borehole is off-route. It is not clear if layers of
clay extend to actual cable route
From KP
Subsection to KP
km km m
12 LAT -10m up to West Rond Route 3) 35,606 46,719 West of Botkil 36.0 – 38.0 2.0
1 521947.01 5713042.72 Layer of clay, 1,2 meter (0,2-1,4m) 0,83 Conformal mapping
1 031-VC 521427.13 5713159.44 0,66 Conformal mapping
1 094-VC 520481.48 5713958.33 No wet density samples analyzed n.n. Value at -1m
13 LAT -10m up to West Rond Route 3) East slope Steendiep 38.0 – 40.0 2.0
1 030-VC 519061.91 5714809.76 0,42 Value at -1m
1 029-VC 519740.71 5715113.18 0,54 Value at -1m
14 LAT -10m up to West Rond Route 3) Steendiep 40.0 – 44.5 4.5
1 028-VC 518879.13 5715371.74 0,50 Value at -1m
1
027-VC 517933.71 5716052.65
First layer (0,8m): sand with high resistivity
value (0,8). Data from DB/calculation, no
measurement 0,61 Conformal mapping
1 026-VC 516840.24 5715997.54 0,35 Value at -1m
1 025-VC 515861.69 5716128.57 0,47 Value at -1m
1 024-VC 515421.20 5716929.27 0,45 Value at -1m
1 099-VC 514952.57 5716837.77 0,32 Value at -1m
15 LAT -10m up to West Rond Route 3) Rabsbank 44.5 - 47.0 2.5
1 514695.41 5717455.07 On two depths (possibly sand wave) 0,56 Average of first 2 layers
3 514695.41 5717455.07 On two depths (possibly sand wave) 0,49 Conformal mapping
1 514627.34 5718465.32 On two depths (possibly sand wave) 0,45 Value at -1m
3 514627.34 5718465.32 On two depths (possibly sand wave) 0,42 Conformal mapping
1 022-VC 513909.68 5718446.19 0,37 Value at -1m
16 West Rond Route 3) 46,719 50,17 Shipping route over West-Rabsbank 47.0 – 50.0 3.0
1 513585.45 5719597.97 0,41 Value at -1m
1 512638.11 5720465.94 0,39 Value at -1m
1 512393.83 5721308.87 0,39 Value at -1m
17West Rond Route up to platform
location 3)50,17 67,469 West slope Rabsbank 50.0 – 51.5 1.5
1 018-VC 511344.77 5721611.89 0,51 Value at -1m
1 017-VC 510810.35 5722753.85 0,44 Value at -1m
1 016A-VC 510931.74 5722951.89 0,39 Value at -1m
18West Rond Route up to platform
location 3)Sandwave area 51.5 – 60.3 8.6
1 015-VC 510070.39 5723421.65 Bottom of sand wave (-34,7) 0,49 Conformal mapping
1 095-Vca 509933.92 5724158.77 Bottom of sand wave (-33,8m) 0,55 Conformal mapping
1509266.07 5725289.54 0,38
Average <2,5m
No meas >-2,5,
3509266.07 5725289.54 On two depths; In between sand wave 0,38
Average <4m
No meas >-2,5,
1 508297.45 5725687.21 0,43 Value at -1m
3 508297.45 5725687.21 0,51 Conformal mapping
1 507893.91 5726132.24 0,45 Value at -1m
3 507893.91 5726132.24 0,41 Average <3,6m
1507002.81 5726337.26 0,40
Average<2m
No meas.<-2m
3507002.81 5726337.26 0,40
Average<2m
No meas.<-2m
1 011-VC 506408.01 5727054.33 0,34 Value at -1m
1 010-VC 505351.27 5726877.48 0,41 Value at -1m
1 504755.38 5727377.24 0,37 Average <2,5m
1,5 504755.38 5727377.24 0,37 Average <2,5m
19West Rond Route up to platform
location 3)Buitenbanken 60.1 – 61.2 1.1
1 503624.93 5728130.83 0,40 Average <2,5m
4,5503624.93 5728130.83 0,42
Average <3,5m
No meas <-3,5 m
1 503638.08 5728352.16 0,45 Average <2,8m
3 503638.08 5728352.16 0,45 Average <2,8m
20West Rond Route up to platform
location 3)Sandwave area 61.32– 67.2 5.9
1 502304.13 5728536.81 0,48 Average of first 2 layers
1,5 502304.13 5728536.81 0,48 Average of first 2 layers
2,5 502304.13 5728536.81 0,58 Conformal mapping
1 501145.95 5729297.60 0,42 Value at -1m (one meas. disregarded)
2 501145.95 5729297.60 0,47 Conformal mapping
1 500736.37 5729716.13 0,40 Value at -1m
3 500736.37 5729716.13 In between sand wave 0,40 Average <4m
1 499159.60 5730007.85 0,45 Value at -1m
2 499159.60 5730007.85 0,45 Conformal mapping
1 002-VC 499065.86 5730276.24 Bottom of sand wave 0,40 Value at -1m
21Between platform Alpha and platform
Beta 3)67,469 67,469 Area just before Platform Beta 67.2 -67.4 0.2
1 497573.24 5731039.69 0,48 Average<3m
2 497573.24 5731039.69 In between sand wave 0,48 Average<3m
4 497573.24 5731039.69 In between sand wave 0,44 Average<4m
001-VC
021-VC
020-VC
019-VC
004-VC
008-VC
006-VC
003-VC
014-VC
096-VCa
009-VC
007-VC
Thermal resistivity
[K.m/W]Remarks
012-VCa
013-VCa
Easting Nording
073A-VC
023-VC
032-VC
On two depths; Top of sand wave. Depth
of hole only 2,15m though.
005-VC Near bottom of sand wave
Offshore borehole locations
lengthDepth of
installation Point-IDSection
On two depths; Near sand wave
On two depths; Near sand wave
In between sand wave (-25,5m)
Comment
Bottom of sand wave
In between sand wave (-24m)
Near bottom of sand wave