soil remediation and plants || spatial mapping of metal-contaminated soils
TRANSCRIPT
415Soil Remediation and Plants. http://dx.doi.org/10.1016/B978-0-12-799937-1.00015-2Copyright © 2015 Elsevier Inc. All rights reserved.
Spatial Mapping of Metal-Contaminated Soils
H.R. Ahmad, T. Aziz, Z.R. Rehman and SaifullahInstitute of Soil and Environmental Sciences, University of Agriculture, Faisalabad, Pakistan
INTRODUCTION
Industrialization has caused huge changes in the heavy metal concentration at the earth’s surface. Soils are the continued recipients of heavy metals and other pollutants. Excessive inputs of heavy metals and synthetic chemicals into urban soils may lead to the deterioration of the soil biology and function, changes in the soil physicochemical properties and other environmental problems (Papa et al., 2010; Xia et al., 2011; Zhang et al., 2012, 2013). Metals added into soils remain there forming insoluble complexes with soil constituents; heavy metal present in soils usually interact with the soil inorganic and organic colloids (Adriano et al., 2004). The fate of heavy metals in contaminated soils is gov-erned by soil characteristics and climatic factors. Metals mobility and reactiva-tion may be controlled by a complex set of chemical, physical and biological processes occurring within soils and with soil components (Kabata-Pendias, 2004; Acosta et al., 2011). Availability of heavy metals in soils and their uptake by plants not only depend on the labile portion of metals in soils but also on a variety of interacting soil and plant factors like type of clay minerals, presence of organic matter, soil reaction, type of genotype, plant species and their archi-tecture (Ghafoor et al., 2004; Sparks, 2005; Li et al., 2009; Zhao et al., 2014).
Urban agricultural soils are often irrigated with raw effluent mainly because of a shortage of canal irrigation. Secondly, city sewerage / effluent often contains certain plant nutrients and is available free of cost throughout the year, so farm-ers apply this untreated effluent to reduce input cost of commercial fertilizers. Although this sewage disposal is an economic method for resource-poor coun-tries like Pakistan, it has certain environmental implications due to the presence of soluble salts and harmful substances including heavy metals like iron (Fe), lead (Pb), nickel (Ni), chromium (Cr), zinc (Zn), cobalt (Co), cadmium(Cd) and lead (Pb) (Ghafoor et al., 1994; Qadir et al., 1999; Hussain, 2000; Murtaza et al., 2003; Ahmad et al., 2011). Continuous application of this water onto
Chapter 15
416 Soil Remediation and Plants
agricultural soils without any treatment causes accumulation of metal ion in biosphere (Ahmad et al., 2011; Sabir et al., 2011; Ghafoor et al., 2004). Heavy metals emitted from mobile and immobile sources can be transported in soil, water, air and can even be taken up by the plants, entering the food chain (Pru-vot et al., 2006). Heavy metals can enter the soil in three primary ways: by continuous use of wastewater for irrigation, leakage of tailings and deposition of aerosol particulates (Ahmad et al., 2011; Weldegebriel et al., 2012). Several factors, both natural and anthropogenic, control the movement of heavy metals and metalloids between the soil, water, plants and even atmosphere and it is part of a complex and intricately organized biogeochemical cycling processes in nature (Singh et al., 2010).
Bioavailability of heavy metals is mainly governed by physical and chemical characteristics of soils, and it is also influenced by plant genetic characteristics. Metal uptake by plants is variable over the years without a clear relationship to weather conditions, and due to such variations the behavior of metals is difficult to predict (Romic and Romic, 2003). Heavy metal uptake depends on the type of plant species and their genetic make-up (Chen et al., 2006; Peris et al., 2007); therefore, their effects vary significantly with plant species. Still, vast areas of arable soils affected by heavy metals have not been reclaimed; for example, about 2 × 10⁷ ha arable soils in China are polluted with heavy metals (Gu et al., 2005).
The major concern of increasing heavy metal contents of soils results from anthropogenic activities. This elevated concentration of heavy metals may lead to human and animal exposure and the associated health risks. In order to prevent potential health hazards of heavy metals in agricultural lands, it is a prerequisite to monitor the sources, reasons and surveying of soil, water and plants, together with the prevention of heavy metals’ entry into the food chain via plant uptake (Henning et al., 2001; QuSheng et al., 2010). Heavy metals enter the food chain through plants and animals. Humans can be chronically exposed to heavy met-als from drinking water and food ingestion (NRCS, 2000), or through breathing in contaminated dust (Abrahams, 2002; Amato et al., 2010). Children are more susceptible to exposure because of their play-habits (USEPA, 2010). These metal ions exhibit various effects including toxicity to aquatic organisms and man if present beyond respective safe limits in soils, waters and plants (Nriagu, 1990; Shukry, 2001). Nowadays, computerized techniques are available to study the geochemistry of heavy metals. The most popular techniques include Remote Sensing, Global Positioning System (GPS) and Geographic Information System (GIS) (Lee et al., 2006; Wong et al., 2006). Geo-statistic mapping techniques are commonly used to demonstrate the hotspots of heavy-metal-contaminated sites (Chaoyang et al., 2009). These techniques add a spatial component to the heavy metal concentration that will help the farmers and environmentalists to make more informed management decisions, by geospatially defining ‘hot spot areas’ of metal contamination. This chapter illustrates how geophysical tech-niques such as GPS, GIS and remote sensing can be integrated to support the management of metal-contaminated soils.
417Chapter | 15 Spatial Mapping of Metal-Contaminated Soils
GEOPHYSICAL TECHNIQUES TO ASSESS SPATIAL VARIABILITY
Global Positioning System (GPS)
The GPS is a satellite-based triangulation system which is used to mark the exact location of a point (in latitudes and longitudes) on earth. The GPS gives the accurate position from where the soil sample is taken. The GPS is a setup of 27 satellites revolving the earth (http://www.howstuffworks.com/gps.htm). The American Heritage Dictionary defines GPS as a system for finding the posi-tion on the Earth’s surface by using the radio signals of several satellites. The GPS has three fragments, namely, space, control and a receiver. The GPS satel-lites revolving around the Earth are spreading continuous navigation signals. A receiver fragment of GPS captures data from at least six satellites to calculate the time it takes for each satellite signal to reach the GPS receiver, and the dif-ference in reception time determines your location (Anonymous, 2000; Theiss et al., 2005). The coordinates given by the GPS receiver are then transferred to GIS software to develop the geochemical maps of heavy metals. Furthermore, given the ease of manipulating and transferring the data, the data can readily be incorporated with other existing GIS information. Now GPS is a necessary part of the geographic information system, with applications ranging from digital soil mapping, forest management, spatial and temporal surveying to road traffic, hospital and water management, etc.
Remote Sensing
Normally soil scientists make holes using soil-augers to take samples from the contaminated areas followed by laboratory analysis and interpolation of results by developing digital maps (Kemper and Sommer, 2002). However, such an approach is time-consuming and costly. Remote sensing has been used in investigations of the contents of heavy metals as a rapid method of preliminary analysis, and high-quality imaging spectrometer (hyperspectral) data have also been used. Hyperspectral remote sensing observations may act as an alterna-tive to traditional ground-based methods to detect a variety of plants facing environmental stress by providing both spatial and temporal key information for precision farming because of its ability to measure biophysical indica-tors and spatial variations. Existing studies show that the metal stress spectral characteristics of data from the field can be distinguished by a high spectral resolution of the instrument and analysis techniques (Collins et al., 1983; Cle-vers et al., 2004). Remote sensing technology can be applied to determine the extent of heavy metal contamination (Wu et al., 2005; Guan and Cheng, 2008; Wu et al., 2013). Liu et al. (2011) monitored the extent of Cu and Cd in rice using red edge position and fractal dimension of reflectance with wavelet transform methods. They reported that wavelet transform methods, along with fractal analysis, are capable of determining heavy metal stress in rice. Simi-larly Liu et al. (2011) reported that the heavy metal stress in rice fields can be
418 Soil Remediation and Plants
visualized if the reflectance is obtained with a typical spectrum with higher reflectance around 550 nm and a weak absorption peak around 680 nm. Sridhara et al. (2011) monitored the bio-assimilation of heavy metals in soils amended with biosolids and their uptake in soybean. They applied remote sensing to monitor plants facing heavy metal stress. They used the LandSat TM images and a handheld spectro-radiometer. The normalized difference vegetation index (NDVI) of both Spectral and Landsat TM images can be used to identify metal stress plants from normal plants. However, NDVI exhibits a negative correlation with the soil copper concentration. This study suggests that remote sensing can be used to identify plants suffering from metal stress.
GEOGRAPHIC INFORMATION SYSTEM
Geographic Information System (GIS) manipulates and manages both spatial and attribute data and display information on a geographical location. The GIS technology is a combination of computer-based tools, data, people and methods that work together to perform tasks related to spatial data. Although GIS is mostly associated with mapping, it is just one aspect of the functions of GIS. It can serve as a database and can also create geographic models by analyzing different sets of data in the GIS (Lerner and Lerner, 2008).
Planimetric and topographic maps are developed based on field data; these maps are used to identify the exact location of a geographic feature on the earth’s surface. For example, accurate location of a sampling or monitor-ing site can be readily observed from the measured grid present on large-scale maps (Artiola et al., 2004). The position of any geographic feature expressed in longitude and latitude is usually described in terms of degrees, minutes, seconds and fractions of seconds. The exact location of the Wash-ington Monument, for example, is 38°54′21″ north latitude, 78°02′07.55″ west longitude. The application of GIS is increasing and it has become an essential tool for planning of conserving forests, grasslands, ecosystems and nature preserves. GIS has revolutionized the science of planning and conservation-examining problems using quantitative data, just as it may have revolutionized the way you plan a driving trip. The National Research Council, Canada recommended using geophysical techniques like remote sensing, GPS and GIS in environment-related problems to assist in data col-lection, their processing and analysis steps. Digital maps developed through these techniques are very useful to resource managers, policy makers and researchers. The GIS displays the analytical data with additional informa-tion like road network, canals, towns, river, etc., offering several benefits in assessing the heavy-metal-contaminated soil, water, air and plants (Lee, 2005). This approach of mapping the affected areas with the heavy metals or for micronutrients is utilized by scientists. Geostatistics can be used to analyze the data and to map the spatial patterns of soil heavy metals by using GIS. GIS can be very helpful in monitoring the pollution-hit areas
419Chapter | 15 Spatial Mapping of Metal-Contaminated Soils
and reports are available showing that GIS contour maps are very effective in identifing the pollution-hit areas (Imperato et al., 2003; Li et al., 2004). Spatial distribution maps are being created using the geostatistical analyst tool of ARCGIS v 10.1 software. Heavy-metal-contaminated hotspot maps associated with city area, cultural features and the regions close to industrial zones can be developed. The GIS maps are helpful in identifying the source of heavy metals (Cd, Ni, Pb, Zn and Cu) mainly originating from industrial, municipal wastes, traffic load and human activities or from a single point of discharge (Shi et al., 2008; Ahmad et al., 2011). Zhang (2006) used the Inverse Distance Weighted (IDW) technique to investigate the distribution of Pb, Cu and Zn in surface soils and concluded that spatial distribution of Pb, Cu and Zn were related to the traffic pollution in Galway city in Ireland, which has relatively heavy traffic densities and has been polluted with heavy metals for many years. The copper originated from brake discs and engine wear, lead from the combustion of gasoline and batteries and zinc came from metal oxidation and tyre wear. A similar type of survey was conducted by Li et al. (2004) using the GIS technique. They estimated the Cd, Co, Cr, Cu, Ni and Zn variations in soil samples drawn from the soil surface (0–15 cm) of urbanized Kowloon area of Hong Kong following a systematic soil-sampling method. Geochemical maps developed from GIS marked many hot spots of heavy metal contamination in the industrial and residential areas. They concluded that traffic load and industrial units are the main sources of heavy metal contamination in these areas.
It is very difficult to collect data about heavy metal concentrations from a city level as it is laborious, time consuming and expensive. Although grid sampling describes the information from the sampling points, you need another method like interpolation to address the non-sampling points while surveying large areas to estimate or predict values of unsampled sites. There are various interpolation methods available to predict the heavy metal concentration from non-sampled points. Some of the methods are briefly described in the following sections.
Histogram
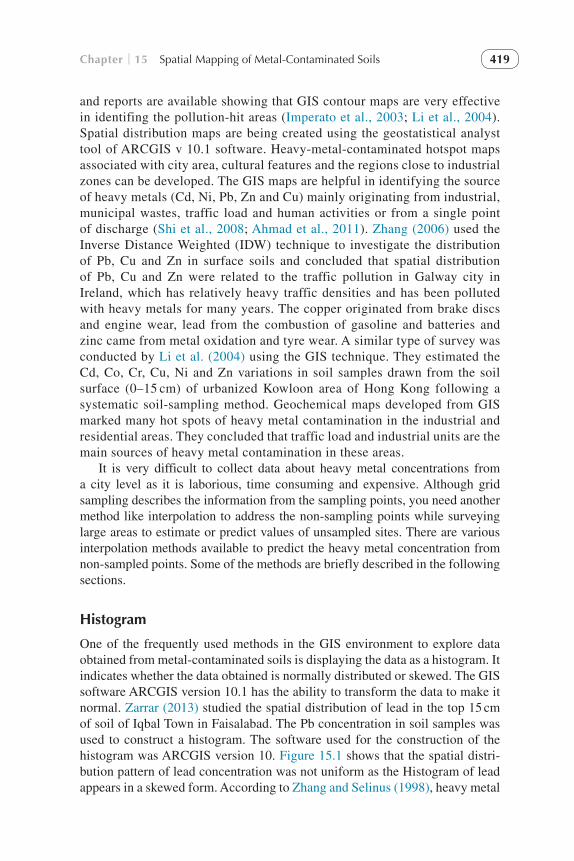
One of the frequently used methods in the GIS environment to explore data obtained from metal-contaminated soils is displaying the data as a histogram. It indicates whether the data obtained is normally distributed or skewed. The GIS software ARCGIS version 10.1 has the ability to transform the data to make it normal. Zarrar (2013) studied the spatial distribution of lead in the top 15 cm of soil of Iqbal Town in Faisalabad. The Pb concentration in soil samples was used to construct a histogram. The software used for the construction of the histogram was ARCGIS version 10. Figure 15.1 shows that the spatial distri-bution pattern of lead concentration was not uniform as the Histogram of lead appears in a skewed form. According to Zhang and Selinus (1998), heavy metal
420 Soil Remediation and Plants
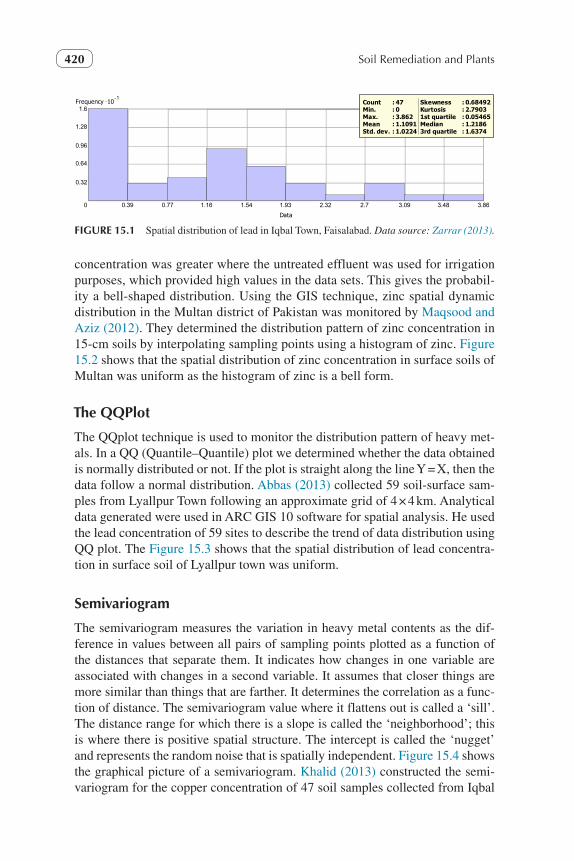
concentration was greater where the untreated effluent was used for irrigation purposes, which provided high values in the data sets. This gives the probabil-ity a bell-shaped distribution. Using the GIS technique, zinc spatial dynamic distribution in the Multan district of Pakistan was monitored by Maqsood and Aziz (2012). They determined the distribution pattern of zinc concentration in 15-cm soils by interpolating sampling points using a histogram of zinc. Figure 15.2 shows that the spatial distribution of zinc concentration in surface soils of Multan was uniform as the histogram of zinc is a bell form.
The QQPlot
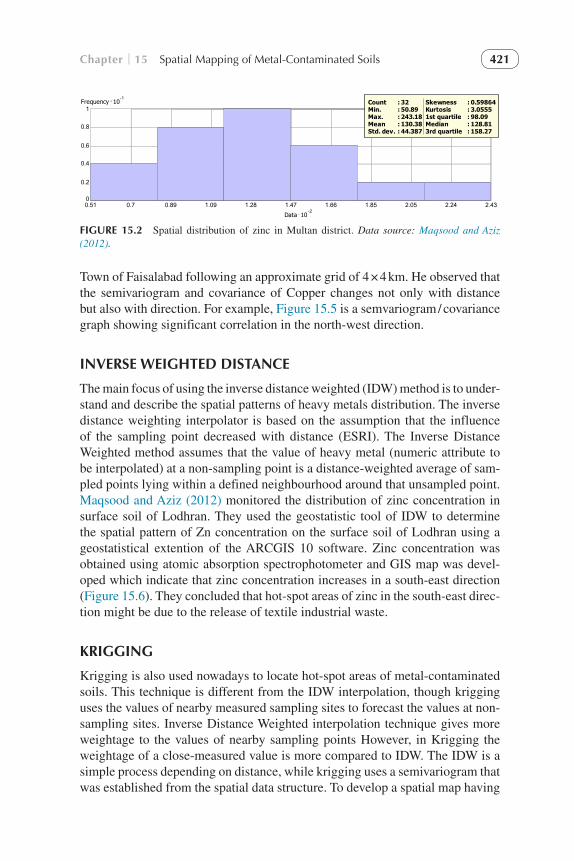
The QQplot technique is used to monitor the distribution pattern of heavy met-als. In a QQ (Quantile–Quantile) plot we determined whether the data obtained is normally distributed or not. If the plot is straight along the line Y = X, then the data follow a normal distribution. Abbas (2013) collected 59 soil-surface sam-ples from Lyallpur Town following an approximate grid of 4 × 4 km. Analytical data generated were used in ARC GIS 10 software for spatial analysis. He used the lead concentration of 59 sites to describe the trend of data distribution using QQ plot. The Figure 15.3 shows that the spatial distribution of lead concentra-tion in surface soil of Lyallpur town was uniform.
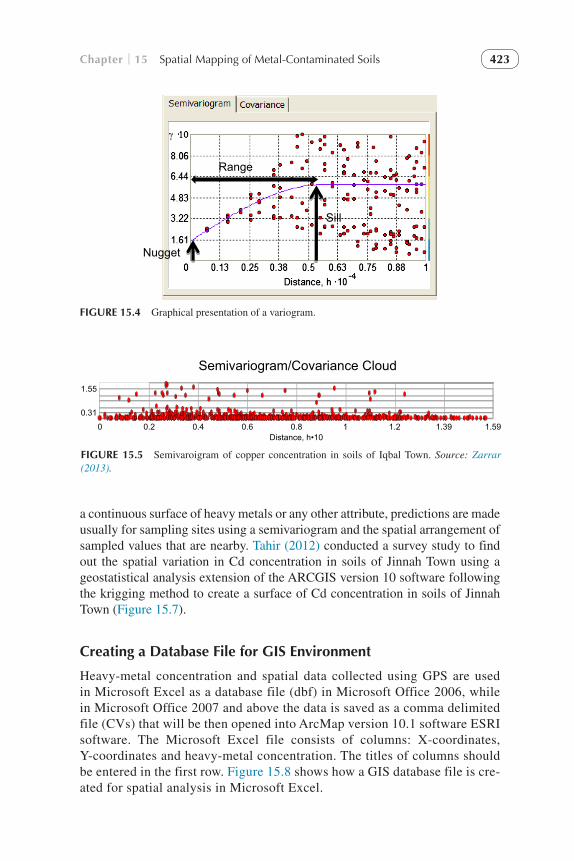
Semivariogram
The semivariogram measures the variation in heavy metal contents as the dif-ference in values between all pairs of sampling points plotted as a function of the distances that separate them. It indicates how changes in one variable are associated with changes in a second variable. It assumes that closer things are more similar than things that are farther. It determines the correlation as a func-tion of distance. The semivariogram value where it flattens out is called a ‘sill’. The distance range for which there is a slope is called the ‘neighborhood’; this is where there is positive spatial structure. The intercept is called the ‘nugget’ and represents the random noise that is spatially independent. Figure 15.4 shows the graphical picture of a semivariogram. Khalid (2013) constructed the semi-variogram for the copper concentration of 47 soil samples collected from Iqbal
Data
Frequency 10
0 0.39 0.77 1.16 1.54 1.93 2.32 2.7 3.09 3.48 3.86
0.32
0.64
0.96
1.28
1.6CountMin.Max.MeanStd. dev.
: 47 : 0 : 3.862 : 1.1091 : 1.0224
SkewnessKurtosis1st quartileMedian3rd quartile
: 0.68492 : 2.7903 : 0.05465 : 1.2186: 1.6374
FIGURE 15.1 Spatial distribution of lead in Iqbal Town, Faisalabad. Data source: Zarrar (2013).
421Chapter | 15 Spatial Mapping of Metal-Contaminated Soils
Town of Faisalabad following an approximate grid of 4 × 4 km. He observed that the semivariogram and covariance of Copper changes not only with distance but also with direction. For example, Figure 15.5 is a semvariogram / covariance graph showing significant correlation in the north-west direction.
INVERSE WEIGHTED DISTANCE
The main focus of using the inverse distance weighted (IDW) method is to under-stand and describe the spatial patterns of heavy metals distribution. The inverse distance weighting interpolator is based on the assumption that the influence of the sampling point decreased with distance (ESRI). The Inverse Distance Weighted method assumes that the value of heavy metal (numeric attribute to be interpolated) at a non-sampling point is a distance-weighted average of sam-pled points lying within a defined neighbourhood around that unsampled point. Maqsood and Aziz (2012) monitored the distribution of zinc concentration in surface soil of Lodhran. They used the geostatistic tool of IDW to determine the spatial pattern of Zn concentration on the surface soil of Lodhran using a geostatistical extention of the ARCGIS 10 software. Zinc concentration was obtained using atomic absorption spectrophotometer and GIS map was devel-oped which indicate that zinc concentration increases in a south-east direction (Figure 15.6). They concluded that hot-spot areas of zinc in the south-east direc-tion might be due to the release of textile industrial waste.
KRIGGING
Krigging is also used nowadays to locate hot-spot areas of metal-contaminated soils. This technique is different from the IDW interpolation, though krigging uses the values of nearby measured sampling sites to forecast the values at non- sampling sites. Inverse Distance Weighted interpolation technique gives more weightage to the values of nearby sampling points However, in Krigging the weightage of a close-measured value is more compared to IDW. The IDW is a simple process depending on distance, while krigging uses a semivariogram that was established from the spatial data structure. To develop a spatial map having
Data 10
Frequency 10
0.51 0.7 0.89 1.09 1.28 1.47 1.66 1.85 2.05 2.24 2.430
0.2
0.4
0.6
0.8
1CountMin.Max.MeanStd. dev.
: 32 : 50.89 : 243.18 : 130.38 : 44.387
SkewnessKurtosis1st quartileMedian3rd quartile
: 0.59864 : 3.0555 : 98.09 : 128.81: 158.27
FIGURE 15.2 Spatial distribution of zinc in Multan district. Data source: Maqsood and Aziz (2012).
422Soil R
emediation and Plants
9.43
7.59
5.76
3.92
2.08
0.24–2.38 –1.91 –1.43 –0.95 –0.48 0
Standard Normal Value
Data's quartile
0.48 0.95 1.43 1.91 2.38
FIGURE 15.3 Normal QQ Plot transformation of lead concentration in soils Lyallpur Town. Data source: Qamber (2013).
423Chapter | 15 Spatial Mapping of Metal-Contaminated Soils
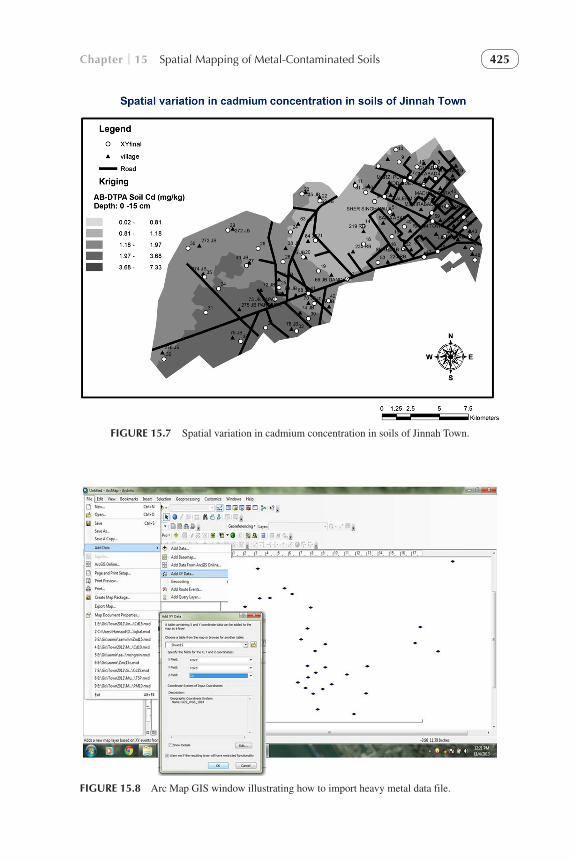
a continuous surface of heavy metals or any other attribute, predictions are made usually for sampling sites using a semivariogram and the spatial arrangement of sampled values that are nearby. Tahir (2012) conducted a survey study to find out the spatial variation in Cd concentration in soils of Jinnah Town using a geostatistical analysis extension of the ARCGIS version 10 software following the krigging method to create a surface of Cd concentration in soils of Jinnah Town (Figure 15.7).
Creating a Database File for GIS Environment
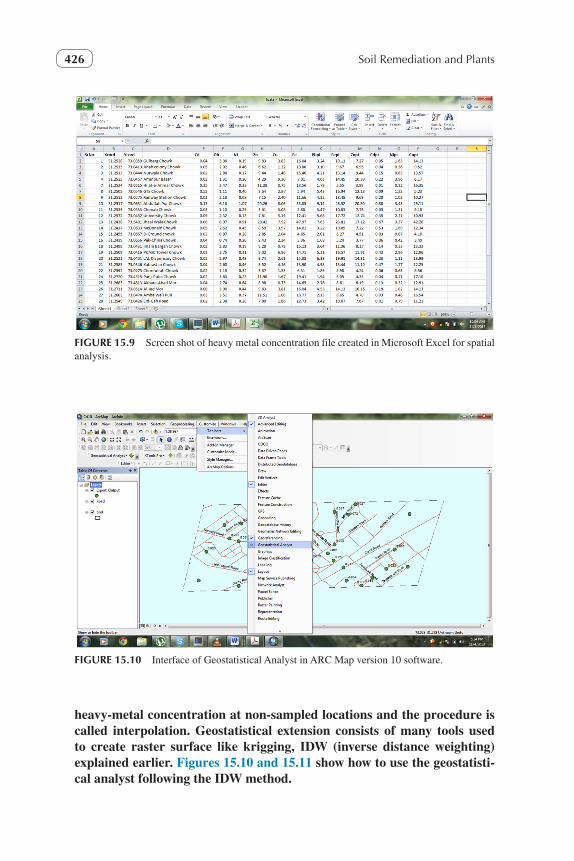
Heavy-metal concentration and spatial data collected using GPS are used in Microsoft Excel as a database file (dbf) in Microsoft Office 2006, while in Microsoft Office 2007 and above the data is saved as a comma delimited file (CVs) that will be then opened into ArcMap version 10.1 software ESRI software. The Microsoft Excel file consists of columns: X-coordinates, Y- coordinates and heavy-metal concentration. The titles of columns should be entered in the first row. Figure 15.8 shows how a GIS database file is cre-ated for spatial analysis in Microsoft Excel.
Distance, h•100.20 0.4 0.6 0.8 1 1.2 1.39 1.59
0.31
1.55
Semivariogram/Covariance Cloud
FIGURE 15.5 Semivaroigram of copper concentration in soils of Iqbal Town. Source: Zarrar (2013).
Sill
Nugget
Range
FIGURE 15.4 Graphical presentation of a variogram.
424 Soil Remediation and Plants
1. Importing database file l Open Arc GIS component Arc Map l Click file. In the Add data click add XY Data. window, choose l Choose database file having extension xls, cvs or dbf.The titles of first two columns of database file should be mentioned in X-Field and Y-Field as X- and Y-coordinates. l For the selection of coordinate system use Edit icon and select the
appropriate coordinate system for the database file, usually GIS ana-lyst, select the GCS-WGS-1984.Coordinate system.
l Then click OK (Figure 15.9). 2. Spatial analyses using Arc GIS geostatistical analyst extension l Open the ARC GIS component Arc map l On Arc Map toolbar click on customize then select Geostatistical exten-
stion. l Using this extension you will able to create a raster surface of a particular
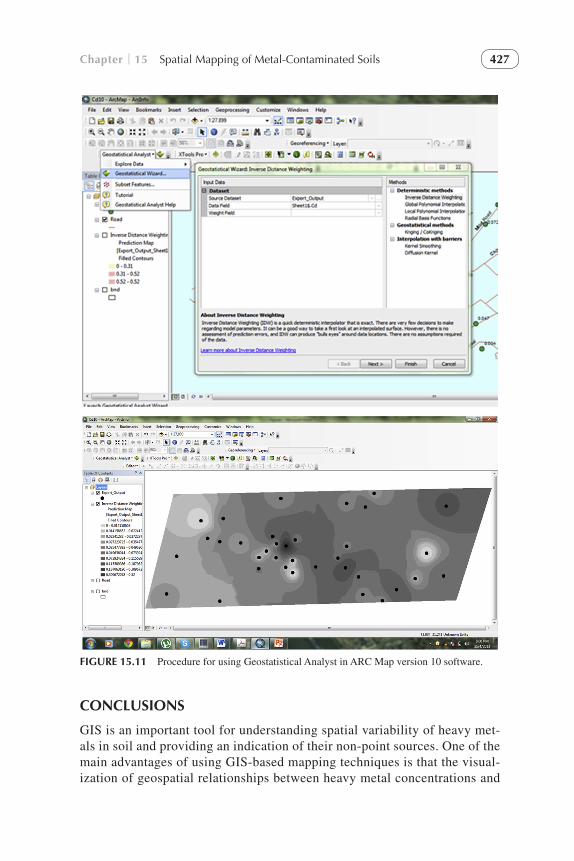
heavy metal in the ArcGIS environment (Figure 15.10) 3. Spatial InterpolationGeostatistical extension is commonly applied to create raster surfaces of heavy metal concentration. The raster surfaces consist of rows and col-umns called cells, and each cell has a particular concentration of heavy metal. Geostatistical extetion uses statistical methods to predict the
FIGURE 15.6 Spatial variation in zinc concentration in soils of Ladhran district.
425Chapter | 15 Spatial Mapping of Metal-Contaminated Soils
FIGURE 15.7 Spatial variation in cadmium concentration in soils of Jinnah Town.
FIGURE 15.8 Arc Map GIS window illustrating how to import heavy metal data file.
426 Soil Remediation and Plants
heavy-metal concentration at non-sampled locations and the procedure is called interpolation. Geostatistical extension consists of many tools used to create raster surface like krigging, IDW (inverse distance weighting) explained earlier. Figures 15.10 and 15.11 show how to use the geostatisti-cal analyst following the IDW method.
FIGURE 15.9 Screen shot of heavy metal concentration file created in Microsoft Excel for spatial analysis.
FIGURE 15.10 Interface of Geostatistical Analyst in ARC Map version 10 software.
427Chapter | 15 Spatial Mapping of Metal-Contaminated Soils
CONCLUSIONS
GIS is an important tool for understanding spatial variability of heavy met-als in soil and providing an indication of their non-point sources. One of the main advantages of using GIS-based mapping techniques is that the visual-ization of geospatial relationships between heavy metal concentrations and
FIGURE 15.11 Procedure for using Geostatistical Analyst in ARC Map version 10 software.
428 Soil Remediation and Plants
other earth features like roads, rails, canals, rivers, industries, etc., can be achieved which, in turn, spatially highlights the influence of human activi-ties on heavy metals contents. These techniques are very useful in specula-tion of the contamination of areas in future and their possible sources, and are being used by policy- making institutes and agencies to make necessary action plans.
REFERENCES
Abbas, Q., 2013. GIS based mapping on spatial variation of Pb, Ni and Cu in soil, water and plants in Jinnah and Iqbal towns of Faisalabad. M.Sc. Thesis, Inst. Soil Environ. Sci. Univ. Agri, Faisalabad, Pakistan.
Abrahams, P.W., 2002. Soils: Their implications to human health. Sci. Total Environ. 291, 1–32.
Acosta, J.A., Faz, A., Martínez-Martínez, S., Zornoza, R., Carmona, D.M., Kabas, S., 2011. Multi-variate statistical and GIS-based approach to evaluate heavy metals behavior in mine sites for future reclamation. J. Geochem. Expl. 109, 8–17.
Adriano, D.C., Wenzel, W.W., Vangronsveld, J., Bolan, N.S., 2004. Role of assisted natural reme-diation in environmental cleanup. Geoderma 122, 121–142.
Ahmad, H.R., Ghafoor, A., Corwin, D.L., Aziz, M.A., Saifullah, 2011. Amendments affect soil concentration and accumulation of cadmium and lead in wheat in calcareous alkaline soils. Commun. Soil Sci. Plant Anal., 42,111–122.
Amato, F., Nava, S., Lucarelli, F., Querol, X., Alastuey, A., Baldasano, J.M., Pandolfi, M., 2010. A comprehensive assessment of PM emissions from paved roads: Real world emission factors and intense street cleaning trials. Sci. Total Environ. 408, 4309–4318.
Anonymous, 2000. Definition of global positioning systems. In: The American Heritage Dictionary, Fourth edn. Houghton Mifflin, Houghton Mifflin Pub. Co, Boston, MA.
Artiola, J., Pepper, I.L., Brusseau, M.L., 2004. Environmental Monitoring and Characterization. Publisher: Elsevier Science & Technology Books, USA.
Chaoyang, W., Cheng, W., Linsheng, Y., 2009. Characterizing spatial distribution and sources of heavy metals in the soils from mining-smelting activities in Shuikoushan, Hunan Province, China. J. Environ. Sci. 21, 1230–1236.
Chen, T.B., Song, B., Zheng, Y.M., Huang, Z.C., Zheng, G.D., Lei, M., Chen, H., 2006. A survey of nickel concentrations in vegetables and vegetable soils of Beijing and their health risk. J. Nat. Resour. 21, 349–361.
Clevers, J., Kooistra, L., Salas, E.A.L., 2004. Study of heavy metal contamination in river floodplains using the red-edge position in spectroscopic data. Int. J. Remote Sens. 25, 3883–3895.
Collins, W., Chang, Raines, S.H., Canney, G.F., Ashley, R., 1983. Airborne biogeophysical mapping of hidden mineral-deposits. Econ. Geo. 78, 737–749.
Ghafoor, A., Rauf, A., Arif, M., Muzaffar, W., 1994. Chemical composition of effluents from differ-ent industries of the Faisalabad city. Pak. J. Agri. Sci. 33, 367–370.
Ghafoor, A., Qadir, M., Sadiq, M., Murtaza, G., Brar, M.S., 2004. Lead, copper, zinc and iron concentrations in soils and vegetables irrigated with city effluent on urban agricultural lands. J. Indian Soc. Soil Sci. 52, 114–117.
Gu, J.G., Lin, Q.Q., Hu, R., Zhuge, Y.P., Zhou, Q.X., 2005. Heavy metals pollution in soil–plant system and its research prospect. Chin. J. Soil Sci. 36, 128–133.
429Chapter | 15 Spatial Mapping of Metal-Contaminated Soils
Guan, Li., Cheng, C., 2008. Remote sensing mechanism model for heavy metal Cd pollu-tion in rice farm land based on hyperspectral data.Proc. SPIE 7145, Geoinformatics 2008 and Joint Conference on GIS and Built Environment: Monitoring and Assessment of Natural Resources and Environments. http://dx.doi.org/10.1117/12.813004. 71450R (November 03, 2008).
Henning, B.J., Snyman, H.G., Aveling, T.A.S., 2001. Plant soil interactions of sludge - borne heavy metals and the effect on maize (Zea mays L.) seedling growth. Water Soil Air 27, 71–78.
Hussain, S.I., 2000. Irrigation of crops with sewage effluent: Implication and movement of Pb and Cr as affected by soil texture, lime, gypsum and organic matter. Ph.D. Thesis, Dept. Soil Sci., Univ. Agric., Faisalabad, Pakistan.
Imperato, M., Adamo, P., Naimo, D., Arienzo, M., Stanzione, P., Violante, P., 2003. Spatial distribu-tion of heavy metals in urban soils of Naples city (Italy). Environ Pollut 124, 247–256.
Kabata-Pendias, A., 2004. Soil plant transfer of trace elements – an environmental issue. Geoderma 122, 143–149.
Kemper, T., Sommer, S., 2002. Estimate of heavy metal contamination in soils after a mining acci-dent using reflectance spectroscopy. Environ.Sci. Technol. 36, 2742–2747.
Khalid, M., 2013. Spatial variability of aerosols and metals concentration in soils, water and plants. M.Sc. Thesis, Inst. Soil. Environ. Sci., Univ. Agric., Faisalabad, Pakistan.
Lee, C.S.L., Li, X.D., Shi, W.Z., Cheung, S.C.N., Thornton, I., 2006. Metal contamination in urban, suburban and country park soils of Hong Kong: a study based on GIS and multivariate statistics. Sci. Total Environ 356, 45–61.
Lerner, K.L., Lerner, B.W., 2008. Environmental Science. Part 1 and 2. Gale. Cengage Learning, China. p. 341.
Li, J., Lu, Y., Yin, W., Gan, H., Zhang, C., Deng, X., Lian, J., 2009. Distribution of heavy metals in agricultural soils near petrochemical complex in Guangzhou, China. Environ. Monit. Assess. 153, 365–375.
Li, X., Lee, S.L., Wong, S.C., Shi, W., Thornton.I, 2004. The study of metal contamination in urban soils of Hong Kong using a GIS-based approach. Environ. Pollut. 129, 113–118.
Liu, M., Liu, X., Ding, W., Wu, L., 2011. Monitoring stress levels on rice with heavy metal pollu-tion from hyperspectral reflectance data using wavelet–fractal analysis. Int. J. Appl. Earth Obs.Geoinfor. 13, 246–255.
Maqsood, M.A., Aziz, T., 2012. Zinc biofortification in grain of wheat grown on Zn deficient soils of Punjab through framer friendly approaches. Ist. Proj. Report, HEC, Islamabad, Pakistan.
Murtaza, G., Ghafoor, A., Qadir, M., 2003. Accumulation and bioavailability of Cd, Co and Mn in soils and vegetables irrigated with city effluent. Pak. J. Agri. Sci. 40, 18–24.
NRCS, 2000. Heavy metal soil contamination. Urban Technical Note 3. SoilQuality Inst., Auburn, AL.Nriagu, J.O., 1990. Trace metal pollution of lakes: a global perspective. Proceeding of 2nd Interna-
tional Conference on Trace Metals in Aquatic Environment, Sydney, Australia.Papa, S., Bartoli, G., Pellegrino, A., Fioretto, A., 2010. Microbial activities and trace element con-
tents in an urban soil. Environ. Monit. Assess. 165, 193–203.Peris, M., Mic, O., Recatal, C., Anchez, L.S., Anchez, J., 2007. Heavy metal contents in horticul-
tural crops of a representative area of the European Mediterranean region. Sci. Total Environ. 378, 42–48.
Pruvot, C., Douay, F., Herve, F., Waterlot, C., 2006. Heavy metals in soil, crops and grass as a source of human exposure in the former mining areas. J. Soil Sediment 6, 215–220.
Qadir, M., Ghafoor, A., Murtaza.G, 1999. Irrigation with city effluent for growing vegetables: A silent epidemic of metal poisoning. Proc. Pak. Acad. Sci. 36, 217–222.
430 Soil Remediation and Plants
QuSheng, Li., Cai, S.C.M., Chu, B., Peng, L., Bing, F., Yang, 2010. Toxic effects of heavy metals and their accumulation in vegetables grown in a saline soil. Ecotox. Environ. Safe. 73, 84–88.
Romic, M., Romic, D., 2003. Heavy metals distribution in agricultural topsoils in urban area. Envi-ron. Geol. 43, 795–805.
Sabir, M., Ghafoor, A., Saifullah, Rehman, M.Z., Ahmad, H.R., Aziz, T., 2011. Growth and Metal Ionic Composition of Zea mays as Affected by nickel Supplementation in the Nutrient Solution. Int. J. Agro. Bio. 2, 186–190.
Shi, G., Chen, Z., Xu, S., Zhang, J., Wang, Li., Bi, C., Teng, J., 2008. Potentially toxic metal contamination of urban soils and roadside dust in Shanghai, China. Environ. Pollut. 156, 251–260.
Shukry, W.M., 2001. Effect of industrial effluents polluting the river Nile on growth, metabolism and productivity of Triticum aestivum and Vicia faba plants. Pak. J. Biol. Sci. 4, 1153–1159.
Singh, R., Singh, D.P., Kumar, N., Bhargava, S.K., Barman, S.C., 2010. Accumulation and translo-cation of heavy metals in soil and plants from fly ash contaminated area. J. Environ. Biol. 31, 421–430.
Sparks, D.L., 2005. Toxic metals in the environment: The role of surfaces. Element 1, 193–197.Sridhara, B.B.M., Vincenta, R., Robertsa, S.J., Czajkowsk, K., 2011. Remote sensing of soybean
stress as an indicator of chemical concentration of biosolid amended surface soils. Int. J. Appl. Earth Obs. Geoinfor. 13, 676–681.
Tahir, M.U., 2012. Spatial variations of particulate matter in air and metals in plant, soil and water of Lyallpur and Jinnah towns of Faisalabad and preparation of GIS based maps. M.Sc. Thesis, Inst. Soil Environ. Sci. Univ. Agri, Faisalabad, Pakistan.
Theiss, A., Yen, D.C., Ku.C.Y, 2005. Global Positioning Systems: An analysis of applications, cur-rent development and future implementations. Comput. Stand. Inter. 27, 89–100.
USEPA, 2010. Exposure pathways. Available at http://www.epa.gov/emergencies/content/hazsubs/pathways.htm (verified 30 Oct. 2013).
Weldegebriel, Y., Chandravanshi, B.S., Wondimu, T., 2012. Concentration levels of metals in veg-etables grown in soils irrigated with river water in Addis Ababa, Ethiopia. Ecot. Environ. Saf. 77, 57–63.
Wong, C.S.C., Li, X., Thornton, I., 2006. Review: Urban environmental geochemistry of trace met-als. Environ. Pollut. 142, 1–16.
Wu, L., Liu, X., Wang, P., Zhou, B., Liu, M., Li, X., 2013. The assimilation of spectral sensing and WOFOST model for the dynamic simulation of cadmium accumulation in rice tissue. Int. J. Appl. Earth Obs. Geoinform. 25, 66–75.
Wu, Y.Z., Chen, J., Ji, J.F., Tian, Q.J., Wu, X.M., 2005. Feasibility of reflectance spectroscopy for the assessment of soil mercury contamination. Environ. Sci. Technol. 39, 873–878.
Xia, X., Chen, X., Liu, R., Liu, H., 2011. Heavy metals in urban soils with various types of land use in Beijing, China. J. Hazard. Mater. 186, 2043–2050.
Zarrar, M.J., 2013. Bioassessment of heavy metal contamination in soil, plants and water of IQbal towns of Faisalabad and mapping through GIS. M.Sc. Thesis, Inst. Soil Environ. Sci. Univ. Agri, Faisalabad, Pakistan.
Zhang, C., 2006. Using multivariate analyses and GIS to identify pollutants and their spatial pat-terns in urban soils in Galway. Ireland. Environ. Pollut 142, 501–511.
Zhang, C., Selinus, O., 1998. Statistics and GIS in environmental geochemistry—some problems and solutions. J. Geochem. Expl 64, 339–354.
Zhang, J., Dai, J., Du, X., Li, F., Wang, W., Wang, R., 2012. Distribution and sources of petro-leum-hydrocarbon in soil profiles of the Hunpu wastewater-irrigated area, China’s northeast. Geoderma 173, 215–223.
431Chapter | 15 Spatial Mapping of Metal-Contaminated Soils
Zhang, J., H. L. Li., Chen, J., Wamg, M., Tao, R., Liu, D., 2013. Assessment of heavy metal con-tamination status in sediments and identification of pollution source in Daye Lake, Central China. Environ. Earth. Sci. http://dx.doi.org/10.1007/s12665-014-3047-6.
Zhao, L., Xu, Y., Hou, H., Shangguan, Y., Li, F., 2014. Source identification and health risk assess-ment of metals in urban soils around the Tanggu chemical industrial district, Tianjin, China. Sci. Total Environ. 469, 654–662.