soil potential ratings - home | nrcs · the soil survey report also contains interpretations or ......
TRANSCRIPT

Uni ted Sta tes Depar tment o f Agr icu l tu re
Natural Resources Conservation Service 344 Merrow Road, Suite A * Tolland, Connecticut 06084-3917 * (860) 871-4011 * www.ct.nrcs.usda.gov
STATE OF CONNECTICUT
February, 2009
Subsurface Sewage Disposal Systems for Single Family Residences
Soil Potential Ratings

0
TABLE OF CONTENTS Page INTRODUCTION ............................................................................................................... 1
PURPOSE ............................................................................................................................ 1
DEFINITION ...................................................................................................................... 1
SOIL POTENTIAL RATINGS ......................................................................................... 2
USE CONSTRAINTS ......................................................................................................... 2
PERFORMANCE STANDARD ........................................................................................ 2
RATING CLASSES ............................................................................................................ 3
EVALUATION CRITERIA .............................................................................................. 4
SOIL POTENTIAL RATINGS BY MAP UNIT .............................................................. 6
CORRECTIVE MEASURES ............................................................................................ 6
SOME SITE CONDITIONS AND DESIGN CONSIDERATIONS NOT REPRESENTED IN THE RATINGS ..................................................................... 7
REFERENCES .................................................................................................................. 37
TABLES TABLE 1 – Evaluation Factors ............................................................................................ 9
TABLE 2 – Corrective Measures for Slope ....................................................................... 10
TABLE 3 – Corrective Measures for Soil Percolation Rates ............................................. 11
TABLE 4 – Saturated Hydraulic Conductivity and Percolation Rate ................................ 12
TABLE 5 – Corrective Measures for Depth to Seasonal High Water Table ...................... 13
TABLE 6 – Corrective Measures for Flooding................................................................... 14
TABLE 7 – Corrective Measures for Depth to Bedrock..................................................... 15
TABLE 8 – Soil Potential Ratings Map Unit ..................................................................... 16
TABLE 9 – Map Units Grouped by Potential Rating ........................................................ 30 The U.S. Department of Agriculture (USDA) prohibits discrimination in all its programs and activities on the basis of race, color, national origin, age, disability, and where applicable, sex, marital status, familial status, parental status, religion, sexual orientation, genetic information, political beliefs, reprisal, or because all or a part of an individual's income is derived from any public assistance program. (Not all prohibited bases apply to all programs.) Persons with disabilities who require alternative means for communication of program information (Braille, large print, audiotape, etc.) should contact USDA's TARGET Center at (202) 720-2600 (voice and TDD). To file a complaint of discrimination write to USDA, Director, Office of Civil Rights, 1400 Independence Avenue, S.W., Washington, D.C. 20250-9410 or call (800) 795-3272 (voice) or (202) 720-6382 (TDD). USDA is an equal opportunity provider and employer.

1
Introduction
The Soil Survey of the State of Connecticut is a modern soil survey, unifying the separate eight county soil legends to a single statewide legend, incorporating current soil taxonomy and standards, addressing land use changes and urbanization, and compiled onto planimetric orthophoto base. The soil survey provides information on the location and characteristics of various kinds of soils within the state. The soil survey report also contains interpretations or ratings of the soils for various land uses. The interpretations are based on the soil properties that affect the intended use. These interpretations are dynamic. They must be periodically revised to reflect improved soils data, new technology and the needs of the soil survey report users.
Purpose
The purpose of this document is to update and expand the interpretations in the soil survey report for subsurface sewage disposal systems (SSDS). These updated interpretations are in the form of soil potentials, which are interpretive ratings that stress soil suitability. The soil potential ratings may be used to determine the relative suitability of soils when installing a SSDS as well as possible ways soil limitations may be overcome.* These soil potentials were developed for planning purposes and are not intended as recommendations for soil use. The information presented here will be useful to groups or individuals involved with urban development such as local officials, builders, engineers, sanitarians, realtors, homebuyers, and other decision makers. It may also be utilized by local, regional, and state planning and zoning agencies.
Definition Subsurface sewage disposal systems (SSDS) are systems consisting of a house sewer, a septic tank followed by a leaching system, any necessary pumps and siphons, and groundwater control system on which the operation of the leaching system is dependent. This interpretation focuses mainly on the septic tank leaching field and groundwater control system. ____________________ *The special requirements identified to overcome soil limitations are a guide to planning and are not to be applied at a specific location without on-site investigation for design and installation.

2
Soil Potential Ratings
Soil potential ratings are classes that indicate the relative quality of a soil for a particular use compared to other soils in a given area, in this case the state of Connecticut.
The rating criteria were developed by a committee of state and local sanitarians, engineers, and installers. The soils information was provided by the USDA Natural Resources Conservation Service (NRCS). Then the performance and site conditions for a typical system were defined (see Performance Standard). This provided a standard against which various combinations of soil properties for the soils within Connecticut could be compared.
The engineering and installation practices used to overcome various soil limitations were listed and their costs estimated. This information was used to identify limitations and costs associated with installing a SSDS on each of the soils in Connecticut. Soils with no or minor limitations for the installation of a SSDS were rated the highest. Conversely, soils requiring extensive site modification and design were rated the lowest. The ease of system installation, and hence cost, formed the basis of the rating scheme.
Use Constraints
In obtaining this data from NRCS, it is understood that you and/or your organization have the right to use them for any internal purpose. This data is not designed for use as a primary regulatory tool in permitting or citing decisions, but may be used as a reference source. This data is not suitable for site-specific studies or litigation. Inappropriate applications would include a regulatory or policy decision requiring on-site verification or prejudicial judgment based on the soil potential ratings information alone.
Performance Standard
The performance standard is composed of two parts. First, it identifies the capabilities of a typical SSDS. A typical system is assumed to be for a single family, 4-bedroom home on a 1-acre lot with a private well, or a ½-acre lot with public water supply. The system has a 1250 gallon septic tank and a 660 to 1000 square foot leaching field. Second, it addresses soil and landscape characteristics. This identifies the soil characteristics that are present in order for a typical system to be constructed.

3
The soil characteristics are:
1. Slope is less than 15 percent. 2. Soil percolation rate is 1 to 30 minutes per inch. 3. Depth to seasonal high water table is greater than 36 inches below the soil
surface. 4. Depth to bedrock is greater than 60 inches. 5. The soils do not flood.
Rating Classes
The rating class definitions refer to installing a SSDS that will meet state and local health code regulations. Soils with high potential have characteristics that meet the performance standard. A typical system can be installed at a cost of x. The cost of x represents the going rate for installing a SSDS. The actual value of x varies depending on many factors independent of soil properties. The cost of installing an leaching field is expressed as a multiple of x and is called the cost factor.** The cost factors of 3x and 3.5x mean that the estimated cost of a leaching field ranges from 3 to 3.5 times more than a field installed in a soil with high potential. These cost factors provide relative estimates of the costs in installing a SSDS. Soil potential ratings are listed in Tables 2 and 3. The soil potential ratings and associated cost factors, assuming a typical system, are defined below.
High Potential – These soils have the best combination of characteristics or may have limitations that can be easily overcome using standard installation practices. The cost factor is 1x to 2.0x.
Medium Potential – These soils have significant limitations, such as low
percolation rate, that are generally overcome using commonly applied designs. The cost factor ranges from 2.0x to 2.5x.
Low Potential – These soils have one or more limitations, such as low
percolation rate and depth to seasonal high water table, that require extensive design and site preparation to overcome. The cost factor ranges from 2.5x to 3.5x.
_______________________ **Cost factors are only a guide. Actual costs will vary both above and below the ranges given. Actual costs will be influenced by on-site features and other variables independent of soil properties.

4
Very Low Potential – These soils have to overcome major soil limitations, such as depth to bedrock, that require extensive design and site preparation. A permit for a SSDS may not be issued unless the naturally occurring soils meet the minimal requirements outlined in the state health code. It is unlikely these soils can be improved sufficiently to meet state health code regulations. The cost factor ranges from 4.25x to 6.0x.
Extremely Low These soils have multiple major limitations, such as Potential – flooding and depth to seasonal high water table,
which are extremely difficult to overcome. A permit for a SSDS may not be issued unless the naturally occurring soils meet the minimal requirements outlined in the state health code. It is unlikely these soils can be improved sufficiently to meet state health code regulations.
Not Rated – Areas labeled Not Rated have characteristics that
show extreme variability from one location to another. The work needed to overcome adverse soil properties cannot be estimated. Often these areas are urban land complexes or miscellaneous areas. An
on site investigation is required to determine soil conditions present at the site.
The estimated percent of land in the state of Connecticut that fit into each of the soil potential ratings is as follows:
High Potential 15.3%Medium Potential 12.4%Low Potential 30.7%Very Low Potential 7.2%Extremely Low Potential 13.7%Not Rated 20.7%
Evaluation Criteria
The evaluation criteria are soil properties that can significantly affect the cost of installing a SSDS. These soil properties correspond to criteria identified in the Connecticut State Health Code Regulations, as well as factors deemed significant by NRCS who developed these soil potential ratings. The evaluation criteria are listed in Table 1 and detailed in Tables 2 through 7.

5
The criteria listed in Table 1 are broken up into several ranges of values. These values are assigned classes. The values defining each rating class were chosen based on three considerations:
1. Is the data compatible with state health regulations? 2. Can the information be obtained from presently available soil survey data? 3. Do these values identify significant differences in the cost of installing a
SSDS that meets the performance standard? The five evaluation criteria are:
Percent Slope – Slope is the inclination of the land surface from the
horizontal. Percentage of slope is the vertical distance divided by the horizontal distance, multiplied by 100. Thus, a slope of 20 percent is a drop of 20 feet in 100 feet of horizontal distance.
Soil Percolation Rate – A percolation test is intended to measure the rate at and Saturated which the soil will absorb effluent. Measurements Hydraulic Conductivity are made in minutes per inch and called the
percolation rate. These rates are utilized by the CT Public Health Code. The percolation rate is not a measure of any one property of the soil. Instead, it is related to many factors including soil texture, kinds of clay minerals, bulk density, structure, size and configuration of pores, number and size of rock fragments, depth to water table, antecedent moisture conditions, chemical composition, etc.
Soil surveys generally measure saturated hydraulic
conductivity (Ksat) to convey the rate of water movement through the soil under (field) saturated conditions as the preferred parameter in the National Cooperative Soil Survey. Percolation rates have also been used to express water flow through soils, particularly for soil interpretations for septic drain fields. For this planning document, percolation rates were estimated for soil types based on saturated hydraulic conductivity values (Table 4). Although these two parameters are different, determined by different methods, and yield different results, they can be considered to be functionally equivalent for this application. Consequently, percolation rates may, with prudence, be used as a proxy for Ksat in this case.

6
Depth to Seasonal This is the depth from the soil surface to a zone of High Water Table saturation at the highest average level during the (SHWT) – wettest season. The depth to a water table is
determined primarily through the presence of rust-colored and/or gray soil redoximorphic features.
Flooding – Flooding is the temporary covering of the soil surface
by floodwater from streams overflowing their banks, inflow from high tides, or any other combination of sources. The frequency or how often, typically, that it floods is an estimate of the current condition, whether natural or human-influenced (such as dams or levees).
Depth to Bedrock – Depth to bedrock is the depth from the soil surface to
the contact with coherent (continuous) bedrock. Ledge rock is another term used for bedrock by the Connecticut Public Health Code.
Soil Potential Ratings by Map Unit
Connecticut’s statewide soil survey identifies and displays the dominant soils in the state. The symbols on the maps identify map units, each map unit representing a unique combination of soils. Areas within the same symbol have similar composition. The soils were mapped at a scale of 1:12000 with a minimum size delineation of approximately 3 acres. Maps enlarged from the soil survey report do not provide more detailed soils information. More detailed information can only be obtained through on-site investigations. The soil survey is not a replacement for on-site investigation. The survey identifies the probability of finding a particular soil or combination of soils. Table 8 assigns a potential rating to each map unit. The list of map units is in order by soil map unit symbol. The potential rating is based on the ease of installing a SSDS in the dominant soil(s) of the map unit. The majority of map units are composed of one dominant soil or of several soils with similar characteristics. A single potential rating is listed for each map unit. Other map units are composed of two kinds of contrasting soils. In these cases, an overall potential rating is listed for the map unit. The limiting soil characteristics for each map unit are identified in Table 8 under the column labeled Concerns. The table also identifies state regulations which may be applicable if particular soil features are present on the site. This information is located in the column labeled State Regs. The numbers in this column reference the footnotes provided at the end of the table.

7
Corrective Measures
Corrective measures are any design or construction practices that may be required on a site. The kinds of measures identified are dependent on the limiting soil characteristics and are commonly used solutions for dealing with those soil limitations. Some soil limitations have no practical corrective measure identified in the CT Public Health Code. Without an on-site investigation, it is impossible to predict exactly what improvements a site will need in order for the subsurface sewage disposal system to work. For this reason, the site improvements are divided into two categories:
Probable Corrective These are on-site improvements that are most likely Measures – to be needed on a site having a particular kind of soil. Possible Additional These improvements may be necessary on some sites. Corrective Measures – Whether they are needed depends on the degree of the
limiting soil and site characteristics.
The commonly applied corrective measures are identified in Tables 2, 3 and 5 through 7. In these tables, the column labeled Concerns identifies why corrective measures are needed on a site having the specified soil feature. The tables also identify the state regulations that may be applicable if a particular soil feature is present on a site. This information is located in the column labeled State Regs. The numbers in this column reference footnotes provided at the end of the each table. The column labeled Other Considerations lists the practices or site requirements that may be needed to construct a SSDS. These measures may be needed to allow for the installation of a system or to determine the most practical solution to a soil or site problem.
Some Site Conditions and Design Considerations Not Represented in the Ratings
The soil potential ratings for SSDS were determined based on the ease of overcoming the soil limitations listed in Table 1. In many cases, the ease of constructing a system and cost is determined by other factors that may be site specific or result from local town requirements. A partial list of these factors that may influence cost, but are not represented in the rating scheme, follows:
• Small areas of contrasting soils too small to delineate at the scale of the Soil
Survey of the State of Connecticut. • Boulders that cannot be moved by customary construction equipment. • Topographic configuration of the property.

8
• Fill needed to compensate for the volume of material lost through the removal of stones and boulders.
• Measuring depth to water table during the spring months. • Local health department practices. • Inland wetland setbacks. • Time needed for approvals from regulatory agencies. • Easements. • Access to site for testing, construction, and system maintenance. • Landscaping. • Maneuvering around site features to be preserved such as stonewalls and trees. • Tree and stump removal. • Hauling costs of fill and gravel. • Proximity of proposed leaching field to neighboring wells. • Time of year of construction. • Construction stakeout and supervision by an engineer or sanitarian.

9
Table 1
Evaluation Factors
Evaluation Criteria Not Limited Somewhat Limited Very Limited
Percent Slope < 15 15 to 25 >25 Soil Percolation Rate (minute/inch) 1 to 30 <1; 30 to 60 > 60
Depth to Seasonal High Water Table (inches) > 36 18 to 36 < 18
Flooding (frequency) none
very rare, rare, occasional, frequent, very frequent
Depth to Bedrock (inches) > 60 40 to 60 < 40

10
Table 2. Corrective Measures for Slope
Slope
Concerns
Probable Corrective Measures
StateRegs
Possible Additional Corrective Measures
Other Considerations
<15%
None
None
15-25%
Difficulty of installation (access, machinery, etc.) Breakout
Design and installation to accommodate for slope. Serial distribution of effluent through the use of high level overflow.
>25%
Difficulty of installation (access, machinery, etc.) Breakout
Design and installation to accommodate for slope. Serial distribution of effluent through the use of high-level overflow.
1
Select fill
Special construction equipment and/or construction methods.
Select fill means clean bank run sand, clean bank run sand and gravel, or approved manufactured fill having a gradation which conforms to the specifications stipulated in Section VIII A of the Technical Standards. Note: See Standard VIII A for manufactured fill approval requirements. Section I of the Connecticut Public Health Code – Regulations and Technical Standards for Subsurface Sewage Disposal Systems, Technical Standards (Pursuant to Section 19-13-B103). January 1, 2004.
1Identified as an area of special concern. Section 19-13-B103d (e) (1) of the Connecticut Public Health Code.

11
Table 3. Corrective Measures for Soil Percolation Rates
Soil Percolation
Rate
Concerns
Probable Corrective Measures
StateRegs
Possible Additional Corrective Measures
Other Considerations
<1 min/in (fast perc)
Inadequate effluent renovation due to fast movement through the soil.
Double horizontal separating distance between well and leach field.
1
Select fill
Hydraulic analysis or pollutant renovation analysis may be required.
1 to 30 min/in
None
3
30 to 60 min/in (slow perc)
Slow acceptance of effluent into the soil
Design leaching field to distribute effluent over a larger area. Curtain drain and drainage swale to divert surface and subsurface flows of water.
1,3
Need drainage outlet. Hydraulic analysis may be required.
>60 min/in (slow perc)
Slow acceptance of effluent into the soil.
Special design of larger leaching field. Curtain drain and drainage swale to divert surface and subsurface flows of water.
1, 2
Select fill Need drainage outlet.
Select fill means clean bank run sand, clean bank run sand and gravel, or approved manufactured fill having a gradation which conforms to the specifications stipulated in Section VIII A of the Technical Standards. Note: See Standard VIII A for manufactured fill approval requirements. Section I of the Connecticut Public Health Code – Regulations and Technical Standards for Subsurface Sewage Disposal Systems, Technical Standards (Pursuant to Section 19-13-B103). January 1, 2004.
1Identified as an area of special concern. Section 19-13-B103d (e) (1) of the Connecticut Public Health Code. 2No permit or approval shall be issued where there is an impervious soil or where there is less than 18 inches depth of suitable existing soil over impervious soil. An impervious soil has a minimum percolation rate slower than one inch in sixty minutes when the groundwater level is at least eighteen inches below the bottom of the percolation test hole. Section 19-13-B103e (a) (3) of the Connecticut Public Health Code. 3Identified as a suitable soil. A suitable soil means having a minimum percolation rate of one inch in one to sixty minutes when the groundwater level is at least eighteen inches below the bottom of the percolation test hole. Section 19-13-B103 b (h) if the Connecticut Public Health Code.

12
Table 4. Saturated Hydraulic Conductivity and Percolation Rate***
Saturated Hydraulic Conductivity (Ksat)
Percolation
Rate cm/day cm/hr µm/sec min/in >864.0 >36.00 >100.08 <1
50.0 to 864.0 2.08 to 36.00 5.79 to 100.08 5 25.0 to 50.0 1.04 to 2.08 2.90 to 5.79 10 17.4 to 25.0 0.73 to 1.04 2.02 to 2.90 15 15.9 to 17.4 0.66 to 0.73 1.84 to 2.02 20 14.6 to 15.9 0.61 to 0.66 1.69 to 1.84 25 13.3 to 14.6 0.55 to 0.61 1.54 to 1.69 30 12.0 to 13.3 0.50 to 0.55 1.39 to 1.54 35 11.0 to 12.0 0.46 to 0.50 1.27 to 1.39 40 10.0 to 11.0 0.42 to 0.46 1.16 to 1.27 45
9.1 to 10.0 0.38 to 0.42 1.05 to 1.16 50 8.3 to 9.1 0.35 to 0.38 0.96 to 1.05 55
<8.3 <0.35 <0.96 >60
***Adapted from the State of Virginia, Virginia Department of Health, September 20, 2001, Footprint Committee Meeting. See references at the end of this document.

13
Table 5. Corrective Measures for Depth to Seasonal High Water Table
Soil Depth To SHWT
Concerns
Probable Corrective Measures
StateRegs
Possible Additional Corrective Measures
Other Considerations
>36 inches
None
None
Curtain drain or shallow trenches may be needed when the water table is near the 3-foot depth.
18 to 36 inches
Groundwater interference with effluent dispersal.
Curtain drain and drainage swale to divert surface and subsurface flows of water, and/or 0-3 feet of select fill.
1
Need drainage outlet. Hydraulic analysis may be required.
<18 inches
Groundwater interference with effluent dispersal.
Curtain drain and drainage swale to divert surface and subsurface flows of water, and/or 3-5 feet of select fill.
1, 4, 5
Need drainage outlet. Hydraulic analysis may be required.
Select fill means clean bank run sand, clean bank run sand and gravel, or approved manufactured fill having a
gradation which conforms to the specifications stipulated in Section VIII A of the Technical Standards. Note: See Standard VIII A for manufactured fill approval requirements. Section I of the Connecticut Public Health Code – Regulations and Technical Standards for Subsurface Sewage Disposal Systems, Technical Standards (Pursuant to Section 19-13-B103). January 1, 2004.
1Identified as an area of special concern. Section 19-13-B103d (e) (1) of the Connecticut Public Health Code. 4No permit or approval shall be issued where the ground water level is less than 18 inches below the surface of the ground for a duration of one month or longer during the wettest season of the year. Section 19-13-B103e (a) (3) of the Connecticut Public Health Code. 5 Identified as an area of special concern. Designated as wetland under the provisions of Sections 22a-36 through 22a-45 of the Connecticut General Statutes, as amended. Section 19-13-B103d (e) (1) (G) of the Connecticut Public Health Code.

14
Table 6. Corrective Measures for Flooding
Soil Flooding Frequency
Concerns
Probable Corrective Measures
StateRegs
Possible Additional Corrective Measures
Other Considerations
None
None
None
Very Rare, Rare Occasional Frequent Very frequent
System backup. Erosion of raised system.
Maintain separating distance to areas of concentrated flow.
1, 5
The very rare class floods more than or equal to 1 time in 500 years, but less than 1 time in 100 years.
The rare class floods 1 to 5 times in 100 years. The occasional class floods 5 to 50 times in 100 years. The frequent class floods more than 50 times in 100 years. The very frequent class floods more than 50 percent of all months in a year 1Identified as an area of special concern. Section 19-13-B103d (e) (1) of the Connecticut Public Health Code. 5 Identified as an area of special concern. Designated as wetland under the provisions of Sections 22a-36 through 22a-45 of the Connecticut General Statutes, as amended. Section 19-13-B103d (e) (1) (G) of the Connecticut Public Health Code.

15
Table 7. Corrective Measures for Depth to Bedrock
Soil Depth to Bedrock
Concerns
Probable Corrective Measures
StateRegs
Possible Additional Corrective Measures
Other Considerations
>60 inches
None
None
40 to 60 inches
Insufficient soil depth for effluent renovation.
1 to 3 feet of select fill.
1, 6
<40 inches
Insufficient soil depth for effluent renovation. Possible groundwater pollution.
3 to 5 feet of select fill.
1, 6
Select fill means clean bank run sand, clean bank run sand and gravel, or approved manufactured fill having a gradation which conforms to the specifications stipulated in Section VIII A of the Technical Standards. Note: See Standard VIII A for manufactured fill approval requirements. Section I of the Connecticut Public Health Code – Regulations and Technical Standards for Subsurface Sewage Disposal Systems, Technical Standards (Pursuant to Section 19-13-B103). January 1, 2004.
1Identified as an area of special concern. Section 19-13-B103d (e) (1) of the Connecticut Public Health Code.
6No permit or approval shall be issued where there is less than four feet depth of suitable existing soil over ledge rock, two feet of which is naturally occurring soil. Section 19-13-B103e (a) (3) of the Connecticut Public Health Code.

16
Table 8. Soil Potential Ratings for
Subsurface Sewage Disposal System by Map Unit
Map Symbol
Map Unit Name
Potential Rating Concerns State
Regs.
2 Ridgebury fine sandy loam Extremely low potential
Depth to SHWT, low percolation rate 1,2,4,5
3 Ridgebury, Leicester, and Whitman soils, extremely stony
Extremely low potential
Depth to SHWT, low percolation rate 1,2,4,5
4 Leicester fine sandy loam Extremely low potential Depth to SHWT 1,4,5
5 Wilbraham silt loam Extremely low potential
Depth to SHWT, low percolation rate 1,2,4,5
6 Wilbraham and Menlo soils, extremely stony Extremely low potential
Depth to SHWT, low percolation rate 1,2,4,5
7 Mudgepond silt loam Extremely low potential Depth to SHWT 1,4,5
8 Mudgepond and Alden soils, extremely stony Extremely low potential
Depth to SHWT, low percolation rate 1,2,4,5
9 Scitico, Shaker, and Maybid soils Extremely low potential
Depth to SHWT, low percolation rate 1,2,4,5
10 Raynham silt loam Extremely low potential
Depth to SHWT, low percolation rate 1,2,4,5
12 Raypol silt loam Extremely low potential
Depth to SHWT, high percolation rate
1,4,5
13 Walpole sandy loam Extremely low potential
Depth to SHWT, high percolation rate
1,4,5
14 Fredon silt loam Extremely low potential Depth to SHWT 1,4,5
15 Scarboro muck Extremely low potential
Depth to SHWT, high percolation rate
1,4,5
16 Halsey silt loam Extremely low potential Depth to SHWT 1,4,5
17 Timakwa and Natchaug soils Extremely low potential
Depth to SHWT, high percolation rate
1,4,5
18 Catden and Freetown soils Extremely low potential Depth to SHWT 1,4,5
20A Ellington silt loam, 0 to 5 percent slopes Low potential Depth to SHWT 1
21A Ninigret and Tisbury soils, 0 to 5 percent slopes Low potential Depth to SHWT 1

17
Map
Symbol Map Unit
Name Potential
Rating Concerns State Regs.
22A Hero gravelly loam, 0 to 3 percent slopes Low potential Depth to SHWT 1
22B Hero gravelly loam, 3 to 8 percent slopes Low potential Depth to SHWT 1
23A Sudbury sandy loam, 0 to 5 percent slopes Low potential Depth to SHWT 1
24A Deerfield loamy fine sand, 0 to 3 percent slopes Low potential Depth to SHWT, high percolation rate
1
25A Brancroft silt loam, 0 to 3 percent slopes Low potential Depth to SHWT, low percolation rate 1,2
25B Brancroft silt loam, 3 to 8 percent slopes Low potential Depth to SHWT, low percolation rate 1,2
25C Brancroft silt loam, 8 to 15 percent slopes Low potential Depth to SHWT, low percolation rate 1,2
26A Berlin silt loam, 0 to 3 percent slopes Low potential Depth to SHWT, low percolation rate 1,2
26B Berlin silt loam, 3 to 8 percent slopes Low potential Depth to SHWT, low percolation rate 1,2
27A Belgrade silt loam, 0 to 5 percent slopes Low potential Depth to SHWT, low percolation rate 1,2
28A Elmridge fine sandy loam, 0 to 3 percent slopes Low potential Depth to SHWT, low percolation rate 1,2
28B Elmridge fine sandy loam, 3 to 8 percent slopes Low potential Depth to SHWT, low percolation rate 1,2
29A Agawam fine sandy loam, 0 to 3 percent slopes High potential None
29B Agawam fine sandy loam, 3 to 8 percent slopes High potential None
29C Agawam fine sandy loam, 8 to 15 percent slopes High potential None
30A Branford silt loam, 0 to 3 percent slopes High potential None
30B Branford silt loam, 3 to 8 percent slopes High potential None
30C Branford silt loam, 8 to 15 percent slopes High potential None
31A Copake fine sandy loam, 0 to 3 percent slopes Low potential High percolation rate 1
31B Copake fine sandy loam, 3 to 8 percent slopes Low potential High percolation rate 1
31C Copake gravelly loam, 8 to 15 percent slopes Low potential High percolation rate 1
32A Haven and Enfield soils, 0 to 3 percent slopes High potential None
32B Haven and Enfield soils, 3 to 8 percent slopes High potential None

18
Map Symbol
Map Unit Name
Potential Rating Concerns State
Regs. 32C Haven and Enfield soils, 8 to 15 percent slopes High potential None
33A Hartford sandy loam, 0 to 3 percent slopes High potential None
33B Hartford sandy loam, 3 to 8 percent slopes High potential None
34A Merrimac sandy loam, 0 to 3 percent slopes High potential None
34B Merrimac sandy loam, 3 to 8 percent slopes High potential None
34C Merrimac sandy loam, 8 to 15 percent slopes High potential None
35A Penwood loamy sand, 0 to 3 percent slopes Low potential High percolation rate 1
35B Penwood loamy sand, 3 to 8 percent slopes Low potential High percolation rate 1
36A Windsor loamy sand, 0 to 3 percent slopes Low potential High percolation rate 1
36B Windsor loamy sand, 3 to 8 percent slopes Low potential High percolation rate 1
36C Windsor loamy sand, 8 to 15 percent slopes Low potential High percolation rate 1
37A Manchester gravelly sandy loam, 0 to 3 percent slopes Low potential High percolation
rate 1
37C Manchester gravelly sandy loam, 3 to 15 percent slopes Low potential High percolation
rate 1
37E Manchester gravelly sandy loam, 15 to 45 percent slopes Low potential High percolation
rate, slope 1
38A Hinckley gravelly sandy loam, 0 to 3 percent slopes Low potential High percolation
rate 1
38C Hinckley gravelly sandy loam, 3 to 15 percent slopes Low potential High percolation
rate 1
38E Hinckley gravelly sandy loam, 15 to 45 percent slopes Low potential High percolation
rate, slope 1
39A Groton gravelly sandy loam, 0 to 3 percent slopes Low potential High percolation rate 1
39C Groton gravelly sandy loam, 3 to 15 percent slopes Low potential High percolation
rate 1
39E Groton gravelly sandy loam, 15 to 45 percent slopes Low potential High percolation
rate, slopes 1
40A Ludlow silt loam, 0 to 3 percent slopes Low potential Depth to SHWT, low percolation rate 1,2
40B Ludlow silt loam, 3 to 8 percent slopes Low potential Depth to SHWT, low percolation rate 1,2
41B Ludlow silt loam, 2 to 8 percent slopes, very stony Low potential Depth to SHWT, low
percolation rate 1,2
42C Ludlow silt loam, 2 to 15 percent slopes, extremely stony Low potential Depth to SHWT, low
percolation rate 1,2
43A Rainbow silt loam, 0 to 3 percent slopes Low potential Depth to SHWT, low percolation rate 1,2
43B Rainbow silt loam, 3 to 8 percent slopes Low potential Depth to SHWT, low percolation rate 1,2
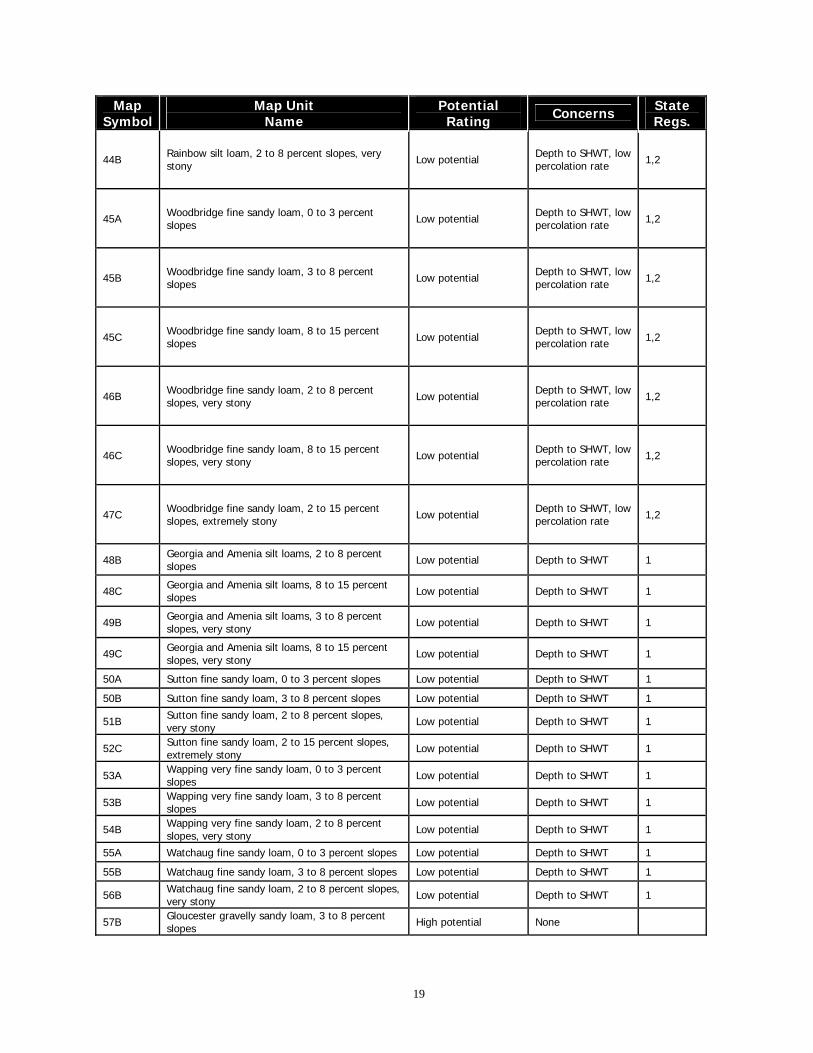
19
Map Symbol
Map Unit Name
Potential Rating Concerns State
Regs.
44B Rainbow silt loam, 2 to 8 percent slopes, very stony Low potential Depth to SHWT, low
percolation rate 1,2
45A Woodbridge fine sandy loam, 0 to 3 percent slopes Low potential Depth to SHWT, low
percolation rate 1,2
45B Woodbridge fine sandy loam, 3 to 8 percent slopes Low potential Depth to SHWT, low
percolation rate 1,2
45C Woodbridge fine sandy loam, 8 to 15 percent slopes Low potential Depth to SHWT, low
percolation rate 1,2
46B Woodbridge fine sandy loam, 2 to 8 percent slopes, very stony Low potential Depth to SHWT, low
percolation rate 1,2
46C Woodbridge fine sandy loam, 8 to 15 percent slopes, very stony Low potential Depth to SHWT, low
percolation rate 1,2
47C Woodbridge fine sandy loam, 2 to 15 percent slopes, extremely stony Low potential Depth to SHWT, low
percolation rate 1,2
48B Georgia and Amenia silt loams, 2 to 8 percent slopes Low potential Depth to SHWT 1
48C Georgia and Amenia silt loams, 8 to 15 percent slopes Low potential Depth to SHWT 1
49B Georgia and Amenia silt loams, 3 to 8 percent slopes, very stony Low potential Depth to SHWT 1
49C Georgia and Amenia silt loams, 8 to 15 percent slopes, very stony Low potential Depth to SHWT 1
50A Sutton fine sandy loam, 0 to 3 percent slopes Low potential Depth to SHWT 1
50B Sutton fine sandy loam, 3 to 8 percent slopes Low potential Depth to SHWT 1
51B Sutton fine sandy loam, 2 to 8 percent slopes, very stony Low potential Depth to SHWT 1
52C Sutton fine sandy loam, 2 to 15 percent slopes, extremely stony Low potential Depth to SHWT 1
53A Wapping very fine sandy loam, 0 to 3 percent slopes Low potential Depth to SHWT 1
53B Wapping very fine sandy loam, 3 to 8 percent slopes Low potential Depth to SHWT 1
54B Wapping very fine sandy loam, 2 to 8 percent slopes, very stony Low potential Depth to SHWT 1
55A Watchaug fine sandy loam, 0 to 3 percent slopes Low potential Depth to SHWT 1
55B Watchaug fine sandy loam, 3 to 8 percent slopes Low potential Depth to SHWT 1
56B Watchaug fine sandy loam, 2 to 8 percent slopes, very stony Low potential Depth to SHWT 1
57B Gloucester gravelly sandy loam, 3 to 8 percent slopes High potential None

20
Map
Symbol Map Unit
Name Potential
Rating Concerns State Regs.
57C Gloucester gravelly sandy loam, 8 to 15 percent slopes High potential None
57D Gloucester gravelly sandy loam, 15 to 25 percent slopes High potential Slope
58B Gloucester gravelly sandy loam, 3 to 8 percent slopes, very stony High potential None
58C Gloucester gravelly sandy loam, 8 to 15 percent slopes, very stony High potential None
59C Gloucester gravelly sandy loam, 3 to 15 percent slopes, extremely stony High potential None
59D Gloucester gravelly sandy loam, 15 to 35 percent slopes, extremely stony Medium potential Slope 1
60B Canton and Charlton soils, 3 to 8 percent slopes High potential None
60C Canton and Charlton soils, 8 to 15 percent slopes High potential None
60D Canton and Charlton soils, 15 to 25 percent slopes High potential Slope
61B Canton and Charlton soils, 3 to 8 percent slopes, very stony High potential None
61C Canton and Charlton soils, 8 to 15 percent slopes, very stony High potential None
62C Canton and Charlton soils, 3 to 15 percent slopes, extremely stony High potential None
62D Canton and Charlton soils, 15 to 35 percent slopes, extremely stony Medium potential Slope 1
63B Cheshire fine sandy loam, 3 to 8 percent slopes High potential None
63C Cheshire fine sandy loam, 8 to 15 percent slopes High potential None
63D Cheshire fine sandy loam, 15 to 25 percent slopes High potential Slope
64B Cheshire fine sandy loam, 3 to 8 percent slopes, very stony High potential None
64C Cheshire fine sandy loam, 8 to 15 percent slopes, very stony High potential None
65C Cheshire fine sandy loam, 3 to 15 percent slopes, extremely stony High potential None
65D Cheshire fine sandy loam, 15 to 35 percent slopes, extremely stony Medium potential Slope 1
66B Narragansett silt loam, 2 to 8 percent slopes High potential None
66C Narragansett silt loam, 8 to 15 percent slopes High potential None
67B Narragansett silt loam, 3 to 8 percent slopes, very stony High potential None
67C Narragansett silt loam, 8 to 15 percent slopes, very stony High potential None
68C Narragansett silt loam, 3 to 15 percent slopes, extremely stony High potential None
68D Narragansett silt loam, 15 to 25 percent slopes, extremely stony High potential Slope
69B Yalesville fine sandy loam, 3 to 8 percent slopes Very low potential Depth to bedrock 1,6
69C Yalesville fine sandy loam, 8 to 15 percent slopes Very low potential Depth to bedrock 1,6

21
Map
Symbol Map Unit
Name Potential
Rating Concerns State Regs.
70C Branford-Holyoke complex, 3 to 15 percent slopes, very rocky Low potential Depth to bedrock 1,6
71C Brookfield-Brimfield-rock outcrop complex, 3 to 15 percent slopes Low potential Depth to bedrock 1,6
71E Brookfield-Brimfield-rock outcrop complex, 15 to 45 percent slopes Low potential Depth to bedrock,
slope 1,6
73C Charlton-Chatfield complex, 3 to 15 percent slopes, very rocky Low potential Depth to bedrock 1,6
73E Charlton-Chatfield complex, 15 to 45 percent slopes, very rocky Low potential Depth to bedrock,
slope 1,6
74C Narragansett-Hollis complex, 3 to 15 percent slopes, very rocky Low potential Depth to bedrock 1,6
75C Hollis-Chatfield-rock outcrop complex, 3 to 15 percent slopes Very low potential Depth to bedrock 1,6
75E Hollis-Chatfield-rock outcrop complex, 15 to 45 percent slopes Very low potential Depth to bedrock,
slope 1,6
76E Rock outcrop-Hollis complex, 3 to 45 percent slopes
Extremely low potential
Depth to bedrock, slope 1,6
76F Rock outcrop-Hollis complex, 45 to 60 percent slopes
Extremely low potential
Depth to bedrock, slope 1,6
77C Cheshire-Holyoke complex, 3 to 15 percent slopes, very rocky Low potential Depth to bedrock 1,6
77D Cheshire-Holyoke complex, 15 to 35 percent slopes, very rocky Low potential Depth to bedrock,
slope 1,6
78C Holyoke-rock outcrop complex, 3 to 15 percent slopes Very low potential Depth to bedrock 1,6
78E Holyoke-rock outcrop complex, 15 to 45 percent slopes Very low potential Depth to bedrock,
slope 1,6
79E Rock outcrop-Holyoke complex, 3 to 45 percent slopes
Extremely low potential
Depth to bedrock, slope 1,6
80B Bernardston silt loam, 3 to 8 percent slopes Medium potential Low percolation rate 1,2
80C Bernardston silt loam, 8 to 15 percent slopes Medium potential Low percolation rate 1,2
81C Bernardston silt loam, 3 to 15 percent slopes, extremely stony Medium potential Low percolation
rate 1,2
81D Bernardston silt loam, 15 to 25 percent slopes, extremely stony Medium potential Low percolation
rate, slope 1,2
82B Broadbrook silt loam, 3 to 8 percent slopes Medium potential Low percolation rate 1,2
82C Broadbrook silt loam, 8 to 15 percent slopes Medium potential Low percolation rate 1,2
82D Broadbrook silt loam, 15 to 25 percent slopes Medium potential Low percolation rate, slope 1,2
83B Broadbrook silt loam, 3 to 8 percent slopes, very stony Medium potential Low percolation
rate 1,2

22
Map
Symbol Map Unit
Name Potential
Rating Concerns State Regs.
83C Broadbrook silt loam, 8 to 15 percent slopes, very stony Medium potential Low percolation
rate 1,2
84B Paxton and Montauk fine sandy loams, 3 to 8 percent slopes Medium potential Low percolation
rate 1,2
84C Paxton and Montauk fine sandy loams, 8 to 15 percent slopes Medium potential Low percolation
rate 1,2
84D Paxton and Montauk fine sandy loams, 15 to 25 percent slopes Medium potential Low percolation
rate, slope 1,2
85B Paxton and Montauk fine sandy loams, 3 to 8 percent slopes, very stony Medium potential Low percolation
rate 1,2
85C Paxton and Montauk fine sandy loams, 8 to 15 percent slopes, very stony Medium potential Low percolation
rate 1,2
86C Paxton and Montauk fine sandy loams, 3 to 15 percent slopes, extremely stony Medium potential Low percolation
rate 1,2
86D Paxton and Montauk fine sandy loams, 15 to 35 percent slopes, extremely stony Medium potential Low percolation
rate, slope 1,2
87B Wethersfield loam, 3 to 8 percent slopes Medium potential Low percolation rate 1,2
87C Wethersfield loam, 8 to 15 percent slopes Medium potential Low percolation rate 1,2
87D Wethersfield loam, 15 to 25 percent slopes Medium potential Low percolation rate, slope 1,2
88B Wethersfield loam, 3 to 8 percent slopes, very stony Medium potential Low percolation
rate 1,2
88C Wethersfield loam, 8 to 15 percent slopes, very stony Medium potential Low percolation
rate 1,2
89C Wethersfield loam, 3 to 15 percent slopes, extremely stony Medium potential Low percolation
rate 1,2
89D Wethersfield loam, 15 to 35 percent slopes, extremely stony Medium potential Low percolation
rate, slope 1,2
90B Stockbridge loam, 3 to 8 percent slopes Medium potential Low percolation rate 1,2
90C Stockbridge loam, 8 to 15 percent slopes Medium potential Low percolation rate 1,2

23
Map Symbol
Map Unit Name
Potential Rating Concerns State
Regs. 90D Stockbridge loam, 15 to 25 percent slopes Medium potential Low percolation
rate, slope 1,2
91B Stockbridge loam, 3 to 8 percent slopes, very stony Medium potential Low percolation
rate 1,2
91C Stockbridge loam, 8 to 15 percent slopes, very stony Medium potential Low percolation
rate 1,2
91D Stockbridge loam, 15 to 35 percent slopes, very stony Medium potential Low percolation
rate, slope 1,2
92B Nellis fine sandy loam, 3 to 8 percent slopes High potential None
92C Nellis fine sandy loam, 8 to 15 percent slopes High potential None
92D Nellis fine sandy loam, 15 to 25 percent slopes High potential Slope
93C Nellis fine sandy loam, 3 to 15 percent slopes, very stony High potential None
94C Farmington-Nellis complex, 3 to 15 percent slopes, very rocky Low potential Depth to bedrock 1,6
94E Farmington-Nellis complex, 15 to 35 percent slopes, very rocky Low potential Depth to bedrock,
slope 1,6
95C Farmington-rock outcrop complex, 3 to 15 percent slopes Very low potential Depth to bedrock 1,6
95E Farmington-rock outcrop complex, 15 to 45 percent slopes Very low potential Depth to bedrock,
slope 1,6
96 Ipswich mucky peat Extremely low potential
Flooding, depth to SHWT 1,4,5
97 Pawcatuck mucky peat Extremely low potential
Flooding, depth to SHWT 1,4,5
98 Westbrook mucky peat Extremely low potential
Flooding, depth to SHWT 1,4,5
99 Westbrook mucky peat, low salt Extremely low potential
Flooding, depth to SHWT 1,4,5
100 Suncook loamy fine sand Extremely low potential
Flooding, high percolation rate 1,5
101 Occum fine sandy loam Extremely low potential
Flooding, high percolation rate 1,5
102 Pootatuck fine sandy loam Extremely low potential
Flooding, high percolation rate 1,5
103 Rippowam fine sandy loam Extremely low potential
Flooding, high percolation rate, depth to SHWT
1,4,5
104 Bash silt loam Extremely low potential Flooding 1,5
105 Hadley silt loam Extremely low potential Flooding 1,5
106 Winooski silt loam Extremely low potential Flooding 1,5
107 Limerick and Lim soils Extremely low potential
Flooding, high percolation rate, depth to SHWT
1,4,5

24
Map Symbol
Map Unit Name
Potential Rating Concerns State
Regs.
108 Saco silt loam Extremely low potential
Flooding, depth to SHWT 1,4,5
109 Fluvaquents-Udifluvents complex, frequently flooded
Extremely low potential
Flooding, high percolation rate, depth to SHWT
1,4,5
221A Ninigret-Urban land complex, 0 to 5 percent slopes Not Rated
224A Deerfield-Urban land complex, 0 to 3 percent slopes Not Rated
225B Brancroft-Urban land complex, 0 to 8 percent slopes Not Rated
226B Berlin-Urban land complex, 0 to 8 percent slopes Not Rated
228B Elmridge-Urban land complex, 0 to 8 percent slopes Not Rated
229B Agawam-Urban land complex, 0 to 8 percent slopes Not Rated
229C Agawam-Urban land complex, 8 to 15 percent slopes Not Rated
230B Branford-Urban land complex, 0 to 8 percent slopes Not Rated
230C Branford-Urban land complex, 8 to 15 percent slopes Not Rated
232B Haven-Urban land complex, 0 to 8 percent slopes Not Rated
234B Merrimac-Urban land complex, 0 to 8 percent slopes Not Rated
235B Penwood-Urban land complex, 0 to 8 percent slopes Not Rated
236B Windsor-Urban land complex, 0 to 8 percent slopes Not Rated
237A Manchester-Urban land complex, 0 to 3 percent slopes Not Rated
237C Manchester-Urban land complex, 3 to 15 percent slopes Not Rated
238A Hinckley-Urban land complex, 0 to 3 percent slopes Not Rated
238C Hinckley-Urban land complex, 3 to 15 percent slopes Not Rated
240B Ludlow-Urban land complex, 0 to 8 percent slopes Not Rated
243B Rainbow-Urban land complex, 0 to 8 percent slopes Not Rated
245B Woodbridge-Urban land complex, 0 to 8 percent slopes Not Rated
245C Woodbridge-Urban land complex, 8 to 15 percent slopes Not Rated
248B Georgia-Urban land complex, 2 to 8 percent slopes Not Rated
248C Georgia-Urban land complex, 8 to 15 percent slopes Not Rated
250B Sutton-Urban land complex, 0 to 8 percent slopes Not Rated
253B Wapping-Urban land complex, 0 to 8 percent slopes Not Rated
255B Watchaug-Urban land complex, 0 to 8 percent slopes Not Rated
260B Charlton-Urban land complex, 3 to 8 percent slopes Not Rated

25
Map Symbol
Map Unit Name
Potential Rating Concerns State
Regs. 260C Charlton-Urban land complex, 8 to 15 percent
slopes Not Rated
260D Charlton-Urban land complex, 15 to 25 percent slopes Not Rated
263B Cheshire-Urban land complex, 3 to 8 percent slopes Not Rated
263C Cheshire-Urban land complex, 8 to 15 percent slopes Not Rated
266B Narragansett-Urban land complex, 3 to 8 percent slopes Not Rated
269B Yalesville-Urban land complex, 3 to 8 percent slopes Not Rated
269C Yalesville-Urban land complex, 8 to 15 percent slopes Not Rated
273C Urban land-Charlton-Chatfield complex, rocky, 3 to 15 percent slopes Not Rated
273E Urban land-Charlton-Chatfield complex, rocky, 15 to 45 percent slopes Not Rated
275C Urban land-Chatfield complex, rocky, 3 to 15 percent slopes Not Rated
275E Urban land-Chatfield-rock outcrop complex, 15 to 45 percent slopes Not Rated
282B Broadbrook-Urban land complex, 3 to 8 percent slopes Not Rated
284B Paxton-urban land complex, 3 to 8 percent slopes Not Rated
284C Paxton-Urban land complex, 8 to 15 percent slopes Not Rated
284D Paxton-Urban land complex, 15 to 25 percent slopes Not Rated
287B Wethersfield-Urban land complex, 3 to 8 percent slopes Not Rated
287C Wethersfield-Urban land complex, 8 to 15 percent slopes Not Rated
287D Wethersfield-Urban land complex, 15 to 25 percent slopes Not Rated
290B Stockbridge-Urban land complex, 3 to 8 percent slopes Not Rated
290C Stockbridge-Urban land complex, 8 to 15 percent slopes Not Rated
290D Stockbridge-Urban land complex, 15 to 25 percent slopes Not Rated
301 Beaches-Udipsamments complex, coastal Not Rated
302 Dumps Not Rated
303 Pits, quarries Not Rated
304 Udorthents, loamy, very steep Not Rated
305 Udorthents-pits complex, gravelly Not Rated
306 Udorthents-Urban land complex Not Rated
307 Urban land Not Rated
308 Udorthents, smoothed Not Rated
309 Udorthents, flood control Not Rated
310 Udorthents, periodically flooded Not Rated
401C Macomber-Taconic complex, 3 to 15 percent slopes, very rocky Very low potential Depth to bedrock 1,6

26
Map Symbol
Map Unit Name
Potential Rating Concerns State
Regs. 402D Taconic-Macomber-rock outcrop complex, 15 to
25 percent slopes Very low potential Depth to bedrock, slope 1,6
403C Taconic-rock outcrop complex, 3 to 15 percent slopes Very low potential Depth to bedrock 1,6
403E Taconic-rock outcrop complex, 15 to 45 percent slopes Very low potential Depth to bedrock
slope 1,6
403F Taconic-rock outcrop complex, 45 to 70 percent slopes
Extremely low potential
Depth to bedrock, slope 1,6
405C Dummerston gravelly loam, 3 to 15 percent slopes, very stony High potential None
405E Dummerston gravelly loam, 15 to 45 percent slopes, very stony Medium potential Slope 1
407C Lanesboro loam, 3 to 15 percent slopes, very stony Medium potential Low percolation
rate 1,2
407E Lanesboro loam, 15 to 45 percent slopes, very stony Medium potential Low percolation
rate, slope 1,2
408C Fullam silt loam, 3 to 15 percent slopes, very stony Low potential Depth to SHWT, low
percolation rate 1,2
409B Brayton mucky silt loam, 0 to 8 percent slopes, very stony
Extremely low potential
Depth to SHWT, low percolation rate 1,2,4,5
412B Bice fine sandy loam, 3 to 8 percent slopes High potential None
412C Bice fine sandy loam, 8 to 15 percent slopes High potential None
412D Bice fine sandy loam, 15 to 25 percent slopes High potential Slope
413C Bice-Millsite complex, 3 to 15 percent slopes, very rocky Low potential Depth to bedrock 1,6
413E Bice-Millsite complex, 15 to 45 percent slopes, very rocky Low potential Depth to bedrock,
slope 1,6
414 Fredon silt loam, cold Extremely low potential Depth to SHWT 1,4,5
415C Westminster-Millsite-rock outcrop complex, 3 to 15 percent slopes Very low potential Depth to bedrock 1,6
415E Westminster-Millsite-rock outcrop complex, 15 to 45 percent slopes Very low potential Depth to bedrock,
slope 1,6
416E Rock outcrop-Westminster complex, 8 to 45 percent slopes
Extremely low potential
Depth to bedrock, slope 1,6
416F Rock outcrop-Westminster complex, 45 to 70 percent slopes
Extremely low potential
Depth to bedrock, slope 1,6
417B Bice fine sandy loam, 3 to 8 percent slopes, very stony High potential None
417C Bice fine sandy loam, 8 to 15 percent slopes, very stony High potential None
417D Bice fine sandy loam, 15 to 25 percent slopes, very stony High potential Slope
418C Schroon fine sandy loam, 2 to 15 percent slopes, very stony Low potential Depth to SHWT 1
420A Schroon fine sandy loam, 0 to 3 percent slopes Low potential Depth to SHWT 1

27
Map
Symbol Map Unit
Name Potential
Rating Concerns State Regs.
420B Schroon fine sandy loam, 3 to 8 percent slopes Low potential Depth to SHWT 1
421A Ninigret fine sandy loam, cold, 0 to 3 percent slopes Low potential
Depth to SHWT high percolation rate
1
423A Sudbury sandy loam, cold, 0 to 3 percent slopes Low potential Depth to SHWT, high percolation rate
1
424B Shelburne fine sandy loam, 3 to 8 percent slopes Medium potential Low percolation rate 1,2
424C Shelburne fine sandy loam, 8 to 15 percent slopes Medium potential Low percolation
rate 1,2
424D Shelburne fine sandy loam, 15 to 25 percent slopes Medium potential Low percolation
rate, slope 1,2
425B Shelburne fine sandy loam, 3 to 8 percent slopes, very stony Medium potential Low percolation
rate 1,2
425C Shelburne fine sandy loam, 8 to 15 percent slopes, very stony Medium potential Low percolation
rate 1,2
426D Shelburne fine sandy loam, 15 to 35 percent slopes, extremely stony Medium potential Low percolation
rate, slope 1,2
427B Ashfield fine sandy loam, 2 to 8 percent slopes, very stony Low potential Depth to SHWT, low
percolation rate 1,2
427C Ashfield fine sandy loam, 8 to 15 percent slopes, very stony Low potential Depth to SHWT, low
percolation rate 1,2
428A Ashfield fine sandy loam, 0 to 3 percent slopes Low potential Depth to SHWT, low percolation rate 1,2
428B Ashfield fine sandy loam, 3 to 8 percent slopes Low potential Depth to SHWT, low percolation rate 1,2
428C Ashfield fine sandy loam, 8 to 15 percent slopes Low potential Depth to SHWT, low percolation rate 1,2
429A Agawam fine sandy loam, cold, 0 to 3 percent slopes High potential None

28
Map
Symbol Map Unit
Name Potential
Rating Concerns State Regs.
429B Agawam fine sandy loam, cold, 3 to 8 percent slopes High potential None
429C Agawam fine sandy loam, cold, 8 to 15 percent slopes High potential None
433 Moosilauke sandy loam Extremely low potential
Depth to SHWT, high percolation rate
1,4,5
434A Merrimac sandy loam, cold, 0 to 3 percent slopes High potential None
434B Merrimac sandy loam, cold, 3 to 8 percent slopes High potential None
434C Merrimac sandy loam, cold, 8 to 15 percent slopes High potential None
435 Scarboro muck, cold Extremely low potential Depth to SHWT 1,4,5
436 Halsey silt loam, cold Extremely low potential Depth to SHWT 1,4,5
437 Wonsqueak mucky peat Extremely low potential Depth to SHWT 1,4,5
438 Bucksport muck Extremely low potential Depth to SHWT 1,4,5
440A Boscawen gravelly sandy loam, 0 to 3 percent slopes Low potential High percolation
rate 1
440C Boscawen gravelly sandy loam, 3 to 15 percent slopes Low potential High percolation
rate 1
440E Boscawen gravelly sandy loam, 15 to 45 percent slopes Low potential High percolation
rate, slope 1
442 Brayton loam Extremely low potential
Depth to SHWT, low percolation rate 1,2,4,5
443 Brayton-Loonmeadow complex, extremely stony Extremely low potential
Depth to SHWT, low percolation rate 1,2,4,5
448B Hogansburg silt loam, 3 to 8 percent slopes Low potential Depth to SHWT, low percolation rate 1,2
449B Hogansburg silt loam, 3 to 8 percent slopes, very stony Low potential Depth to SHWT, low
percolation rate 1,2
449C Hogansburg silt loam, 8 to 15 percent slopes, very stony Low potential Depth to SHWT, low
percolation rate 1,2

29
Map
Symbol Map Unit
Name Potential
Rating Concerns State Regs.
450B Pyrities loam, 3 to 8 percent slopes Medium potential Low percolation rate 1,2
450C Pyrities loam, 8 to 15 percent slopes Medium potential Low percolation rate 1,2
450D Pyrities loam, 15 to 25 percent slopes Medium potential Low percolation rate, slope 1,2
451B Pyrities loam, 3 to 8 percent slopes, very stony Medium potential Low percolation rate 1,2
451C Pyrities loam, 8 to 15 percent slopes, very stony Medium potential Low percolation rate 1,2
451D Pyrities loam, 15 to 25 percent slopes, very stony Medium potential Low percolation rate, slope 1,2
457 Mudgepond silt loam, cold Extremely low potential Depth to SHWT 1,4,5
458 Mudgepond and Alden soils, extremely stony, cold
Extremely low potential Depth to SHWT 1,4,5
501 Ondawa fine sandy loam Extremely low potential Flooding 1,5
503 Rumney fine sandy loam Extremely low potential
Flooding, depth to SHWT 1,4,5
508 Medomak silt loam Extremely low potential
Flooding, depth to SHWT 1,4,5
W Water Not Rated
1Identified as an area of special concern by state regulations. Section 19-13-B103d (e) (1) of the Connecticut Public Health Code. 2No permit or approval shall be issued where there is an impervious soil or where there is less than 18 inches depth of suitable existing soil over impervious soil. An impervious soil has a minimum percolation rate slower than one inch in sixty minutes when the groundwater level is at least eighteen inches below the bottom of the percolation test hole. Section 19-13-B103e (a) (3) of the Connecticut Public Health Code.
4No permit or approval shall be issued where the ground water level is less than 18 inches below the surface of the ground for a duration of one month or longer during the wettest season of the year. Section 19-13-B103e (a) (3) of the Connecticut Public Health Code. 5 Identified as an area of special concern by state regulations. Designated as wetland under the provisions of Sections 22a-36 through 22a-45 of the Connecticut General Statutes, as amended. Section 19-13-B103d (e) (1) (G) of the Connecticut Public Health Code.
6No permit or approval shall be issued where there is less than four feet depth of suitable existing soil over ledge rock, two feet of which is naturally occurring soil. Section 19-13-B103e (a) (3) of the Connecticut Public Health Code.

30
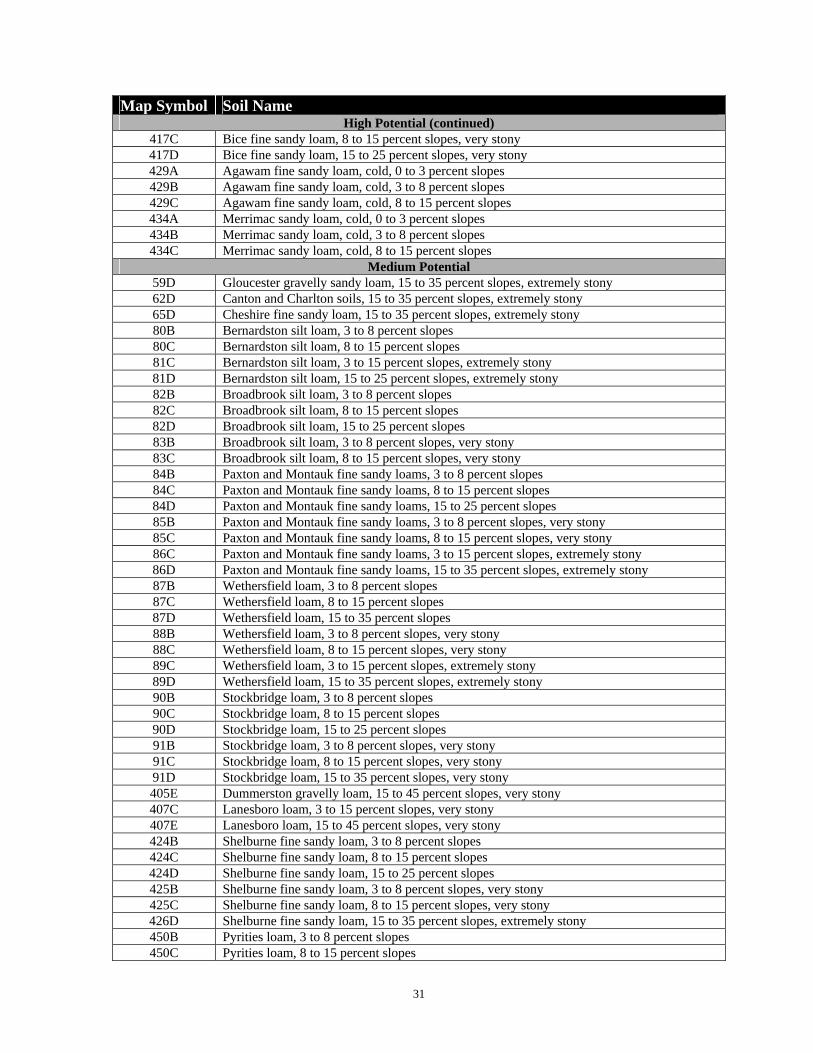
Table 9. Map Units Grouped by Potential Rating
Map Symbol Soil Name
High Potential 29A Agawam fine sandy loam, 0 to 3 percent slopes 29B Agawam fine sandy loam, 3 to 8 percent slopes 29C Agawam fine sandy loam, 8 to 15 percent slopes 30A Branford silt loam, 0 to 3 percent slopes 30B Branford silt loam, 3 to 8 percent slopes 30C Branford silt loam, 8 to 15 percent slopes 32A Haven and Enfield soils, 0 to 3 percent slopes 32B Haven and Enfield soils, 3 to 8 percent slopes 32C Haven and Enfield soils, 8 to 15 percent slopes 33A Hartford sandy loam, 0 to 3 percent slopes 33B Hartford sandy loam, 3 to 8 percent slopes 34A Merrimac sandy loam, 0 to 3 percent slopes 34B Merrimac sandy loam, 3 to 8 percent slopes 34C Merrimac sandy loam, 8 to 15 percent slopes 57B Gloucester gravelly sandy loam, 3 to 8 percent slopes 57C Gloucester gravelly sandy loam, 8 to 15 percent slopes 57D Gloucester gravelly sandy loam, 15 to 25 percent slopes 58B Gloucester gravelly sandy loam, 3 to 8 percent slopes, very stony 58C Gloucester gravelly sandy loam, 8 to 15 percent slopes, very stony 59C Gloucester gravelly sandy loam, 3 to 15 percent slopes, extremely stony 60B Canton and Charlton soils, 3 to 8 percent slopes 60C Canton and Charlton soils, 8 to 15 percent slopes 60D Canton and Charlton soils, 15 to 25 percent slopes 61B Canton and Charlton soils, 3 to 8 percent slopes, very stony 61C Canton and Charlton soils, 8 to 15 percent slopes, very stony 62C Canton and Charlton soils, 3 to 15 percent slopes, extremely stony 63B Cheshire fine sandy loam, 3 to 8 percent slopes 63C Cheshire fine sandy loam, 8 to 15 percent slopes 63D Cheshire fine sandy loam, 15 to 25 percent slopes 64B Cheshire fine sandy loam, 3 to 8 percent slopes, very stony 64C Cheshire fine sandy loam, 8 to 15 percent slopes, very stony 65C Cheshire fine sandy loam, 3 to 15 percent slopes, extremely stony 66B Narragansett silt loam, 2 to 8 percent slopes 66C Narragansett silt loam, 8 to 15 percent slopes 67B Narragansett silt loam, 3 to 8 percent slopes, very stony 67C Narragansett silt loam, 8 to 15 percent slopes, very stony 68C Narragansett silt loam, 3 to 15 percent slopes, very stony 68D Narragansett silt loam, 15 to 35 percent slopes, extremely stony 92B Nellis fine sandy loam, 3 to 8 percent slopes 92C Nellis fine sandy loam, 8 to 15 percent slopes 92D Nellis fine sandy loam, 15 to 25 percent slopes 93C Nellis fine sandy loam, 3 to 15 percent slopes, very stony 405C Dummerston gravelly loam, 3 to 15 percent slopes, very stony 412B Bice fine sandy loam, 3 to 8 percent slopes 412C Bice fine sandy loam, 8 to 15 percent slopes 412D Bice fine sandy loam, 15 to 25 percent slopes 417B Bice fine sandy loam, 3 to 8 percent slopes, very stony
31
Map Symbol Soil Name High Potential (continued)
417C Bice fine sandy loam, 8 to 15 percent slopes, very stony 417D Bice fine sandy loam, 15 to 25 percent slopes, very stony 429A Agawam fine sandy loam, cold, 0 to 3 percent slopes 429B Agawam fine sandy loam, cold, 3 to 8 percent slopes 429C Agawam fine sandy loam, cold, 8 to 15 percent slopes 434A Merrimac sandy loam, cold, 0 to 3 percent slopes 434B Merrimac sandy loam, cold, 3 to 8 percent slopes 434C Merrimac sandy loam, cold, 8 to 15 percent slopes
Medium Potential 59D Gloucester gravelly sandy loam, 15 to 35 percent slopes, extremely stony 62D Canton and Charlton soils, 15 to 35 percent slopes, extremely stony 65D Cheshire fine sandy loam, 15 to 35 percent slopes, extremely stony 80B Bernardston silt loam, 3 to 8 percent slopes 80C Bernardston silt loam, 8 to 15 percent slopes 81C Bernardston silt loam, 3 to 15 percent slopes, extremely stony 81D Bernardston silt loam, 15 to 25 percent slopes, extremely stony 82B Broadbrook silt loam, 3 to 8 percent slopes 82C Broadbrook silt loam, 8 to 15 percent slopes 82D Broadbrook silt loam, 15 to 25 percent slopes 83B Broadbrook silt loam, 3 to 8 percent slopes, very stony 83C Broadbrook silt loam, 8 to 15 percent slopes, very stony 84B Paxton and Montauk fine sandy loams, 3 to 8 percent slopes 84C Paxton and Montauk fine sandy loams, 8 to 15 percent slopes 84D Paxton and Montauk fine sandy loams, 15 to 25 percent slopes 85B Paxton and Montauk fine sandy loams, 3 to 8 percent slopes, very stony 85C Paxton and Montauk fine sandy loams, 8 to 15 percent slopes, very stony 86C Paxton and Montauk fine sandy loams, 3 to 15 percent slopes, extremely stony 86D Paxton and Montauk fine sandy loams, 15 to 35 percent slopes, extremely stony 87B Wethersfield loam, 3 to 8 percent slopes 87C Wethersfield loam, 8 to 15 percent slopes 87D Wethersfield loam, 15 to 35 percent slopes 88B Wethersfield loam, 3 to 8 percent slopes, very stony 88C Wethersfield loam, 8 to 15 percent slopes, very stony 89C Wethersfield loam, 3 to 15 percent slopes, extremely stony 89D Wethersfield loam, 15 to 35 percent slopes, extremely stony 90B Stockbridge loam, 3 to 8 percent slopes 90C Stockbridge loam, 8 to 15 percent slopes 90D Stockbridge loam, 15 to 25 percent slopes 91B Stockbridge loam, 3 to 8 percent slopes, very stony 91C Stockbridge loam, 8 to 15 percent slopes, very stony 91D Stockbridge loam, 15 to 35 percent slopes, very stony 405E Dummerston gravelly loam, 15 to 45 percent slopes, very stony 407C Lanesboro loam, 3 to 15 percent slopes, very stony 407E Lanesboro loam, 15 to 45 percent slopes, very stony 424B Shelburne fine sandy loam, 3 to 8 percent slopes 424C Shelburne fine sandy loam, 8 to 15 percent slopes 424D Shelburne fine sandy loam, 15 to 25 percent slopes 425B Shelburne fine sandy loam, 3 to 8 percent slopes, very stony 425C Shelburne fine sandy loam, 8 to 15 percent slopes, very stony 426D Shelburne fine sandy loam, 15 to 35 percent slopes, extremely stony 450B Pyrities loam, 3 to 8 percent slopes 450C Pyrities loam, 8 to 15 percent slopes

32
Map Symbol Soil Name Medium Potential (continued)
450D Pyrities loam, 15 to 25 percent slopes 451B Pyrities loam, 3 to 8 percent slopes, very stony 451C Pyrities loam, 8 to 15 percent slopes, very stony 451D Pyrities loam, 15 to 25 percent slopes, very stony
Low Potential 20A Ellington silt loam, 0 to 5 percent slopes 21A Ninigret and Tisbury soils, 0 to 5 percent slopes 22A Hero gravelly loam, 0 to 3 percent slopes 22B Hero gravelly loam, 3 to 8 percent slopes 23A Sudbury sandy loam, 0 to 5 percent slopes 24A Deerfield loamy fine sand, 0 to 3 percent slopes 25A Brancroft silt loam, 0 to 3 percent slopes 25B Brancroft silt loam, 3 to 8 percent slopes 25C Brancroft silt loam, 8 to 15 percent slopes 26A Berlin silt loam, 0 to 3 percent slopes 26B Berlin silt loam, 3 to 8 percent slopes 27A Belgrade silt loam, 0 to 5 percent slopes 28A Elmridge fine sandy loam, 0 to 3 percent slopes 28B Elmridge fine sandy loam, 3 to 8 percent slopes 31A Copake fine sandy loam, 0 to 3 percent slopes 31B Copake fine sandy loam, 3 to 8 percent slopes 31C Copake gravelly loam, 8 to 15 percent slopes 35A Penwood loamy sand, 0 to 3 percent slopes 35B Penwood loamy sand, 3 to 8 percent slopes 36A Windsor loamy sand, 0 to 3 percent slopes 36B Windsor loamy sand, 3 to 8 percent slopes 36C Windsor loamy sand, 8 to 15 percent slopes 37A Manchester gravelly sandy loam, 0 to 3 percent slopes 37C Manchester gravelly sandy loam, 3 to 15 percent slopes 37E Manchester gravelly sandy loam, 15 to 45 percent slopes 38A Hinckley gravelly sandy loam, 0 to 3 percent slopes 38C Hinckley gravelly sandy loam, 3 to 15 percent slopes 38E Hinckley gravelly sandy loam, 15 to 45 percent slopes 39A Groton gravelly sandy loam, 0 to 3 percent slopes 39C Groton gravelly sandy loam, 3 to 15 percent slopes 39E Groton gravelly sandy loam, 15 to 45 percent slopes 40A Ludlow silt loam, 0 to 3 percent slopes 40B Ludlow silt loam, 3 to 8 percent slopes 41B Ludlow silt loam, 2 to 8 percent slopes, very stony 42C Ludlow silt loam, 2 to 15 percent slopes, extremely stony 43A Rainbow silt loam, 0 to 3 percent slopes 43B Rainbow silt loam, 3 to 8 percent slopes 44B Rainbow silt loam, 2 to 8 percent slopes, very stony 45A Woodbridge fine sandy loam, 0 to 3 percent slopes 45B Woodbridge fine sandy loam, 3 to 8 percent slopes 45C Woodbridge fine sandy loam, 8 to 15 percent slopes 46B Woodbridge fine sandy loam, 2 to 8 percent slopes, very stony 46C Woodbridge fine sandy loam, 8 to 15 percent slopes, very stony 47C Woodbridge fine sandy loam, 2 to 15 percent slopes, extremely stony 48B Georgia and Amenia silt loams, 2 to 8 percent slopes 48C Georgia and Amenia silt loams, 8 to 15 percent slopes 49B Georgia and Amenia silt loams, 3 to 8 percent slopes, very stony

33
Map Symbol Soil Name Low Potential (continued)
49C Georgia and Amenia silt loams, 8 to 15 percent slopes, very stony 50A Sutton fine sandy loam, 0 to 3 percent slopes 50B Sutton fine sandy loam, 3 to 8 percent slopes 51B Sutton fine sandy loam, 2 to 8 percent slopes, very stony 52C Sutton fine sandy loam, 2 to 15 percent slopes, extremely stony 53A Wapping very fine sandy loam, 0 to 3 percent slopes 53B Wapping very fine sandy loam, 3 to 8 percent slopes 54B Wapping very fine sandy loam, 2 to 8 percent slopes, very stony 55A Watchaug fine sandy loam, 0 to 3 percent slopes 55B Watchaug fine sandy loam, 3 to 8 percent slopes 56B Watchaug fine sandy loam, 2 to 8 percent slopes, very stony 70C Branford-Holyoke complex, 3 to 15 percent slopes, very rocky 71C Brookfield-Brimfield-rock outcrop complex, 3 to 15 percent slopes 71E Brookfield-Brimfield-rock outcrop complex, 15 to 45 percent slopes 73C Charlton-Chatfield complex, 3 to 15 percent slopes, very rocky 73E Charlton-Chatfield complex, 15 to 45 percent slopes, very rocky 74C Narragansett-Hollis complex, 3 to 15 percent slopes, very rocky 77C Cheshire-Holyoke complex, 3 to 15 percent slopes, very rocky 77D Cheshire-Holyoke complex, 15 to 35 percent slopes, very rocky 94C Farmington-Nellis complex, 3 to 15 percent slopes, very rocky 94E Farmington-Nellis complex, 15 to 35 percent slopes, very rocky
408C Fullam silt loam, 3 to 15 percent slopes, very stony 413C Bice-Millsite complex, 3 to 15 percent slopes, very rocky 413E Bice-Millsite complex, 15 to 45 percent slopes, very rocky 418C Schroon fine sandy loam, 2 to 15 percent slopes, very stony 420A Schroon fine sandy loam, 0 to 3 percent slopes 420B Schroon fine sandy loam, 3 to 8 percent slopes 421A Ninigret fine sandy loam, cold, 0 to 3 percent slopes 423A Sudbury sandy loam, cold, 0 to 3 percent slopes 427B Ashfield fine sandy loam, 2 to 8 percent slopes, very stony 427C Ashfield fine sandy loam, 8 to 15 percent slopes, very stony 428A Ashfield fine sandy loam, 0 to 3 percent slopes 428B Ashfield fine sandy loam, 3 to 8 percent slopes 428C Ashfield fine sandy loam, 8 to 15 percent slopes 440A Boscawen gravelly sandy loam, 0 to 3 percent slopes 440C Boscawen gravelly sandy loam, 3 to 15 percent slopes 440E Boscawen gravelly sandy loam, 15 to 45 percent slopes 448B Hogansburg silt loam, 3 to 8 percent slopes 449B Hogansburg silt loam, 3 to 8 percent slopes, very stony 449C Hogansburg silt loam, 8 to 15 percent slopes, very stony
Very Low Potential 69B Yalesville fine sandy loam, 3 to 8 percent slopes 69C Yalesville fine sandy loam, 8 to 15 percent slopes 75C Hollis-Chatfield-rock outcrop complex, 3 to 15 percent slopes 75E Hollis-Chatfield-rock outcrop complex, 15 to 45 percent slopes 78C Holyoke-rock outcrop complex, 3 to 15 percent slopes 78E Holyoke-rock outcrop complex, 15 to 45 percent slopes 95C Farmington-rock outcrop complex, 3 to 15 percent slopes 95E Farmington-rock outcrop complex, 15 to 45 percent slopes
401C Macomber-Taconic complex, 3 to 15 percent slopes, very rocky 402D Taconic-Macomber-rock outcrop complex, 15 to 25 percent slopes

34
Map Symbol Soil Name Very Low Potential (continued)
403C Taconic-rock outcrop complex, 3 to 15 percent slopes 403E Taconic-rock outcrop complex, 15 to 45 percent slopes 415C Westminster-Millsite-rock outcrop complex, 3 to 15 percent slopes 415E Westminster-Millsite-rock outcrop complex, 15 to 45 percent slopes
Extremely Low Potential 2 Ridgebury fine sandy loam 3 Ridgebury, Leicester, and Whitman soils, extremely stony 4 Leicester fine sandy loam 5 Wilbraham silt loam 6 Wilbraham and Menlo soils, extremely stony 7 Mudgepond silt loam 8 Mudgepond and Alden soils, extremely stony 9 Scitico, Shaker, and Maybid soils
10 Raynham silt loam 12 Raypol silt loam 13 Walpole sandy loam 14 Fredon silt loam 15 Scarboro muck 16 Halsey silt loam 17 Timakwa and Natchaug soils 18 Catden and Freetown soils
76E Rock outcrop-Hollis complex, 3 to 45 percent slopes 76F Rock outcrop-Hollis complex, 45 to 60 percent slopes 79E Rock outcrop-Holyoke complex, 3 to 45 percent slopes 96 Ipswich mucky peat 97 Pawcatuck mucky peat 98 Westbrook mucky peat 99 Westbrook mucky peat, low salt
100 Suncook loamy fine sandy 101 Occum fine sandy loam 102 Pootatuck fine sandy loam 103 Rippowam fine sandy loam 104 Bash silt loam 105 Hadley silt loam 106 Winooski silt loam 107 Limerick and Lim soils 108 Saco silt loam 109 Fluvaquents-Udifluvents complex, frequently flooded
403F Taconic-Rock outcrop complex, 45 to 70 percent slopes 409B Brayton mucky silt loam, 0 to 8 percent slopes, very stony 414 Fredon silt loam, cold
416E Rock outcrop-Westminster complex, 8 to 45 percent slopes 416F Rock outcrop-Westminster complex, 45 to 70 percent slopes 433 Moosilauke sandy loam 435 Scarboro muck, cold 436 Halsey silt loam, cold 437 Wonsqueak mucky peat 438 Bucksport muck 442 Brayton loam 443 Brayton-Loonmeadow complex, extremely stony 457 Mudgepond silt loam, cold 458 Mudgepond and Alden soils, extremely stony, cold
35
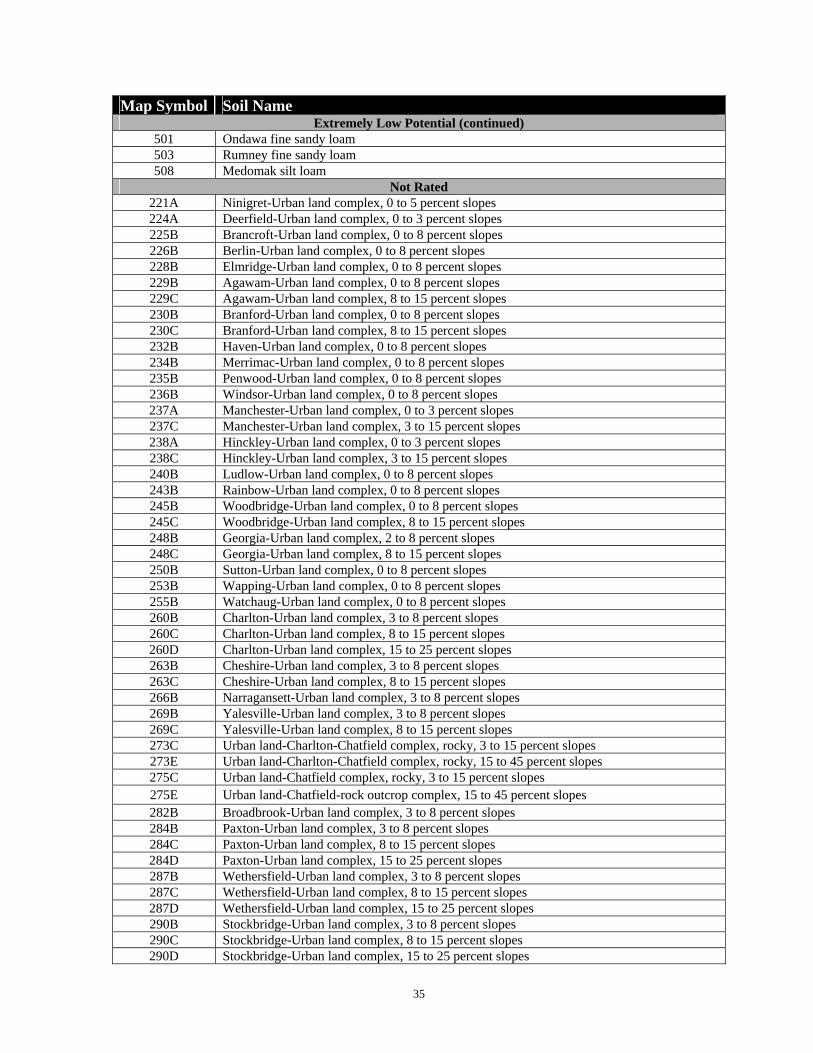
Map Symbol Soil Name Extremely Low Potential (continued)
501 Ondawa fine sandy loam 503 Rumney fine sandy loam 508 Medomak silt loam
Not Rated 221A Ninigret-Urban land complex, 0 to 5 percent slopes 224A Deerfield-Urban land complex, 0 to 3 percent slopes 225B Brancroft-Urban land complex, 0 to 8 percent slopes 226B Berlin-Urban land complex, 0 to 8 percent slopes 228B Elmridge-Urban land complex, 0 to 8 percent slopes 229B Agawam-Urban land complex, 0 to 8 percent slopes 229C Agawam-Urban land complex, 8 to 15 percent slopes 230B Branford-Urban land complex, 0 to 8 percent slopes 230C Branford-Urban land complex, 8 to 15 percent slopes 232B Haven-Urban land complex, 0 to 8 percent slopes 234B Merrimac-Urban land complex, 0 to 8 percent slopes 235B Penwood-Urban land complex, 0 to 8 percent slopes 236B Windsor-Urban land complex, 0 to 8 percent slopes 237A Manchester-Urban land complex, 0 to 3 percent slopes 237C Manchester-Urban land complex, 3 to 15 percent slopes 238A Hinckley-Urban land complex, 0 to 3 percent slopes 238C Hinckley-Urban land complex, 3 to 15 percent slopes 240B Ludlow-Urban land complex, 0 to 8 percent slopes 243B Rainbow-Urban land complex, 0 to 8 percent slopes 245B Woodbridge-Urban land complex, 0 to 8 percent slopes 245C Woodbridge-Urban land complex, 8 to 15 percent slopes 248B Georgia-Urban land complex, 2 to 8 percent slopes 248C Georgia-Urban land complex, 8 to 15 percent slopes 250B Sutton-Urban land complex, 0 to 8 percent slopes 253B Wapping-Urban land complex, 0 to 8 percent slopes 255B Watchaug-Urban land complex, 0 to 8 percent slopes 260B Charlton-Urban land complex, 3 to 8 percent slopes 260C Charlton-Urban land complex, 8 to 15 percent slopes 260D Charlton-Urban land complex, 15 to 25 percent slopes 263B Cheshire-Urban land complex, 3 to 8 percent slopes 263C Cheshire-Urban land complex, 8 to 15 percent slopes 266B Narragansett-Urban land complex, 3 to 8 percent slopes 269B Yalesville-Urban land complex, 3 to 8 percent slopes 269C Yalesville-Urban land complex, 8 to 15 percent slopes 273C Urban land-Charlton-Chatfield complex, rocky, 3 to 15 percent slopes 273E Urban land-Charlton-Chatfield complex, rocky, 15 to 45 percent slopes 275C Urban land-Chatfield complex, rocky, 3 to 15 percent slopes 275E Urban land-Chatfield-rock outcrop complex, 15 to 45 percent slopes 282B Broadbrook-Urban land complex, 3 to 8 percent slopes 284B Paxton-Urban land complex, 3 to 8 percent slopes 284C Paxton-Urban land complex, 8 to 15 percent slopes 284D Paxton-Urban land complex, 15 to 25 percent slopes 287B Wethersfield-Urban land complex, 3 to 8 percent slopes 287C Wethersfield-Urban land complex, 8 to 15 percent slopes 287D Wethersfield-Urban land complex, 15 to 25 percent slopes 290B Stockbridge-Urban land complex, 3 to 8 percent slopes 290C Stockbridge-Urban land complex, 8 to 15 percent slopes 290D Stockbridge-Urban land complex, 15 to 25 percent slopes

36
Map Symbol Soil Name Not Rated (continued)
301 Beaches-Udipsamments complex, coastal 302 Dumps 303 Pits, quarries 304 Udorthents, loamy, very steep 305 Udorthents-Urban land complex 307 Urban land 308 Udorthents, smoothed 309 Udorthents, flood control 310 Udorthents, periodically flooded W Water

37
References
Cooley, Roger. Chart presented to Footprint Committee – Footprint Area Square Feet per Hundred Gallons. Minutes of the Footprint Committee, Meeting #4, p. 8-9. September 20, 2001.
Hill, David E. Connecticut Agricultural Experiment Station, Soil Interpretations for Waste
Disposal. New Haven, Connecticut: 1979. Peacock, Carl. Table Specifying Trench Bottom Area, Ksat, and Percolation Rate. Minutes
of the Footprint Committee, Meeting #4, p. 6. September 20, 2001. State of Connecticut, Department of Public Health, Connecticut Public Health Code –
Regulations and Technical Standards for Subsurface Sewage Disposal Systems, Technical Standards (Pursuant to Section 19-13-B103). January 1, 2004.
State of Connecticut, Department of Public Health, Connecticut Public Health Code –
Regulations and Technical Standards for Subsurface Sewage Disposal Systems, Section 19-13-B103 (Discharges 5,000 Gallons Per Day or Less). August 16, 1982.
State of Virginia, Virginia Department of Health, Proposed Regulations, Title of
Regulation: 12 VAC 5-610. Sewage Handling and Disposal Regulations (amending 12 VAC 5-610-120 and 12 VAC 5-610-490; adding 12 VAC 5-610-449 and 12 VAC 5-610-449.1). July 29, 2002.
United States Department of Agriculture, Natural Resources Conservation Service Soil
Survey Staff, Soil Survey of the State of Connecticut. Tolland, Connecticut: July 15, 2005. Available URL: http://soildatamart.nrcs.usda.gov/survey.aspx?State=CT
USDA-Soil Conservation Service, and Connecticut Department of Health Services, Soil
Potential Ratings – Septic Tank Absorption Fields for Single Family Residences – Middlesex County, Connecticut. Storrs, Connecticut: 1986.
USDA-Soil Conservation Service and Connecticut Department of Health Services, Soil
Potential Ratings – Septic Tank Absorption Fields for Single Family Residences – New Haven County, Connecticut. Storrs, Connecticut: 1985.
USDA-Soil Conservation Service and Connecticut Department of Health Services, Soil
Potential Ratings – Septic Tank Absorption Fields for Single Family Residences – New London County, Connecticut. Storrs, Connecticut: 1985.