soil organic matter, microbial properties, and aggregate stability under annual and perennial...
TRANSCRIPT

Biol Fertil Soils (2004) 39:172–178DOI 10.1007/s00374-003-0698-y
O R I G I N A L P A P E R
R. M. Milne · R. J. Haynes
Soil organic matter, microbial properties,and aggregate stability under annual and perennial pastures
Received: 5 May 2003 / Accepted: 12 November 2003 / Published online: 9 January 2004� Springer-Verlag 2004
Abstract The use of annually sown pastures to providewinter forage is common in dairy farming in manyregions of the world. Loss of organic matter and soilstructural stability due to annual tillage under thismanagement may be contributing to soil degradation.The comparative effects of annual ryegrass pastures(conventionally tilled and resown each year), permanentkikuyu pastures and undisturbed native vegetation on soilorganic matter content, microbial size and activity, andaggregate stability were investigated on commercial dairyfarms in the Tsitsikamma region of the Eastern Cape,South Africa. In comparison with soils under sparse,native grassy vegetation, those under both annual ryegrassand permanent kikuyu pasture had higher soil organicmatter content on the very sandy soils of the eastern endof the region. By contrast, in the higher rainfall, westernside, where the native vegetation was coastal forest, therewas a loss of organic matter under both types of pasture.Nonetheless, soil organic C, K2SO4-extractable C, micro-bial biomass C, basal respiration, arginine ammonifica-tion and fluorescein diacetate hydrolysis rates andaggregate stability were less under annual than permanentpastures at all the sites. These results reflect the degradingeffect of annual tillage on soil organic matter and thepositive effect of grazed permanent pasture on soilmicrobial activity and aggregation. Soil organic C,microbial biomass C, K2SO4-extractable C, basal respi-ration and aggregate stability were significantly correlatedwith each other. The metabolic quotient and percentage oforganic C present as microbial biomass C were generallypoorly correlated with other measured properties butnegatively correlated with one another. It was concludedthat annual pasture involving conventional tillage results
in a substantial loss of soil organic matter, soil microbialactivity and soil physical condition under dairy pasturesand that a system that avoids tillage needs to bedeveloped.
Keywords Soil organic matter · Pasture · Microbialbiomass · Microbial activity · Tillage
Introduction
Maintenance or improvement of soil organic mattercontent is generally accepted as being an importantobjective for any sustainable system of agriculture(Gregorich et al. 1997; Janzen et al. 1997). Loss of soilorganic matter can have detrimental effects on soilchemical, physical and biological properties. The loss ofsoil microflora is of particular concern since microbiallymediated processes are central to soil functioning (Doranet al. 1996; Gregorich et al. 1997). Important processesinclude decomposition of organic residues, transforma-tions of organic matter, mineralization of nutrients andformation and stabilization of soil aggregates.
In general, conversion of land under undisturbed nativegrassland to improved pasture results in an increase in soilorganic matter content due to increased dry matterproduction and greater organic matter inputs to the soil(Haynes and Williams 1993). In contrast, conversion toarable crop production characteristically results in asubstantial decline in organic matter content because oftillage-induced breakdown of organic material (Fenton etal. 1999).
In the main dairy farming areas of humid, subtropicalSouth Africa, pasture production is based on permanentkikuyu grass (Pennisetum clandestinum Hochst. ExChiov.) pastures. Kikuyu is so invasive that it usuallybecomes dominant within a few years even if the field issown to other grass/legume species. A major problemwith these systems is that forage production is very lowduring the winter months because low temperatures limitkikuyu growth. For that reason, annual pastures of
R. M. Milne · R. J. Haynes ())Discipline of Soil Science,School of Applied Environmental Sciences,University of Natal, Pietermaritzburg, Private Bag X01,3209 Scottsville, South Africae-mail: [email protected].: +27-33-2605416Fax: +27-33-2605426

perennial (Lolium perenne L.) or annual (Lolium multi-florum Lam.) ryegrass are sown for winter production.These are commonly tilled (usually using a rotarycultivator) and resown each spring. The use of suchannual pastures is common in other parts of the worldwith similar climates. Observations have suggested thatwith time, production from annual pastures has progres-sively declined and this is suspected to be related to soildegradation, particularly a decrease in organic mattercontent and a loss of related soil microbial and physicalproperties.
The purpose of this study was to compare the effects ofpermanent kikuyu pasture, annually cultivated ryegrasspasture and undisturbed native vegetation on soil organicmatter content, size and activity of the microbial biomass,and aggregate stability. The study area was in theTsitsikamma region of the Eastern Cape province, SouthAfrica, where dairy farming is the main land use. Fourcommercial farms, situated on sites that represented thethree main soil groups in the region were sampled.
Materials and methods
Soils and sites
Four commercial dairy farms were selected in the Tsitsikammaregion of the Eastern Cape, South Africa. These were named“Brandkop” (34�00051700S and 24�16083800E), “Lanark”(34�02078700S and 24�26049700E), “Heidehof” (34�04024300S and24�15049100E) and “Kenmore” (34�01004600S and 23�56016100E).Mean annual rainfall is about 710 mm at Brandkop, 951 mm atLanark and Heidehof and 1,125 mm at Kenmore; rain fallsthroughout the year but peaks during winter (May to August). Meanmonthly air temperatures in the region range from 10�C in Augustto 24.7�C in February. Soils at the sites were classified as GroekopForm, Basrug family (Soil Classification Working Group 1991;Dystric Regosol; FAO) at Brandkop, Cartref form, Frosterly family(Gleyic Luvisol; FAO) at Lanark and Heidehof and Kroonstadform, Morgendal family (Ochric Planosol; FAO) at Kenmore. Theclay contents of soils ranged from 8–15% at Brandkop, 16–24% atLanark and Heidehof and 26–35% at Kenmore.
At each farm a preliminary soil survey was carried out to ensurethat experimental fields were on soils of the same texture andclassification. Three fields were chosen at each farm. They wereunder: (1) annually tilled ryegrass, (2) permanent kikuyu pastureand (3) undisturbed native vegetation. At each farm, annualpastures were sown with perennial ryegrass and had been annuallytilled with a rotary cultivator for longer than 15 years. Tillage iscarried out to a depth of about 15 cm in September to November(Spring), prior to resowing the pasture, and usually consists of twopasses with a tractor-mounted rotary cultivator. The soil isgenerally moist and friable at the time of tillage. The permanentkikuyu pastures had remained untilled for >15 years. Each field hada history of annual applications of fertilizer (N, P, K and Mg) andlime at commercially recommended rates. Typical annual fertilizerrates are 2 tonne lime ha�1, 250 kg N ha�1, 75 kg K ha�1 and 25 kg Pha�1. At each site, the annual pastures were irrigated by centre-pivotsystems while the kikuyu pastures were not irrigated. All of thepastures were rotationally grazed with dairy cows.
Areas under undisturbed native vegetation were identified onunused parts of each farm. Vegetation of Brandkop was sparseconsisting of small bushes and a few grasses but at Lanmark it wasmore prolific and dense. At Heidehof it was a more productivemixture of small bushes, shrubs and grasses while at Kenmore itconsisted of a short coastal forest. The dominant species at each ofthe sites were: Brandkop (Stoebe plumosus, Leucodendron
salignum, Rhodocoma gigante), Lanark (Rhodocoma gigantea,Podalyria glanca, Metalasia muticata), Heidehof (Rhus lucida,Rhus glanca, Tarchonanthus camphoratus) and Kenmore (Oliniaventosa, Crysanthemoides monilefera, Helichrysum petiolare).
Study fields were about 20 ha in size. The fields were dividedinto 100 m2 plots and three separate plots were randomly chosenand sampled to a depth of 10 cm. Before sampling, plots wereheavily irrigated and allowed to drain for 48 h to field capacityprior to sampling. Twenty five samples were taken from each plotusing a 25-mm diameter tube sampler. Samples from each plotwere bulked. For areas under undisturbed vegetation, an area ofapproximately 20 ha was marked out and it was sampled in thesame way. The bulked, field-moist samples were mixed and splitinto three sub-samples. One sub-sample was sieved (<2 mm) andstored at 2�C prior to microbiological analysis. Another sub-samplewas air-dried, sieved (<2 mm), ground (<0.5 mm) and stored forsubsequent chemical analyses. The third sub-sample, for analysis ofaggregate stability, was sieved and the 2- to 6-mm-diameteraggregates were collected and air-dried.
Analyses
Soil pH was measured with a glass electrode using a 1:2.5soil:water ratio. Soil organic C was determined by the Walkley andBlack dichromate oxidation method (Blakemore et al. 1972).Microbial biomass C was estimated by the fumigation-extractionmethod based on the difference between C extracted with 0.5 MK2SO4 from chloroform-fumigated and unfumigated soil samplesusing a Kc factor of 0.38 (Vance et al. 1987). The amount oforganic C extracted from the unfumigated soil with K2SO4 wasused as an index of labile, soluble organic C. Basal respiration wasdetermined by placing 30 g oven-dry equivalent of field-moist soilin a 50-ml beaker and incubating the sample in the dark at 25�C in a1-l air-tight sealed jar along with 10 ml 1 M NaOH. The CO2evolved was determined after 2, 5 and 10 days by titration(Anderson 1982). Basal respiration was calculated over the 10-dayperiod as �g CO2-C g�1 day�1. The metabolic quotient wascalculated as a basal respiration (mg CO2-C h�1) expressed permg of microbial biomass C. Arginine ammonification rate wasmeasured by the method of Franzluebbers et al. (1995) using anincubation period of 3 h and a temperature of 25�C. The rate offluorescein diacetate (FDA) hydrolysis was estimated by themethod of Schn�rer and Rosswall (1982) using an incubationperiod of 2 h and a temperature of 30�C.
Aggregate stability was measured using a wet sieving technique(Haynes 1993). The equivalent of 30 g air-dried, 2- to 6-mm soilaggregates were transferred to the uppermost of a set of three sieveshaving 2.0-, 1.0- and 0.5-mm-diameter apertures. The water levelwas maintained to ensure that the aggregates on the upper sievewere just submerged at the highest point of oscillation. Theoscillation rate was 25 cycles per minute, the amplitude of sievingaction was 35 mm and the period of sieving was 15 min. The resultswere expressed as a mean weight diameter (mm), which is the sumof the fraction of soil remaining on each sieve after sieving for thestandard time multiplied by the mean diameter of the intersieveaperture. The maximum value for mean weight diameter is 4 andthe minimum is 0.25 mm.
Data was analysed by analysis of variance using the Genstat 5package. Least significant differences were calculated at the 5%level.
Results
Soil properties
As already noted, the clay content of soils increased in theorder Brandkop < Lanark = Heidehof < Kenmore.pH(water) values for the experimental sites are presented
173

in Fig. 1 and ranged from 4.1 under native vegetation atKenmore to 6.9 under annual ryegrass at Kenmore. Thesoils at Kenmore are Podzolic in nature, with an E horizonat 25–30 cm and this explains the low pH under nativevegetation. However, at all the sites, fields under dairypasture had a history of lime application. As a result, therewas no discernable trend in pH values with land use.
Recorded values for aggregate stability were allrelatively low compared with a maximum obtainablevalue of 4 mm (Fig. 1). This emphasises the structurallyunstable nature of these sandy soils. Under nativevegetation, aggregate stability was higher at Kenmorethan other sites. Values were higher under kikuyu grassthan other land uses at each of the sites. At Brandkop,Heidehof and Kenmore, values under annual ryegrasstended to be lower than those under native vegetation.
The organic C contents under native vegetationincreased in the order Brandkop < Lanark < Heidehof <Kenmore (Fig. 2). At Brandkop, Lanark, and Heidehof,organic C content was greater under kikuyu grass thanunder native vegetation; the effect was most marked atBrandkop. At Kenmore, however, the reverse was thecase and organic C content was greatest under nativevegetation. Brandkop was the only one of the four siteswhere the organic C content was higher under annualpasture (36 g kg�1) than under native vegetation (18 g
kg�1). At Kenmore the organic C levels were relativelyhigh (>67 g kg�1) even under the annual pastures.
The K2SO4-extractable C concentrations ranged from32 mg kg�1 under annual pasture at Lanark to 372 mgkg�1 under permanent kikuyu pasture at Kenmore (Fig. 2).In comparison with values for organic C, those forK2SO4-extractable C under native vegetation were unex-pectedly low at the Lanark site. Indeed values followedthe order Lanark < Brandkop < Heidehof < Kenmore. Thepermanent kikuyu pastures had the highest values at allfour sites. Surprisingly, annual pastures tended to have asimilar or higher extractable C content than under nativevegetation.
Microbial biomass and microbial activity
Microbial biomass C concentrations ranged from 94 mgkg�1 under annual pasture at Brandkop to the very highvalue of 3,359 mg kg�1 under permanent kikuyu pasture atKenmore (Fig. 3). Under native vegetation, microbialbiomass C followed the trend Brandkop < Lanark =Heidehof < Kenmore. Microbial biomass C was thehighest under permanent kikuyu pastures at all four sitesand tended to be lowest under annual pasture. Incomparison with values for organic C and K2SO4-
Fig. 1 Effect of native vegetation, annual ryegrass and permanentkikuyu pastures at four farm sites (Brandkop, Lanark, Heidehof andKenmore) on soil pH and aggregate stability measured as meanweight diameter (MWD). Means associated with the same letter arenot significantly different (P �0.05)
Fig. 2 Effect of native vegetation, annual ryegrass and permanentkikuyu pastures at four farm sites (Brandkop, Lanark, Heidehof andKenmore) on soil organic C and K2SO4-extractable C. Meansassociated with the same letter are not significantly different(P �0.05)
174
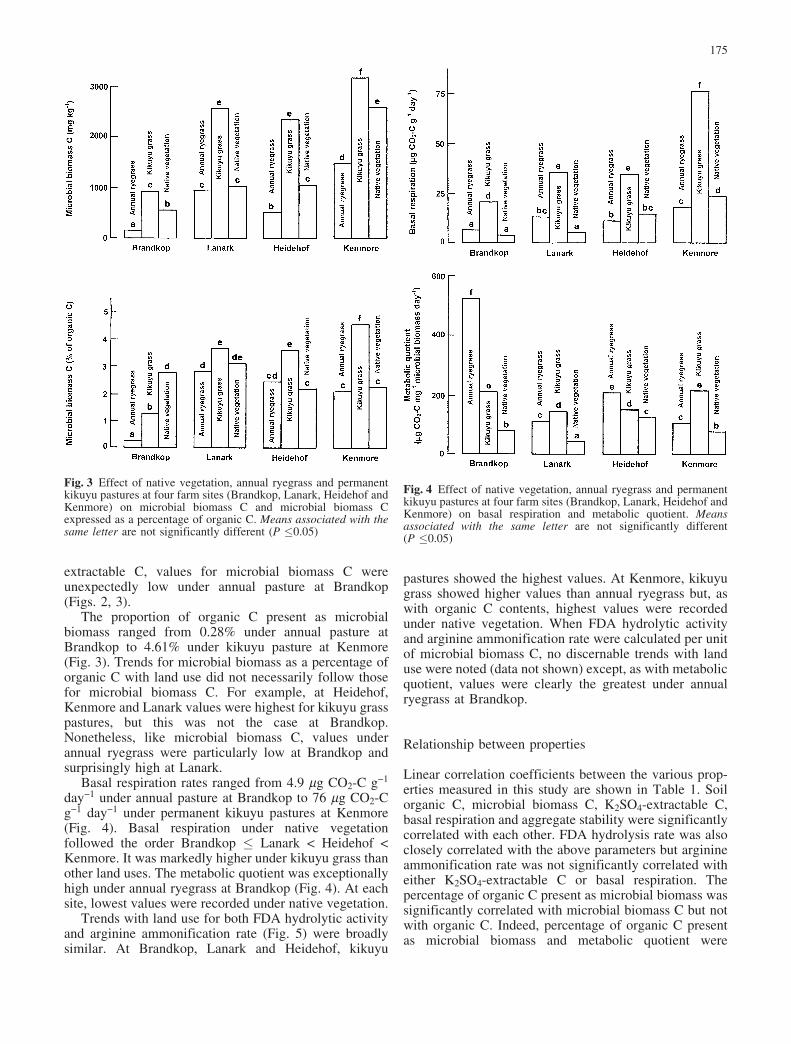
extractable C, values for microbial biomass C wereunexpectedly low under annual pasture at Brandkop(Figs. 2, 3).
The proportion of organic C present as microbialbiomass ranged from 0.28% under annual pasture atBrandkop to 4.61% under kikuyu pasture at Kenmore(Fig. 3). Trends for microbial biomass as a percentage oforganic C with land use did not necessarily follow thosefor microbial biomass C. For example, at Heidehof,Kenmore and Lanark values were highest for kikuyu grasspastures, but this was not the case at Brandkop.Nonetheless, like microbial biomass C, values underannual ryegrass were particularly low at Brandkop andsurprisingly high at Lanark.
Basal respiration rates ranged from 4.9 mg CO2-C g�1
day�1 under annual pasture at Brandkop to 76 mg CO2-Cg�1 day�1 under permanent kikuyu pastures at Kenmore(Fig. 4). Basal respiration under native vegetationfollowed the order Brandkop � Lanark < Heidehof <Kenmore. It was markedly higher under kikuyu grass thanother land uses. The metabolic quotient was exceptionallyhigh under annual ryegrass at Brandkop (Fig. 4). At eachsite, lowest values were recorded under native vegetation.
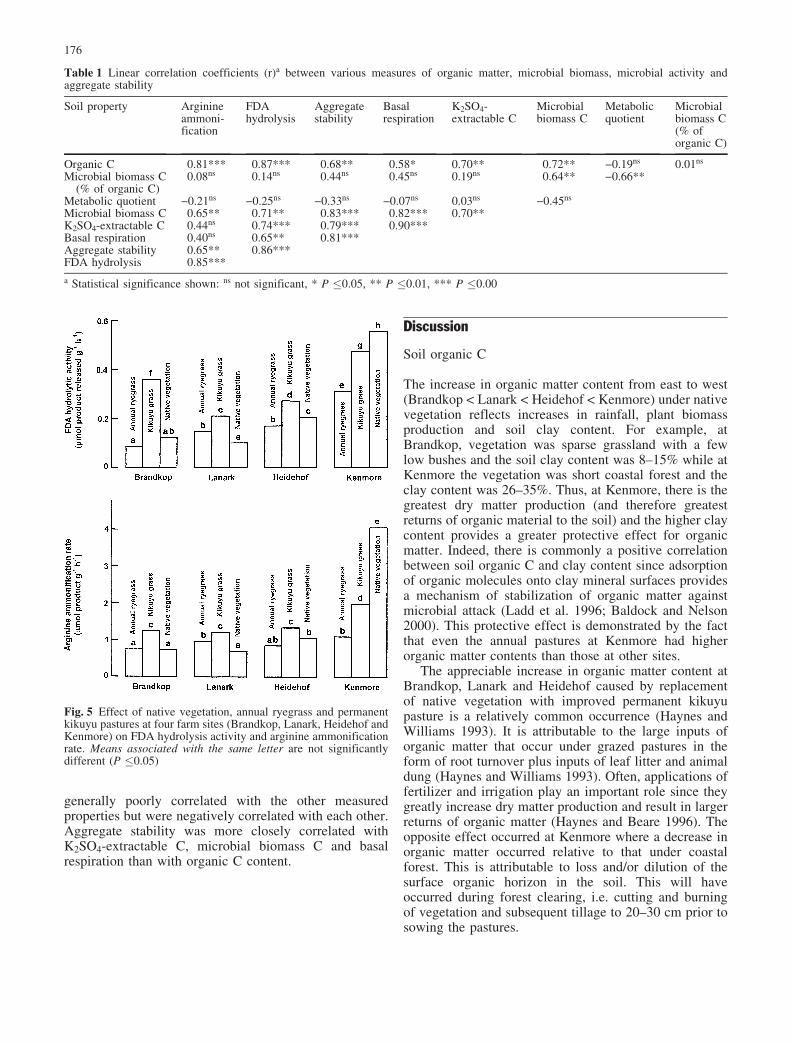
Trends with land use for both FDA hydrolytic activityand arginine ammonification rate (Fig. 5) were broadlysimilar. At Brandkop, Lanark and Heidehof, kikuyu
pastures showed the highest values. At Kenmore, kikuyugrass showed higher values than annual ryegrass but, aswith organic C contents, highest values were recordedunder native vegetation. When FDA hydrolytic activityand arginine ammonification rate were calculated per unitof microbial biomass C, no discernable trends with landuse were noted (data not shown) except, as with metabolicquotient, values were clearly the greatest under annualryegrass at Brandkop.
Relationship between properties
Linear correlation coefficients between the various prop-erties measured in this study are shown in Table 1. Soilorganic C, microbial biomass C, K2SO4-extractable C,basal respiration and aggregate stability were significantlycorrelated with each other. FDA hydrolysis rate was alsoclosely correlated with the above parameters but arginineammonification rate was not significantly correlated witheither K2SO4-extractable C or basal respiration. Thepercentage of organic C present as microbial biomass wassignificantly correlated with microbial biomass C but notwith organic C. Indeed, percentage of organic C presentas microbial biomass and metabolic quotient were
Fig. 3 Effect of native vegetation, annual ryegrass and permanentkikuyu pastures at four farm sites (Brandkop, Lanark, Heidehof andKenmore) on microbial biomass C and microbial biomass Cexpressed as a percentage of organic C. Means associated with thesame letter are not significantly different (P �0.05)
Fig. 4 Effect of native vegetation, annual ryegrass and permanentkikuyu pastures at four farm sites (Brandkop, Lanark, Heidehof andKenmore) on basal respiration and metabolic quotient. Meansassociated with the same letter are not significantly different(P �0.05)
175
generally poorly correlated with the other measuredproperties but were negatively correlated with each other.Aggregate stability was more closely correlated withK2SO4-extractable C, microbial biomass C and basalrespiration than with organic C content.
Discussion
Soil organic C
The increase in organic matter content from east to west(Brandkop < Lanark < Heidehof < Kenmore) under nativevegetation reflects increases in rainfall, plant biomassproduction and soil clay content. For example, atBrandkop, vegetation was sparse grassland with a fewlow bushes and the soil clay content was 8–15% while atKenmore the vegetation was short coastal forest and theclay content was 26–35%. Thus, at Kenmore, there is thegreatest dry matter production (and therefore greatestreturns of organic material to the soil) and the higher claycontent provides a greater protective effect for organicmatter. Indeed, there is commonly a positive correlationbetween soil organic C and clay content since adsorptionof organic molecules onto clay mineral surfaces providesa mechanism of stabilization of organic matter againstmicrobial attack (Ladd et al. 1996; Baldock and Nelson2000). This protective effect is demonstrated by the factthat even the annual pastures at Kenmore had higherorganic matter contents than those at other sites.
The appreciable increase in organic matter content atBrandkop, Lanark and Heidehof caused by replacementof native vegetation with improved permanent kikuyupasture is a relatively common occurrence (Haynes andWilliams 1993). It is attributable to the large inputs oforganic matter that occur under grazed pastures in theform of root turnover plus inputs of leaf litter and animaldung (Haynes and Williams 1993). Often, applications offertilizer and irrigation play an important role since theygreatly increase dry matter production and result in largerreturns of organic matter (Haynes and Beare 1996). Theopposite effect occurred at Kenmore where a decrease inorganic matter occurred relative to that under coastalforest. This is attributable to loss and/or dilution of thesurface organic horizon in the soil. This will haveoccurred during forest clearing, i.e. cutting and burningof vegetation and subsequent tillage to 20–30 cm prior tosowing the pastures.
Fig. 5 Effect of native vegetation, annual ryegrass and permanentkikuyu pastures at four farm sites (Brandkop, Lanark, Heidehof andKenmore) on FDA hydrolysis activity and arginine ammonificationrate. Means associated with the same letter are not significantlydifferent (P �0.05)
Table 1 Linear correlation coefficients (r)a between various measures of organic matter, microbial biomass, microbial activity andaggregate stability
Soil property Arginineammoni-fication
FDAhydrolysis
Aggregatestability
Basalrespiration
K2SO4-extractable C
Microbialbiomass C
Metabolicquotient
Microbialbiomass C(% oforganic C)
Organic C 0.81*** 0.87*** 0.68** 0.58* 0.70** 0.72** �0.19ns 0.01ns
Microbial biomass C(% of organic C)
0.08ns 0.14ns 0.44ns 0.45ns 0.19ns 0.64** �0.66**
Metabolic quotient �0.21ns �0.25ns �0.33ns �0.07ns 0.03ns �0.45ns
Microbial biomass C 0.65** 0.71** 0.83*** 0.82*** 0.70**K2SO4-extractable C 0.44ns 0.74*** 0.79*** 0.90***Basal respiration 0.40ns 0.65** 0.81***Aggregate stability 0.65** 0.86***FDA hydrolysis 0.85***
a Statistical significance shown: ns not significant, * P �0.05, ** P �0.01, *** P �0.00
176

The effect of annual pasture on soil organic matterstatus is the consequence of a balance between highorganic matter inputs from the productive pasture andincreased organic matter breakdown induced by annualtillage (Haynes 1999a, 1999b). Conventional tillageincreases aeration and breaks up soil aggregates, exposingorganic matter that was previously physically protectedby aggregate structure to microbial attack (Haynes andBeare 1996). For Kenmore, Heidehof, and to a lesserextent Lanark, the tillage effect dominated and organicmatter content was decreased. By contrast, at Brandkop,where native vegetation was sparse and initial soil organicmatter content was low, increased organic matter returnsdominated and organic C was increased by establishmentof annual pastures.
The fact that, at all sites, organic matter content wasappreciably less under annual than permanent pasture isattributable to the loss of organic matter caused by annualrotary cultivation and conversely the lack of tillage underpermanent kikuyu pasture. In addition, organic matterinputs from annual pastures will be low in the summerperiod because the recently-sown grass is only small.
Microbial biomass and microbial activity
As in several other studies (Kassim et al. 1982; Haynes1999a), we used the K2SO4-extractable C fraction as ameasure of the labile pool of soil organic C. It representedonly 0.25–0.60% of total organic C and is probablymainly soluble C in solution (Bolan et al. 1996; Haynes2000). The fact that it is a labile fraction means thatchanges and/or differences in C turnover may bedetectable even where total organic C content remainsunchanged or shows a different trend. For example,extractable C concentrations were greatest under perma-nent kikuyu pastures at all the sites, even at Kenmorewhere this is not the case for organic C (Fig. 2). Thisreflects the high turnover of organic matter that occursunder a highly productive, grazed pasture (Haynes andWilliams 1993) which maintains high concentrations oforganic matter in soil solution (Sarathchandra et al. 1988;Haynes 2000). Because soluble C is directly available as asubstrate for microbes it is not surprising that themicrobial biomass C and microbial activity (basal respi-ration) of the microbial community showed a similartrend, being greatest under kikuyu pastures at each site.
The lower microbial biomass C and basal respirationunder native vegetation than kikuyu pasture at Kenmoremay not only be related to greater C turnover under thepasture but also to the very low soil pH (i.e. 4.1) under thenative vegetation. Soil acidity is known to be an importantfactor that can limit microbial size and activity (Tate1995).
The fact that organic C content was positivelycorrelated with most of the other measured propertiesemphasizes the central role that it plays in determiningsoil microbiological quality (Gregorich et al. 1997). Asshown in many other studies (Dalal 1998), microbial
biomass C was positively correlated with soil organic Ccontent. Nonetheless, the fact that microbial biomass Cexpressed as a percentage of organic C was significantlycorrelated with microbial biomass C values but not withthose for organic C (Table 1) emphasizes the fact thatchanges in the size of the microbial biomass can occurindependently of changes in organic C content.
An increase in the metabolic quotient has beeninterpreted as a response by microflora to adverseconditions, either environmental stress or disturbance(Wardle and Ghani 1995). As expected, lowest valueswere observed under native vegetation (i.e. climaxecosystems; Insam and Domsch 1988; Insam and Hasel-wandter 1989). The negative correlation observed be-tween the metabolic quotient and the percentage oforganic C present as microbial biomass C (Table 1)occurs because factors that cause stress to the microbialcommunity generally also limit its size. The highest valuefor metabolic quotient was recorded under annual pastureat Brandkop. FDA hydrolysis and arginine ammonifica-tion rate per unit of microbial biomass C were alsohighest under this treatment. Thus, the soil in this fieldhad a very small microbial biomass with an unusuallyhigh metabolic activity. Differences in the composition ofthe microbial community between sites probably explainsuch differences.
The rates of FDA hydrolysis and arginine ammonifi-cation have both been used as indices of soil microbialactivity (Schn�rer and Rosswall 1982; Alef and Kleiner1987; Bonde et al. 2001). Both were strongly correlatedwith each other and with organic C content but they wereless strongly correlated with microbial biomass C (Ta-ble 1). While the FDA hydrolysis rate was correlated withbasal respiration, arginine ammonification was not. Amajor contributor to the closeness, or otherwise, of thesecorrelations was that at the Kenmore site, organic Ccontent and rates of arginine ammonification and FDAhydrolysis were higher under native forest than kikuyupasture yet the reverse was the case for microbial biomassC, the percentage of organic C present as microbialbiomass C and basal respiration. That is, the smallermicrobial biomass under native forest had a lowerrespiration rate but greater enzymatic capacity to am-monify arginine endocellularly or hydrolyse FDA. Itseems possible that the composition of the microbialcommunity in the acidic forest soil at Kenmore differedappreciably from that which predominated in the others.For example, a low pH would favour fungi over bacteriaand vice versa (Tate 1995).
Aggregate stability
Since organic matter is central to the formation andstabilization of soil aggregates (Tisdall and Oades 1982)there is normally a close correlation between soil organicmatter content and water stable aggregation (Haynes andBeare 1996). The significant correlation observed heresuggests that over the range of soils and sites studied, the
177

binding actions of humic substances were playing animportant role in aggregation. Nonetheless, the signifi-cantly closer correlations with K2SO4-extractable C,microbial biomass C and basal respiration (Table 1)indicated that both microbial size and activity have anextremely important role in aggregation. That highestaggregate stability occurred under permanent kikuyupastures at each of the sites is not surprising. Aggregationis promoted by the production of large quantities ofpolysaccharide binding agents by the large microbialbiomass in the pasture rhizosphere and the enmeshingeffects of the fine grass roots and associated mycorrhizalhyphae (Tisdall and Oades 1982).
In agreement with values for organic C and themicrobial biomass and microbial activity, aggregatestability was lower under annual than kikuyu pasture ateach site. Such findings confirm field observations thathave revealed surface capping, poor germination andearly seedling growth, lack of pasture longevity, evidenceof surface and subsoil compaction and loss of soil viawind erosion under annual pastures. Such problems arenot generally encountered under kikuyu pastures.
It is concluded that soil organic C, microbial biomassand activity, and aggregate stability were lower underannual ryegrass than permanent kikuyu pastures due tothe degrading effect of annual tillage using a rotarycultivator on soil organic matter and the positive effect ofpermanent pasture on soil microbial activity and aggre-gation. As a result, soils under annual pasture are moresusceptible to structural breakdown and compaction. Themost obvious way to improve soil organic matter statusand related microbiological and physical properties in thesurface soil under annual pastures would be to changefrom conventional to zero tillage. In the future, thepractice of direct drilling annual pastures should beseriously considered.
Acknowledgements We are indebted to the farm owners andmanagers who gave us access to their fields, and the TsitsikammaMilk Producers Group who funded the research and provided apostgraduate student bursary to the senior author.
References
Alef K, Kleiner D (1987) Applicability of arginine ammonificationas an indicator of microbial activity in different soils. BiolFertil Soils 5:148–151
Anderson JPE (1982) Soil respiration. In: Page AL (ed) Methods ofsoil analysis, part 2, 2nd edn. Soil Science Society of America,Madison, Wisc., pp 837–871
Baldock JA, Nelson PN (2000) Soil organic matter. In: Sumner ME(ed) Handbook of soil science. CRC Press, Boca Raton, Fla., ppB25–B84
Blakemore LC, Searle PL, Daly BK (1972) Methods for chemicalanalysis of soils. New Zealand Soil Bureau Report 10A.Government Printer, Wellington
Bolan NS, Baskaran S, Thiagarajan S (1996) An evaluation of themethods of measurement of dissolved organic carbon in soils,manures, sludges and stream water. Commun Soil Sci PlantAnal 27:2723–2737
Bonde TA, Nielsen TH, Miller M, Sørensen J (2001) Arginineammonification assay as a rapid index of gross mineralizationin agricultural soils. Biol Fertil Soils 34:179–184
Dalal RC (1998) Soil microbial biomass—what do the numbersreally mean? Aust J Exp Agric 38:649–665
Doran JW, Sarrantonio M, Liebig MA (1996) Soil health andsustainability. Adv Agron 56:1–54
Fenton TE, Brown JR, Mausbach MJ (1999) Effects of long-termcropping on organic matter content of soils: implications forsoil quality. In: Lal R (ed) Soil quality and soil erosion. CRCPress, Boca Raton, Fla., pp 95–124
Franzluebbers AJ, Zuberer DA, Hons FM (1995) Comparison ofmicrobiological methods for evaluating quality and fertility ofsoil. Biol Fertil Soils 19:135–140
Gregorich EG, Carter MR, Doran JW, Pankhurst CE, Dwyer LM(1997) Biological attributes of soil quality. In: Gregorich EG,Carter MR (eds) Soil quality for crop production and ecosystemhealth. Elsevier, Amsterdam, pp 81–113
Haynes RJ (1993) Effect of sample pre-treatment on aggregatestability measured by wet sieving or turbidimetry on soils ofdifferent cropping histories. J Soil Sci 44:261–270
Haynes RJ (1999a) Labile organic matter fractions and aggregatestability under short-term, grass-based leys. Soil Biol Biochem31:1821–1830
Haynes RJ (1999b) Size and activity of the soil microbial biomassunder grass and arable management. Biol Fertil Soils 30:210–216
Haynes RJ (2000) Labile organic matter as an indicator of organicmatter quality in arable and pastoral soils in New Zealand. SoilBiol Biochem 32:211–219
Haynes RJ, Beare MH (1996) Aggregation and organic matterstorage in meso-thermal, humid soils. In: Carter MR, StewartBA (eds) Advances in soil science. Structure and organic matterstorage in agricultural soils. CRC Press, Boca Raton, Fla., pp213–262
Haynes RJ, Williams PH (1993) Nutrient cycling and soil fertilityin the grazed pasture ecosystem. Adv Agron 49:119–199
Insam H, Domsch KH (1998) Relationship between soil organiccarbon and microbial biomass on chronosequences of reclama-tion sites. Microb Ecol 15:177–188
Insam H, Haselwanter K (1989) Metabolic quotient of soil micro-flora in relation to plant succession. Oecologia 79:174–178
Janzen HH, Campbell CA, Ellert BH, Bremer E (1997) Soil organicmatter dynamics and their relationship to soil quality. In:Gregorich EG, Carter MR (eds) Soil quality for crop productionand ecosystem health. Elsevier, Amsterdam, pp 277–291
Kassim G, Martin JP, Haider K (1982) Incorporation of a widevariety of organic substrate carbons into the soil biomass asestimated by the fumigation procedure. Soil Sci Soc Am J45:1106–1112
Ladd JN, Foster RC, Nannipieri P, Oades JM (1996) Soil structureand biological activity. In: Stotzky G, Bollag JM (eds) Soilbiochemistry, vol 9. Dekker, New York, pp 23–78
Sarathchandra SU, Perrott KW, Boase MR, Waller JE (1998)Seasonal changes and the effects of fertilizers on somechemical, biochemical and microbiological characteristics ofhigh-producing pastoral soil. Biol Fertil Soils 6:328–335
Schn�rer J, Rosswall T (1982) Fluorescein diacetate hydrolysis as ameasure of total microbial activity in soil and litter. ApplEnviron Microbiol 43:1256–1261
Soil Classification Working Group (1991) Classification. A taxo-nomic system for South Africa. Soil and Irrigation ResearchInstitute, Department of Agricultural Development, Pretoria
Tate RL (1995) Soil microbiology. Wiley, New YorkTisdall JM, Oades JM (1982) Organic matter and water stable
aggregates in soils. J Soil Sci 33:141–163Vance ED, Brookes PC, Jenkinson DS (1987) An extraction
method for measuring microbial biomass C. Soil Biol Biochem19:703–707
Wardle DA, Ghani A (1995) A critique of the microbial metabolicquotient (qCO2) as a bioindicator of disturbance and ecosystemdevelopment. Soil Biol Biochem 27:1601–1610
178