soil organic carbon stock and fractions in relation to land use and soil depth in the degraded...
TRANSCRIPT
land degradation & developmentLand Degrad. Develop. (2012)
Published online in Wiley Online Library (wileyonlinelibrary.com) DOI: 10.1002/ldr.2151
SOIL ORGANIC CARBON STOCK AND FRACTIONS IN RELATION TO LANDUSE AND SOIL DEPTH IN THE DEGRADED SHIWALIKS HILLS OF LOWER
HIMALAYAS
DEBASISH-SAHA, S.S. KUKAL* AND S.S. BAWADepartment of Soil Science, Punjab Agricultural University, Ludhiana 141004, India
Received: 12 February 2011; Revised: 30 January 2012; Accepted: 7 February 2012
ABSTRACT
The proportional differences in soil organic carbon (SOC) and its fractions under different land uses are of significance for understanding theprocess of aggregation and soil carbon sequestration mechanisms. A studywas conducted in a mixed vegetation cover watershedwith forest, grass,cultivated and eroded lands in the degraded Shiwaliks of the lower Himalayas to assess land-use effects on profile SOC distribution and storage andto quantify the SOC fractions in water-stable aggregates (WSA) and bulk soils. The soil samples were collected from eroded, cultivated, forest andgrassland soils for the analysis of SOC fractions and aggregate stability. The SOC in eroded surface soils was lower than in less disturbed grassland,cultivated and forest soils. The surface and subsurface soils of grassland and forest lands differentially contributed to the total profile carbon stock.The SOC stock in the 1.05-m soil profile was highest (83.5Mgha�1) under forest and lowest (55.6Mgha�1) in eroded lands. The SOC stock in thesurface (0–15 cm) soil constituted 6.95, 27.6, 27 and 42.4 per cent of the total stock in the 1.05-m profile of eroded, cultivated, forest and grasslandsoils, respectively. The forest soils were found to sequester 22.4Mgha�1 more SOC than the cultivated soils as measured in the 1.05-m soilprofiles. The differences in aggregate SOC content among the land uses were more conspicuous in bigger water-stable macro-aggregates(WSA> 2mm) than in water-stable micro-aggregates (WSA< 0.25mm). The SOC in micro-aggregates (WSA< 0.25mm) was found to be lessvulnerable to changes in land use. The hot water soluble and labile carbon fractions were higher in the bulk soils of grasslands than in the individualaggregates, whereas particulate organic carbon was higher in the aggregates than in bulk soils. Copyright © 2012 John Wiley & Sons, Ltd.
keywords: carbon sequestration; forest land use; hot water soluble carbon; labile carbon; soil aggregation; water-stable aggregates; soil organic carbon;India
INTRODUCTION
Quantification of profile soil carbon (C) stock under differentterrestrial ecosystems is a valuable input towards C budgetingand ecosystem management. Soils are the largest terrestrialactive sink for atmospheric C and have the potentials to miti-gate the effect of global warming (Singh and Lal, 2005). Thesoil organic carbon (SOC) pool contains approximately twiceas much C as the atmosphere and 2.5-times as much C as thebiosphere. The SOC maintains soil physical (Rehana-Rasoolet al., 2008) and biochemical quality (Benbi and Chand,2007). The recent concern of many scientific communitiesover increasing atmospheric CO2 has resulted in an increasedinterest in studying SOC dynamics and C sequestrationpotential in various ecosystems. Land use, land-use changesand soil erosion are the paramount factors affecting SOCpools at watershed scale (Shrestha et al., 2004) apart from soildepth (Kaiser et al., 2002). For example, the mechanism of Csequestration is different for grassland and forest soils becauseof the obvious differences in their root architecture and density
*Correspondence to: S.S. Kukal, Department of Soil Science, PunjabAgricultural University, Ludhiana 141004, India.E-mail: [email protected]
Copyright © 2012 John Wiley & Sons, Ltd.
(Six et al., 2000). Appropriate land use and soil managementcan lead to an increase in SOC, improve physical andbiochemical soil quality and partially mitigate the rise of atmo-spheric CO2 (Lal and Bruce, 1999). Cultivation leads to signif-icant decrease in SOC and soil structural stability (Eynard et al.,2004). The studies related to comparison of SOC stock in soilprofiles under different land uses thus need to be carried outin different ecosystems particularly degraded ones.The confinement of SOC in deeper layers of forest subsoil is
of critical importance for long-term C sequestration as it is lessvulnerable to changes induced because of human manipula-tions and higher turnover period. Most of the studiesconcerning the C input and output between soil and atmo-sphere have generally considered surface soils for thispurpose. However, important stable SOC pools could alsobe stored at greater depths (Meersmans et al., 2009). Thus,mere consideration of surface soil C would have little accuracyin producing an effective ecosystem C budget. The inputs ofroot C to the deeper soil SOC pool may be small comparedwith above-ground biomass but it is actively exchanging withthe atmospheric C and could be an important contributorto total soil CO2 efflux. Thus, studies on profile C storagewould generate some important ecological information. The
D. SAHA ET AL.
extensive deep root system of forest trees facilitates the transferof SOC into the deeper soil profile, whereas the intricate net-work of finer but denser root mass under grasses favours smallerbut stable aggregates in which C could have stabilized in theshallow layer of the surface soils. Moreover, eroded lands couldproduce a different picture in the deeper soil layers as comparedwith the surface soils where most of the SOC has been removedby runoff water, whereas the deep soil buried SOC might haveescaped loss. A loss of SOC due to soil erosion and incompat-ible land use change degrades the soil ecosystem and environ-mental quality (Lal, 2002). Thus, for a better understanding ofthe profile C balance, the SOC dynamics in deeper soil layersunder different land uses needs to be studied.The SOC is a complex and heterogeneous entity consisting
of fractions varying in mean residence time (Campbell et al.,1967). Thus, the SOC dynamics under varied land uses andmanagement practices can better be understood by differentialways of C allocation in different pools with differentdecomposition rates (Stevenson, 1994). Soil labile carbon(LC) is a dynamic pool of SOC, accounting for much of thefluctuation over time (Huggins et al., 1998) and with land-use change. Soil aggregation and SOC protection are propor-tionally related. The water-stable aggregates (WSA) providea physical resistance to the microbes that can decompose theC encapsulated within it and also protect it from loss due towater erosion. Some of the SOC fractions like particulateorganic carbon (POC) are more responsible for water stabilityof aggregates (Debasish-Saha et al., 2011). Being a labileintermediate fraction, the POC can be used as an early indica-tor of changes in C dynamics and total SOC under differentland uses and management systems (Pikul et al., 2007). Itaccumulates rapidly under soils with minimized disturbance(Cambardella and Elliott, 1992). Furthermore, the differencesin SOC fractions under different land uses can yield significantinformation related to the mechanism of C sequestration(Blanco-Canqui and Lal, 2004).The human-induced degradation of land in most fragile
Shiwaliks (Hill) region of the lower Himalayas is very rapidbecause of soil erosion by water. This leads to a large-scaleerosion of soil along with SOC, leading to downstreamsedimentation. The different land uses in the region have beenreported to affect the SOC (Gupta et al., 2009; Debasish-Sahaet al., 2011). The conversion of natural forest and grasslandinto arable lands accompanied by severe soil erosion hazardsis very predominant in the region, resulting in degradation ofsoil quality. Basic background information on the differentialprofile distribution pattern of SOC under different terrestrialecosystems, is lacking in this part of India, and there is acritical need to frame the land management packages anddevelop a sound ecosystem C budget. The present study wasthus conducted with an aim to quantify the profile variabilityin SOC stock and understand the dynamics of SOC fractionsunder different land uses in the region.
Copyright © 2012 John Wiley & Sons, Ltd.
MATERIALS AND METHODS
Study site descriptions
A mixed watershed (Hoshiarpur District of northwest India)located in the foothills of the lower Shiwaliks in the lowerHimalayas was selected for the investigation. It is situated atan altitude of 355m above the mean sea-level and is one ofthe most fragile regions of the lower Himalayas. This regionhas semi-arid to sub-humid type of climate and lies between31�12′N latitude and 76�14′E longitude. The mean maximumtemperatures vary from 18.6 �C in the month of January to39.1 �C in May, whereas the mean minimum temperaturesvary from 5.2 �C in the month of December to 24.7 �C in June.The region receives an annual rainfall of 850–1100mm witha high coefficient of variation. About 80 per cent of theannual rainfall is received during a short period of 3months(July to September), whereas the remaining 20 per cent isreceived during the months of October to March. The proba-bility of occurrence of at least one dry spell greater than6 days during individual months is between 55 and 99 percent (Sur et al., 1998). The rainfall during the months ofJuly to September is ill distributed, and the droughts occurfrequently. The erosion of sediments by the runoff waterfrom the hillslopes and their subsequent deposition at thefoot slopes is a continuous process in the region. The soilsare non-saline sandy clay-loam with low to moderate waterretention capacity (Table I).
Land-use characteristics
Eroded, cultivated, forest and grasslands were selected in amixed watershed. The eroded lands constituted 18 per centof total land area (mainly under gullies), whereas the culti-vated arable, forest and grass lands constituted 54, 18 and 10per cent of the total land area of the watershed. The erodedlands were previously under forest trees, which were lostthrough human-induced destruction of the natural ecosystem(severe deforestation). This has led to severe soil erosionincluding rill and gully erosion. The eroded lands are basicallyexposed to the direct action of the rain drops because of lack ofvegetation cover or very sparsely distributed small herbs andgrasses in some depressions. Thus, there is less return of litterto these soils to maintain the SOC status particularly in the sur-face layers. At the same time, continuous runoff during severerainstorms washes away the finer soil particles along withSOC and thus aggravates the degradation process. Thecultivated lands were either level or gently-sloping (0.5–2per cent slope steepness), located towards the toe positionof the watershed. These cultivated arable lands are com-monly used for growing corn (Zea mays L) in the summerseason (June–October) and wheat (Triticum aestivum L)during the winter season (November–April). The slopesteepness varied from 5 to 8 per cent under forest land, 3 to5 per cent under grassland and 8 to 10 per cent under eroded
LAND DEGRADATION & DEVELOPMENT (2012)
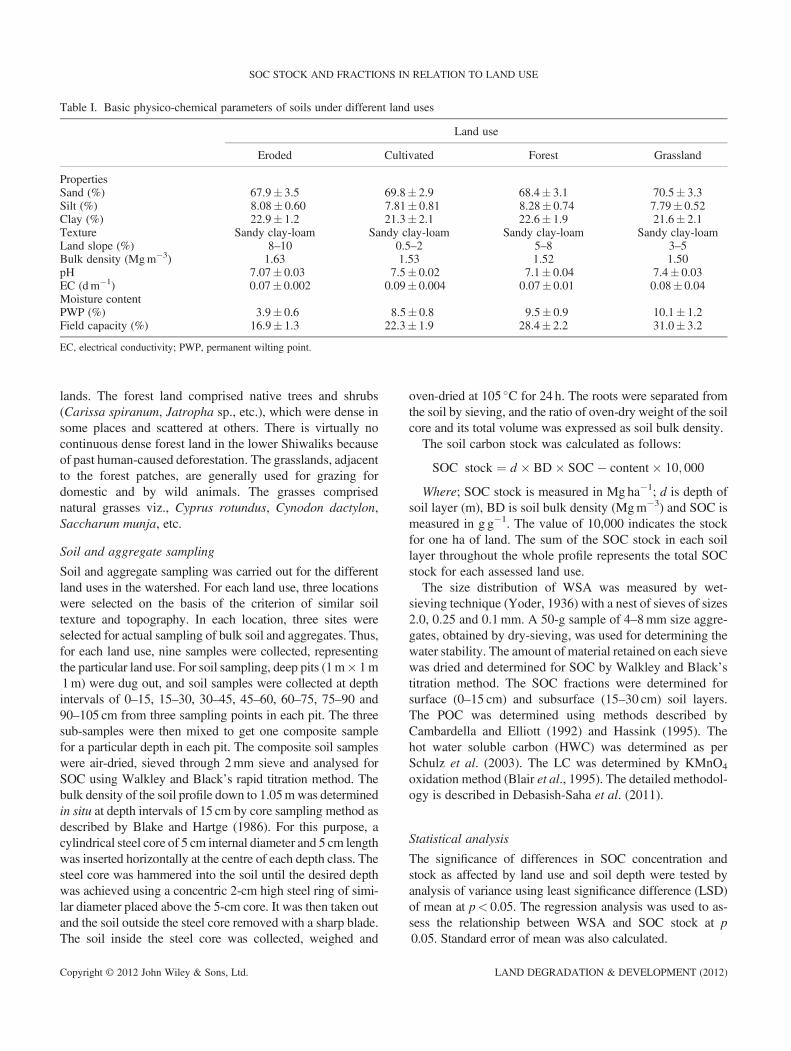
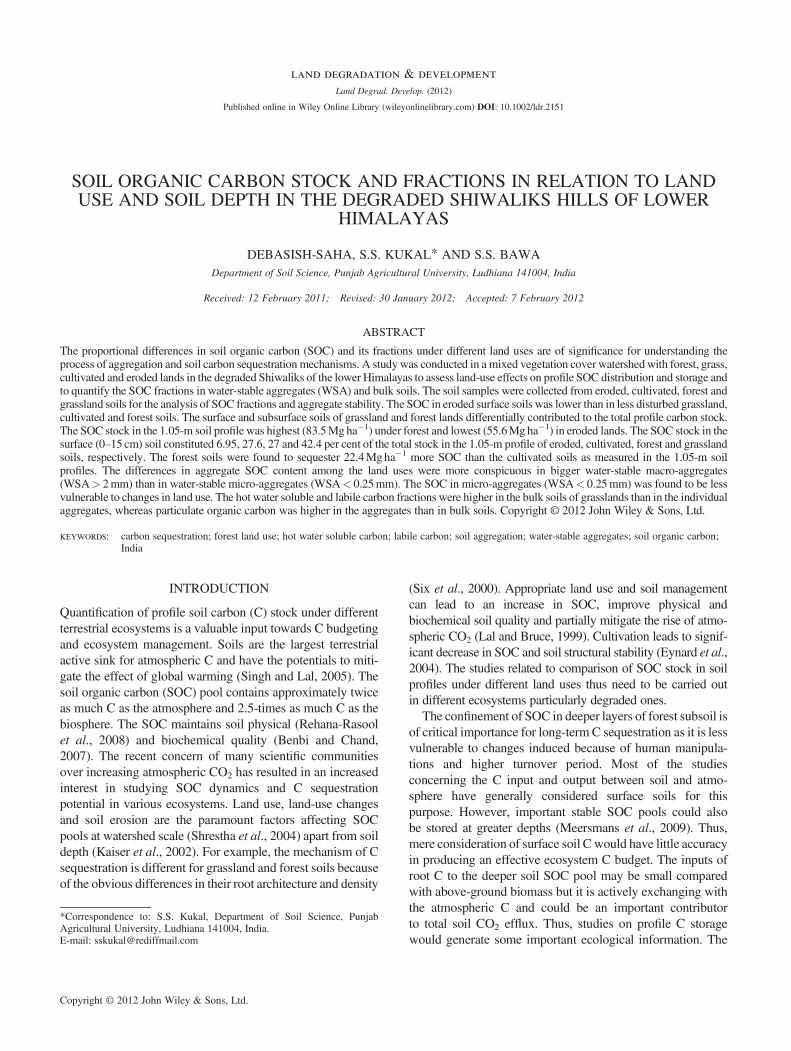
Table I. Basic physico-chemical parameters of soils under different land uses
Land use
Eroded Cultivated Forest Grassland
PropertiesSand (%) 67.9� 3.5 69.8� 2.9 68.4� 3.1 70.5� 3.3Silt (%) 8.08� 0.60 7.81� 0.81 8.28� 0.74 7.79� 0.52Clay (%) 22.9� 1.2 21.3� 2.1 22.6� 1.9 21.6� 2.1Texture Sandy clay-loam Sandy clay-loam Sandy clay-loam Sandy clay-loamLand slope (%) 8–10 0.5–2 5–8 3–5Bulk density (Mgm�3) 1.63 1.53 1.52 1.50pH 7.07� 0.03 7.5� 0.02 7.1� 0.04 7.4� 0.03EC (dm�1) 0.07� 0.002 0.09� 0.004 0.07� 0.01 0.08� 0.04Moisture contentPWP (%) 3.9� 0.6 8.5� 0.8 9.5� 0.9 10.1� 1.2Field capacity (%) 16.9� 1.3 22.3� 1.9 28.4� 2.2 31.0� 3.2
EC, electrical conductivity; PWP, permanent wilting point.
SOC STOCK AND FRACTIONS IN RELATION TO LAND USE
lands. The forest land comprised native trees and shrubs(Carissa spiranum, Jatropha sp., etc.), which were dense insome places and scattered at others. There is virtually nocontinuous dense forest land in the lower Shiwaliks becauseof past human-caused deforestation. The grasslands, adjacentto the forest patches, are generally used for grazing fordomestic and by wild animals. The grasses comprisednatural grasses viz., Cyprus rotundus, Cynodon dactylon,Saccharum munja, etc.
Soil and aggregate sampling
Soil and aggregate sampling was carried out for the differentland uses in the watershed. For each land use, three locationswere selected on the basis of the criterion of similar soiltexture and topography. In each location, three sites wereselected for actual sampling of bulk soil and aggregates. Thus,for each land use, nine samples were collected, representingthe particular land use. For soil sampling, deep pits (1m� 1m1m) were dug out, and soil samples were collected at depthintervals of 0–15, 15–30, 30–45, 45–60, 60–75, 75–90 and90–105 cm from three sampling points in each pit. The threesub-samples were then mixed to get one composite samplefor a particular depth in each pit. The composite soil sampleswere air-dried, sieved through 2mm sieve and analysed forSOC using Walkley and Black’s rapid titration method. Thebulk density of the soil profile down to 1.05mwas determinedin situ at depth intervals of 15 cm by core sampling method asdescribed by Blake and Hartge (1986). For this purpose, acylindrical steel core of 5 cm internal diameter and 5 cm lengthwas inserted horizontally at the centre of each depth class. Thesteel core was hammered into the soil until the desired depthwas achieved using a concentric 2-cm high steel ring of simi-lar diameter placed above the 5-cm core. It was then taken outand the soil outside the steel core removed with a sharp blade.The soil inside the steel core was collected, weighed and
Copyright © 2012 John Wiley & Sons, Ltd.
oven-dried at 105 �C for 24 h. The roots were separated fromthe soil by sieving, and the ratio of oven-dry weight of the soilcore and its total volume was expressed as soil bulk density.The soil carbon stock was calculated as follows:
SOC stock ¼ d � BD� SOC� content� 10; 000
Where; SOC stock is measured in Mg ha�1; d is depth ofsoil layer (m), BD is soil bulk density (Mgm�3) and SOC ismeasured in g g�1. The value of 10,000 indicates the stockfor one ha of land. The sum of the SOC stock in each soillayer throughout the whole profile represents the total SOCstock for each assessed land use.The size distribution of WSA was measured by wet-
sieving technique (Yoder, 1936) with a nest of sieves of sizes2.0, 0.25 and 0.1mm. A 50-g sample of 4–8mm size aggre-gates, obtained by dry-sieving, was used for determining thewater stability. The amount of material retained on each sievewas dried and determined for SOC by Walkley and Black’stitration method. The SOC fractions were determined forsurface (0–15 cm) and subsurface (15–30 cm) soil layers.The POC was determined using methods described byCambardella and Elliott (1992) and Hassink (1995). Thehot water soluble carbon (HWC) was determined as perSchulz et al. (2003). The LC was determined by KMnO4
oxidation method (Blair et al., 1995). The detailed methodol-ogy is described in Debasish-Saha et al. (2011).
Statistical analysis
The significance of differences in SOC concentration andstock as affected by land use and soil depth were tested byanalysis of variance using least significance difference (LSD)of mean at p< 0.05. The regression analysis was used to as-sess the relationship between WSA and SOC stock at p0.05. Standard error of mean was also calculated.
LAND DEGRADATION & DEVELOPMENT (2012)
D. SAHA ET AL.
RESULTS AND DISCUSSION
Soil organic carbon concentration
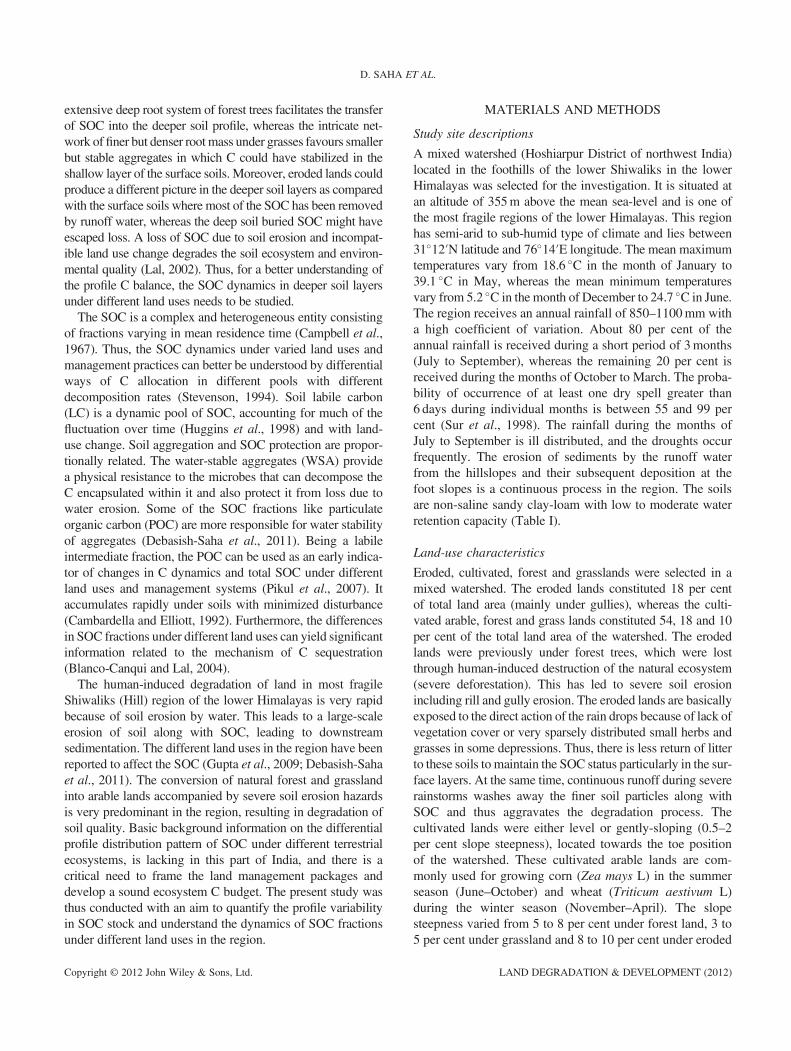
In the surface soil layers (0–15 cm), the concentration ofSOC was significantly (p< 0.05) different among theassessed land uses (Table II). The grassland soils displayedthe highest amount of SOC (13.2 g kg�1), whereas theeroded soil had the lowest concentration of SOC (1.95 gkg�1). The eroded surface soils (0–15 cm) had 79 and 73per cent lower SOC than that under forest and cultivatedland, respectively, the difference being significant at 5 percent level of significance (Table II). This could be due tothe loss of SOC with the sediments and runoff water fromthe surface soil of the eroded lands. In general, there was adecreasing trend of SOC with soil depth in all the land usesexcept for the eroded soils where there was a successive in-crease in SOC concentration down the profile (Table II). Thehigher amount of SOC in deeper layers of eroded soil wasdue to the fact that these soils were in the past under foresttrees, and because of deforestation and subsequent soil ero-sion by water, the SOC from the surface layers got removedalong with the sediments (Kukal et al., 1991). The highestdecrease in SOC in the subsurface soil layers (15–30 cm)was recorded for grassland soils (62.4 per cent) followedby 34 per cent for cultivated and lowest (27 per cent) forforest soils. Except for the surface soils (0–15 cm), the forestsoils recorded the highest SOC among all the land uses.No significant (p< 0.05) difference in SOC was observedbetween cultivated and grassland soils below 45 cm soil depth.The highest amount of SOC was found in the surface grass-land soils and could be attributed to the higher root mass den-sity of the shallow intricate grass roots (Kukal et al., 2008).The higher root mass density increases the WSA and SOCby secreting root exudates rich in binding agents, increasingphysical stability and microbial activity (Holeplass et al.,2004). Nakagami et al. (2009) observed that a substantial
Table II. Profile distribution of soil organic carbon concentration(g kg�1) under different land uses
Soildepth Land use(cm)
Eroded Cultivated Forest GrasslandLSD(0.05)
0–15 1.95al 7.23b 10.2c 13.2d 1.5715–30 2.50a 4.72b 7.01c 4.96b 0.3830–45 3.24a 4.36b 4.73b 3.27a 0.4045–60 3.68a 3.38a 4.85b 3.48a 0.7760–75 3.98a 2.55b 4.95c 2.80b 0.8075–90 3.67a 2.21b 4.93c 2.25b 0.8090–105 3.73a 1.70b 4.67c 1.70b 0.95
Lower case letters indicate differences (at the 0.05 probability level) in SOCconcentration at each depth classes among different land uses.
Copyright © 2012 John Wiley & Sons, Ltd.
amount of C can be accumulated in the topsoil layers ofpasture lands. However, the higher SOC content in forest soilsin deeper layers compared with those for other land usesindicates the role of biomass input through roots of forest trees(Gibbon et al., 2010) and leaching of dissolved organic C(Shrestha et al., 2004) in increasing the deep soil C allocation.
Soil organic carbon stock and sequestration
The total SOC stock in the 1.05-m soil profile was highestfor forest land (83.5Mg ha�1), followed by grassland(73.0Mg ha�1) and cultivated (61.1Mg ha�1) and lowestfor eroded (55.6Mg ha�1) soils (Table III). The forest soilscould store 14.4, 36.7 and 50.2 per cent higher total SOCstock than grassland, cultivated and eroded land soils,respectively. The variation of SOC stock under differentland uses is significantly prominent in the surface (0–15 cm)soils, and the difference becomes narrow with increasing soildepth. The 0–15 cm layer for grassland soils contributed42.5� 6.5 per cent of the total SOC stock in the entire 1.05-m profile, whereas it was 27� 6.9, 27.6� 6.1 and 6.9� 5.8per cent for forest, cultivated and eroded soils, respectively(Figure 1). In 15–30 cm soil layer, the forest soils had the high-est pool of SOC (16.0Mgha�1), followed by grassland(11.9Mgha�1), cultivated (11.2Mgha�1) and eroded soils(6.20Mgha�1) (Table III). In subsequent soil layers, theSOC stock decreased sharply for all the land uses excepteroded lands, where it increased till 45–60 cm soil layers. Itwas almost similar down to 90 cm soil depth, after which itdecreased sharply by 50 per cent in eroded lands. In cultivatedsoils, the SOC stock decreased consistently till 90 cm depthafter which it sharply declined by 50 per cent (2.8Mgha�1)(Table III). As for other land uses, the grassland soils alsoshowed a sharp decline in SOC stock below 90 cm depth. Thisindicates that most of the active C cycling for all the land usesoccurs within the first 0–90 cm of the soil profile. For forest
Table III. Soil organic carbon stock (Mg ha�1) in different soillayers under different land uses
Soildepth Land use(cm)
Eroded Cultivated Forest GrasslandLSD(0.05)
0–15 4.76a 16.6b 23.2c 30.0d 2.4115–30 6.20a 11.2b 16.0c 11.9b 2.1330–45 8.97ab 9.93a 10.0a 7.61b 1.5245–60 10.4a 8.35b 9.70a 8.10b 0.7460–75 10.0a 6.42b 10.4a 6.44b 0.4175–90 10.1a 5.54b 9.23a 5.30b 1.0190–105 5.38a 2.80b 6.71c 2.73b 0.36Total
(0–105)55.6 61.1 85.2 72.0
Lower case letters indicate differences (at the 0.05 probability level) in SOCstock at each depth classes among different land uses.
LAND DEGRADATION & DEVELOPMENT (2012)
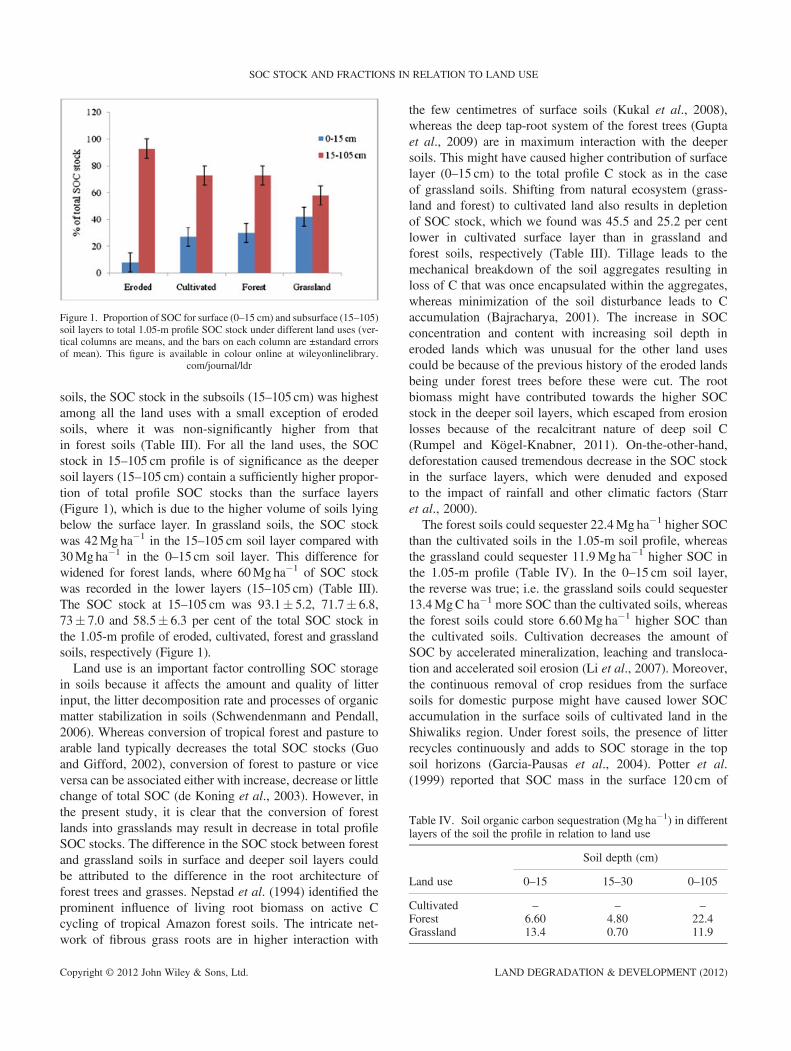
Figure 1. Proportion of SOC for surface (0–15 cm) and subsurface (15–105)soil layers to total 1.05-m profile SOC stock under different land uses (ver-tical columns are means, and the bars on each column are ±standard errorsof mean). This figure is available in colour online at wileyonlinelibrary.
com/journal/ldr
Table IV. Soil organic carbon sequestration (Mg ha�1) in differentlayers of the soil the profile in relation to land use
Land use
Soil depth (cm)
0–15 15–30 0–105
Cultivated – – –Forest 6.60 4.80 22.4Grassland 13.4 0.70 11.9
SOC STOCK AND FRACTIONS IN RELATION TO LAND USE
soils, the SOC stock in the subsoils (15–105 cm) was highestamong all the land uses with a small exception of erodedsoils, where it was non-significantly higher from thatin forest soils (Table III). For all the land uses, the SOCstock in 15–105 cm profile is of significance as the deepersoil layers (15–105 cm) contain a sufficiently higher propor-tion of total profile SOC stocks than the surface layers(Figure 1), which is due to the higher volume of soils lyingbelow the surface layer. In grassland soils, the SOC stockwas 42Mgha�1 in the 15–105 cm soil layer compared with30Mgha�1 in the 0–15 cm soil layer. This difference forwidened for forest lands, where 60Mgha�1 of SOC stockwas recorded in the lower layers (15–105 cm) (Table III).The SOC stock at 15–105 cm was 93.1� 5.2, 71.7� 6.8,73� 7.0 and 58.5� 6.3 per cent of the total SOC stock inthe 1.05-m profile of eroded, cultivated, forest and grasslandsoils, respectively (Figure 1).Land use is an important factor controlling SOC storage
in soils because it affects the amount and quality of litterinput, the litter decomposition rate and processes of organicmatter stabilization in soils (Schwendenmann and Pendall,2006). Whereas conversion of tropical forest and pasture toarable land typically decreases the total SOC stocks (Guoand Gifford, 2002), conversion of forest to pasture or viceversa can be associated either with increase, decrease or littlechange of total SOC (de Koning et al., 2003). However, inthe present study, it is clear that the conversion of forestlands into grasslands may result in decrease in total profileSOC stocks. The difference in the SOC stock between forestand grassland soils in surface and deeper soil layers couldbe attributed to the difference in the root architecture offorest trees and grasses. Nepstad et al. (1994) identified theprominent influence of living root biomass on active Ccycling of tropical Amazon forest soils. The intricate net-work of fibrous grass roots are in higher interaction with
Copyright © 2012 John Wiley & Sons, Ltd.
the few centimetres of surface soils (Kukal et al., 2008),whereas the deep tap-root system of the forest trees (Guptaet al., 2009) are in maximum interaction with the deepersoils. This might have caused higher contribution of surfacelayer (0–15 cm) to the total profile C stock as in the caseof grassland soils. Shifting from natural ecosystem (grass-land and forest) to cultivated land also results in depletionof SOC stock, which we found was 45.5 and 25.2 per centlower in cultivated surface layer than in grassland andforest soils, respectively (Table III). Tillage leads to themechanical breakdown of the soil aggregates resulting inloss of C that was once encapsulated within the aggregates,whereas minimization of the soil disturbance leads to Caccumulation (Bajracharya, 2001). The increase in SOCconcentration and content with increasing soil depth ineroded lands which was unusual for the other land usescould be because of the previous history of the eroded landsbeing under forest trees before these were cut. The rootbiomass might have contributed towards the higher SOCstock in the deeper soil layers, which escaped from erosionlosses because of the recalcitrant nature of deep soil C(Rumpel and Kögel-Knabner, 2011). On-the-other-hand,deforestation caused tremendous decrease in the SOC stockin the surface layers, which were denuded and exposedto the impact of rainfall and other climatic factors (Starret al., 2000).The forest soils could sequester 22.4Mg ha�1 higher SOC
than the cultivated soils in the 1.05-m soil profile, whereasthe grassland could sequester 11.9Mg ha�1 higher SOC inthe 1.05-m profile (Table IV). In the 0–15 cm soil layer,the reverse was true; i.e. the grassland soils could sequester13.4MgC ha�1 more SOC than the cultivated soils, whereasthe forest soils could store 6.60Mg ha�1 higher SOC thanthe cultivated soils. Cultivation decreases the amount ofSOC by accelerated mineralization, leaching and transloca-tion and accelerated soil erosion (Li et al., 2007). Moreover,the continuous removal of crop residues from the surfacesoils for domestic purpose might have caused lower SOCaccumulation in the surface soils of cultivated land in theShiwaliks region. Under forest soils, the presence of litterrecycles continuously and adds to SOC storage in the topsoil horizons (Garcia-Pausas et al., 2004). Potter et al.(1999) reported that SOC mass in the surface 120 cm of
LAND DEGRADATION & DEVELOPMENT (2012)
D. SAHA ET AL.
agricultural soils was significantly lower than that of nativeAmerican prairie grassland soils. Schwendenmann and Pen-dall (2006) observed that surface (0–5 cm) soil carbon stockwas non-significantly higher under forest than under grass-lands. In fact, the roots of the grasses in Shiwaliks apartfrom being dense and shallow add significant amount ofbiomass in the surface soil layers. Kukal et al. (2008)reported 3.89mg cm�3 higher root mass density in surface(0–15 cm) pasture soils than the forest soils of Shiwaliksregion, whereas in forest soils the deeper root systems ofthe trees lead to accumulation of higher biomass in thedeeper layers, which generally remains protected from theaccelerated decomposition because of lower rate of oxygendiffusion from the atmosphere and substrate limitation(Fontaine et al., 2007) to support the microbial growthand activity in the deeper layers. Gibbon et al. (2010)estimated root C contribution of Puna grassland of about0.05Mg ha�1, whereas it was 13.9Mg ha�1 in forest landsof Peru. Moreover, the root channels created by thedead roots could facilitate easy movement of decomposeddissolved organic matter into the lower layers throughpreferential flow of water, which may not be the casein the Shiwaliks grassland soils.
Soil organic carbon concentration in water-stableaggregates
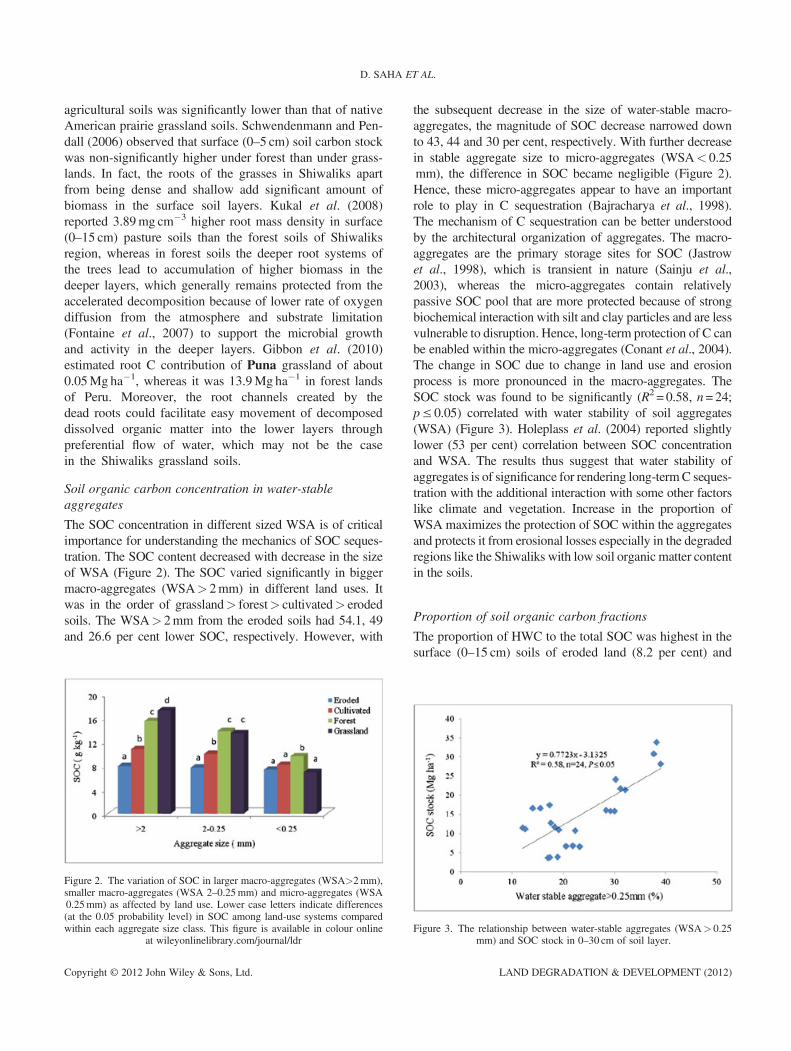
The SOC concentration in different sized WSA is of criticalimportance for understanding the mechanics of SOC seques-tration. The SOC content decreased with decrease in the sizeof WSA (Figure 2). The SOC varied significantly in biggermacro-aggregates (WSA> 2mm) in different land uses. Itwas in the order of grassland> forest> cultivated> erodedsoils. The WSA> 2mm from the eroded soils had 54.1, 49and 26.6 per cent lower SOC, respectively. However, with
Figure 2. The variation of SOC in larger macro-aggregates (WSA>2mm),smaller macro-aggregates (WSA 2–0.25mm) and micro-aggregates (WSA0.25mm) as affected by land use. Lower case letters indicate differences(at the 0.05 probability level) in SOC among land-use systems comparedwithin each aggregate size class. This figure is available in colour online
at wileyonlinelibrary.com/journal/ldr
Copyright © 2012 John Wiley & Sons, Ltd.
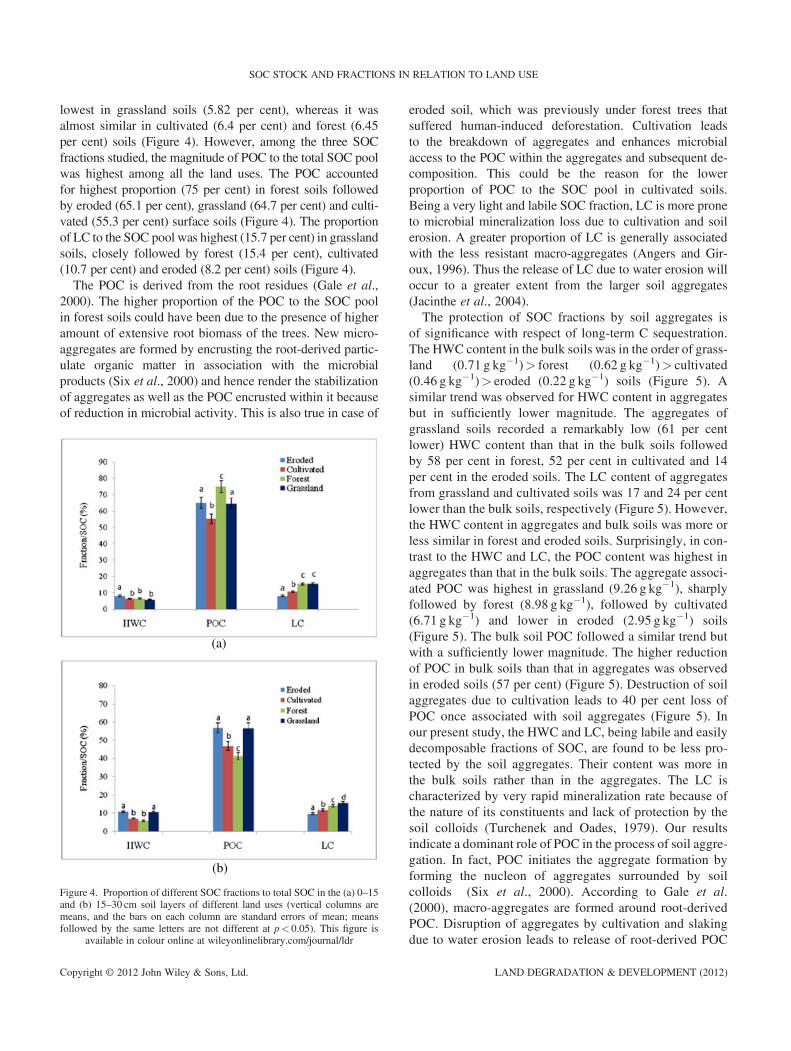
the subsequent decrease in the size of water-stable macro-aggregates, the magnitude of SOC decrease narrowed downto 43, 44 and 30 per cent, respectively. With further decreasein stable aggregate size to micro-aggregates (WSA< 0.25mm), the difference in SOC became negligible (Figure 2).Hence, these micro-aggregates appear to have an importantrole to play in C sequestration (Bajracharya et al., 1998).The mechanism of C sequestration can be better understoodby the architectural organization of aggregates. The macro-aggregates are the primary storage sites for SOC (Jastrowet al., 1998), which is transient in nature (Sainju et al.,2003), whereas the micro-aggregates contain relativelypassive SOC pool that are more protected because of strongbiochemical interaction with silt and clay particles and are lessvulnerable to disruption. Hence, long-term protection of C canbe enabled within the micro-aggregates (Conant et al., 2004).The change in SOC due to change in land use and erosionprocess is more pronounced in the macro-aggregates. TheSOC stock was found to be significantly (R2 = 0.58, n=24;p≤ 0.05) correlated with water stability of soil aggregates(WSA) (Figure 3). Holeplass et al. (2004) reported slightlylower (53 per cent) correlation between SOC concentrationand WSA. The results thus suggest that water stability ofaggregates is of significance for rendering long-termC seques-tration with the additional interaction with some other factorslike climate and vegetation. Increase in the proportion ofWSA maximizes the protection of SOC within the aggregatesand protects it from erosional losses especially in the degradedregions like the Shiwaliks with low soil organic matter contentin the soils.
Proportion of soil organic carbon fractions
The proportion of HWC to the total SOC was highest in thesurface (0–15 cm) soils of eroded land (8.2 per cent) and
Figure 3. The relationship between water-stable aggregates (WSA> 0.25mm) and SOC stock in 0–30 cm of soil layer.
LAND DEGRADATION & DEVELOPMENT (2012)
SOC STOCK AND FRACTIONS IN RELATION TO LAND USE
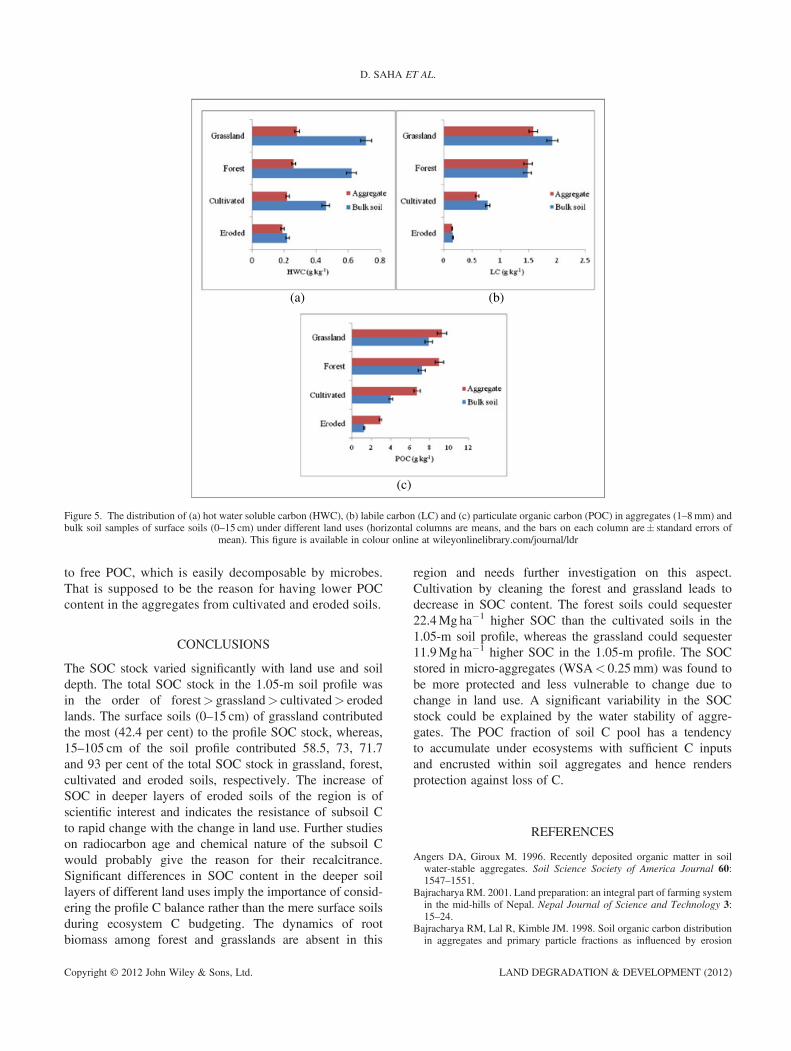
lowest in grassland soils (5.82 per cent), whereas it wasalmost similar in cultivated (6.4 per cent) and forest (6.45per cent) soils (Figure 4). However, among the three SOCfractions studied, the magnitude of POC to the total SOC poolwas highest among all the land uses. The POC accountedfor highest proportion (75 per cent) in forest soils followedby eroded (65.1 per cent), grassland (64.7 per cent) and culti-vated (55.3 per cent) surface soils (Figure 4). The proportionof LC to the SOC pool was highest (15.7 per cent) in grasslandsoils, closely followed by forest (15.4 per cent), cultivated(10.7 per cent) and eroded (8.2 per cent) soils (Figure 4).The POC is derived from the root residues (Gale et al.,
2000). The higher proportion of the POC to the SOC poolin forest soils could have been due to the presence of higheramount of extensive root biomass of the trees. New micro-aggregates are formed by encrusting the root-derived partic-ulate organic matter in association with the microbialproducts (Six et al., 2000) and hence render the stabilizationof aggregates as well as the POC encrusted within it becauseof reduction in microbial activity. This is also true in case of
(a)
(b)
Figure 4. Proportion of different SOC fractions to total SOC in the (a) 0–15and (b) 15–30 cm soil layers of different land uses (vertical columns aremeans, and the bars on each column are standard errors of mean; meansfollowed by the same letters are not different at p< 0.05). This figure is
available in colour online at wileyonlinelibrary.com/journal/ldr
Copyright © 2012 John Wiley & Sons, Ltd.
eroded soil, which was previously under forest trees thatsuffered human-induced deforestation. Cultivation leadsto the breakdown of aggregates and enhances microbialaccess to the POC within the aggregates and subsequent de-composition. This could be the reason for the lowerproportion of POC to the SOC pool in cultivated soils.Being a very light and labile SOC fraction, LC is more proneto microbial mineralization loss due to cultivation and soilerosion. A greater proportion of LC is generally associatedwith the less resistant macro-aggregates (Angers and Gir-oux, 1996). Thus the release of LC due to water erosion willoccur to a greater extent from the larger soil aggregates(Jacinthe et al., 2004).The protection of SOC fractions by soil aggregates is
of significance with respect of long-term C sequestration.The HWC content in the bulk soils was in the order of grass-land (0.71 g kg�1)> forest (0.62 g kg�1)> cultivated(0.46 g kg�1)> eroded (0.22 g kg�1) soils (Figure 5). Asimilar trend was observed for HWC content in aggregatesbut in sufficiently lower magnitude. The aggregates ofgrassland soils recorded a remarkably low (61 per centlower) HWC content than that in the bulk soils followedby 58 per cent in forest, 52 per cent in cultivated and 14per cent in the eroded soils. The LC content of aggregatesfrom grassland and cultivated soils was 17 and 24 per centlower than the bulk soils, respectively (Figure 5). However,the HWC content in aggregates and bulk soils was more orless similar in forest and eroded soils. Surprisingly, in con-trast to the HWC and LC, the POC content was highest inaggregates than that in the bulk soils. The aggregate associ-ated POC was highest in grassland (9.26 g kg�1), sharplyfollowed by forest (8.98 g kg�1), followed by cultivated(6.71 g kg�1) and lower in eroded (2.95 g kg�1) soils(Figure 5). The bulk soil POC followed a similar trend butwith a sufficiently lower magnitude. The higher reductionof POC in bulk soils than that in aggregates was observedin eroded soils (57 per cent) (Figure 5). Destruction of soilaggregates due to cultivation leads to 40 per cent loss ofPOC once associated with soil aggregates (Figure 5). Inour present study, the HWC and LC, being labile and easilydecomposable fractions of SOC, are found to be less pro-tected by the soil aggregates. Their content was more inthe bulk soils rather than in the aggregates. The LC ischaracterized by very rapid mineralization rate because ofthe nature of its constituents and lack of protection by thesoil colloids (Turchenek and Oades, 1979). Our resultsindicate a dominant role of POC in the process of soil aggre-gation. In fact, POC initiates the aggregate formation byforming the nucleon of aggregates surrounded by soilcolloids (Six et al., 2000). According to Gale et al.(2000), macro-aggregates are formed around root-derivedPOC. Disruption of aggregates by cultivation and slakingdue to water erosion leads to release of root-derived POC
LAND DEGRADATION & DEVELOPMENT (2012)
(a) (b)
(c)
Figure 5. The distribution of (a) hot water soluble carbon (HWC), (b) labile carbon (LC) and (c) particulate organic carbon (POC) in aggregates (1–8mm) andbulk soil samples of surface soils (0–15 cm) under different land uses (horizontal columns are means, and the bars on each column are� standard errors of
mean). This figure is available in colour online at wileyonlinelibrary.com/journal/ldr
D. SAHA ET AL.
to free POC, which is easily decomposable by microbes.That is supposed to be the reason for having lower POCcontent in the aggregates from cultivated and eroded soils.
CONCLUSIONS
The SOC stock varied significantly with land use and soildepth. The total SOC stock in the 1.05-m soil profile wasin the order of forest> grassland> cultivated> erodedlands. The surface soils (0–15 cm) of grassland contributedthe most (42.4 per cent) to the profile SOC stock, whereas,15–105 cm of the soil profile contributed 58.5, 73, 71.7and 93 per cent of the total SOC stock in grassland, forest,cultivated and eroded soils, respectively. The increase ofSOC in deeper layers of eroded soils of the region is ofscientific interest and indicates the resistance of subsoil Cto rapid change with the change in land use. Further studieson radiocarbon age and chemical nature of the subsoil Cwould probably give the reason for their recalcitrance.Significant differences in SOC content in the deeper soillayers of different land uses imply the importance of consid-ering the profile C balance rather than the mere surface soilsduring ecosystem C budgeting. The dynamics of rootbiomass among forest and grasslands are absent in this
Copyright © 2012 John Wiley & Sons, Ltd.
region and needs further investigation on this aspect.Cultivation by cleaning the forest and grassland leads todecrease in SOC content. The forest soils could sequester22.4Mg ha�1 higher SOC than the cultivated soils in the1.05-m soil profile, whereas the grassland could sequester11.9Mg ha�1 higher SOC in the 1.05-m profile. The SOCstored in micro-aggregates (WSA< 0.25mm) was found tobe more protected and less vulnerable to change due tochange in land use. A significant variability in the SOCstock could be explained by the water stability of aggre-gates. The POC fraction of soil C pool has a tendencyto accumulate under ecosystems with sufficient C inputsand encrusted within soil aggregates and hence rendersprotection against loss of C.
REFERENCES
Angers DA, Giroux M. 1996. Recently deposited organic matter in soilwater-stable aggregates. Soil Science Society of America Journal 60:1547–1551.
Bajracharya RM. 2001. Land preparation: an integral part of farming systemin the mid-hills of Nepal. Nepal Journal of Science and Technology 3:15–24.
Bajracharya RM, Lal R, Kimble JM. 1998. Soil organic carbon distributionin aggregates and primary particle fractions as influenced by erosion
LAND DEGRADATION & DEVELOPMENT (2012)
SOC STOCK AND FRACTIONS IN RELATION TO LAND USE
phases and landscape position. In Soil processes’ and the carbon cycle,Lal R, Kimble JM, Follett RF, Stewart BA (eds). CRC Press: BocaRaton, FL; 353–367.
Benbi DK, Chand M. 2007. Quantifying the effect of soil organicmatter on indigenous soil N supply and wheat productivity in semi-arid sub-tropical India. Nutrient Cycling in Agroecosystems 79:103–112.
Blair GJ, Lefroy RDB, Lisle L. 1995. Soil C fractions, based on theirdegree of oxidation and the development of a C management indexfor agricultural system. Australian Journal of Agronomy Research46: 1459–1466.
Blake GR, Hartge KH. 1986. Bulk density. In Methods of soil analysis,part I, Klute A (ed.). ASA Monograph No 9: Madison, WI;363–376.
Blanco-Canqui H, Lal R. 2004. Mechanisms of carbon sequestration in soilaggregates. Critical Reviews in Plant Science 23: 481–504.
Cambardella CA, Elliott ET. 1992. Particulate soil organic matter changesacross a grassland cultivation sequence. Soil Science Society of AmericaJournal 56: 777–783.
Campbell CA, Paul EA, Rennie DA, McCallum KJ. 1967. Applicability ofthe carbon-dating method of analysis to soil humus studies. Soil Science104: 217–224.
Conant TR, Six J, Paustian K. 2004. Land use effects on soil carbonfractions in the southeastern United States. II. Changes in soil carbonfractions along a forest to pasture chronosequence. Biology and Fertilityof Soils 40: 194–200.
Debasish-Saha, Kukal SS, Sharma S. 2011. Landuse impacts on SOCfractions and aggregate stability in typicustochrept of Northwest India.Plant and Soil 339: 457–470.
Eynard A, Shumacher TE, Lindstrom MJ, Malo DD. 2004. Aggregate sizesand stability in cultivated South Dakota Prairie Ustolls and Usterts. SoilScience Society of America Journal 68: 1360–1365.
Fontaine S, Barot S, Bdioui N, Mary B, Rumpel C. 2007. Stability oforganic carbon in deep soil layers controlled by fresh carbon supply.Nature 450: 277–280.
Gale WJ, Cambardella CA, Bailey TB. 2000. Root-derived carbon and theformation and stabilization of aggregates. Soil Science Society of AmericaJournal 64: 201–207.
Garcia-Pausas J, Casals P, Romanya J. 2004. Litter decomposition andfaunal activity in Mediterranean forest soils: effects of N content andthe moss layer. Soil Biology and Biochemistry 36: 989–999.
Gibbon A, Silman MR, Malhi Y, Fisher JB, Meir P, Zimmermann M,Dargie GC, William RF, Karina CG. 2010. Ecosystem carbon storageacross the grassland–forest transition in the High Andes of ManuNational Park, Peru. Ecosystems 13: 1097–1111.
Guo LB, Gifford RM. 2002. Soil carbon stocks and land use change: ameta-analysis. Global Change Biology 8: 345–360.
Gupta N, Kukal SS, Bawa SS, Dhaliwal GS. 2009. Soil organic carbon andaggregation under poplar based agroforestry system in relation to tree ageand soil type. Agroforestry Systems 76: 27–35.
Hassink J. 1995. Density fraction of soil macro organic matter and micro-bial biomass as prediction of C and N mineralization. Soil Biology andBiochemistry 27: 1099–1108.
Holeplass H, Singh BR, Lal R. 2004. Carbon sequestration in soil aggre-gates under different crop rotation and nitrogen fertilization in anInceptisol in southeastern Norway. Nutrient Cycling in Agroecosystems70: 167–177.
Huggins DR, Clapp CE, Allmaras RR, Lamb JA, Layese MF. 1998.Carbon dynamics in corn–soybean sequences as estimated fromnatural 13C abundance. Soil Science Society of America Journal62: 195–203.
Jacinthe PA, Lal R, Owens LB, Hothem DL. 2004. Transport of labilecarbon in runoff as affected by land use and rainfall characteristics. Soiland Tillage Research 77: 111–123.
Jastrow JD. 1996. Soil aggregate formation and accrual of particulate andmineral-associated organic matter. Soil Biology and Biochemistry 28:665–676.
Jastrow JD, Miller RM, Lussenhop J. 1998. Contributions of interactingbiological mechanisms to soil aggregate stabilization in restored prairie.Soil Biology and Biochemistry 30: 905–916.
Copyright © 2012 John Wiley & Sons, Ltd.
Kaiser K, Eusterhues K, Rumpel C, Guggenberger G, Kogel K. 2002.Stabilization of organic matter by soil minerals—investigations ofdensity and particle—size fractions from two acid forest soils. Journalof Plant Nutrition and Soil Science 165: 451–459.
de Koning GHJ, Veldkamp E, Lopez-Ulloa M. 2003. Quantification ofcarbon sequestration in soils following pasture to forest conversion innorth-western Ecuador. Global Biogeochemical Cycles 17: 1098.
Kukal SS, Sur HS, Gill SS. 1991. Factors responsible for soil erosionhazard in submontane Punjab, India. Soil Use and Management 7:38–44.
Kukal SS, Kaur M, Bawa SS. 2008. Erodibility of sandy loam aggregatesin relation to their size and initial moisture content under different landuses in semi-arid tropics of India. Arid Land Research Management 22:216–227.
Lal R. 2002. Soil carbon dynamics in cropland and rangeland. EnvironmentalPollution 116: 353–362.
Lal R, Bruce JP. 1999. The potential of world cropland soils to sequester Cand mitigate the greenhouse effect. Environmental Science Policy 2:177–185.
Li XG, Li FM, Zed R, Zhan ZY, Singh B. 2007. Soil physical propertiesand their relation to organic carbon pools as affected by land use in analpine pasture land. Geoderna 139: 98–105.
Meersmans J, VanWesemael B, De Ridder F, Fallas Dotti M, De Baets S,Van Molle M. 2009. Changes in organic carbon distribution with depthin agricultural soils in Northern Belgium, 1960–2006. Global ChangeBiology 15: 2739–2750.
Nakagami K, Hojito M, Itano S, Kohyama K, Miyaji T, Nishiwaki A,Matsuura S, Tsutsumi M, Kano S. 2009. Soil carbon stock in typicalgrasslands in Japan. Grassland Science 55: 96–103.
Nepstad DC, de Carvalho CR, Davidson EA, Jipp PH, Lefebvre PA,Negreiros GH, da Silva ED, Stone T, Trumbore S, Vieira S. 1994. Therole of deep roots in the hydrological and carbon cycles of Amazonianforests and pastures. Nature 372: 666–669.
Pikul J, Shannon O, Michael E, Walter R. 2007. Particulate organic matterand water-stable aggregation of soil under contrasting management. SoilScience Society of America Journal 71: 766–776.
Potter KN, Torbert HA, Johnson HB, Tischler CR. 1999. Carbon storageafter longterm grass establishment on degraded soils. Soil Science 164:718–725.
Rehana-Rasool, Kukal SS, Hira GS. 2008. Soil organic carbon andphysical properties as affected by long term application of FYMand inorganic fertilizers in maize–wheat system. Soil and TillageResearch 101: 31–36.
Rumpel C, Kögel-Knabner I. 2011. Deep soil organic matter—a key butpoorly understood component of terrestrial C cycle. Plant and Soil 338:143–158.
Sainju UM, Terrill TH, Gelaye S, Singh BP. 2003. Soil aggregation andcarbon and nitrogen pools under rhizoma peanut and perennial weeds.Soil Science Society of America Journal 67: 146–155.
Schulz E, Deller B, Hoffmann G. 2003. C and N in Heibwasser extract.In VDLUFA methodenbuch. 1, method A 4.3.2. VDLUFA- Verlag:Bonn.
Schwendenmann L, Pendall E. 2006. Effects of forest conversion into onsoil aggregate structure and carbon storage in Panama: evidence from soilcarbon fractionation and stable isotopes. Plant and Soil 288: 217–232.
Shrestha BM, Sitaula BK, Singh BR, Bajracharya RM. 2004. Soilorganic carbon stocks in soil aggregates under different landuse systems in Nepal. Nutrient Cycling in Agroecosystems 70:201–213.
Singh BR, Lal R. 2005. The potential of soil carbon sequestration throughimproved management practices in Norway. Environment, Developmentand Sustainability 7: 161–184.
Six J, Elliott ET, Paustian K. 2000. Soil macroaggregate turnoverand microaggregate formation: a mechanism for C sequestrationunder no-tillage agriculture. Soil Biology and Biochemistry 32:2099–2103.
Starr GC, Lal R, Malone R, HothemD, Owens L, Kimble J. 2000.Modellingsoil carbon transported by water erosion processes. Land Degradation &Development 11: 83–91.
LAND DEGRADATION & DEVELOPMENT (2012)
D. SAHA ET AL.
Stevenson FJ. 1994. Humus chemistry: genesis, composition, reaction, 2ndedn. Wiley: New York, NY; 496.
Sur HS, Kukal SS, Maskina MS. 1998. Indigenous technical knowledge forsoil and water conservation and crop management in Kandi area of NWIndia. Research Bulletin, Zonal Research Station for Kandi Area, PunjabAgricultural University: Ludhiana, India.
Copyright © 2012 John Wiley & Sons, Ltd.
Turchenek LW, Oades JM. 1979. Fractionation of organomineralcomplexes by sedimentation and density techniques. Geoderma 21:311–343.
Yoder RE. 1936. A direct method of aggregate size analysis of soils and astudy of the physical nature of erosion losses. Journal of American Societyof Agronomy 28: 337–351.
LAND DEGRADATION & DEVELOPMENT (2012)