soil organic carbon decomposition and carbon pools in temperate and sub-tropical forests in china
TRANSCRIPT
ARTICLE IN PRESS
0301-4797/$ - se
doi:10.1016/j.je
�CorrespondE-mail addr
Journal of Environmental Management 85 (2007) 690–695
www.elsevier.com/locate/jenvman
Soil organic carbon decomposition and carbon pools intemperate and sub-tropical forests in China
L. Yanga,b,c, J. Pana,�, Y. Shaoa, J.M. Chend, W.M. Jud, X. Shie, S. Yuanf
aCollege of Resources and Environment of Nanjing Agriculture University, Nanjing 210095, PR ChinabNanjing Institute of Geography and Limnology, Chinese Academy of Sciences, Nanjing 210008, PR China
cGraduate School of Chinese Academy of Sciences, Beijing 100039, PR ChinadDepartment of Geography, University of Toronto, 100 St. George St., Room 5047, Toronto, Ont., Canada M5S 3G3
eInstitute of Soil Science, Chinese Academy of Sciences, Nanjing 210008, PR ChinafLand Institute of College of Public Management, Zhejiang Gongshang University, Hangzhou 310035, PR China
Received 4 December 2005; received in revised form 31 August 2006; accepted 19 September 2006
Available online 14 November 2006
Abstract
Decomposition of soil organic carbon (SOC) is a critical component of the global carbon cycle, and accurate estimates of
SOC decomposition are important for forest carbon modeling and ultimately for decision making relative to carbon sequestration and
mitigation of global climate change. We determined the major pools of SOC in four sites representing major forest types in
China: temperate forests at Changbai Mountain (CBM) and Qilian Mountain (QLM), and sub-tropical forests at Yujiang (YJ) and
Liping (LP) counties. A 90-day laboratory incubation was conducted to measure CO2 evolution from forest soils from each site, and
data from the incubation study were fitted to a three-pool first-order model that separated mineralizable soil organic carbon into active
(Ca), slow (Cs) and resistant (Cr) carbon pools. Results indicate that: (1) the rate of SOC decomposition in the sub-tropical zone was
faster than that in the temperature zone, (2) The Ca pool comprised �1–3% of SOC with an average mean residence time (MRT) of 219
days. The Cs pool comprised �25–65% with an average MRT of 78 yr. The Cr pool accounted for �35–80% of SOC, (3) The YJ site in
the sub-tropical zone had the greatest Ca pool and the lowest MRT, while the QLM in the temperature zone had the greatest MRT for
both the Ca and Cs pools. The results suggest a higher capacity for long-term C sequestration as SOC in temperature forests than in sub-
tropical forests.
r 2006 Elsevier Ltd. All rights reserved.
Keywords: Soil organic carbon decomposition; Carbon pool; Active carbon pool; Slow carbon pool; Resistant carbon pool
1. Introduction
Soil organic carbon (SOC) represents the largest carbonreservoir in terrestrial ecosystems, and is estimatedat about 1500 PgC globally, or �2 times that of theatmosphere and 2.3 times that of the total terrestrialvegetation (Schimel, 1995). Approximately 70% of theglobal soil C inventory resides in forest ecosystems(Hudson et al., 1994). A small change in forest soil Cinventories can thus result in a large change in atmosphericCO2 concentration (Raich and Schlesinger, 1992). Thestudy of dynamic changes and mechanisms of forest SOC is
e front matter r 2006 Elsevier Ltd. All rights reserved.
nvman.2006.09.011
ing author. Tel.: +8625 84395329; fax: +86 25 57714759.
ess: [email protected] (J. Pan).
thus essential in understanding and mitigating globalclimate change (Fang et al., 1996). The chemicalcomponents of SOC are complex, involving a wide arrayof organic constituents (Sollins et al., 1999) with meanresistant times (MRT) that range over three orders ofmagnitude (Goh et al., 1989; Paul et al., 2001a). In general,SOC can be divided into an active pool (turnover time0.1–4.5 a), a slow pool (turnover time 5–50 a) and a passivepool (50–3000 a) (Parton et al., 1987). Prior researchsuggests that the three-pool first-order model canaccurately predict dynamic changes in forest SOC (Deanset al., 1986; Gregorich et al., 1989; Cabrera, 1993).Accurate assessment of the different carbon pools of forestSOC is an important step in understanding mechanisms ofsoil C cycling and dynamic change of carbon pools.
ARTICLE IN PRESS
Table 1
Properties of soil samples in LP, CBM, YJ and QLM sites
Sample Depth (cm) Organic carbon (g kg�1) pH (%) Clay (%) Soil type (CST) Vegetation
LP3 0–20 21.17 4.84 17.9 Perudic Ferrosols Cunninghamia lanceolata
LP7 0–15 24.73 4.42 22.9 Perudic Ferrosols Evergreen broadleaf
YJ1 0–15 30.76 4.35 28.40 Udic Ferralsols Evergreen broadleaf
YJ2 0–18 26.59 4.33 35.6 Udic Ferralsols Cunninghamia lanceolata
CBM0 0–11 57.72 5.04 9.39 Udic Isohumosols Pteridophyta
CBM14 0–11 74.41 5.07 8.69 Boric Argosols Spruce-fir
CBM22 0–7 120.34 5.24 7.18 Udic Isohumosols Poplar and Birch
QLM2 0–30 89.03 8.11 13.70 Ustic Argosols Picea crassifolia
QLM7 0–30 71.93 8.31 12.50 Ustic Isohumosols Sabinaprezew alskii
QLM8 0–30 70.18 8.24 13.30 Ustic Isohumosols Shrub
L. Yang et al. / Journal of Environmental Management 85 (2007) 690–695 691
While there are recent studies on total SOC stocks offorests in China, estimates of sizes and turnover rates of thethree SOC pools have not been reported in forest soils ofChina. The objectives of this work were: (a) to describeSOC decomposition by incubation analysis of differentsoils under constant temperature (25 1C) and water content(60% WHC) for major forest types in China, and (b) todetermine SOC pool sizes and turnover rates for theseforest types according to the three-pool first-order model.
2. Materials and methods
2.1. Study sites
The Liping (LP) site is located in the Guizhou Province,China (1091100E, 261200N) with a mean annual tempera-ture (MAT) of 15 1C and rainfall of 1321mm. The site is inthe sub-tropical zone of China, with plantation standsof Chinese fir (Cunninghamia lanceolata). Soil typecorresponds to Perudic Ferrosols in the CST classification(Chinese Soil Taxonomy, 2001). The Yujiang (YJ) site, alsoin the sub-tropical zone, is located in the Jiangxi Province,China (1161410E, 281040N) with a MAT of 18.1 1C and1741mm of rainfall annually. Ferralsols were formedunder Chinese fir (Cunninghamia lanceolata) and evergreenbroadleaf forests (Wu et al., 1997). The ChangbaiMountain (CBM) site is located in the southeast of Jilinprovince, northeast China (1271380E, 411420N), and theelevation varies in the range from 720 to 2691m above thesea level. The climate belongs to the temperate continentalmountainous climate with a MAT of 5 1C and 1050mm ofprecipitation annually. The typical soil types in the area areBoric Argosols and Udic Isohumosols. The site hasobvious vertical vegetation zones, including broad-leavedKorean pine forest with an elevation from 500 to 1000m,dark coniferous forest with an elevation from 1100 to1700m, and Erman’s birch forest with an elevation from1700 to 2000m. The broad-leaved Korean pine forest is thedominating vegetation type (Wang et al., 2003a, b). TheQilian Mountain (QLM) site is located in the Gansuprovince, northwest China (991500E, 381300N) and has asemiarid climate with a MAT of �0.3 1C and 440mm ofprecipitation annually. The typical soil types are Ustic
Isohumosols and Argosols in the CST classification withmain parent rock of calcareous rock. Influenced by thetopography and climate, vegetation type in the site ismountainous pasture and forest, which includes Picea
crassisolia, Sabina przewalski and shrub forests (Changet al., 2005).
2.2. Samples and analysis methods
Soil samples from the four experimental sites werecollected using truck-mounted hydraulic soil probes in2002 and 2003. Ten samples were collected according toclimate, soil and vegetation types, each of which includedthree replicates (Table 1). Geographic coordinates and theelevations of the four sites were obtained using a satellitedifferential global positioning system (GPS).Moist soil samples were air-dried and sieved to pass a
2mm screen. Recognizable plant fragments were removedby hand picking. Soil carbonates were removed by adding100ml of 250mM HCL to 20 g soil and shaking for 1 h.Soils were washed with deionized water to remove excessCl� (Collins et al., 2000). Total C was measured by wetoxidation using dichromate in acid medium followed bythe FeSO4 Titration method (Nelson and Sommers, 1975),and pH was measured in 0.01M CaCl2 (1:5 Soil: Solutionby volume) using a glass electrode (Sparks, 1996).One-hundred g of each sample were incubated in 250ml
glass jars in the dark at 25 1C and 60% water holdingcapacity for 90 days. Water holding capacity was estimatedby a volumetric soil water method (Elliott et al., 1994). Thejars were normally closed but opened periodically tomaintain aerobic conditions. Water loss in the jars wasmonitored by weight and replenished after opening. Noleaching occurred during the course of incubation. Theevolved CO2 was trapped in 25ml, 0.4NNaOH. Controljars contained no soil. Evolved CO2 was precipitated by theaddition of BaCl2 and measured by titration of residualNaOH to pH 7.0 with 0.4NHCL. The evolved CO2 wasmeasured daily during the first week and every 3–4 days inthe following 2 weeks till the end of the incubation period.The size of the resistant C pool (Cr) (Leavitt et al., 1997)
was determined by the residue of acid hydrolysis. Acidhydrolysis consisted of refluxing 1 g soil in hot, 6MHCL
ARTICLE IN PRESS
0
2
4
6
8
10
12
14
16
18
20
0 10 20 30 40 50 60 70 80 90
Incubation time (days)
CO
2-C
evo
lved
(m
g C
kg-1
day-1
)
Cunninghamia lanceolata(LP)
Cunninghamia lanceolata(YJ)
Evergreen broadleaf(LP)
Evergreen broadleaf(YJ)
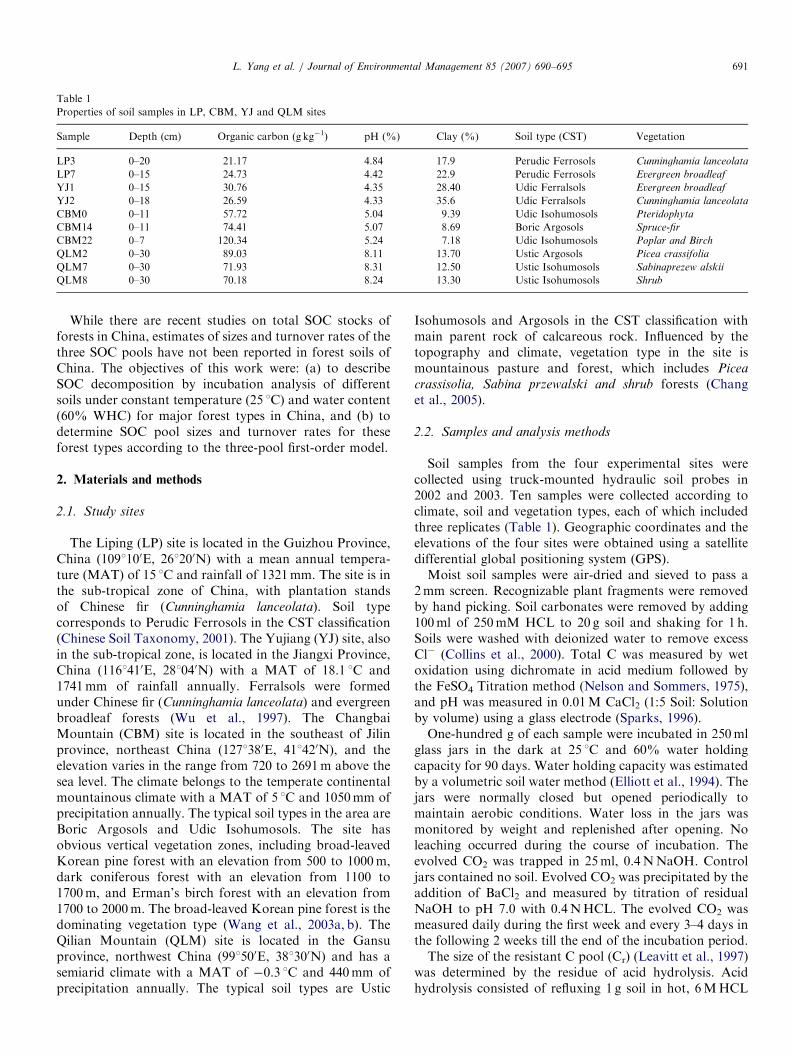
Fig. 1. Decomposition rates of SOC from two vegetations under sub-
tropical zone.
L. Yang et al. / Journal of Environmental Management 85 (2007) 690–695692
for 18 h. The soluble materials were separated by filtrationfollowed by repeated evaporation to remove the HCL. Theresidue of hydrolysis was rinsed with deionized water anddried at 55 1C and ground to pass a 180 mm screen. Thetotal soil and the residue of hydrolysis were combusted toCO2 (Paul et al., 2001a, b).
2.3. Model description
The three-pool first-order model (Paul et al., 2001a, b)separates the mineralizable organic carbon into active, slowand resistant C pools and can be presented as:
Ct ¼ Cae�Kat þ Cse
�K st þ Cre�K rt, (1)
where Ct is total organic carbon at time t, Ca and Cs are thesizes of the active and slow pools; and Ka and Ks aredecomposition rate constants for the active and slow pools.Cr is the size of the resistant carbon pool as estimated byacid hydrolysis. Mean residence time (MRT) for eachcomponent was calculated as the reciprocal of thedecomposition rate constant in the three-pool first-ordermodel. Radiocarbon dating of the residue of the acidhydrolysis may be used to determine MRT for Cr. Carbondating is relatively expensive and therefore C dates areoften unavailable, and the MRT of Cr is commonlyassumed to be 1000 yr (Paul et al., 2001a, b). Thelaboratory-derived values were scaled to the field accordingto mean-annual temperature (MAT) by assuming a Q10 of2ð25�MATÞ=2 (Collins et al., 2000). The size of the slow poolis defined as Cs ¼ CSOC � Ca � Cr with CSOC representingthe total SOC at time of sampling.
2.4. Model fitting and statistical analysis
Eq. (1) was fitted with a non-linear regression (SPSS10.5) that uses the Marquardt algorithm and an iterativeprocess to find the parameter values that minimize theresidual sum of squares. The resultant pool sizes and theirmineralization rate constants could be sensitive to theinitially assigned parameter values and the iterative stepsize. Generally, the automatically estimated initial para-meters resulted in acceptable parameter values. In somecases, initial parameter values and the iterative steps sizewere adjusted by hand to obtain results in reasonableranges; for example, rate constants could not be negative,and the sum of active, slow and resistant carbon poolsshould not exceed total SOC.
The standard deviations of the parameters, the residualmean square (RMS) and the F-values of the curve fits werecalculated (Little and Hills, 1975).
3. Results
3.1. Characteristic of SOC decomposition
Although the rates of SOC decomposition were differentin different forests, qualitative trends were similar with
rapid decomposition in the initial incubation stages andgradually which gradually reached a steady state. Duringthe SOC decomposition process, the amount of decom-position in the first week accounted for 14–41% of totaldecomposition.In the LP and YJ sites, which belong to the sub-tropical
zone, rates of SOC decomposition differed substantially.The decomposition rates in the LP site from Cunninghamia
lanceolata forest were faster than those in the YJ site. Therewas the same trend under evergreen broadleaf forest.Comparing the decomposition rates between the Cunning-
hamia lanceolata and evergreen broadleaf forests, themaximum decomposition rate of the former was higherthan that of the latter (Fig. 1).In the CBM and QLM sites, which belong to the
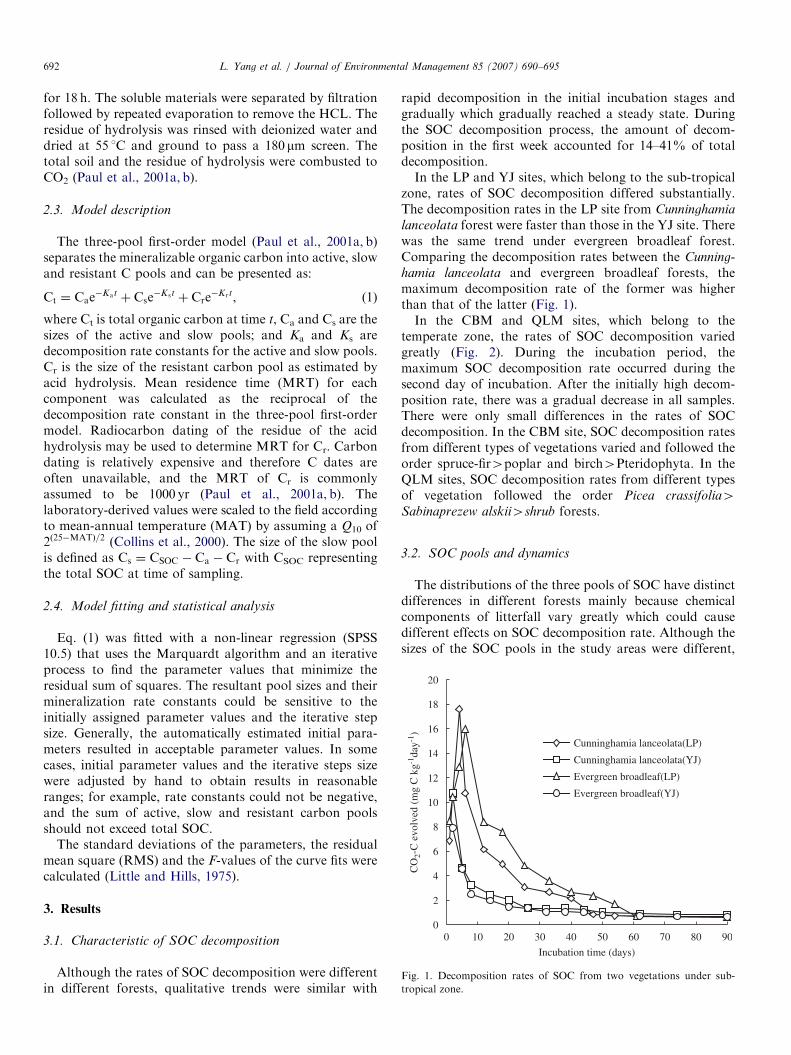
temperate zone, the rates of SOC decomposition variedgreatly (Fig. 2). During the incubation period, themaximum SOC decomposition rate occurred during thesecond day of incubation. After the initially high decom-position rate, there was a gradual decrease in all samples.There were only small differences in the rates of SOCdecomposition. In the CBM site, SOC decomposition ratesfrom different types of vegetations varied and followed theorder spruce-fir4poplar and birch4Pteridophyta. In theQLM sites, SOC decomposition rates from different typesof vegetation followed the order Picea crassifolia4Sabinaprezew alskii4shrub forests.
3.2. SOC pools and dynamics
The distributions of the three pools of SOC have distinctdifferences in different forests mainly because chemicalcomponents of litterfall vary greatly which could causedifferent effects on SOC decomposition rate. Although thesizes of the SOC pools in the study areas were different,
ARTICLE IN PRESSL. Yang et al. / Journal of Environmental Management 85 (2007) 690–695 693
there was a commonality in that the sizes of Ca weresmaller (Table 2). The Ca pool comprised �1–3% of SOCwith an average MRT of 219 days. Because Ca is active, asmall change in pool size can cause a marked change inatmospheric CO2 concentration and cause a sharp effect onthe global climate. Therefore, it is vital to take measures todecrease the loss of Ca and increase the stock of the stabileC pool. The Cs pool comprised �25–65% with an averageMRT of 78 yr. The Cr pool accounted for �35–80%. Therewas a greater retention of C in the forests. These results areconsistent with the existence of at least a small, labilecarbon pool and a much larger, more recalcitrant pool(Collins et al., 2000).
The proportion of Ca in the YJ site was greater than inthe other study sites and this site had the lowest MRT forboth the Ca and Cs pools. This indicated that the soil in theYJ site was active. The QLM site had the most stable pool,and the CBM site had the second most stable pool (Table2). So the stable C pools followed the orderQLM4CBM4LP4YJ which was consistent with thetemperature change in the study sites.
4. Discussion
Our data indicated that SOC decomposed rapidly duringthe early incubation stages and gradually slowed down to a
0
5
10
15
20
25
0 10 20 30 40 50 60 70 80 90
Incubation time (days)
CO
2-C
evo
lved
(m
g C
kg-1
day
-1) Spruce-fir(CBS)
Poplar and birch(CBS)
Pteridophyta(CBS)
Picea crassifolia(QLS)
Sabinaprezew alskii(QLS)
shrub(QLS)
Fig. 2. Decomposition rates of SOC from different vegetations under
temperate zone.
Table 2
Pool sizes and laboratory mean residence times (MRT) of soil for the active,
Sample Depth (cm) Ca (g kg�1) MRTLab (days) Ca/SOC (%) Cs (g kg
�
LP3 0–20 0.21 47 0.99 11.6
LP7 0–15 0.31 50 1.25 12.55
YJ1 0–15 0.47 8 1.53 6.65
YJ2 0–18 0.48 7 1.81 5.24
CBM0 0–11 0.65 56 1.13 36.54
CBM14 0–12 0.69 11 0.93 18.75
CBM22 0–7 1.38 35 1.15 64.08
QLM2 0–30 1.33 45 1.49 36.5
QLM7 0–30 1.73 161 2.41 27.56
QLM8 0–30 0.65 47 0.92 28.81
comparative steady state. During the early stages ofincubation, the decomposed SOC consisted mostly ofaccumulations of Ca, presumably derived from vegetation.The Ca pool comprised �1–3% of the SOC with an averageMRT of 219 days. The Cs pool comprised about 25–65%with an average field MRT of 78 yr. The Cr pool accountedfor �35–80%. The sizes of the Cs and Cr pools indicatedthat the SOC in the cold arid QLM site was the moststable. Among the different forests sampled, the SOCcontents followed the order CBM4QLM4YJ4LP. Theratio of the Ca pool to the CSOC contents followed theorder YJ4LP4CBM4QLM, with MRT showing theinverse order YJ (MRT ¼ 8 days)4LP (MRT ¼ 47days)4CBM (MRT ¼ 56 days)4QLM (MRT ¼ 80 days).These orders correspond closely to the rank order of meanannual temperature (MAT) across the study areas: YJ(18.1 1C)4LP (15 1C)4CBM (5 1C)4QLM (�3 1C). Ourresults are thus consistent with the conclusion thattemperature is the most important environmental factorthat affects microbial processes in soils and consequentlySOC decomposition dynamics. Although a significantcorrelation between soil temperature and SOC decomposi-tion is well established (Singh and Gupta, 1977; Raich andSchlesinger, 1992; Lloyd and Taylor, 1994; Kirschbaum,1995; Katterer et al., 1998), there is no agreement aboutwhich function to use to describe this relationship.Litterfall properties could also affect SOC decomposi-
tion under the same environment. In particular, the ligninconcentration and lignin/N ratios of litterfall, bothgenerally higher in conifers than in broadleaved trees(Perry et al., 1987; Petersen et al., 1997), are expected to benegatively related to decomposition rates. Our resultsindicate that SOC decomposition rate in Cunninghamialanceolata plantations was actually faster than that inevergreen broadleaf forests in the sub-tropical zone,contradicting some other researchers’ conclusions (Wuet al., 1996). The relationships between the decompositionrate and litterfall properties need to be studied further.Soil texture, especially soil clay content, is also an
important factor influencing SOC dynamics under thesame climatic conditions. It was apparent that the finetexture of clay soil reduced the amount of SOC miner-alization which contributed to accumulation of SOC. Clay
slow and resistant carbon pools from LP, YJ, CBM and QLM sites
1) MRTLab (yr) Cs/SOC (%) Cr (g kg�1) MRTLab (yr) Cr/SOC (%)
3 54.79 9.36 500 44.22
27 50.75 11.87 500 50.00
2 21.61 23.64 620 76.86
2 19.71 20.87 620 78.48
12 63.32 20.52 250 35.55
4 25.20 54.97 250 73.87
25 53.25 54.88 250 45.61
16 41.00 52.53 173 59.00
33 38.31 44.38 173 61.70
3 41.05 41.37 500 58.95
ARTICLE IN PRESS
0
10
20
30
40
50
60
0 10 20 30 40
Clay content (%)
Cr
(g k
g-1)
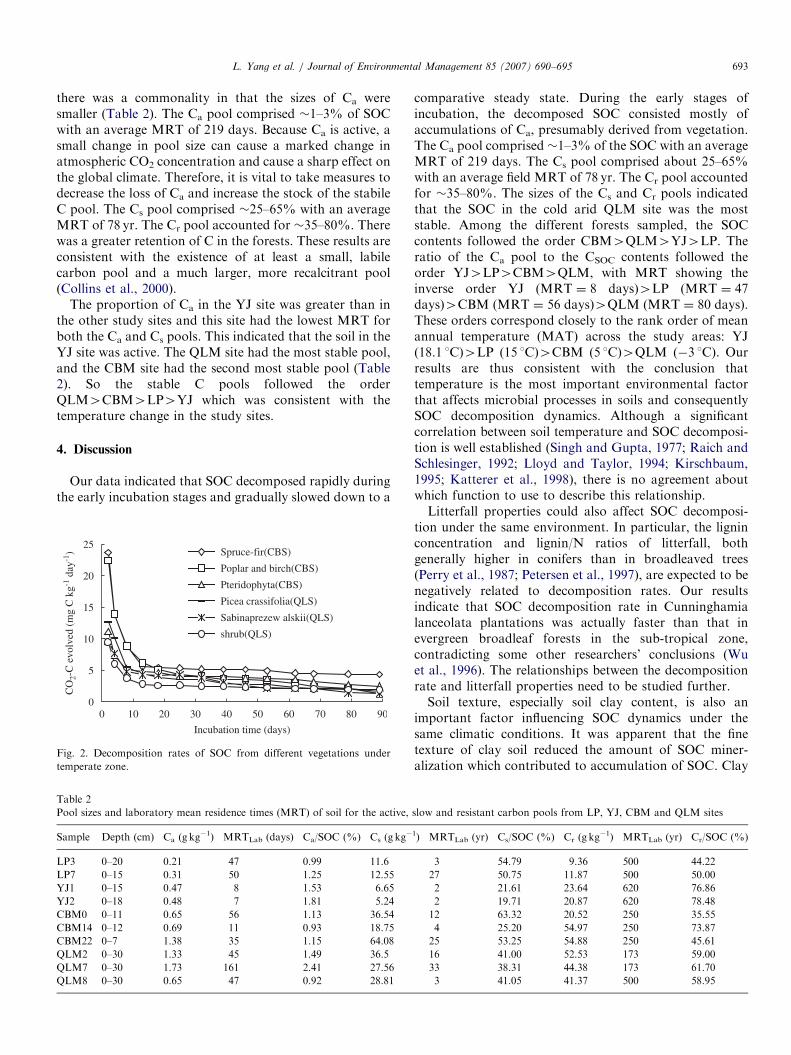
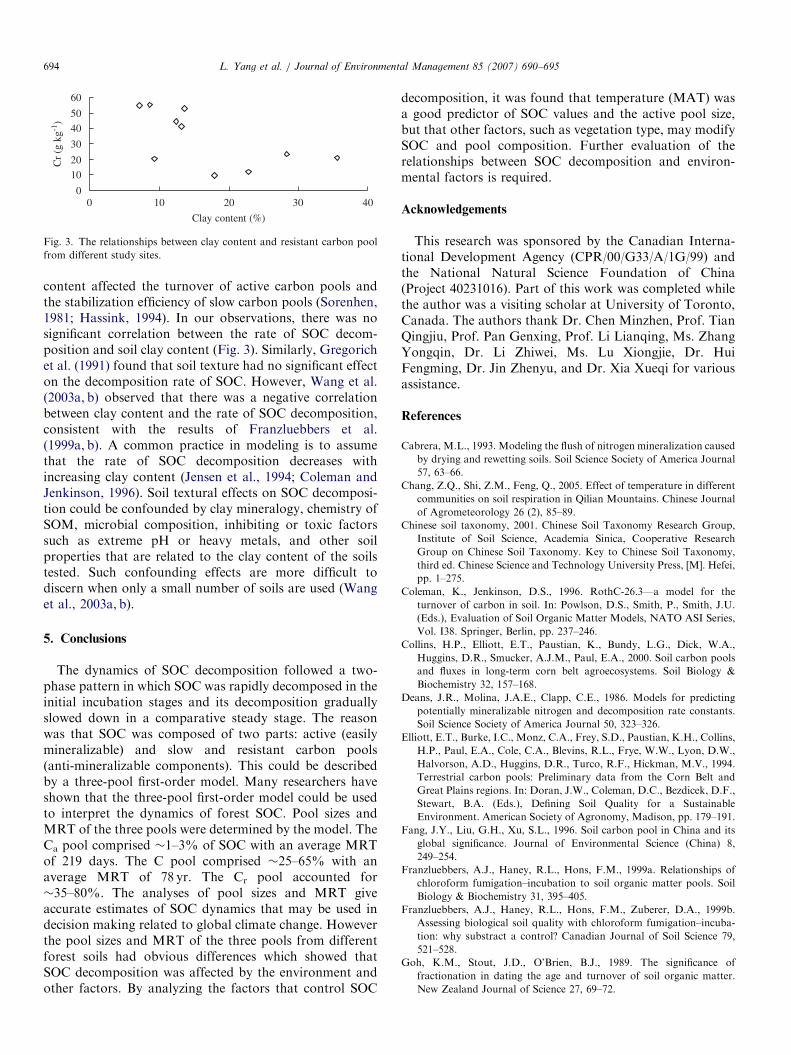
Fig. 3. The relationships between clay content and resistant carbon pool
from different study sites.
L. Yang et al. / Journal of Environmental Management 85 (2007) 690–695694
content affected the turnover of active carbon pools andthe stabilization efficiency of slow carbon pools (Sorenhen,1981; Hassink, 1994). In our observations, there was nosignificant correlation between the rate of SOC decom-position and soil clay content (Fig. 3). Similarly, Gregorichet al. (1991) found that soil texture had no significant effecton the decomposition rate of SOC. However, Wang et al.(2003a, b) observed that there was a negative correlationbetween clay content and the rate of SOC decomposition,consistent with the results of Franzluebbers et al.(1999a, b). A common practice in modeling is to assumethat the rate of SOC decomposition decreases withincreasing clay content (Jensen et al., 1994; Coleman andJenkinson, 1996). Soil textural effects on SOC decomposi-tion could be confounded by clay mineralogy, chemistry ofSOM, microbial composition, inhibiting or toxic factorssuch as extreme pH or heavy metals, and other soilproperties that are related to the clay content of the soilstested. Such confounding effects are more difficult todiscern when only a small number of soils are used (Wanget al., 2003a, b).
5. Conclusions
The dynamics of SOC decomposition followed a two-phase pattern in which SOC was rapidly decomposed in theinitial incubation stages and its decomposition graduallyslowed down in a comparative steady stage. The reasonwas that SOC was composed of two parts: active (easilymineralizable) and slow and resistant carbon pools(anti-mineralizable components). This could be describedby a three-pool first-order model. Many researchers haveshown that the three-pool first-order model could be usedto interpret the dynamics of forest SOC. Pool sizes andMRT of the three pools were determined by the model. TheCa pool comprised �1–3% of SOC with an average MRTof 219 days. The C pool comprised �25–65% with anaverage MRT of 78 yr. The Cr pool accounted for�35–80%. The analyses of pool sizes and MRT giveaccurate estimates of SOC dynamics that may be used indecision making related to global climate change. Howeverthe pool sizes and MRT of the three pools from differentforest soils had obvious differences which showed thatSOC decomposition was affected by the environment andother factors. By analyzing the factors that control SOC
decomposition, it was found that temperature (MAT) wasa good predictor of SOC values and the active pool size,but that other factors, such as vegetation type, may modifySOC and pool composition. Further evaluation of therelationships between SOC decomposition and environ-mental factors is required.
Acknowledgements
This research was sponsored by the Canadian Interna-tional Development Agency (CPR/00/G33/A/1G/99) andthe National Natural Science Foundation of China(Project 40231016). Part of this work was completed whilethe author was a visiting scholar at University of Toronto,Canada. The authors thank Dr. Chen Minzhen, Prof. TianQingjiu, Prof. Pan Genxing, Prof. Li Lianqing, Ms. ZhangYongqin, Dr. Li Zhiwei, Ms. Lu Xiongjie, Dr. HuiFengming, Dr. Jin Zhenyu, and Dr. Xia Xueqi for variousassistance.
References
Cabrera, M.L., 1993. Modeling the flush of nitrogen mineralization caused
by drying and rewetting soils. Soil Science Society of America Journal
57, 63–66.
Chang, Z.Q., Shi, Z.M., Feng, Q., 2005. Effect of temperature in different
communities on soil respiration in Qilian Mountains. Chinese Journal
of Agrometeorology 26 (2), 85–89.
Chinese soil taxonomy, 2001. Chinese Soil Taxonomy Research Group,
Institute of Soil Science, Academia Sinica, Cooperative Research
Group on Chinese Soil Taxonomy. Key to Chinese Soil Taxonomy,
third ed. Chinese Science and Technology University Press, [M]. Hefei,
pp. 1–275.
Coleman, K., Jenkinson, D.S., 1996. RothC-26.3—a model for the
turnover of carbon in soil. In: Powlson, D.S., Smith, P., Smith, J.U.
(Eds.), Evaluation of Soil Organic Matter Models, NATO ASI Series,
Vol. I38. Springer, Berlin, pp. 237–246.
Collins, H.P., Elliott, E.T., Paustian, K., Bundy, L.G., Dick, W.A.,
Huggins, D.R., Smucker, A.J.M., Paul, E.A., 2000. Soil carbon pools
and fluxes in long-term corn belt agroecosystems. Soil Biology &
Biochemistry 32, 157–168.
Deans, J.R., Molina, J.A.E., Clapp, C.E., 1986. Models for predicting
potentially mineralizable nitrogen and decomposition rate constants.
Soil Science Society of America Journal 50, 323–326.
Elliott, E.T., Burke, I.C., Monz, C.A., Frey, S.D., Paustian, K.H., Collins,
H.P., Paul, E.A., Cole, C.A., Blevins, R.L., Frye, W.W., Lyon, D.W.,
Halvorson, A.D., Huggins, D.R., Turco, R.F., Hickman, M.V., 1994.
Terrestrial carbon pools: Preliminary data from the Corn Belt and
Great Plains regions. In: Doran, J.W., Coleman, D.C., Bezdicek, D.F.,
Stewart, B.A. (Eds.), Defining Soil Quality for a Sustainable
Environment. American Society of Agronomy, Madison, pp. 179–191.
Fang, J.Y., Liu, G.H., Xu, S.L., 1996. Soil carbon pool in China and its
global significance. Journal of Environmental Science (China) 8,
249–254.
Franzluebbers, A.J., Haney, R.L., Hons, F.M., 1999a. Relationships of
chloroform fumigation–incubation to soil organic matter pools. Soil
Biology & Biochemistry 31, 395–405.
Franzluebbers, A.J., Haney, R.L., Hons, F.M., Zuberer, D.A., 1999b.
Assessing biological soil quality with chloroform fumigation–incuba-
tion: why substract a control? Canadian Journal of Soil Science 79,
521–528.
Goh, K.M., Stout, J.D., O’Brien, B.J., 1989. The significance of
fractionation in dating the age and turnover of soil organic matter.
New Zealand Journal of Science 27, 69–72.
ARTICLE IN PRESSL. Yang et al. / Journal of Environmental Management 85 (2007) 690–695 695
Gregorich, E.G., Kachanoski, R.G., Voroney, R.P., 1989. Carbon
mineralization in soil size fractions after various amounts of aggregate
disruption. Journal of Soil Science 40, 649–659.
Gregorich, E.G., Voroney, R.P., Kachanoski, R.G., 1991. Turnover of
carbon through through the microbial biomass in soils with different
textures. Soil Biology & Biochemistry 23, 799–805.
Hassink, J., 1994. Effects of soil texture and grassland management on soil
organic C and N and rates of C and N mineralization. Soil Biology
& Biochemistry 9, 1221–1231.
Hudson, R.J.M., Gherini, S.A., Goldstein, R.A., 1994. Modeling the
global carbon cycle: nitrogen fertilization of the terrestrial biosphere
and the ‘‘missing’’ CO2 sink. Global Biogeochemical Cycles 8,
307–333.
Jensen, C., Stougaard, B., Ostergaard, H.S., 1994. Simulation of nitrogen
dynamics in farm land areas of Denmark (1989–1993). Soil Use and
Management 10, 111–118.
Katterer, T., Reichstein, M., Andren, O., Lomander, A., 1998. Tempera-
ture dependence of organic matter decomposition: a critical review
using literature data analysed with different models. Biology and
Fertility of Soils 27, 258–262.
Kirschbaum, M.U.F., 1995. The temperature dependence of soil organic
matter decomposition, and the effect of global warming on soil organic
C storage. Soil Biol Biochem 27, 753–760.
Leavitt, S.W., Paul, E.A., Pendall, E., Pinter, J.R., Kimble, B.A., 1997.
Field variability of carbon isotopes in soil organic carbon. Nuclear
Instruments and Methods in Physics Research B 123, 451–454.
Little, T.M., Hills, F.J., 1975. Statistics Methods in Agricultural Research,
second ed. University of California, Davis, p. 242.
Lloyd, J., Taylor, J.A., 1994. On the temperature dependence of soil
respiration. Functional Ecology 8, 315–323.
Nelson, D.W., Sommers, L.E., 1975. A rapid and accurate method for
estimating organic carbon in soil. Proceedings of the Indiana Academy
of Science 84, 456–462.
Parton, W.J., Schimel, D.S., Cole, C.V., 1987. Analysis of factors
controlling soil organic matter levels in great plains grasslands.
Journal of Soil Science Society of America Journal 51, 1173–1179.
Paul, E.A., Morris, S.J., Bohm, S., 2001a. The determination of soil C
pool sizes and turnover rates: biophysical fractionation and tracers. In:
Lal, R., Kimble, J.M., Follett, R.F. (Eds.), Assessment Methods for
Soil C Pools. CRC Press, Boca Raton, FL.
Paul, E.A., Collins, H.P., Leavitt, S.W., 2001b. Dynamics of resistant soil
carbon of Midwestern agricultural soils measured by naturally
occurring 14C abundance. Geoderma 104, 239–256.
Perry, D.A., Choquette, C., Schroeder, P., 1987. Nitrogen dynamics in
conifer-dominated forests with and without hardwoods. Canadian
Journal of Forest Research 17, 1434–1441.
Peterson, E.B., Peterson, N.M., Simard, S.W., Wang, J.R., 1997. Paper
birch managers’ handbook for British Columbia. B.C. Ministry of
Forests, Victoria, B.C. FRDA Report no. 271.
Raich, J.W., Schlesinger, W.H., 1992. The global carbon dioxide flux in
soil respiration and its relationship to vegetation and climate. Tellus
44B, 81–99.
Schimel, D.S., 1995. Terrestrial ecosystems and the carbon cycle. Global
Change Biology 1, 77–91.
Singh, J.S., Gupta, S.R., 1977. Plant decomposition and soil respiration in
terrestrial ecosystems. Botanical Review 43, 449–526.
Sorenhen, L.H., 1981. Carbon-nitrogen relationships during the humifica-
tion of cellulose in soils containing different amounts of clay. Soil
Biology & Biochemistry 13, 313–321.
Sollins, P., Gassman, C., Paul, E.A., Swanston, C., Lajtha, K., Hei, J.W.,
Elliott, E.T., 1999. Soil carbon and nitrogen: pools and fractions. In:
Robertson, G.P., Bledsoe, C.S., Coleman, D.C., Sollins, P. (Eds.),
Standard Soil Methods for Long-Term Ecological Research. Oxford
University Press, New York, pp. 89–105.
Sparks, D.L., 1996. Methods of Soil Analysis, Part III. Soil Science
Society of America, American Society of Agronomy, Madison, WI.
Wang, M., Ji, L.Z., Li, Q.R., et al., 2003a. Effects of soil temperature and
moisture on soil respiration in different forest types in Changbai
Mountain. Chinese Journal of Applied Ecology 14 (8), 1234–1238.
Wang, W.J., Dalal, R.C., Moody, P.W., Smith, C.J., 2003b. Relationships
of soil respiration to microbial biomass, substrate availability and clay
content. Soil Biology & Biochemistry 35, 273–284.
Wu, W.D., Huan, C.C., Liu, R.L., et al., 1996. A study on litter
decomposition and the dynamic state of nutrient release of different
types of forest in Jiangxi Province. Acta Agriculturae Universitatis
Jiangxiensis 18 (1), 61–66.
Wu, W.D., Huang, C.C., Wang, J.M., et al., 1997. The status and
distribution of soil organic matter and N in the soil profiles under
different types of forest in Jiangxi. Acta Agriculturae Universitatis
Jiangxiensis 19 (3), 90–95.