soil nutrient status soil summary 2016-2017 - … · soil summary 2016-2017 soil nutrient status...
TRANSCRIPT
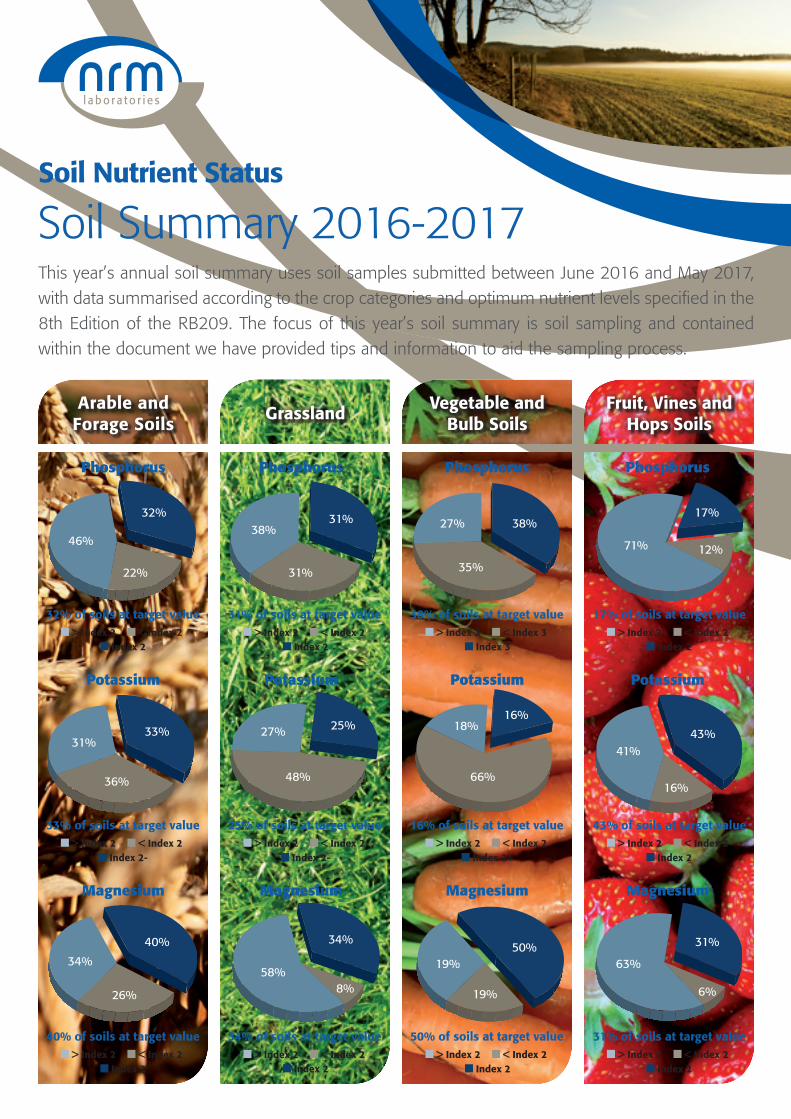
Soil Summary 2016-2017Soil Nutrient Status
This year’s annual soil summary uses soil samples submitted between June 2016 and May 2017, with data summarised according to the crop categories and optimum nutrient levels specified in the 8th Edition of the RB209. The focus of this year’s soil summary is soil sampling and contained within the document we have provided tips and information to aid the sampling process.
Arable andForage Soils
Grassland Vegetable andBulb Soils
Fruit, Vines andHops Soils
Phosphorus Phosphorus Phosphorus Phosphorus
32% of soils at target value 31% of soils at target value 38% of soils at target value 17% of soils at target value
46%
22%
32%38%
31%
31% 27%
35%
38%
71% 12%
17%
Magnesium Magnesium Magnesium Magnesium
40% of soils at target value 34% of soils at target value 50% of soils at target value 31% of soils at target value > Index 2 < Index 2
Index 2 > Index 2 < Index 2
Index 2 > Index 2 < Index 2
Index 2 > Index 2 < Index 2
Index 2
34%
26%
40%
58%8%
34%
19%
19%
50%63%
6%
31%
Potassium Potassium Potassium Potassium
33% of soils at target value 25% of soils at target value 16% of soils at target value 43% of soils at target value
31%
36%
33% 27%
48%
25% 18%
66%
16%
41%
16%
43%
> Index 2 < Index 2 Index 2-
> Index 2 < Index 2 Index 2-
> Index 2 < Index 2 Index 2+
> Index 2 < Index 2 Index 2
> Index 2 < Index 2 Index 2
> Index 2 < Index 2 Index 2
> Index 3 < Index 3 Index 3
> Index 2 < Index 2 Index 2
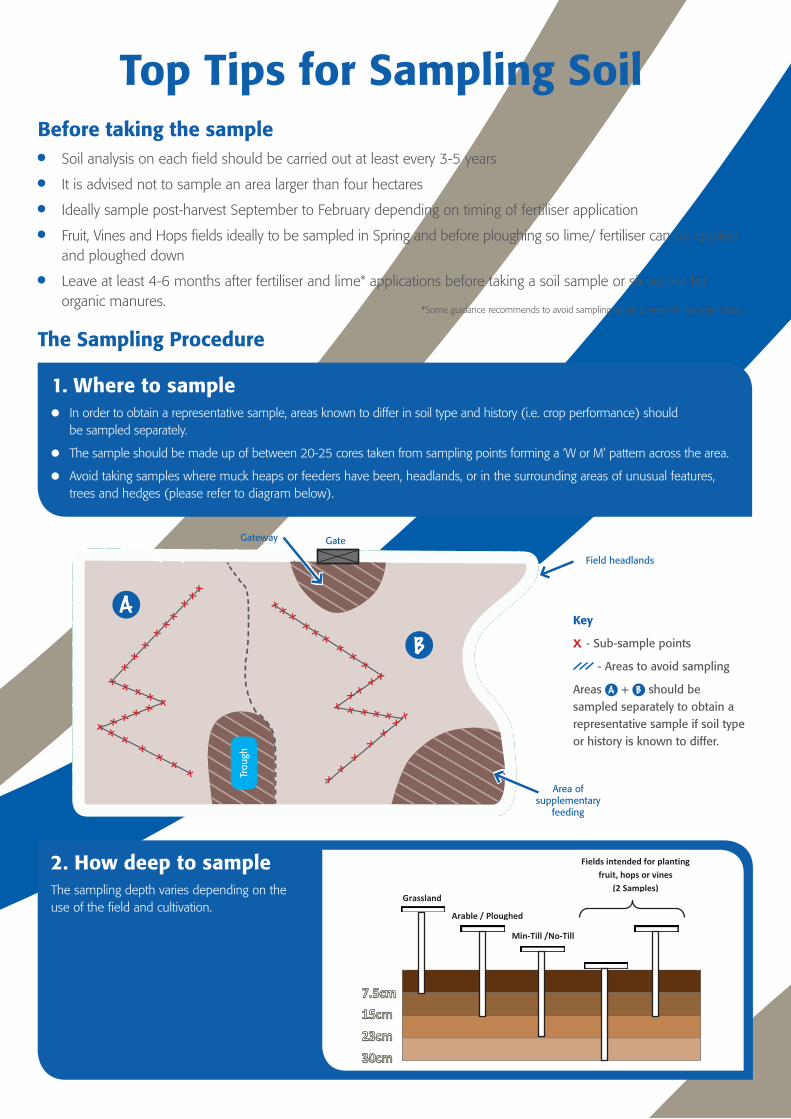
Top Tips for Sampling SoilBefore taking the sample Soil analysis on each field should be carried out at least every 3-5 years
It is advised not to sample an area larger than four hectares
Ideally sample post-harvest September to February depending on timing of fertiliser application
Fruit, Vines and Hops fields ideally to be sampled in Spring and before ploughing so lime/ fertiliser can be applied and ploughed down
Leave at least 4-6 months after fertiliser and lime* applications before taking a soil sample or six weeks for organic manures.
The Sampling Procedure
1. Where to sample In order to obtain a representative sample, areas known to differ in soil type and history (i.e. crop performance) should
be sampled separately.
The sample should be made up of between 20-25 cores taken from sampling points forming a ‘W or M’ pattern across the area.
Avoid taking samples where muck heaps or feeders have been, headlands, or in the surrounding areas of unusual features, trees and hedges (please refer to diagram below).
2. How deep to sampleThe sampling depth varies depending on the use of the field and cultivation.
Key
X - Sub-sample points
- Areas to avoid sampling
Areas A + B should be sampled separately to obtain a representative sample if soil type or history is known to differ.
A
B
XX
XX
XX
XX
X
X XX X
XXXXXX X
XX
XX
X
XX
XX
XX
XX
XX
XX
XX X X X X X
XX
X
XX
XArea of
supplementary feeding
GateGateway
Field headlands
Trou
gh
Grassland
Arable / Ploughed
Min-Till /No-Till
Fields intended for planting fruit, hops or vines
(2 Samples)
*Some guidance recommends to avoid sampling within 2 years of lime application.
Natural Resource ManagementA division of Cawood Scientific Ltd
Send to: Natural Resource Management, Coopers Bridge, Braziers Lane, Bracknell, Berkshire RG42 6NSA division of Cawood Scientific Ltd
Standard Soil Analysis RequestFIELD NAME OR O.S.No.
SOILTYPE
FIELDSIZE(H/A)
CROP CODEPRESENT FUTURE
STRAWREMY/N
*** Package Codes / Quote Reference /
Addtional Trace Elements
1
2
3
4
5
6Client Details
Name
Address
Post Code
Merchant
Local Rep.
Phone No.
LIME RECOMMENDATION YES / NO *
FYMY/N
REPORT NUMBER
LABORATORYREFERENCE
BATCH NUMBER
COMPLETE FOR LIME AND FERTILISER RECOMMENDATIONS
*** Please use the above column to specify against each sample where any additional analysis is required:
a) Package Codes (e.g. A003)b) Quote References (e.g. Q12345)c) Individual Trace Elements (e.g. Cu, B)
ANALYSED BY COURTESY OFNRMCOOPERS BRIDGEBRAZIERS LANEBRACKNELLBERKSHIRE RG42 6NS
U 49
Arable & ForageWinter Wheat WWWinter Barley WBSpring Barley SBAWinter Oats WOSpring Oats SOCereals CESugar Beet SBTOilseed Rape ORPotatoes Main PMSpring Wheat SWForage Swedes SDForage Rape FRFodder Beet FBForage Maize MZSpring Linseed LIMalting Barley MBTriticale TRRye RYWinter OS Rape WOSRSpring OS Rape SOSRForage Turnips FTU
Please complete crop code details on request form, to ensure accurate fertiliser and lime recommendations.
Peas (D and V) PEDForage Rye FRYForage Triticale FTRRye Grass 4 Seed RGS
Vegetables & BulbsMarket Peas PEField Beans BEKale KAStubble Turnips STMangels MABrussel Sprouts BRCabbage CBCauliflowers CFMaincrop carrots CAOnions ONBulbs BUBeetroot RBCalabrese CLCelery CYCourgettes CORadish RA
Leeks LKParsnips PNMaincrop Turnips TULettuce LETCulinary Swede CSAsparagus Established ASPAsparagus Subsequent ASSBroad Beans BBDwarf Beans DBRunner Beans RUNBSweetcorn SWC
Fruit, Vines & HopsTop Fruit TFEstablished Hops HOStrawberries STRRaspberries RBYVines Est VIBlackcurrants BCRedcurrants RCGoosberries GBLoganberries LB
Tayberries TBBlackberries BBYHops Preplanting HPFruit Preplantng FPVines Preplantng VPCherries CHYPlums PLMPears PRSApples APLBlueberries BLB
GrassPerm Pasture PPGrazing GZHay HASilage SIGrass Reseed RSHorse Pasture GZHSilage 1st Cut SI1Silage 2nd Cut SI2Silage 3rd Cut SI3Silage 4th Cut SI4
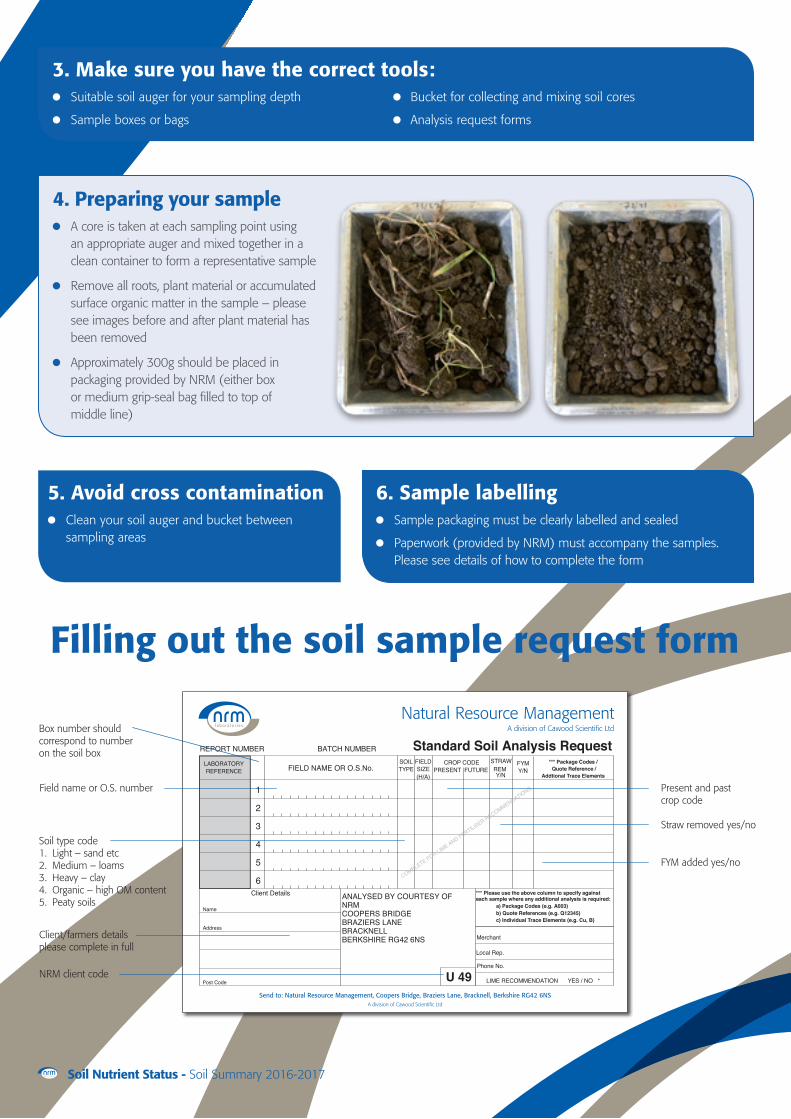
Box number shouldcorrespond to numberon the soil box
Field name or O.S. number
Soil type code1. Light – sand etc2. Medium – loams3. Heavy – clay4. Organic – high OM content5. Peaty soils
Client/farmers detailsplease complete in full
NRM client code
Present and past crop code
Straw removed yes/no
FYM added yes/no
Filling out the soil sample request form
3. Make sure you have the correct tools: Suitable soil auger for your sampling depth Bucket for collecting and mixing soil cores
Sample boxes or bags Analysis request forms
4. Preparing your sample A core is taken at each sampling point using
an appropriate auger and mixed together in a clean container to form a representative sample
Remove all roots, plant material or accumulated surface organic matter in the sample – please see images before and after plant material has been removed
Approximately 300g should be placed in packaging provided by NRM (either box or medium grip-seal bag filled to top of middle line)
6. Sample labelling Sample packaging must be clearly labelled and sealed
Paperwork (provided by NRM) must accompany the samples. Please see details of how to complete the form
5. Avoid cross contamination Clean your soil auger and bucket between
sampling areas
Soil Nutrient Status - Soil Summary 2016-2017
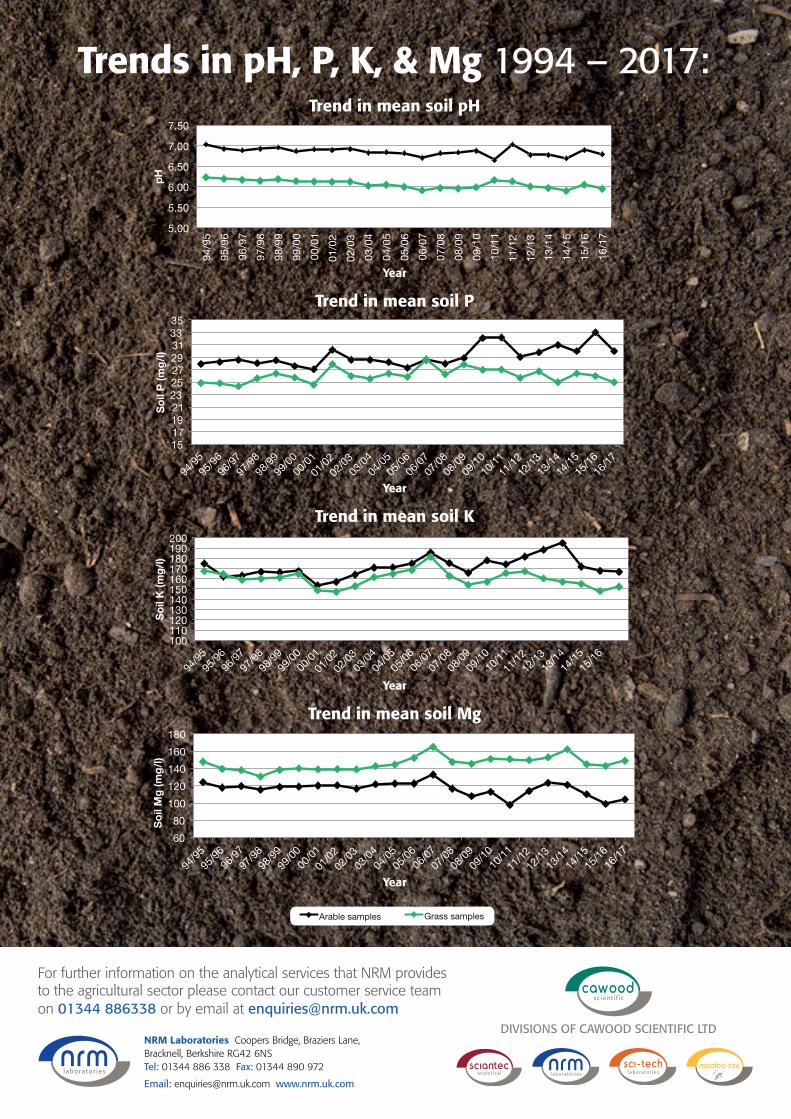
Trends in pH, P, K, & Mg 1994 – 2017:Trend in mean soil pH
5.00
5.50
6.00
6.50
7.00
7.50
94/9
5
95/9
6
96/9
7
97/9
8
98/9
9
99/0
0
00/0
1
01/0
2
02/0
3
03/0
4
04/0
5
05/0
6
06/0
7
07/0
8
08/0
9
09/1
0
10/1
1
11/1
2
12/1
3
13/1
4
14/1
5
15/1
6
16/1
7
pH
Arable samples
Grass samples
15 17 19 21 23 25 27 29 31 33 35
Soil
P (m
g/l)
Arable samples
Grass samples
100 110 120 130 140 150 160 170 180 190 200
Soil
K (m
g/l)
Arable samples
Grass samples
60
80
100
120
140
160
180
Soil
Mg
(mg/
l)
Arable samples
Grass samples
Year
5.00
5.50
6.00
6.50
7.00
7.50
94/9
5
95/9
6
96/9
7
97/9
8
98/9
9
99/0
0
00/0
1
01/0
2
02/0
3
03/0
4
04/0
5
05/0
6
06/0
7
07/0
8
08/0
9
09/1
0
10/1
1
11/1
2
12/1
3
13/1
4
14/1
5
15/1
6
16/1
7
pH
Arable samples
Grass samples
15 17 19 21 23 25 27 29 31 33 35
Soil
P (m
g/l)
Arable samples
Grass samples
100 110 120 130 140 150 160 170 180 190 200
Soil
K (m
g/l)
Arable samples
Grass samples
60
80
100
120
140
160
180
Soil
Mg
(mg/
l)
Arable samples
Grass samples
Trend in mean soil P
Year
5.00
5.50
6.00
6.50
7.00
7.50
94/9
5
95/9
6
96/9
7
97/9
8
98/9
9
99/0
0
00/0
1
01/0
2
02/0
3
03/0
4
04/0
5
05/0
6
06/0
7
07/0
8
08/0
9
09/1
0
10/1
1
11/1
2
12/1
3
13/1
4
14/1
5
15/1
6
16/1
7
pH
Arable samples
Grass samples
15 17 19 21 23 25 27 29 31 33 35
Soil
P (m
g/l)
Arable samples
Grass samples
100 110 120 130 140 150 160 170 180 190 200
Soil
K (m
g/l)
Arable samples
Grass samples
60
80
100
120
140
160
180
Soil
Mg
(mg/
l)
Arable samples
Grass samples
Trend in mean soil K
Year
5.00
5.50
6.00
6.50
7.00
7.50
94/9
5
95/9
6
96/9
7
97/9
8
98/9
9
99/0
0
00/0
1
01/0
2
02/0
3
03/0
4
04/0
5
05/0
6
06/0
7
07/0
8
08/0
9
09/1
0
10/1
1
11/1
2
12/1
3
13/1
4
14/1
5
15/1
6
16/1
7
pH
Arable samples
Grass samples
15 17 19 21 23 25 27 29 31 33 35
Soil
P (m
g/l)
Arable samples
Grass samples
100 110 120 130 140 150 160 170 180 190 200
Soil
K (m
g/l)
Arable samples
Grass samples
60
80
100
120
140
160
180
Soil
Mg
(mg/
l)
Arable samples
Grass samples
Trend in mean soil Mg
Year
5.00
5.50
6.00
6.50
7.00
7.50
94/9
5
95/9
6
96/9
7
97/9
8
98/9
9
99/0
0
00/0
1
01/0
2
02/0
3
03/0
4
04/0
5
05/0
6
06/0
7
07/0
8
08/0
9
09/1
0
10/1
1
11/1
2
12/1
3
13/1
4
14/1
5
15/1
6
16/1
7
pH
Arable samples
Grass samples
15 17 19 21 23 25 27 29 31 33 35
Soil
P (m
g/l)
Arable samples
Grass samples
100 110 120 130 140 150 160 170 180 190 200
Soil
K (m
g/l)
Arable samples
Grass samples
60
80
100
120
140
160
180
Soil
Mg
(mg/
l)
Arable samples
Grass samples
pH and Major Nutrient Maps for England and WalesFor this annual summary we have been able to work with the British Geological Society to present the average pH, P, K and Mg figures for soils taken from arable and grassland fields within England and Wales on a regional scale. These are split across two time periods, on the left soil samples taken between 2004-2009 and on the right soil samples take between 2010-2015. The White regions on the maps denote other land cover types where no data are available. The maps are based on more than 200,000 separate analyses. The use of this data may be beneficial in the future for policy makers in determining appropriate actions to ensure the health and long term future productivity of UK soils.
87.667.3376.666.3365.665.33
Avail. K 2004 – 2009 Avail. K 2010 – 2015
28018817416014613211810490
1 2- 2+
Topsoil pH 2004 – 2009 Topsoil pH 2010 – 2015
Avail. P 2004 – 2009 Avail. P 2010 – 2015 Avail. Mg 2004 – 2009 Avail. Mg 2010 – 2015
603431282522191613
1 2 3 2 31
17015013011090705030 300
For further information on the analytical services that NRM provides to the agricultural sector please contact our customer service team on 01344 886338 or by email at [email protected]
DIVISIONS OF CAWOOD SCIENTIFIC LTDNRM Laboratories Coopers Bridge, Braziers Lane, Bracknell, Berkshire RG42 6NS Tel: 01344 886 338 Fax: 01344 890 972
Email: [email protected] www.nrm.uk.com