soil moisture movement and groundwater recharge by tritium tracer tagging technique
TRANSCRIPT

Proc. Indian Acad. Sci., Vol. 85 A, No. 6, 1977, pp. 462-471.
Soil moisture movement and groundwater recharge by tritiumtracer tagging technique
J. BAHADUR, R. K. SAXENA AND P. MOOKERJEE
Nuclear Research Laboratory, Indian Agricultural Research Institute, New Delhi 110012
MS received 30 August 1976; in revised form 24 March 1977
ABSTRACT
The paper deals with the study of rate of soil moisture movement andrecharge to groundwater system at Indian Agricultural Research Institute(TART) farm for the years 1973, 1974 and 1975. The utility of artificiallyinjected tritium, experimental techniques adopted and a quantitativedetermination of recharge and moisture movement rates are discussed.Corrections for upward movement of moisture after the end of monsoonhave been used to calculate the average rates of water movement belowthe injection level and groundwater recharge. Average rates of soilmoisture movement and recharge are 9.4 mm/d and 27.4% (193 mm)of monsoon precipitation for three years respectively. Under favourableconditions the diffusion coefficients for soil water system are calculatedassuming Gaussian distribution of tritium concentrations in the soilprofiles. The average value of diffusion coefficient is 2.5 x 10⁻⁵ cm 2/sfor the sandy loam soils. The variation in recharge is mainly dueto inherent variability in soil physical properties and vegetative cover.The technique is not found reliable for higher water table conditionson account of lateral flow.
1. INTRODUCTION
GROUNDWATER recharge assumes a greater importance for arids and semi-arids where water is a limiting factor for all developmental activities, andmore so for agricultural operations. A complete knowledge about thebehaviour of inputs from monsoon and surface irrigation is necessary foran optimum use of soil water for increased agricultural production.
The transit of monsoonal and /or irrigation water through soils causeschanges in soil moisture content. When the amount of water applied istoo high, the excess of water is drained out of the root zone and rechargesthe groundwater. For its judicious use, fate of applied inputs in terms
462

SOIL MOISTURE MOVEMENT AND GROUNDWATER RECHARGE 463
of rate of soil moisture movement and recharge has to be quantitativelydetermined in the soil profile. For study of soil moisture movement andgroundwater recharge techniques such as tensiometers and lysimeters areroutinely used but these methods do not monitor continuously the move-ment of soil water. Further, these methods fail to differentiate betweenold soil water and relatively fresh incoming water, together with theirinability to determine directly rate of soil moisture movement. For suchinvestigations, a tracer method, i.e., tracer tagging technique using deuteriumor tritium, introduced by Zimmerman et a!., 1 ' 2 has made it possible tofollow the movement of soil moisture. They have concluded that themovement of soil water is layered, e.g., applied water on the surface, simplypushes the old water downward, more or less like a piston flow. Presentinvestigations were taken up to study the rate of soil moisture movementand amount of vertical recharge to groundwater with a view to make anefficient use of water on an agricultural farm.
2. DESCRIPTION OF SITE
TART farm (figure 1) is situated between latitudes (28° 37'-28° 39' N)and longitudes (77° 9'-77° 11' E) and lies at the end of the western flankof the remnants of the Aravalli hills. The farm area is largely made upof alluvial and colluvial materials. Nodular calcareous material occurslocally. Ferromanganese concretions are also met with. Quartz domi-nates in the sand fraction with iron oxide minerals up to 5-10% and biotitefrom 5-25%. 3 The soils in the farm are named locally as Holambi, Meh-rauli, Palam and Jagat series belonging to hyperthermic family of typicustochrepts, while Daryapur series belongs to hyperthermic family of typicustofluvents. The soils vary from fine to coarse loam.
On an average, the soils contain 0.5 to 2% coarse sand, 37 to 53% finesand, 1.8 to 28% coarse silt, 10 to 17% fine silt and 12 to 23% clay andhave a variable distribution. The farm gets canal and also tubewell irri-gation while there are areas in Todapur which are cultivated under drylandfarming conditions.
3. EXPERIMENTAL METHODOLOGY
Small diameter holes were prepared by driving a pointed steel rod(8 mm outer diameter) in soils. Tn freshly driven holes a brass tube (5 mmouter diameter) was inserted and cleared by forcing air from a pressurepump. Through the brass tube, 2 ml HTO (5pci/ml) was injected usinga piston micropipette. The tube was further rinsed by 2 ml distilled waterand final flushing was done by air under pressure. The injections weredone at 10 cm interval along a line or in a plain. The injection holes were
A8—June 77

464 1. BAHADUR, R. K. SAXENA AND P. MOOKERJEE
G E
ISYOT
G E GA
' 6 F R•1A _ _
3NAD. G•6 G'B.0
N-L
" -- '- \LOCKSz
M-17 M¤ N BL CK
M-1^ M-li Y-! N-7 M 2 X
---- % % OAMMA
M 1 _ x __ _ _ _ _ _ _ _ _\ 00f
GARDEN
M•12 Y•9 Mx• M^J 2 ^ G
USE0 - TU6E WELLSIR - IRRIGATION TANK.
S -INJECTION SITES
Figure 1. Location map of IARI farm area with tritium injection sites.
subsequently filled by powdered dry soil taken from the same region. Ironnails were driven around the corners of the area to serve as markers. The loca-tions of HTO injections are shown in figure 1. Soil cores were taken perio-dically using a Veihmeyer tube and a pneumatic soil coring machine. Soilmoisture was extracted by ordinary distillation of soil cores. In situ soilmoisture observations were made at regular intervals by a neutron moisturemeter- (Troxier). The extracted soil moisture was assayed for tritium acti-vity in a liquid scintillation spectrometer (Packard 3320), using a dioxane-naphthalene cocktail and also Instagel when activity levels were low. Rateof soil moisture movement was calculated using equation (1).
v = d/t or = d2 — d1 (1)t2 — tl
where v is the rate of soil moisture movement and d is the shift of the tracerpeak, while dl, d2 are the depths of peak tritium concentration at time t l
and t2 respectively.
Recharge R below the injection depths is calculated from the relationR=8Xd (2)
SOIL MOISTURE MOVEMENT AND GROUNDWATER RECHARGE 465
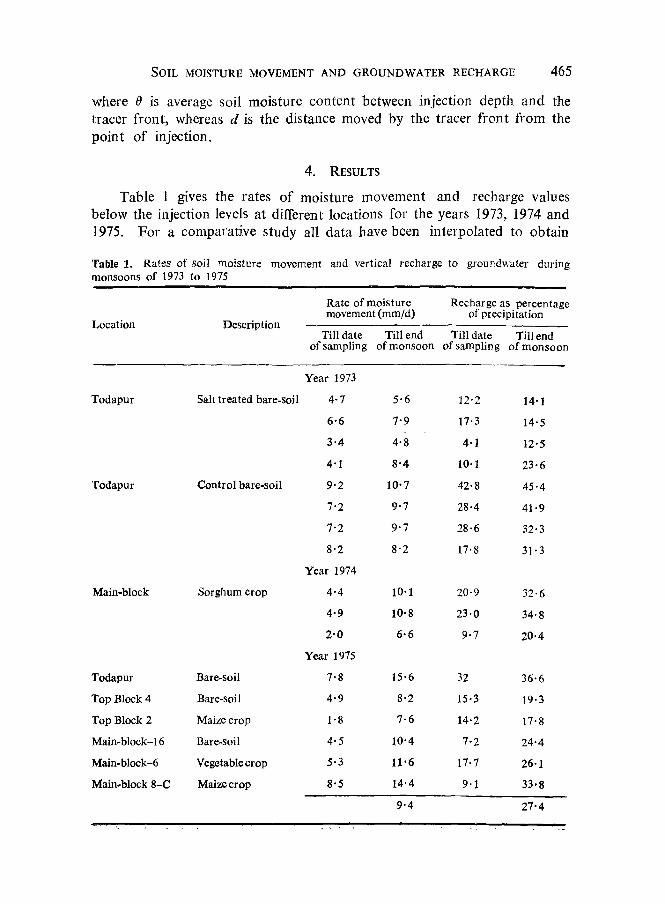
where 0 is average soil moisture content between injection depth and thetracer front, whereas d is the distance moved by the tracer front from thepoint of injection.
4. RESULTS
Table 1 gives the rates of moisture movement and recharge valuesbelow the injection levels at different locations for the years 1973, 1974 and1975. For a comparative study all data have been interpolated to obtain
Table 1. Rates of soil moisture movement and vertical recharge to groundwater duringmonsoons of 1973 to 1975
Rate of moisture Recharge as percentagemovement (mm/d) of precipitation
Location DescriptionTill date Till end Till date Till end
of sampling of monsoon of sampling of monsoon
Year 1973
Todapur Salt treated bare-soil 4.7 5.6 12.2 14.1
6.6 7.9 17.3 14.5
3.4 4.8 4-1 12.5
4.1 8.4 10.1 23.6
Todapur Control bare-soil 9.2 10.7 42.8 45.4
7.2 9.7 28.4 41.9
7.2 9.7 28.6 32.3
8.2 8.2 17.8 31.3
Year 1974
Main-block Sorghum crop 4.4 10.1 20.9 32.6
4.9 10.8 23.0 34.8
2.0 6.6 9.7 20.4
Year 1975
Todapur Bare-soil 7.8 15.6 32 36.6
TopBlock4 Bare-soil 4.9 8.2 15-3 19.3
Top Block 2 Maize crop 1.8 7.6 14.2 17.8
Main-block-16 Bare-soil 4.5 10.4 7•2 24.4
Main-block-6 Vegetable crop 5.3 11.6 17.7 26.1
Main-block 8-C Maize crop 8.5 14.4 9.1 33.8
9.4 27.4

466 J. BAHADUR, R. K. SAXENA AND P. MOOKERJEE
0
60
120
+80
240
U
z
= o
0
00
120
Igo
240
dpm /ql
80 loo ISO 200 250
PLOT-2
DATE OF INJECrION 6 •6 73 d.pth 30 0^ i
DATE OF SAMPLING II IJ•73 - ----
'. .. 11 24 I 7 I ---
CO 147 03 cm
COG 1 15 3 cm
PLOT-3
DATE OF INJECTION 6.6 73 Id.pt 30c^nI
DATE OF SAMPLING 20 10.73 -----
n •^ a 24 • I I 13 -
CO t28•t cm -----
C.G 99-5ci,
Figure 2. Tritium activity distribution near run-off plots of Todapur region (bare-soil)during 1973 monsoon.
rates of moisture movement and recharge till 1st October of every year,since it was possible to determine rates of upward movement of tracerfront during October/November every year, by repeated soil corings.It was found that the tracer front started moving up during October/November 1973, at an average rate of I -2 mm/d and this figure has beenused to deduce the recharge due to monsoon as on 1st October 1973 (sincemonsoon practically ceases by the end of September). The average ratesof soil moisture movement during monsoon in control and salt treatedplots (bare-soil) are 9.6 and 6.7 mm/d respectively while the averagerecharge values expressed as percentage of 1973—precipitation are 37.7%and 17.4% respectively. This indicates that the top 15 cm of soil treatedwith NaCl reduces the rate of soil moisture movement by 2.9 mm/d andthe recharge by about 20%, and is due to deflocculation of soil aggregates.

200
xI-nWO
100
300
A (']aPrh C'"
SOIL MOISTURE MOVEMENT AND GROUNDWATER RECHARGE 467
For control plot, soil moisture movement rates range from 8.2 to 10.7mm/d and that more than 30% of precipitation recharges the soil profilebelow 30 cm depth in nonirrigated Todapur region. Some typical tritiumdistribution for 1973-monsoon are shown in figure 2.
The interpolated rates of soil moisture movement during 1974-monsoonfor natural vegetation are 6.6 to 10.8 mm/d in main-block. The corres-ponding range of recharge values till 1st Octobes 1974 are 20.4 to 34.8%of total precipitation. Amounts of actual irrigation (though rarely given)are not known; therefore, percentage recharge figures are a little on thehigher side. The high values of soil moisture movement in main-blockshow that the soils in main-block are well drained because of better soilstructure resulting from frequent ploughing for cultivation. A typicaltritium distribution for 1974-monsoon is shown in figure 3.
dpm ml
0 100 200 300 400 Soo 600 700 Boo 900
,00
Figure 3. Tritium distribution at Todapur recharge profile under natural vegetation uur:114
Monsoon 1974,

468 J. BAHADUR, R. K. SAXENA AND P. MOOKERJEE
Soil samplings in October-November 1975 at top-block give on anaverage a rate of 1.6 mm/d for soil moisture movement in upward directionAlso, the logging at three boreholes at Todapur with neutron moisturemeter has shown that this rate of upward moisture loss during October-November 1975, is 0.9, 1.4 and 2.3 mm/d averaging to 1.6 mm/d . Thisdemonstrates the validity of tritium tagging technique for studying upwardmoisture movement as well. It may be noted that the corresponding valuefor 1973-monsoon was 1.2 mm/d. This is mainly dependent on availablemoisture, pattern of rainfall and other environmental factors, affectingthe microclimate of the area.
Interpolated figures for rates of moisture movement and rechargetill 1st October 1975 at Todapur are 15.6 mm/d and 36.6%. For topblock, the corresponding values range from 7.6 to 8.2 mm/d and 17.8 to19.3% respectively whereas in main-block, rates of moisture movement varyfrom 10.4 to 14.4 mm/d and recharge values range from 24.4 to 33.8%.Figure 4 gives some typical distributions for 1975-monsoon. It is seen fromthe results of 1973, 1974 and 1975 that about 27% (19.3 cm) of monsoonprecipitation recharges groundwater in this area of Delhi. This value exceedsthe recharge values of 15% (8 cm), 18% (8.5 cm) and 20% (21.5 cm) forHaryana, Punjab and Western UP, respectively as reported 4-s
5. DISCUSSION
Thomas and Swaboda' have questioned the utility of tritium as an idealtracer because of its adsorption and retardation in certain types of soils.However, in most of the soils the behaviour of tritiated water is almost thesame as that of ordinary water. In laboratory soil-column studies Knutssonand Forsberg" reported that barring montmorillonite and bentonite domi-nant soils, there was no significant adsorption or retardation of HTO insoils dominant in illite and kaolinite. The retardation of HTO in mont-morillonite dominant soils is attributed to isotopic exchange with inter-layer water. Conceptually, distribution of tritium concentration in a soilsystem is modified because of molecular diffusion and follows more or lessa Gaussian distribution. The width of such a Gaussian curve has beenused to determine the coefficient of diffusion from the formula a• 2 = 2Dtwhere a is the standard deviation, D the diffusion coefficient and t is thetime elapsed between injection and sampling of the tracer. Most of theexperimentally obtained tritium distributions follow a Gaussian distributionwhile some of them show a strong deviation from it. These deviations aremet in those regions where water table rose almost to the surface duringmonsoon. It is seen (table 2) that D-values are mostly the same as obtainedby other investigators. High D-values are due to plant demands on soil

O
0Cl
0
0N
Nn
N °KI Z
O0
nrn
SOIL MOISTURE MOVEMENT AND GROUNDWATER RECHARGE 469
EUO
n r on w .W p- ^ N
ZN
ZOO 1- V p E
0 OI W 3o ? N oL-
O O ONO 0 W Wc y F l7
SI O 00
E Oo Ov Y
OON
O LE
O
^t nn u 0
_ p 9 A-- N
¢^ Q O
0I w E- ? N O
LL 4O ml O O O
W
O Q OSI O O V
0
m
OO
o Ov O
OON
pO
0Cl
0
ON
N
0
;1 OZ
0Iy E
p f u
ID
J < N4_ NUI 4 NO
Wo
OD
w
0 0 0 0 0 0 0 0 0 O Owf Cl 0 N h O N m O
N'
'W7 NI H1d30

470 J. BAIIADUR, R. IC. SAXENA AND P. MOOKERJ$E
Table 2. Diffusion coefficient for soil-water system
Location Peak Q D cm2/sec(x 10-6)
Average valueof D
1973 Todapur Bare-soil plot 2 112.5 cm 29.67 2.9
1973 Todapur Bare-soil plot 3 97.5 cm 19.9 1.34
1974 Todapur (WTC) 75 cm 21.4 1.48
1974 Todapur plot F 2nd sampling 150 cm 21.0 2.6
1974-75 Todapur Grid I 225 cm 53.9 3.1 2.5 x 10⁻⁵
cm2/sec
1974-75 Todapur Grid II 165 cm 71.08 5.4*
Todapur Grid III 225 cm 56.9 3.4*
Todapur IV 150 cm 49.0 2.5
1975 MB-8C. R1 105 cm 43.25 26*
MB-8C. R1 2nd sampling 215 cm 128 78*
„ MB-8C R, 105 cm 47 30*
MB-8C R, 2nd sampling 165 cm 90 38*
* Higher values are due to water uptake by plants and lateral flow due to water loggingof the soils in the area.
moisture causing redistribution of soil water and subsequent distortionof tracer distribution due to dispersive effects while small variations inD-values may be due to the inherent variability in soil structure and texture,However, when peak activity of the tracer is monitored, the average ratesof soil moisture movement and recharge to groundwater can be determinedreliably.
The uncertainty in the estimation of peak of the labelled layer causesan error in the determination of rates of moisture movement and recharge.This uncertainty is due to molecular diffusion which broadens the tracerfront. If the time interval between injection and sampling is large, i.e.,allowing the tracer front to travel about one meter a year the error due todiffusion 2 is about 10% which can be further minimized by increasingtime ' t' as o increases in direct proportion to square root of t. The samplingerror practically can be reduced to a certain limit only since tracer concen-tration determined for every core soil core is just an average concentration forits entire length. The resolution in tracer distribution can still be made betterif lengths of soil cores are limited between 3 to 5 cm. However, this necessi-tates collection of about a meter long soil core having a large diameterwhich could be sliced off to yield smaller cores. The overall error in the

SOIL MOISTURE MOVEMENT AND GROUNDWATER RECHARGE 471
estimation of recharge and soil moisture movement rates is estimatedto be about 15%.
From the observed data it is evident that recharge to groundwater isvariable in semi-arids and that a representative recharge value should bedetermined by taking average of several years in order to fully exploit ground-water for agricultural production, ensuring that total groundwater draftdoes not exceed the average recharge in a given region.
6. CONCLUSIONS
The rates of soil moisture movement vary from 4•8 to 15.6 m1n/dduring monsoon period while vertical recharge to groundwater varies fromabout 12.5% to 45.4% of total precipitation in sandy loam soils of IARIfarm. About 27% of average annual precipitation recharges groundwaterin this region of Delhi. Extensive work is being planned in neighbouringregion so as to improve the efficiency of water use. Tritium tracer taggingis a practical and useful technique for quantitative evaluation of rates ofmoisture movement in soils and vertical recharge to groundwater in alluvialand colluvial formations. From tritium tracer technique this infor-mation is difficult to obtain for soils having cracks and fractures and alsofor those regions where water-table is generally very shallow, as the distri-bution of tracer concentration is drastically perturbed due to lateral flow.
REFERENCES
1. Zimmerman, U., Munnich, K. O. and Roether,' W., Geophysical Monograph No. 11Am. Geophys. Union, Wash. p. 18 (1967).
2. Zimmerman, U. eta!., Science 152 346 (1966).
3. Soil Survey and Land Use Planning of the IARI farm Report No. 375 (ICAR). Directorate ofAIS and LOS (ICAR), New Delhi (1976).
4. Datta, P. S. and Goel, P. S., Pre-print for J. Hydrology (1976).
5. Goel, P. S., Datta, P. S. and Tanwar, B. S., Uunpublished report (1976).
6. Datta, P. S., Goel, P. S., Rama and Sangal, S. P., Proc. Indian Acad. Sci. A77 1 (1973).
7. Thomas, G. W. and Swaboda, A. R., Soil Sci. p. 110 (1970).
8. Knutsson, G. and Forsberg, H. G., Proc. Symp. Isotopes Hydrology, IAEA, Vienna, p. 629(November 1966).
A9—Junc 77