soil lime measurement, determination of soil carbonates by a rapid gasometric method
TRANSCRIPT
SOIL LIME MEASUREMENT
Determination of Soil Carbonates by a Rapid Gasometric Method
MICAH W. M. LEO' Canada Department of Agriculture, Brandon, Manitoba, Canada
A technique using a portable, unbreakable, easy to assemble apparatus was designed for rapid determination of calcium carbonate equivalent of calcareous soils in the labora- tory and in the field. CO, evolved was measured gasometrically within a few minutes, and the calcium carbonate equivalent was obtained by comparison with a standard. The method gave reproducible results which were comparable in accuracy to the titration method. The accuracy of the new method was not affected by increasing contents of lime in the soils tested. Fifty soil samples from 12 calcareous soil profiles were tested by the gasometric method, and results were reported. The rapid gasometric method appears to be useful in determining both lime contents of calcareous soils and calcium carbonate equivalents of high lime materials.
HE LIME CONTENT of soil is an T. important factor in agriculture because it has a significant bearing a n physical and chemical properties of soils as well as on growth and production of crops. In addition, the distribution of lime content in soil profiles tells a story of soil genesis and has been used as a criterion for sail classifications.
O n an ordinary ficld study trip or a soil survey tour, a few drops of HCl on a soil profile from an acid bottle would usually serve the purpose of distinguish- ing calcareous soils or horizons from nan- calcareous ones. But this simple and widely used technique does not give quantitative information.
Considerable work has been done with development of better methods for lime determination. Edsan (Z ) , who titrated calcium carbonate equivalent, found that a 30-minute digestion period was re- quired and that results were only ac- curate within 10%. Pierce and Hae- nisch (7) described a carbon dioxide evolution method which employed a carbon dioxide absorption material such as NaOH. This method was time-con- suming since COS had to be evolved slowly for complete absorption. The evolved COI may be collected and weighed in soda-lime (6) . Inorganic carbonates may also be determined gasometrically in the laboratory by measuring the volume of COS evolved according to the method of Horton and Newson (4), but their apparatus could not he employed conveniently in the field. Piper (8) described the Passon's
Present address: Isotopes, Inc., West- wood, N. J.
manometric method for determining carbanates as modified by Skewes. This method was later improved by Williams ( 7 7 ) , Martin and Reeve (51, Skinner and Halstead (9) , and most re- cently by Skinner, Halstead and Brydon
A rapid and accurate test for soil carbonates which could be employed in both the laboratory and field would greatly facilitate soil work, especially in the prairie regions of Canada and the United States where calcareous soils are predominant.
Methods ond Maferiafs
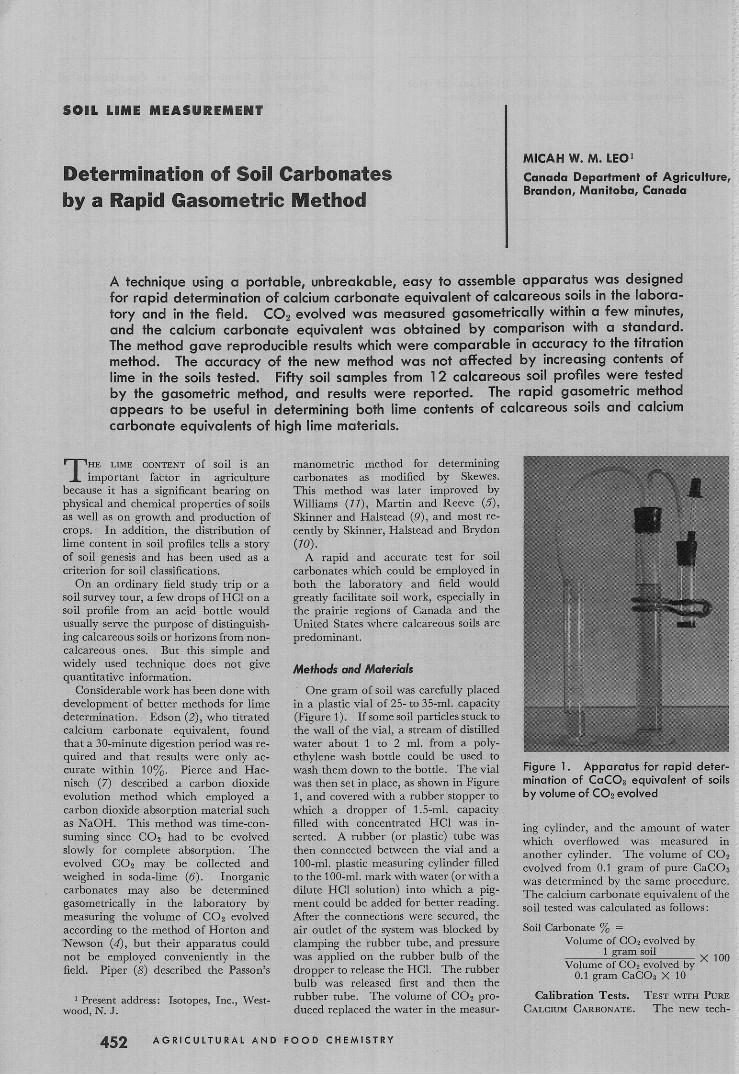
One gram of soil was carefully placed in a plastic vial of 25- to 35-ml. capacity (Figure 1). If some soil particles stuck to the wall of the vial, a stream of distilled water about 1 to 2 ml. from a poly- ethylene wash bottle could be used to wash them down to the bottle. The vial was then set in place, as shown in Figure 1, and covered with a rubber stopper to which a dropper of 1.5-ml. capacity filled with concentrated HC1 was in- serted. A rubber (or plastic) tube was then connected between the vial and a 100-ml. plastic measuring cylinder filled to the 100-ml. mark with water (or with a dilute HC1 solution) into which a pig- ment could be added for better reading. After the connections were secured, the air outlet of the system was blocked by clamping the rubber tube, and pressure was applied on the rubber bulb of the dropper to release the HCI. The rubber bulb was released first and then the rubber tube. The volume of COz pro- duced replaced the water in the measur-
i 70).
Figure 1. Apparatus for rapid deter- mination of CaCOa equivolent of soils by volume of COZ evolved
ing cylinder, and the amount of water which overflowed was measured in another cylinder. The volume of COS evolved from 0.1 gram of pure CaC08 was determined by the same procedure. The calcium carbonate equivalent of the soil tested was calculated as follows:
Soil Carbonate % = Volume of COS evolved bv
x 100 I gram-soil Volume of COX evolved by
0.1 gram CaCOs X 10
Calibration Tests. TEST WITH PURE CALCNM CARBONATE. The new tech-
452 A G R I C U L T U R A L A N D F O O D C H E M I S T R Y
CALCIUU CARBONATE EQUIVALENT, OR LIME CONTENT IN PERCENTAGE
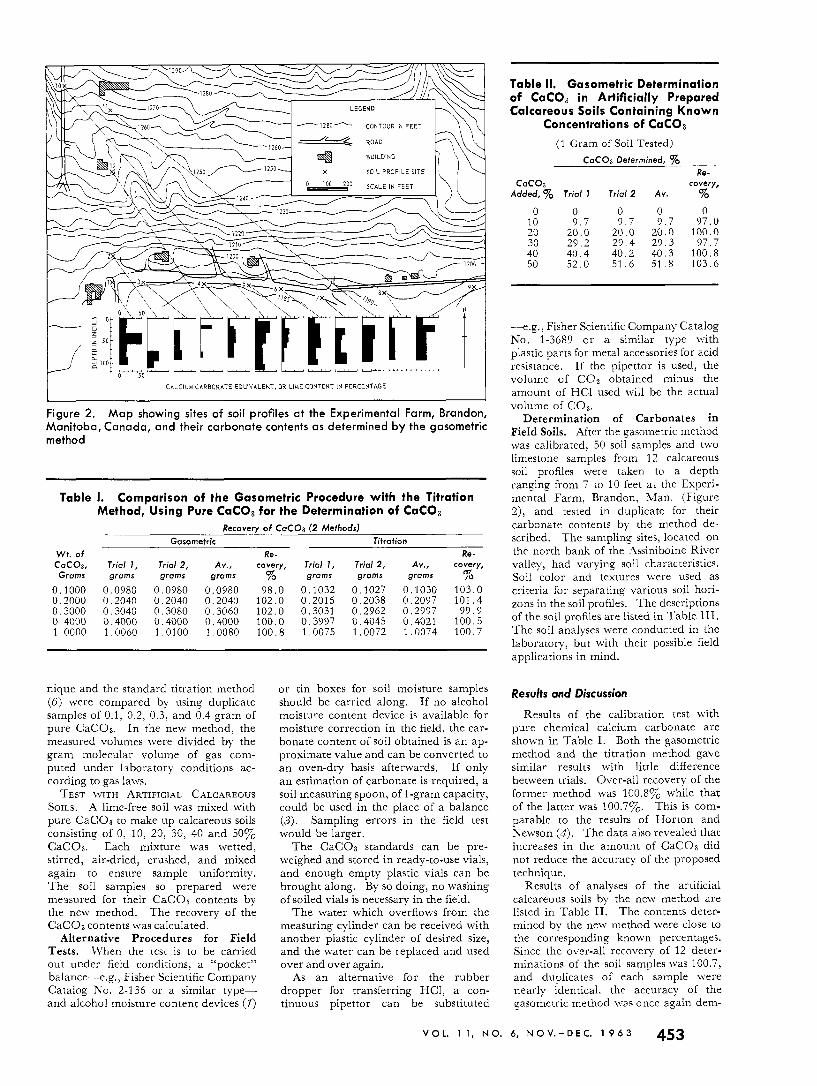
Figure 2. Map showing sites of soil profiles at the Experimental Farm, Brandon, Manitoba, Canada, and their carbonate contents as determined b y the gasometric method
Table 1. Comparison of the Gasometric Procedure with the Titration Method, Using Pure COCO3 for the Determination of Coco3
Wt. of CoC03,
Grams
0.1000 0,2000 0.3000 0.4000 1 . 0000
Recovery of Coco3 (2 Mefhods) Gosometric Titrotion
Re- Triol I , Triol 2, Av., covery, Triol I , Triol 2 , Av., grams grams grams % grams grams grams
0.0980 0.0980 0.0980 98.0 0.1032 0.1027 0.1030 0,2040 0.2040 0,2040 102.0 0.2015 0.2038 0.2097 0.3040 0.3080 0,3060 102.0 0.3031 0,2962 0.2997 0.4000 0.4000 0,4000 100.0 0.3997 0.4045 0.4021 1.0060 1.0100 1,0080 100.8 1.0075 1.0072 1.0074
Re- covery, 07 /*
103.0 101.4 99.9
100.5 100.7
nique and the standard titration method ( 6 ) were compared by using duplicate samples of 0.1, 0.2, 0.3, and 0.4 gram of pure CaCO3. In the new method, the measured volumes were divided by the gram molecular volume of gas com- puted under laboratory conditions ac- cording to gas laws.
TEST WITH ARTIFICIAL CALCAREOUS SOILS. A lime-free soil was mixed with pure CaC03 to make up calcareous soils consisting of 0. 10, 20, 30, 40 and 50% CaC03. Each mixture was wetted, stirred, air-dried, crushed, and mixed again to ensure sample uniformity. The soil samples so prepared were messured for their CaCO3 contents by the new method. The recovery of the CaCO3 contents was calculated.
Alternative Procedures for Field Tests. LVhen the test is to be carried out under field conditions, a “pocket” balance-e.g., Fisher Scientific Company Catalog KO. 2-136 or a similar type- and alcohol moisture content devices (7)
o r tin boxes for soil moisture samples should be carried along. If no alcohol moisture content device is available for moisture correction in the field? the car- bonate content of soil obtained is an ap- proximate value and can be converted to a n oven-dry basis afterwards. If only a n estimation of carbonate is required, a soil measuring spoon, of 1-gram capacity, could be used in the place of a balance (3) . Sampling errors in the field test would be larger.
The CaCO3 standards can be pre- weighed and stored in ready-to-use vials, and enough empty plastic vials can be brought along. By so doing, no washing of soiled vials is necessary in the field.
The water which overflows from the measuring cylinder can be received with another plastic cylinder of desired size, and the water can be replaced and used over and over again.
As an alternative for the rubber dropper for transferring HCl, a con- tinuous pipettor can be substituted
V O L . 1 1 , N O .
Table I I . Gasometric Determination of Coco3 in Artificially Prepared Calcareous Soils Containing Known
Concentrations of CaC03 (1 Gram of Soil Tested)
c o c o 3 Determined, % Re-
c o c o 3 covery, Added, % Triol I Triol 2 Av. %
n n n n n 10 5.7 6 .7 6 . 7 97.0 20 20.0 20.0 20.0 100.0 30 29.2 29.4 29.3 97.7 40 40.4 40.2 40.3 100.8 50 52.0 51.6 51.8 103.6
-e.g., Fisher Scientific Company Catalog No. 1-3689 or a similar type with plastic parts for metal accessories for acid resistance. If the pipettor is used, the volume of COZ obtained minus the amount of HCl used will be the actual volume of CO2.
Determination of Carbonates in Field Soils. After the gasometric method was calibrated. 50 soil samples and two limestone samples from 12 calcareous soil profiles were taken to a depth ranging from 7 to 10 feet at the Experi- mental Farm, Brandon, Man. (Figure Z), and tested in duplicate for their carbonate contents by the method de- scribed. The sampling sites, located on the north bank of the Assiniboine River valley, had varying soil characteristics. Soil color and textures were used as criteria for separating various soil hori- zons in the soil profiles. The descriptions of the soil profiles are listed in Table 111. The soil analyses were conducted in the laboratory, but with their possible field applications in mind.
Results and Discussion
Results of the calibration test with pure chemical calcium carbonate are shown in Table I. Both the gasometric method and the titration method gave similar results with little difference between trials. Over-all recovery of the former method was 100.8y0 while that of the latter was 100.770. This is com- parable to the results of Horton and Kewson (4). The data also revealed that increases in the amount of CaCO3 did not reduce the accuracy of the proposed technique.
Results of analyses of the artificial calcareous soils by the new method are listed in Table 11. The contents deter- mined by the new method were close to the corresponding known percentages. Since the over-all recovery of 12 deter- minations of the soil samples was 100.7, and duplicates of each sample Ivere nearly identical. the accuracy of the gasometric method \vas once again dem-
6 , N 0 V . - D E C . 1 9 6 3 453
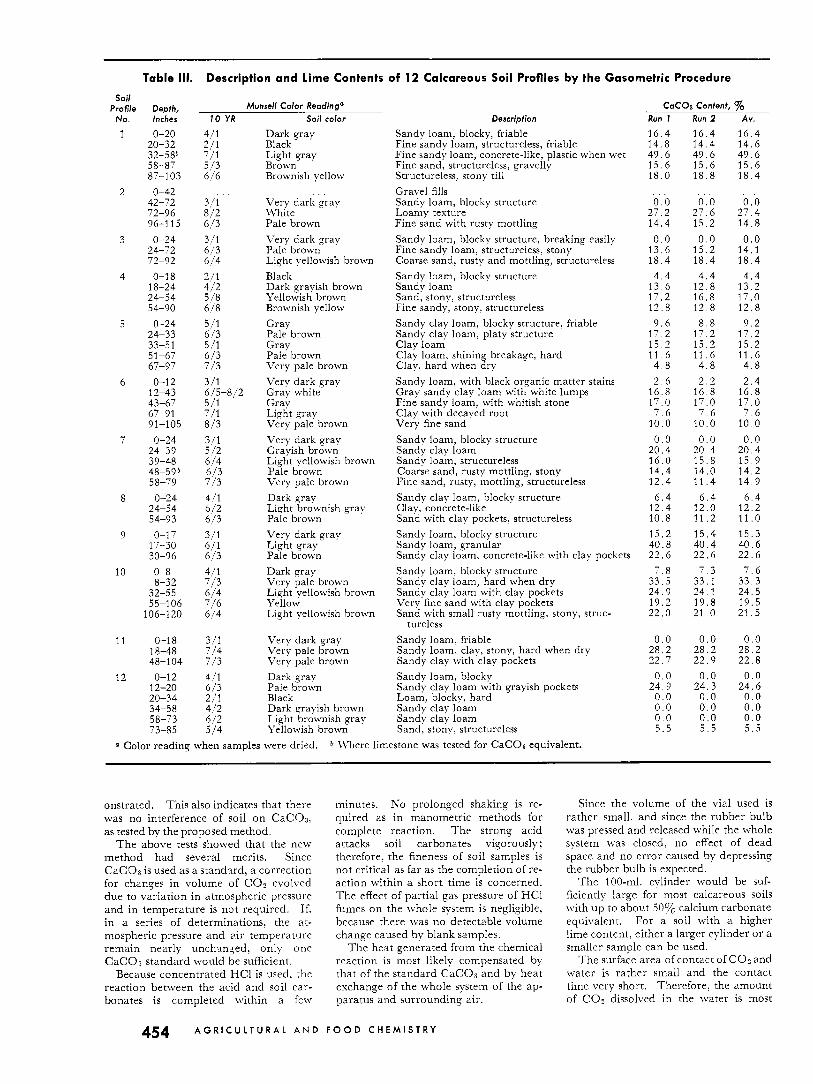
Table 111. Description and l ime Contents of 12 Calcareous Soil Profiles by the Gasometric Procedure
Soil Profile Depth,
No
1
2
3
4
5
6
7
8
9
10
11
12
lnches
0-20 20-32 32-5Sa 58-87 87-103 0-42
42-72 72-96 96-1 15 0-24
24-72 72-92 0-1 8
18-24 24-54 54-90
0-24 24-33 33-51 51-67 67-97 0-12
12-43 43-67 67-91 91-105
0-24 24-39 39-48 48-596 58-79
0-24 24-54 5 4-9 3 0-1 7
17-30 30-96 0-8 8-32
32-55 55-106
106-120
0-1 8 18-48 48-1 04
0-1 2 12-20 20-34 34-58 58-73 73-85
Munsell Color Readingo 10 YR Soil color
4 / 1 2 11 7/1 5 /3 6/6
8/2 6/3 3 /1 6/3 6/4 2 /1 4/2 5 /8 6 /8
5 /1 6/3 5/1 6/3 7/3 3/1
3 /1
6/5-8/2 511 7 /1 8/3
3; 6 /4 6 /3 7/3
4/1 6 /2 6/3 3 / 1 6/1 6/3 4/1 7/3 6 /4 7/6 6 /4
3 / 1 7/4 7/3 4/1 6/3 2/1 4 /2 6 /2 5/4
Dark gray Black Light gray Brown Brownish yellow
Very dark gray IYhite Pale brown Very dark gray Pale brown Light yellowish brown Black Dark grayish brown Yellowish brown Brownish yellow
. . .
Gray Pale brown Gray Pale brown Very pale brown Very dark gray Grav white Gray Light gray Very pale brown Very dark gray Grayish brown Light yellowish brown Pale brown Very pale brown Dark qray Liqht brownish gray Pale brown Very dark gray Light gray Pale brown Dark gray Very pale brown Liqht yellowish brown Yellow Light yellowish brown
Very dark gray Very pale brown Very pale brown Dark gray Pale brown Black Dark grayish brown Light brownish gray Yellowish brown
Description
Sandy loam, blocky, friable Fine sandy loam, structureless, friable Fine sandy loam, concrete-like, plastic when wet Fine sand, structureless, gravelly Structureless, stony till Gravel fills Sandy loam, blocky structure Loamy texture Fine sand with rusty mottling Sandy loam, blocky structure, breaking easily Fine sandy loam, structureless, stony Coarse sand, rusty and mottling, structureless Sandy loam, blocky structure Sandy loam Sand, stony, structureless Fine sandy, stony, structureless Sandy clay loam, blocky structure, friable Sandy clay loam, platy structure Clay loam Clay loam. shining breakage, hard Clay, hard when dry Sandy loam, with black organic matter stains Gray sandy clay loam with white lumps Fine sandy loam, with whitish stone Clay with decayed root Very fine sand Sandy loam, blocky structure Sandy clay loam Sandy loam, structureless Coarse sand, rusty mottling, stony Fine sand, rusty, mottling, structureless Sandy clay loam, blocky structure Clay. concrete-like Sand with clay pockets, structureless Sandy loam, blocky structure Sandy loam, granular Sandy clay loam. concrete-like with clay pockets Sandy loam, blocky structure Sandy clay loam, hard when dry Sandy clay loam with clay pockets Very fine sand with clay pockets Sand with small rusty mottling, stony. struc-
Sandy loam, friable Sandy loam. clay, stony, hard when dry Sandy clay with clay pockets Sandy loam, blocky Sandy clay loam with grayish pockets Loam, blocky. hard Sandy clay loam Sandy clay loam Sand, stony. structureless
tureless
5 Color reading when samples were dried. b I\’here limestone was tested for CaC03 equivalent.
C a C O a Conient, % Run 1 Run 2
16.4 14 .8 49 .6 15 .6 18 .0
0 . 0 27.2 14.4 0 . 0
13 .6 1 8 . 4 4 . 4
1 3 . 6 17.2 12 .8
9 . 6 1 7 . 2 1 5 . 2 1 1 . 6 4 . 8 2 . 6
16 .8
7 . 6 10 .0 0 . 0
20 .4 1 6 . 0 14.4 1 2 . 4
6 . 4 12.4 10 .8 15.2 40.8 22 .6
7 . 8 33.5 24.9 19.2 22 .0
0 . 0 28 .2 22 .7 0 . 0
2 4 . 9 0 . 0 0 . 0 0 . 0 5.5
. . .
17 .0
1 6 . 4 1 4 . 4 49 .6 1 5 . 6 1 8 . 8
0 . 0 27 .6 1 5 . 2
0 . 0 1 5 . 2 1 8 . 4 4 . 4
12 .8 16 .8 1 2 . 8
8 . 8 1 7 . 2 1 5 . 2 1 1 . 6 4 . 8 2 . 2
1 6 . 8 17 .0 7 . 6
1 0 . 0 0 .0
2 0 . 4 15 .8 14.0 1 1 . 4
6 . 4 12.0 1 1 . 2 1 5 . 4 40 .4 22.6
7 . 3 33 .1 2 4 . 1 19 .8 21 . o
0.0 2 8 . 2 22 .9
0 . 0 24.3
0 . 0 0 .0 0 .0 5 . 5
. . .
Av. 1 6 . 4 1 4 . 6 49 .6 1 5 . 6 1 8 . 4
0 . 0 2 7 . 4 1 4 . 8 0.0
1 4 . 1 1 8 . 4
4 . 4 1 3 . 2 17.0 1 2 . 8
9 . 2 1 7 . 2 1 5 . 2 11 .6 4 . 8 2 . 4
16 .8 17 .0
7 . 6 10.0 0 .0
2 0 . 4 1 5 . 9 1 4 . 2 1 4 . 9
6 . 4 1 2 . 2 11 . o 15.3 40 .6 2 2 . 6
7 . 6 3 3 . 3 24 .5 19.5 21.5
0 .0 28 .2 22 .8
0 . 0 24 .6 0 .0 0 .0 0 .0 5.5
. . .
onstrated. This also indicates that there was no interference of soil on CaC03. as tested by the proposed method.
The above tests showed that the new method had several merits. Since CaC03 is used as a standzrd, a correction for changes in volume of CO? evolved due to variation in atmospheric pressure and in temperature is not required. If, in a series of determinations. the at- mospheric pressure and air temperature remain nearly unchanged, only one CaC03 standard would be sufficient.
Because concentrated HC1 is used. the reaction between the acid and soil car- bonates is completed within a few
minutes. No prolonged shaking is re- quired as in manometric methods for complete reaction. The strong acid attacks soil carbonates vigorously; therefore, the fineness of soil samples is not critical as far as the completion of re- action within a short time is concerned. The effect of partial gas pressure of HC1 fumes o n the whole system is negligible. because there was no detectable volume change caused by blank samples.
The heat generated from the chemical reaction is most likely compensated by that of the standard CaC03 and by heat exchange of the whole system of the ap- paratus and surrounding air.
Since the volume of the vial used is rather small. and since the rubber bulb was pressed and released while the whole system was closed. no effect of dead space and no error caused by depressing the rubber bulb is expected.
The 100-nil. cylinder would be suf- ficiently large for most calcareous ?oils with u p to about 50% calcium carbonate equivalent. For a soil with a higher lime content, either a larger cylinder or a smaller sample can be used.
The surface area of contact of CO? and \rater is rather small and the contact time very short. Therefore. the amount of CO? dissolved in the water is most
454 A G R I C U L T U R A L A N D F O O D C H E M I S T R Y
likely to be negligible. However, if de- sired, dilute HC1 in which COZ is less soluble may be used as a substitute for the water in the measuring cylinder.
A few precautions should be pointed out here. The rubber stopper should be secured tightly enough to prevent a gas leak. The rubber tube connecting the vial and the measuring cylinder should be secured after the rubbe1 stoppers are closed safely. so that there nil1 be no air pressure changes in the qs tem and the pressure inside and outside of the system will be equal before the chemical reaction takes place.
No attempt was made to distinguish between the calcite and dolomite. The technique gives only a calcium carbonate equivalent, or a total lime content.
The carbonate content of the 12 pro- fdes as determined by this method is shonn in ‘Table 111 and also diagramati- cally in Figure 2. The duplicate analyses of 26 of 50 soil samples were identical and the remainder had 0.287, variation from their means. There were great variations in concentration and dis- tribution of lime contents in the soils both vertically and horizontally. The dis- tance between two adjacent profiles was usually less than 200 feet. The range of
lime content of the soils tested was from 0 to 507,. The calcium carbonate equivalents of limestone from two profiles range from 70 to 100%. The wide variation in lime content within the soil catena studied is not unusual with the high heterogeneity of the soils in color, texture, structure, and horizon depth (Table 111). However, most of the top soils were black when wet. I t would be rather difficult for an individual, without a chemical test, to realize that there were such great differences in lime content among soil samples within such a small area of the farm. Agricultural experi- ments of a comparison nature, when carried out on soils with a similar char- acteristic. would expect considerable errors.
From the foregoing context it is con- cluded that the rapid method described herein for determining carbonates in calcareous soils and in liming materials appears to be satisfactory and useful.
Acknowledgment
The author wishes to thank A. Grambo and A. Hunt for their assistance in soil sampling and chemical determina- tion. H e is also in debt to G. Stevenson
I N S E C T I C I D E A C T I V I T Y IN M A N
Urinary Excretion of Paranitrophenol by Volunteers Following Dermal Exposure to Parathion at Different Ambient Temperatures
for his help in taking the picture used in Figure 1.
Literature Cited
fl) Bouvoucos. G. J.. Soil Sci. 44, 377 \ I
( i w j . (2) Edson, S. N.: Better Crops Plant Food
37. 22 (1953). (3) Graham, ’E. R.. Unio. MO. .4gr.
Exb. Sta. Bull. 734 (1959). (4) Horton, J. H., Newson, D. W.,
Soil Sci. SOL. Am. Proc. 17, 414 (1953). (5) Martin, A. E., Reeve, R., Soil Sci.
79, 187 (1955). (6) “Official and Tentative Methods of
Analysis,” 7th ed., Assoc. Offic. Agr. Chemist, Washington, D. C., 1950.
(7) Pierce, W. C., Haenisch, E. L., “Quantitative Analysis,” 4th ed., Wiley, Kew York, 1947.
(8) Piper, C. S., “Soil and Plant ,4nal- ysis,” Vniv. of Adelaida, Adelaida, Australia, 1942.
(9) Skinner, S. I . M., Halstead, R. L., Can. J . SoilSci. 38, 187 (1958).
(IO) Skinner, S. I . M . ? Halstead, R. L., Brydon. J. E.: Zbid., 197 (1958).
(11) Williams, D. E., Soil Sci. Am. Proc. 13, 127 (1948).
RecezLed for reuteu, December 3, 7962. March 25, 7963.
Accepted
A. J. FUNCKES,‘ G. R. HAYES, Jr., and W. V. HARTWELL
Technology Branch, Communicable Disease Center, Public Health Serv- ice, U. S. Department of Health, Education, and Welfare, Phoenix, Ariz.
The rate of absorption of parathion, as reflected by urinary excretion of paranitrophenol, was measured in human volunteers exposed to 2y0 parathion dust at different ambient temperatures. Rates of paranitrophenol excretion varied directly with temperature between 58” and 105” F. Maximum excretion occurred 5 to 6 hours following initiation of exposure. Neither depressions in cholinesterase activities nor clinical symptoms were observed following the exposures used.
HE ORGANIC phosphorus insecticide T parathion is a useful material for controlling insects of economic and public health importance. I t has a high toxic- ity to humans, however, and each year deaths are attributed to its use. In an effort to understand more fully the toxic hazards associated with parathion, stud- ies have been made of factors that influence the mechanisms and rates of
1 Present address : Marion Davies Clinic, University of California, Los Angeles, Calif.
absorption. Two methods have been used to measure parathion absorption. They are determination of activities of cholinesterases, enzymes that are inhib- ited by parathion, and quantitation of a urinary metabolite. paranitrophenol (3 ) .
Excretion of paranitrophenol and depression of cholinesterase activities reflect different physiologic functions. Changes in enzyme activity ordinarily cannot be determined b>- the Michel method following brief light exposures, because normal variations in the method are greater than the changes produced by the compound ( 7 ) . Paranitrophenol
assay is useful under these conditions however, since microgram quantities can be measured and the metabolite is absent from the urine of unexposed individuals. The quantity of paranitrophenol excreted indicates the magnitude of absorption and, less directl?, the magnitude of exposure, but it does not necessarily measure the physiologic effects of the exposure. Changes in cholinesterase activities reflect physiologic eflects result- ing from parathion.
A direct quantitative correlation be- tween changes in enzyme activities and paranitrophenol excretions has not been
VOL. 1 1 , NO. 6, N 0 V . - D E C . 1 9 6 3 455