soil hydrophobic effects on infiltration and catchment runoff
TRANSCRIPT
HYDROLOGICAL PROCESSES, VOL. 3, 211-222 (1989)
SOIL HYDROPHOBIC EFFECTS ON INFILTRATION AND CATCHMENT RUNOFF
G. J. BURCH Bureau of Rural Resources, Department of Primary Industries and Energy, Canberra, A. C. T. 2600, Australia
I. D. MOORE Department of Agricultural Engineering, University of Minnesota, St Paul, Minnesota 55108, U. S. A .
AND J. BURNS
Divbion of Water Resources, CSIRO, G. P.O. Box 1666, Canberra, A.C. T., 2601, Australia
ABSTRACT After dry summers or drought, eucalypt forest soils at two sites in southeastern Australia developed hydrophobic or non-wetting surface characteristics that reduced infiltration, measured using a sprinkling infiltrometer. At one site the development of hydrophobic conditions caused the rainfall to runoff conversion efficiency of a forested catchment to increase from 5 per cent to 15 per cent. Under non-hydrophobic conditions at this site, grassland always generated more runoff than forest. However, one major rainfall-runoff was recorded at a time of highly hydrophobic forest soil conditions and this storm generated greater runoff on the forested catchment than the grassland catchment.
At the second site forest soils have naturally highly conductive surface layers because of a dense network of macropores and pathways for preferential flow. Hydrophobic conditions produced by drought caused soil water movement to be confined to only a few of the larger macropores exposed to surface ponded'water. Even so, infiltration rates remained relatively high so that the impacts of hydrophobic soils were not translated into increased catchment runoff as at the first site.
KEY WORDS Catchment runoff Water-repellent soils Preferential flow Hydrophobicity Infiltration
INTRODUCTION
Infiltration in undisturbed and disturbed forest catchments is a major determinant of runoff responses. Physical disturbance or land clearing has been shown to reduce the permeability of forest soils and modify their runoff response (Burch et al., 1987; Moore et al., 1986b). The development of surface water repellency has also been observed to reduce infiltration and modify catchment runoff, but these effects are temporally highly variable, less predictable, and have been poorly quantified.
Numerous plants contribute to the development of water repellency in soils (McGhie and Posner, 1981). Jamison (1942) associated non-wetting soils with citrus, Bond (1968) with perennial pastures, De Ban0 (1969) with chaparrel brush and Gilmour (1965) with dry sclerophyll eucalypt and pine forests. Many eucalypts produce litter and exudate that create water repellent soils, usually attributed to plant residues physically coating soil particles (McGhie and Posner, 1980). This coating has a high wetting angle. Other causative agents such as fire (De Bano, 1969) or fungi in decaying plant matter (Bond, 1969) have been described, However, these studies have considered only localized reductions in infiltration and little information is available describing catchment scale responses to transient changes in soil wettability. The objective of the studies reported in this paper was to investigate the effects of water repellent soils on the infiltration and runoff responses of forest and grassland catchments in southeastern Australia.
0885-6087/89/03O211-12$06.00 @ 1989 by John Wiley & Sons, Ltd.
Received 26 September 1988 Revised 10 December 1988
212 G . J . BURCH, I . D. MOORE, AND J . BURNS
EXPERIMENTAL DETAILS
Study areas Catchments in two geographically different locations were studied; at Puckapunyal (37"S, 145"E) in
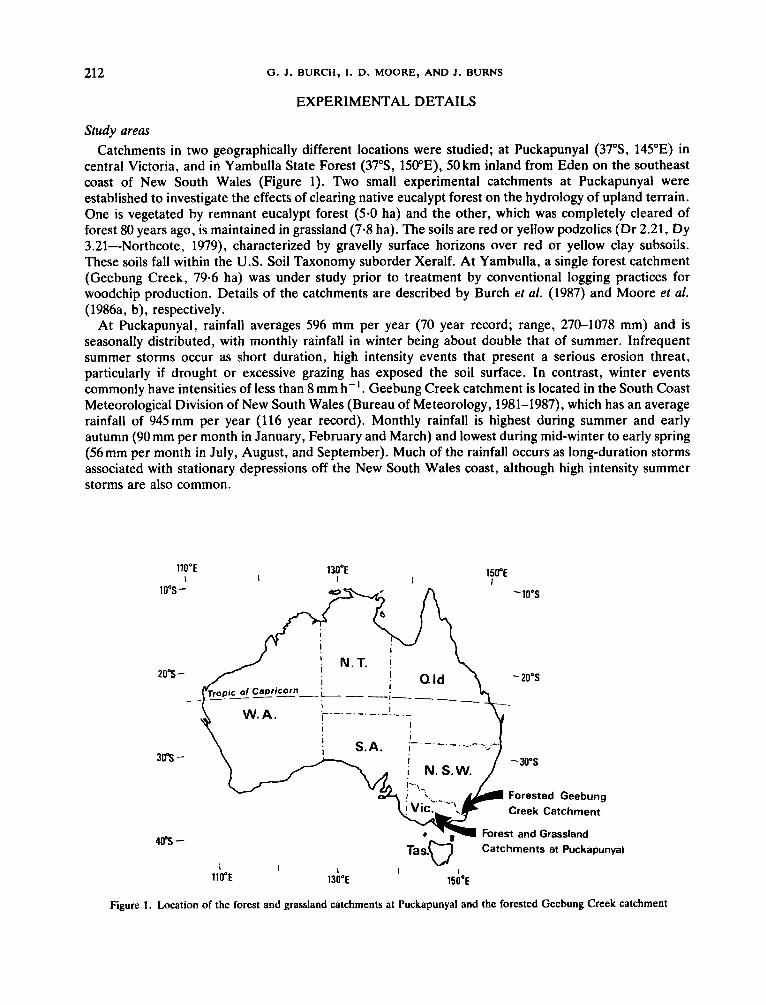
central Victoria, and in Yambulla State Forest (37"S, 150°E), 50 km inland from Eden on the southeast coast of New South Wales (Figure 1). Two small experimental catchments at Puckapunyal were established to investigate the effects of clearing native eucalypt forest on the hydrology of upland terrain. One is vegetated by remnant eucalypt forest (5.0 ha) and the other, which was completely cleared of forest 80 years ago, is maintained in grassland (7.8 ha). The soils are red or yellow podzolics (Dr 2.21, Dy 3.21-Northcote, 1979), characterized by gravelly surface horizons over red or yellow clay subsoils. These soils fall within the U.S. Soil Taxonomy suborder Xeralf. At Yambulla, a single forest catchment (Geebung Creek, 79.6 ha) was under study prior to treatment by conventional logging practices for woodchip production. Details of the catchments are described by Burch et al. (1987) and Moore et al. (1986a, b), respectively.
At Puckapunyal, rainfall averages 596 mm per year (70 year record; range, 270-1078 mm) and is seasonally distributed, with monthly rainfall in winter being about double that of summer. Infrequent summer storms occur as short duration, high intensity events that present a serious erosion threat, particularly if drought or excessive grazing has exposed the soil surface. In contrast, winter events commonly have intensities of less than 8mm h-'. Geebung Creek catchment is located in the South Coast Meteorological Division of New South Wales (Bureau of Meteorology, 1981-1987), which has an average rainfall of 945mm per year (116 year record). Monthly rainfall is highest during summer and early autumn (90 mm per month in January, February and March) and lowest during mid-winter to early spring (56mm per month in July, August, and September). Much of the rainfall occurs as long-duration storms associated with stationary depressions off the New South Wales coast, although high intensity summer storms are also common.
1lO"E \ I
1 0"s - 130"E
I I
20's -
3 n -
40"s -
.. -
-10"s
- 2 0 3
- 30's
Forested Geebung Creek Catchment
Forest and Grassland Catchments at Puckapunyal
-10"s
- 2 0 3
- 30's
Forested Geebung Creek Catchment
Forest and Grassland
TasmW Catchments at Puckapunyal I I I I
1lO'E 13b"E 150"E
Figure 1. Location of the forest and grassland catchments at Puckapunyal and the forested Geebung Creek catchment
HYDROPHOBIC EFFECTS ON INFILTRATION AND RUNOFF 213
Catchment and Soil measurements Surface runoff was measured at Puckapunyal between 1981 and 1985 for the grassland, and between
1982 and 1985 for the forest, using identical 0.45m H-flumes in both catchments. At Geebung Creek streamflow was measured between 1979 and 1986 using a 140" V-notch weir with a rated head of 1.0 m. At both locations RIMCO float recorders and tipping bucket pluviometers were used to record stream stage and precipitation, respectively. Total runoff was partitioned into quickflow (stormflow) and baseflow when required for hydrological analysis using a digital filtering algorithm (program BASUM) following the procedure outlined by O'Loughlin et al. (1982).
The soil water status was monitored at both Puckapunyal and Geebung Creek using the neutron attenuation technique (Greacen, 1981). The instrument was calibrated in the field at both locations. At Puckapunyal, regular measurements of the water content of the soil profile (0-043 m deep) at five slope positions on transects between the crests and valleys of both catchments recorded successive wetting and drying cycles over a 44 month period. The slope positions instrumented were the depressions (d), lower slopes (Is), midslopes (ms), upper slopes (us), and crests (c). At Geebung Creek periodic soil water measurements (0-1-0 m deep) at 30 locations on two different sites on a single hillslope in the catchment commenced in February 1985.
Water repellency tests, adapted from the method described by Letey (1969), were conducted to detect soil hydrophobicity on the two Puckapunyal catchments. Water containing increasing concentrations of ethanol was applied in drop form to the soil surface (loose litter removed) until a concentration was reached where immediate infiltration occurred. At this concentration the aqueous ethanol drop has a sufficiently small surface tension to overcome the surface water repellency restriction to infiltration. If a high concentration of ethanol is required for incipient infiltration, say above 7 per cent by volume it is indicative of hydrophobic soil. These hydrophobicity tests were conducted at all slope positions (i.e. d, Is, ms, us, and c) in November 1982 and February 1983 during drought conditions. Tests were conducted on soils at two hillslope sites in the Geebung Creek catchment on 20 August 1986.
Infiltration was measured at Puckapunyal and Geebung Creek using a trailer-mounted sprinkling infiltrometer, similar to that described by Morin and Cluff (1980). Rainfall was applied to 1 m x 1 m plots for 20 and 50 minutes, depending on the infiltration and runoff response, at intensities ranging from 26 to 68mm h-'. Runoff was collected via a flume at 2 minute intervals after flow initiation. Surface ponding was detected using a ceramic tensiometer coupled to a pressure transducer. The tensiometer was placed beneath any loose leaf material but on top of the Ao-horizon.
At Puckapunyal, infiltration was measured under hydrophobic conditions when the soil was dry in April, September, and November 1982, and under non-hydrophobic conditions when the soil was moist in June 1983 and March 1984. Replicated tests were conducted at ms and Is/d hillslope positions. Infiltration sites in the two catchments were chosen to give similar gradients for each slope position. Vegetative cover changed very little in either catchment during 1982 as a result of drought. At Geebung Creek, infiltration was measured in April 1986 under hydrophobic conditions on undisturbed forest sites.
A second series of experiments was conducted at ms positions on the Puckapunyal catchments in November 1982 to examine the effect of repeated wetting on soil hydrophobicity and infiltration. Four wetting cycles (25.6mm h-' for 40 minutes) were applied to each site, the interval between each cycle ranged from 6 to 17 hours.
RESULTS
Puckapunyal soils and catchments The experimental period at Puckapunyal included a severe drought from 1982 to 1983. Annual rainfall
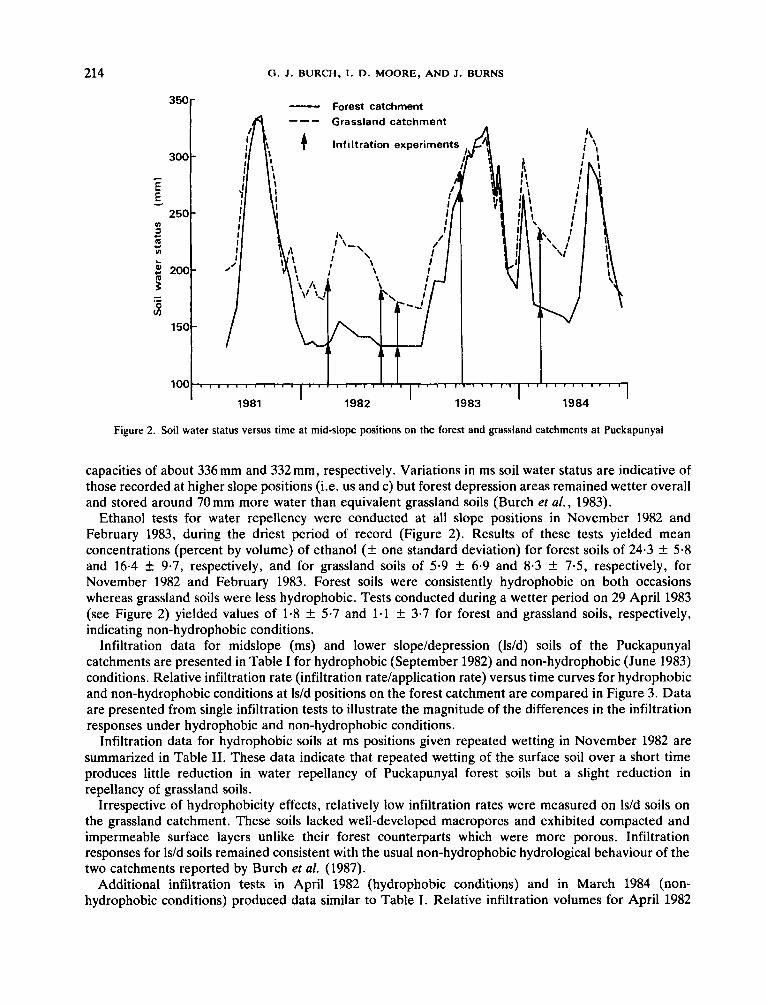
for 1981 and 1982 was 619 mm and 270 mm, respectively. This was followed by a wet autumn in 1983 and a total rainfall for that year of 800mm. Measurements of soil water status at ms locations in both catchments are presented in Figure 2. Pronounced drying of soils occurred each year during the summer, especially in the 1982-1983 drought period. Forest and grassland ms soils had total water storage
214
350-
300 - c
E E -
250 - v1 J c m c
i! 200- 5 - .- 0 v1
150 -
G. J . BURCH, I . D. MOORE, AND J . BURNS
- Forest catchment
Figure 2. Soil water status versus time at mid-slope positions on the forest and grassland catchments at Puckapunyal
capacities of about 336 mm and 332 mm, respectively. Variations in ms soil water status are indicative of those recorded at higher slope positions (i.e. us and c) but forest depression areas remained wetter overall and stored around 70mm more water than equivalent grassland soils (Burch et al., 1983).
Ethanol tests for water repellency were conducted at all slope positions in November 1982 and February 1983, during the driest period of record (Figure 2). Results of these tests yielded mean concentrations (percent by volume) of ethanol (f one standard deviation) for forest soils of 24.3 f 5.8 and 16-4 f 9.7, respectively, and for grassland soils of 5.9 f 6.9 and 8.3 f 7.5, respectively, for November 1982 and February 1983. Forest soils were consistently hydrophobic on both occasions whereas grassland soils were less hydrophobic. Tests conducted during a wetter period on 29 April 1983 (see Figure 2) yielded values of 1-8 f 5.7 and 1.1 f 3.7 for forest and grassland soils, respectively, indicating non-hydrophobic conditions.
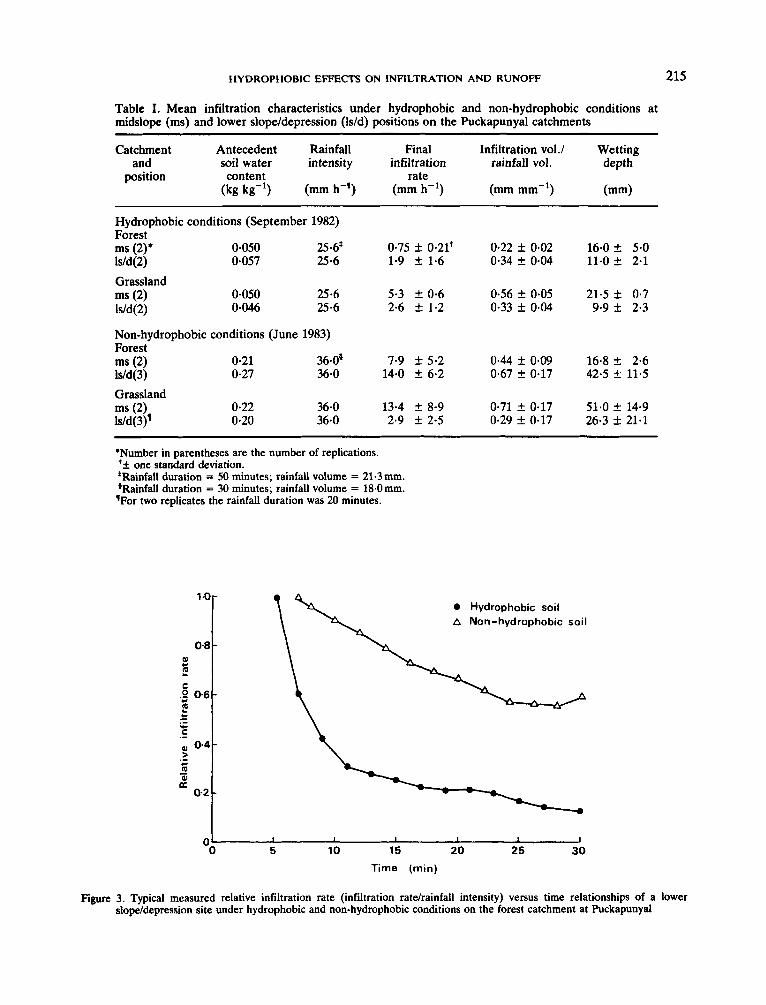
Infiltration data for midslope (ms) and lower slope/depression (Is/d) soils of the Puckapunyal catchments are presented in Table I for hydrophobic (September 1982) and non-hydrophobic (June 1983) conditions. Relative infiltration rate (infiltration rate/application rate) versus time curves for hydrophobic and non-hydrophobic conditions at ls/d positions on the forest catchment are compared in Figure 3. Data are presented from single infiltration tests to illustrate the magnitude of the differences in the infiltration responses under hydrophobic and non-hydrophobic conditions.
Infiltration data for hydrophobic soils at ms positions given repeated wetting in November 1982 are summarized in Table 11. These data indicate that repeated wetting of the surface soil over a short time produces little reduction in water repellancy of Puckapunyal forest soils but a slight reduction in repellancy of grassland soils.
Irrespective of hydrophobicity effects, relatively low infiltration rates were measured on Is/d soils on the grassland catchment. These soils lacked well-developed macropores and exhibited compacted and impermeable surface layers unlike their forest counterparts which were more porous. Infiltration responses for ls/d soils remained consistent with the usual non-hydrophobic hydrological behaviour of the two catchments reported by Burch et al. (1987).
Additional infiltration tests in April 1982 (hydrophobic conditions) and in March 1984 (non- hydrophobic conditions) produced data similar to Table I. Relative infiltration volumes for April 1982
HYDROPHOBIC EFFECTS ON INFILTRATION AND RUNOFF 215
1.0-
0.8 0) c L
C .P 0.6 2 c
w u- - .- .- a 0.4- > .- c - 0) a
0.2
Table I. Mean infiltration characteristics under hydrophobic and non-hydrophobic conditions at rnidslope (ms) and lower slope/depression (Idd) positions on the Puckapunyal catchments
-
-
-
Catchment Antecedent Rainfall Final Infiltration vol./ Wetting and soil water intensity infiltration rainfall vol. depth
position content rate (kg kg-') (rnrn h-*) (rnm h-') (rnm rnm-') (rnrn)
Hydrophobic conditions (September 1982) Forest rns (2)* 0.050 25.6' 0.75 f 0*21t 0.22 f 0.02 16.0 f 5.0 ldd(2) 0.057 25.6 1.9 f 1.6 0.34 f 0.04 11.0 f 2-1
rns (2) Grassland
0.050 25.6 5.3 k 0.6 0.56 f 0.05 21.5 f 0.7 ldd(2) 0.046 25.6 2.6 f 1.2 0.33 f 0.04 9.9 k 2.3
Non-hydrophobic conditions (June 1983) Forest
0.21 36.0' 7.9 f 5-2 0.44 k 0.09 16.8 f 2.6 ldd(3) 0.27 36.0 14.0 f 6.2 0.67 f 0.17 42.5 k 11-5
0.22 36.0 13.4 f 8.9 0.71 f 0.17 51.0 f 14.9 l ~ / d ( 3 ) ~ 0.20 36.0 2.9 k 2-5 0.29 f 0.17 26.3 f 21.1
*Number in parentheses are the number of replications. '+ one standard deviation. *Rainfall duration = 50 minutes; rainfall volume = 21'3mm. 'Rainfall duration = 30 minutes; rainfall volume = 18.0mm. '"For two replicates the rainfall duration was 20 minutes.
rns (2)
ms (2) Grassland
0 Hydrophobic soil A Non-hydrophobic soil
"0 5 10 15 20 25 30 Time (min)
Figure 3. Typical measured relative infiltration rate (infiltration rate/rainfall intensity) versus time relationships of a lower slope/depression site under hydrophobic and non-hydrophobic conditions on the forest catchment at Puckapunyal
216 G. J . BURCH, I . D. MOORE, AND J . BURNS
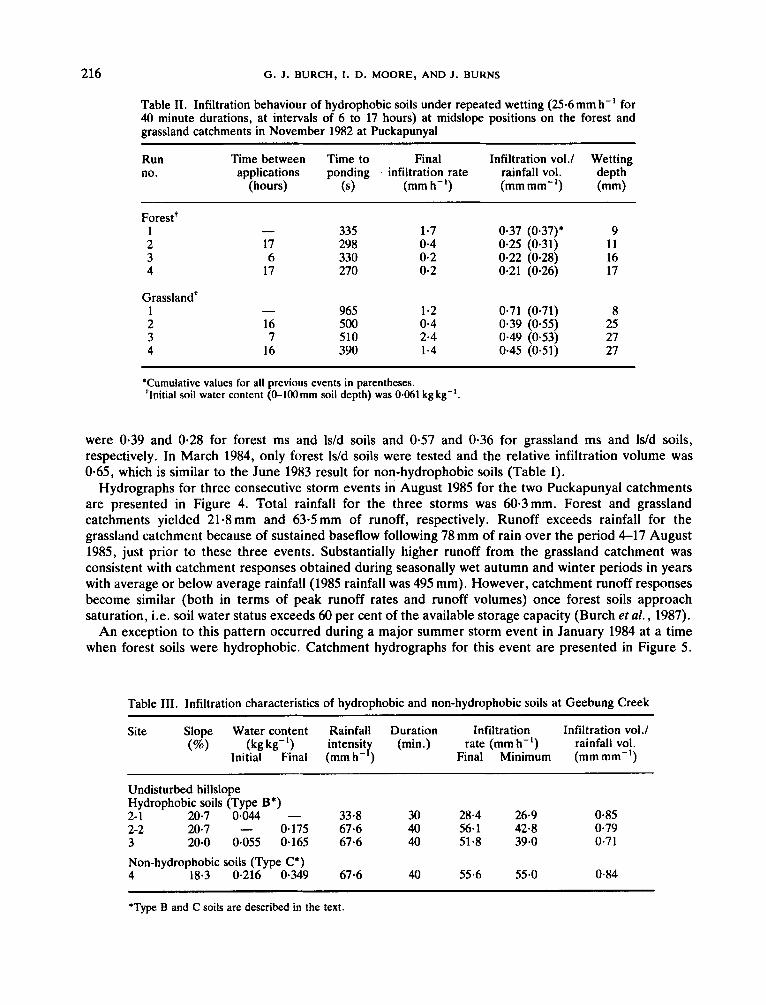
Table 11. Infiltration behaviour of hydrophobic soils under repeated wetting (25.6 mm h-' for 40 minute durations, at intervals of 6 to 17 hours) at midslope positions on the forest and grassland catchments in November 1982 at Puckapunyal
Run Time between Time to Final Infiltration v0l.l Wetting no. applications ponding infiltration rate rainfall vol. depth
(hours) (4 (mm h-') (mm mm-I) (mm)
Forestt 1 2 3 4
Grasslandt 1 2 3 4
- 17 6
17
- 16 7
16
335 1.7 298 0-4 330 0.2 270 0.2
965 1 *2 500 0.4 510 2.4 390 1.4
0.37 (0-37)* 9 0.25 (0.31) 11 0.22 (0-28) 16 0.21 (0.26) 17
0.71 (0-71) 8 0.39 (0.55) 25 0.49 (0.53) 27 0.45 (0.51) 27
'Cumulative values for all previous events in parentheses. +Initial soil water content (0-100mm soil depth) was 0.061 kgkg-'.
were 0.39 and 0.28 for forest ms and Is/d soils and 0.57 and 0.36 for grassland ms and Is/d soils, respectively. In March 1984, only forest Is/d soils were tested and the relative infiltration volume was 0.65, which is similar to the June 1983 result for non-hydrophobic soils (Table I).
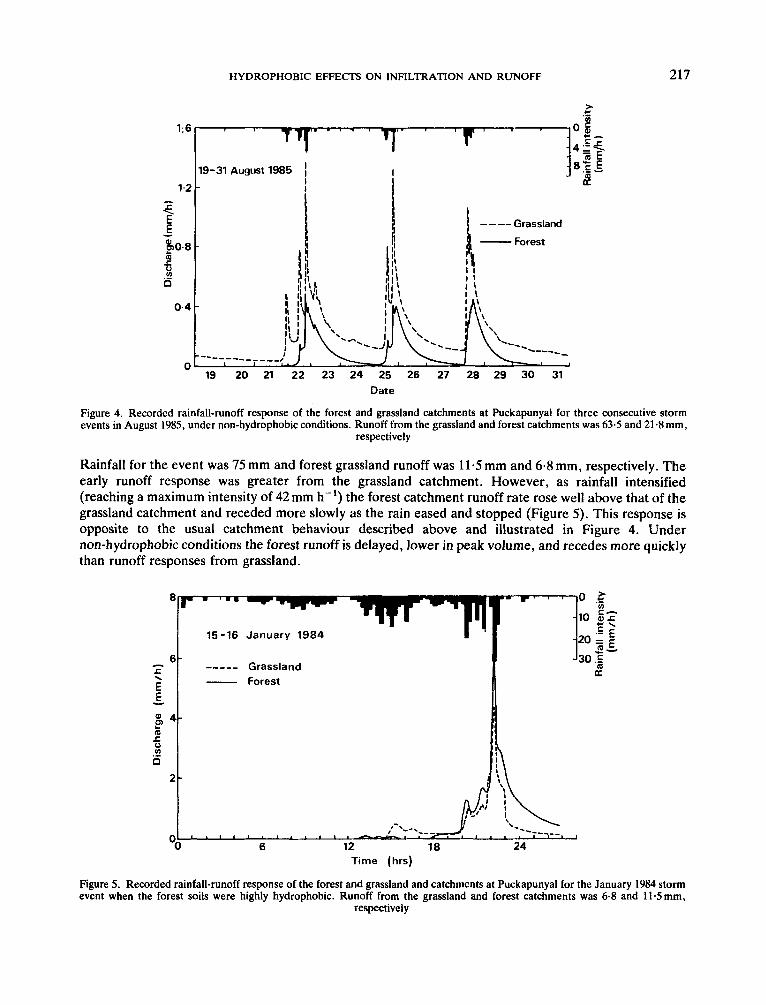
Hydrographs for three consecutive storm events in August 1985 for the two Puckapunyal catchments are presented in Figure 4. Total rainfall for the three storms was 60.3mm. Forest and grassland catchments yielded 21-8 mm and 63-5 mm of runoff, respectively. Runoff exceeds rainfall for the grassland catchment because of sustained baseflow following 78mm of rain over the period 4-17 August 1985, just prior to these three events. Substantially higher runoff from the grassland catchment was consistent with catchment responses obtained during seasonally wet autumn and winter periods in years with average or below average rainfall (1985 rainfall was 495 mm). However, catchment runoff responses become similar (both in terms of peak runoff rates and runoff volumes) once forest soils approach saturation, i.e. soil water status exceeds 60 per cent of the available storage capacity (Burch et al., 1987).
An exception to this pattern occurred during a major summer storm event in January 1984 at a time when forest soils were hydrophobic. Catchment hydrographs for this event are presented in Figure 5 .
Table 111. Infiltration characteristics of hydrophobic and non-hydrophobic soils at Geebung Creek
Site Slope Water content Rainfall Duration Infiltration Infiltration voi .I (kg kg-I) intensity (min.) rate (mm h-I) rainfall vol.
Initial Final (mm h- ) Final Minimum (mm mm-') (%)
Undisturbed hillslope Hydrophobic soils (Type B*) 2- 1 20.7 0.044 - 33.8 30 28.4 26.9 0-85 2-2 20.7 - 0.175 67.6 40 56.1 42-8 0.79 3 20.0 0.055 0.165 67.6 40 51.8 39.0 0.71
Non-hydrophobic soils (Type C*) 4 18.3 0.216 0.349 67.6 40 55.6 55.0 0.84
*Type B and C soils are described in the text.
HYDROPHOBIC EFFECTS ON INFILTRATION AND RUNOFF 217
> c .- 1;6
19-31 August 1985 I I I K 1.2 -
0.4 -
Date
Figure 4. Recorded rainfall-runoff response of the forest and grassland catchments at Puckapunyal for three consecutive storm events in August 1985, under non-hydrophobic conditions. Runoff from the grassland and forest catchments was 63.5 and 21.8mm,
respectively
Rainfall for the event was 75 mm and forest grassland runoff was 11.5 mm and 6-8 mm, respectively. The early runoff response was greater from the grassland catchment. However, as rainfall intensified (reaching a maximum intensity of 42 mm h-I) the forest catchment runoff rate rose well above that of the grassland catchment and receded more slowly as the rain eased and stopped (Figure 5) . This response is opposite to the usual catchment behaviour described above and illustrated in Figure 4. Under non-hydrophobic conditions the forest runoff is delayed, lower in peak volume, and recedes more quickly than runoff responses from grassland.
Forest
- , , , , , , , ' , , , , , ---.---+ OO 6 12 18 24
Time (hrs)
Figure 5. Recorded rainfall-runoff response of the forest and grassland and catchments at Puckapunyal for the January 1984 storm event when the forest soils were highly hydrophobic. Runoff from the grassland and forest catchments was 6.8 and 11-5mm,
respectively
218 G . J . BURCH, 1. D. MOORE, AND J . BURNS
Two rainfall-runoff events reported in the data presented by Burch et al. (1987) in their Table 5, can be compared with the runoff behaviour that was observed in January 1984. These events occurred in May 1983 and August 1984. Ethanol dilution tests cohducted on 29 April 1983 showed that the soils were dry, but non-hydrophobic for the May 1983 event. The August 1984 event occurred after a wet winter and no water repellency would have remained. Rainfall recorded for the events in May 1983 and August 1984 was 47.4 mm and 104.8 mm, respectively. Runoff conversion efficiencies for the grassland and forest catchments were 35.4 per cent and 0.1 per cent for May 1983, respectively; 9.1 per cent and 15.3 per cent for January 1984, respectively; and 46.1 per cent and 5.4 per cent for August 1984, respectively. Futhermore, the maximum rainfall intensity was highest for the May 1983 event and lowest for the August 1984 event. Therefore, under non-hydrophobic conditions the grassland runoff conversion efficiency is about an order of magnitude greater than that for the forest catchment. For the January 1984 event this trend is reversed.
Geebung Creek soils and catchment Between September and December 1985, inclusive, the total rainfall at Geebung Creek was 618mm,
which is 206 per cent of the average (300mm). This was followed by a very dry period leading up to the infiltration measurements on the catchment in April 1986. The four month rainfall between January and April 1986 was 176mm, which is only 49 per cent of the average (357mm). This dry period continued until July. Between January and July 1986, inclusive, the rainfall was 271 mm or 46 per cent of the average (587 mm).
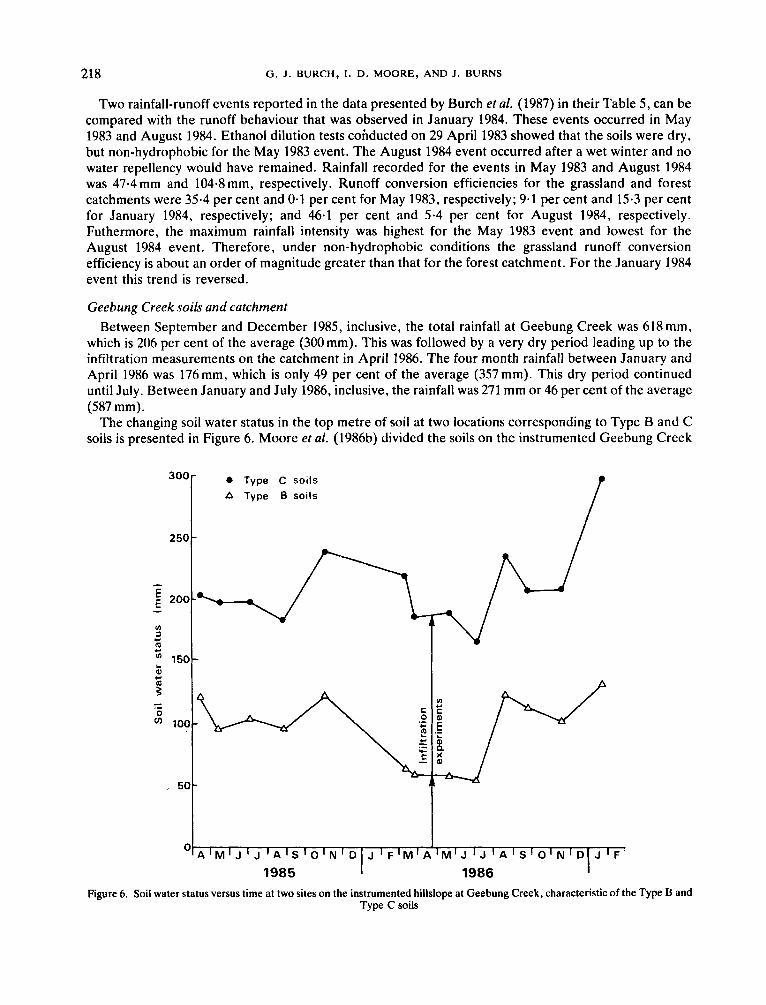
The changing soil water status in the top metre of soil at two locations corresponding to Type B and C soils is presented in Figure 6. Moore et al. (1986b) divided the soils on the instrumented Geebung Creek
'0°[ 0 Type C soils A Type B soils /
A l M l J l J ' A l S l O l N ' D l J lFIM1!lWllJ I J I A I S I O I N i D I J I F i
1985 1986 Figure 6. Soil water status versus time at two sites on the instrumented hillslope at Geebung Creek, characteristic of the Type B and
Type C soils
HYDROPHOBIC EFFECTS ON INFILTRATION AND RUNOFF 219
hillslope into four groups and defined the Type B soils as: ‘yellow duplex soils (Dy2.71-Northcote, 1979) with a loamy-sand A-horizon and a yellow sandy-clay B-horizon’. Type C soils are defined as: ‘yellow duplex soils (Dy3.11-Northcote, 1979) with a sandy-clay A-horizon and a mottled medium clay B-horizon’. All soils on the hillslope fall within the U.S. soil taxonomy suborder Aqualf. Figure 6 shows Type B soils retain less water than Type C soils. Type B soils drain downslope towards Type C soils and this accounts for the differences in their response.
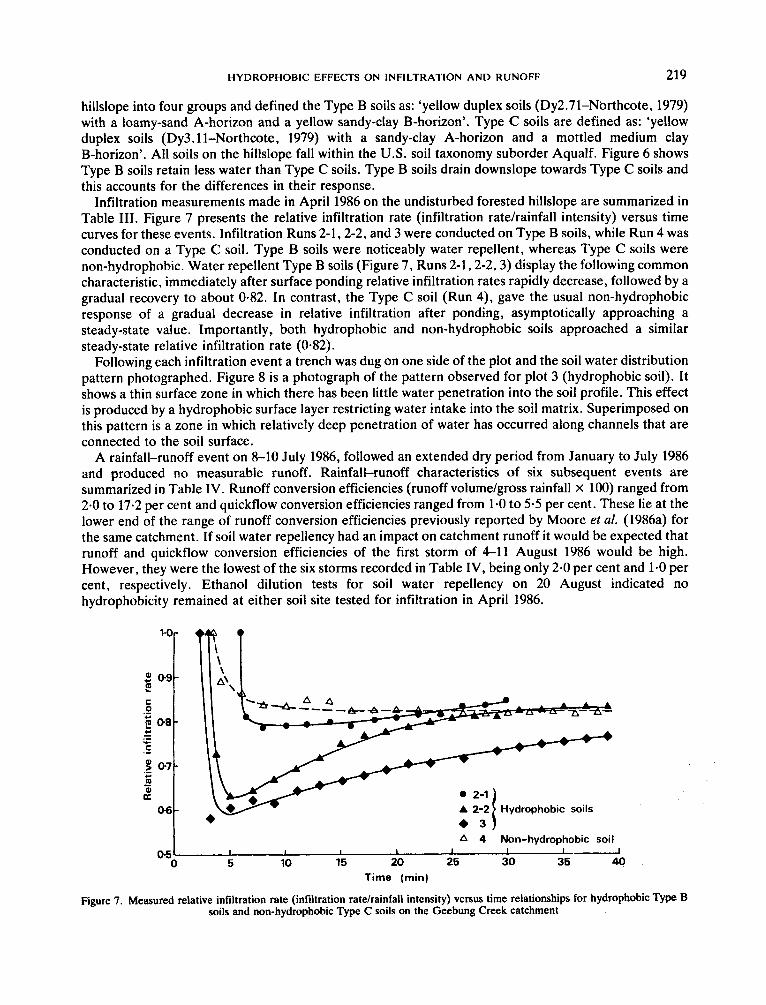
Infiltration measurements made in April 1986 on the undisturbed forested hillslope are summarized in Table 111. Figure 7 presents the relative infiltration rate (infiltration ratehainfall intensity) versus time curves for these events. Infiltration Runs 2-1,2-2, and 3 were conducted on Type B soils, while Run 4 was conducted on a Type C soil. Type B soils were noticeably water repellent, whereas Type C soils were non-hydrophobic. Water repellent Type B soils (Figure 7, Runs 2-1,2-2,3) display the following common characteristic, immediately after surface ponding relative infiltration rates rapidly decrease, followed by a gradual recovery to about 0.82. In contrast, the Type C soil (Run 4), gave the usual non-hydrophobic response of a gradual decrease in relative infiltration after ponding, asymptotically approaching a steady-state value. Importantly, both hydrophobic and non-hydrophobic soils approached a similar steady-state relative infiltration rate (0.82).
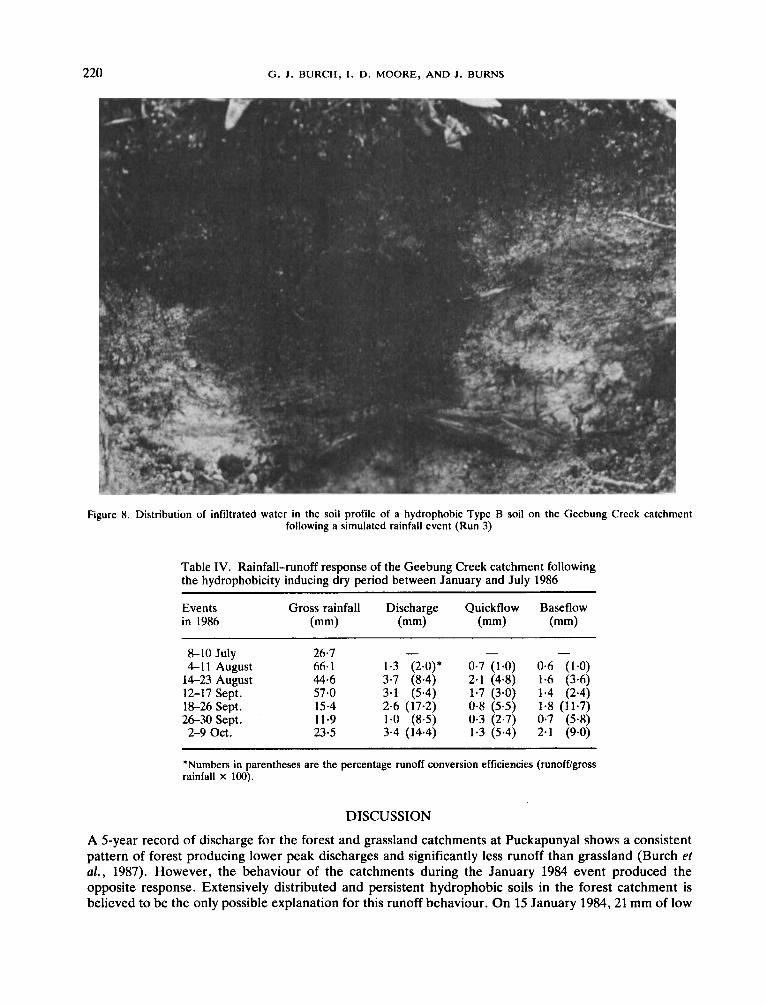
Following each infiltration event a trench was dug on one side of the plot and the soil water distribution pattern photographed. Figure 8 is a photograph of the pattern observed for plot 3 (hydrophobic soil). It shows a thin surface zone in which there has been little water penetration into the soil profile. This effect is produced by a hydrophobic surface layer restricting water intake into the soil matrix. Superimposed on this pattern is a zone in which relatively deep penetration of water has occurred along channels that are connected to the soil surface.
A rainfall-runoff event on 8-10 July 1986, followed an extended dry period from January to July 1986 and produced no measurable runoff. Rainfall-runoff characteristics of six subsequent events are summarized in Table IV. Runoff conversion efficiencies (runoff volume/gross rainfall x 100) ranged from 2.0 to 17-2 per cent and quickflow conversion efficiencies ranged from 1.0 to 5.5 per cent. These lie at the lower end of the range of runoff conversion efficiencies previously reported by Moore et al. (1986a) for the same catchment. If soil water repellency had an impact on catchment runoff it would be expected that runoff and quickflow conversion efficiencies of the first storm of 4-11 August 1986 would be high. However, they were the lowest of the six storms recorded in Table IV, being only 2.0 per cent and 1.0 per cent, respectively. Ethanol dilution tests for soil water repellency o n 20 August indicated no hydrophobicity remained at either soil site tested for infiltration in April 1986.
+* \ \ \
A 4 Non-hydrophobic soil I I I I I I 1-
0 5 10 15 20 25 30 35 40 05
Time (min)
Figure 7. Measured relative infiltration rate (infiltration ratelrainfall intensity) versus time relationships for hydrophobic Type B soils and non-hydrophobic Type C soils on the Geebung Creek catchment
220 G. J . BURCH, 1. D. MOORE, AND J . BURNS
Figure 8. Distribution of infiltrated water in the soil profile of a hydrophobic Type B soil on the Geebung Creek catchment following a simulated rainfall event (Run 3)
Table IV. Rainfall-runoff response of the Geebung Creek catchment following the hydrophobicity inducing dry period between January and July 1986
Events Gross rainfall Discharge Quickflow Baseflow in 1986 (mm) (mm) (mm) (mm)
- - - 8-10 July 26.7 4-11 August 66.1 1-3 (2.0)' 0-7 (1.0) 0.6 (1.0)
14-23 August 44.6 3-7 (8.4) 2.1 (4-8) 1.6 (3-6) 12-17 Sept. 57-0 3-1 (5.4) 1.7 (3.0) 1.4 (2.4) 18-26 Sept. 15-4 2.6 (17.2) 0.8 (5.5) 1-8 (11.7) 26-30 Sept. 11.9 1.0 (8.5) 0.3 (2.7) 0.7 (5.8) 2-9 Oct . 23.5 3.4 (14.4) 1.3 (5.4) 2.1 (9.0)
'Numbers in parentheses are the percentage runoff conversion efficiencies (runoff/gross rainfall x 100).
DISCUSSION
A 5-year record of discharge for the forest and grassland catchments at Puckapunyal shows a consistent pattern of forest producing lower peak discharges and significantly less runoff than grassland (Burch et al., 1987). However, the behaviour of the catchments during the January 1984 event produced the opposite response. Extensively distributed and persistent hydrophobic soils in the forest catchment is believed to be the only possible explanation for this runoff behaviour. On 15 January 1984,21 mm of low
HYDROPtIOBIC EFFECTS ON INFILTRATION AND RUNOFF 221
intensity rain fell intermittently over a 12 hour period prior to the start of the intense runoff producing rainfall. Because no runoff occurred during this time, the amount of rainfall did not exceed the capacity of the infiltration, interception, detention and depression storages for either catchment. As the rainfall intensity increased runoff began, but to sustain the reversal in runoff response for the duration of the entire storm would have required forest soil? to remain water repellent throughout.
Infiltration tests indicated that the greatest reductions in permeability occurred with water repellent forest Is/d soils. These soils surround and form the drainage channels that conduct runoff from upslope areas to the catchment outlet. Therefore, they act as important contributory areas for runoff generation if they develop hydrophobic surfaces or become saturated. Crockford and Topalides (personal communication) have recorded similar hydrophobic induced runoff responses in eucalypt forests near Canberra, Australia. Their studies also show water repellency to be more persistent after rainfall in summer than in winter and to reappear more rapidly after drying in summer.
Water repellent soils on the Geebung Creek catchment similarly reduced infiltration. However, infiltration rates at Geebung Creek were an order of magnitude larger than those for Puckapunyal forest soils. In addition, hydrophobic effects were not as persistent as at Puckapunyal (Figure 7), with infiltration rapidly recovering as soil surfaces became saturated. A major difference between the locations was the failure to translate hydrophobic soil effects into increased runoff from the Geebung Creek catchment.
At Geebung Creek the infiltration is controlled by preferential flow through root holes. Figure 8 shows that these macropores provide major conduits for water entry into soils irrespective of water repellency effects. Table 111 and Figure 7 indicate that macropores alone were conducting water into Type B and C soils at rates of up to 55 mm h-'. Rainfall intensities at Geebung Creek are rarely this high. Hence, for Geebung Creek catchment infiltration via macropores possibly masked any hydrophobicity effects on catchment runoff.
Adopting conventional infiltration theory (Mein and Larson, 1973), that neglects macropore flow, should give similar rates of steady-state infiltration for all three runs presented in Figure 7. This should produce a steady-state relative infiltration rate for Run 2-1 double that of Runs 2-2 and 3. However, they are approximately the same (0.82, see Figure 7). This can occur for varying rainfall intensities only if the area contributing to runoff is constant and virtually impervious, and all water from the remaining area infiltrates. Hydrophobic surface soils with uniform spatial distributions of surface connected macropores (and surrounding areas draining to the macropores) would satisfy this condition. We can, therefore, infer that spatial distributions of surface connected macropores for Runs 2-1,2-2, and 3 were similar, and that slightly less than 82 per cent of total plot area drained into macropores.
CONCLUSIONS
At Puckapunyal, persistent water repellency greatly reduced infiltration on the naturally more permeable lower slope/depression areas of a forest catchment. Such changes in infiltration behaviour were considered responsible for a reversal in the comparative runoff response of forest and grassland catchments for a summer storm in 1984.
At Geebung Creek infiltration was dominated by macropores and water repellency mainly reduced initial infiltration rates which then recovered. Relatively few macropores would be able to infiltrate the maximum rainfall intensities experienced at this location, even when highly hydrophobic surface conditions exist. As a result, hydrophobic soils have no measurable impact on catchment runoff at this site.
ACKNOWLEDGEMENTS
The authors wish to thank Mr R. Bath, Mr P. Wallbrink, Mr T. Dowling, and Mr J. Brophy, CSIRO, for assistance in obtaining the infiltration data, and Mr R. Bath and Mr J. Margules for digitizing the rainfall and runoff records. Financial assistance for this work was provided in part by the Australian Defence
222 G . J . BURCI1, I . D. MOORE, AND J . BURNS
Department, the Division of Water Resources, CSIRO, Australia, and the College of Agriculture, University of Minnesota, U.S.A. Published as Paper No. 15,638 of the scientific journal series of the Minnesota Agricultural Experiment Station on research conducted under Minnesota Agricultural Experiment Station Project MIN-12-055 and Southern Regional Research Project MIN-12-056 (S-211).
REFERENCES
Bond, R. D. 1968. ‘Water repellent sands’, 9th Int. Cong. Soil Sci. Trans., Adelaide. 339-347. Bond, R. D. 1969. ‘Factors responsible for water rcpcllence of soils’, in De Bano L. F. and Letey J. (Eds), Water Repellent Soils,
Proc. Symp. on Water Repellent Soils, Univ. Calif. Riverside, 259-264. Burch, G. J., Bath, R. K., Moore, 1. D., and O’Loughlin, E. M. 1987. ‘Comparative hydrological behaviour of forested and cleared
catchments in southeastern Australia’, J. Hydrol., 90, 19-42. Burch, G. J., Bath, R . K., Spate, A. P., Nicholls, A. O., and OLoughlin, E. M. 1983. ‘Soil water store, infiltration and runoff
characteristics of forest and grassland catchments at Puckapunyal in central Victoria’, in Hydrol. Water Resour. Symp. Inst. Eng., Aust. Nar. Conf, Publ., 83(13), 293-299.
Bureau of Meteorology (Australia) 1981-1987. Monthly Weather Review, New Soufh Wales, Department of Science and Technology.
De Bano L. F. 1969. ‘Water repellent soils: a worldwidc concern in managcment of soil and vegetation’, Agric. Sci. Rev., 7 , 11-IX. Gilmour, D. A. 1965. Hydrological Investigation of Soil and Vegetation Types in the Lower Cotter Catchment, Unpublished M.Sc.
Greacen, E. L. (Ed.) 1981. Soil Water Assessment by the Neutron Method, CSIRO, Melbourne, 98 pp. Jamison, V. C. 1942. ‘The slow reversible drying of sandy surface soils beneath citrus trees in central Florida’, Soil Sci. Soc. Am.
Letey, J. 1969. ‘Measurement of contact angle, water drop penetration time, and critical surface tension’, in De Bano, L. F. and
McGhie, D. A. and Posner, A. M. 1980. ‘Water repellence of a heavy-textured Western Australian surface soil’, Ausr. 1. Soil RES,.
McGhie, D. A. and Posner, A. M. 1981. ‘The effect of plant top material on the water repellence of fired sands and water repellent
Mein, R. G. and Larson, C. L. 1973. ‘Modelling infiltration during a steady rain’, Water Resour. Res., 9, 384-394. Moore, I. D., Mackay, S. M., Wallbrink, P. J., Burch, G. J., and O’Loughlin, E. M. 1986a. ‘Hydrologic characteristics and
modelling of a small forested catchment in southeastern New South Wales. Pre-logging condition’, J. Hydrol., 83, 307-335. Moore, I. D., Burch, G. J. and Wallbrink, P. J. 1986b. ‘Preferential flow and hydraulic conductivity of forest soils’, Soil Sci. Soc.
Am. J . , 50, 876-881. Morin, J. and Cluff, C. B. 1980. ‘Runoff calculation on semi-arid watersheds using a rotadish rainulator’, Water Resour. Res., 16,
1085-1093. Northcote, K. H. 1979. A Factual Key for the Recognition of Australian Soils (4th Ed.), Rellim Technical Publishcrs, Adelaide,
South Australia, 124 pp. OLoughlin, E. M., Cheney, N. P., and Burns, J. 1982. ‘The Bushrangers experiment: hydrological response of a eucalypt
catchment to fire’, First Nut. Symp. For. Hydrol., Inst. Eng., A&. Nat. Conf. Publ., 82(6), 132-138.
Thesis, Australian National University, Canberra, Australia.
Proc., I, 36-41,
Letey. J. (Eds), Wafer Repellent Soils, Proc. Symp. on Water Repellent Soils, Univ. Calif., Riverside, 43-47.
18, 309-323.
soils’, Aust. J. Agric. Res., 32, 609-620.