soil heavy metal contamination and risk assessment around the fenhe reservoir, china
TRANSCRIPT
Soil Heavy Metal Contamination and Risk Assessment Aroundthe Fenhe Reservoir, China
Hong Zhang • Guanglei Liu • Wei Shi •
Jinchang Li
Received: 21 November 2013 / Accepted: 21 May 2014
� Springer Science+Business Media New York 2014
Abstract Heavy metal contamination in the soil around a
water source is a particularly serious issue, because these
heavy metals can be transferred into the water source and
can pose significant human health risks through the con-
tamination of drinking water or farmland irrigation water.
In this paper, we collected surface soil samples from the
area surrounding the Fenhe Reservoir. The concentrations
of As, Cd, Cr, Cu, Hg, Ni, and Zn were determined and the
potential ecological risks posed by the heavy metals were
quantitatively evaluated. The primary inputs for As, Ni,
and Zn were natural sources, whereas the other elements
were derived from mainly anthropogenic sources. Hg dis-
plays more serious environmental impacts than the other
heavy metals. The upper reaches of the reservoir, located in
the northwest, display a higher potential ecological risk.
Keywords Heavy metals � Sources identification �Ecological risk � Spatial distribution
The contamination of urban and peri-urban soils by heavy
metals has received increasing public attention and cor-
relative surveys have been carried out in several munici-
palities (Birke and Rauch 2000; Rizo et al. 2013).
However, the contamination pattern in soils of water source
areas, especially in developing countries, remains inade-
quate, which is a particular problem because these heavy
metals can be transferred from the soil into reservoirs,
rivers, or underground water, which will pose a severe
threat to human health if it contaminates drinking water or
farmland irrigation water (Zahra et al. 2014; Suresh et al.
2012). Therefore, fully understanding (quantifying and
mapping) the spatial characteristics of soil contamination
by heavy metals in water source areas will facilitate
accurate risk assessment and planning of mitigation and/or
remediation (Lin 2002).
The Fenhe River, which is the second-largest tributary
of the Yellow River, possesses a length of 716 km and a
watershed area of 39, 000 km2, and flows through the
central and southern areas of the Shanxi Province of China.
The Fenhe Reservoir, located in the upper reaches of the
Fenhe River, is the largest reservoir and drinking water
source area in Shanxi Province. We conducted the present
study to survey soil heavy metal contamination around the
Fenhe Reservoir. The aims of this study are: (1) to deter-
mine and compare the concentrations of heavy metals in
soils surrounding the Fenhe Reservoir with those of other
areas; (2) to identify their possible sources; and (3) to
assess the potential ecological risks posed by these heavy
metals.
Materials and Methods
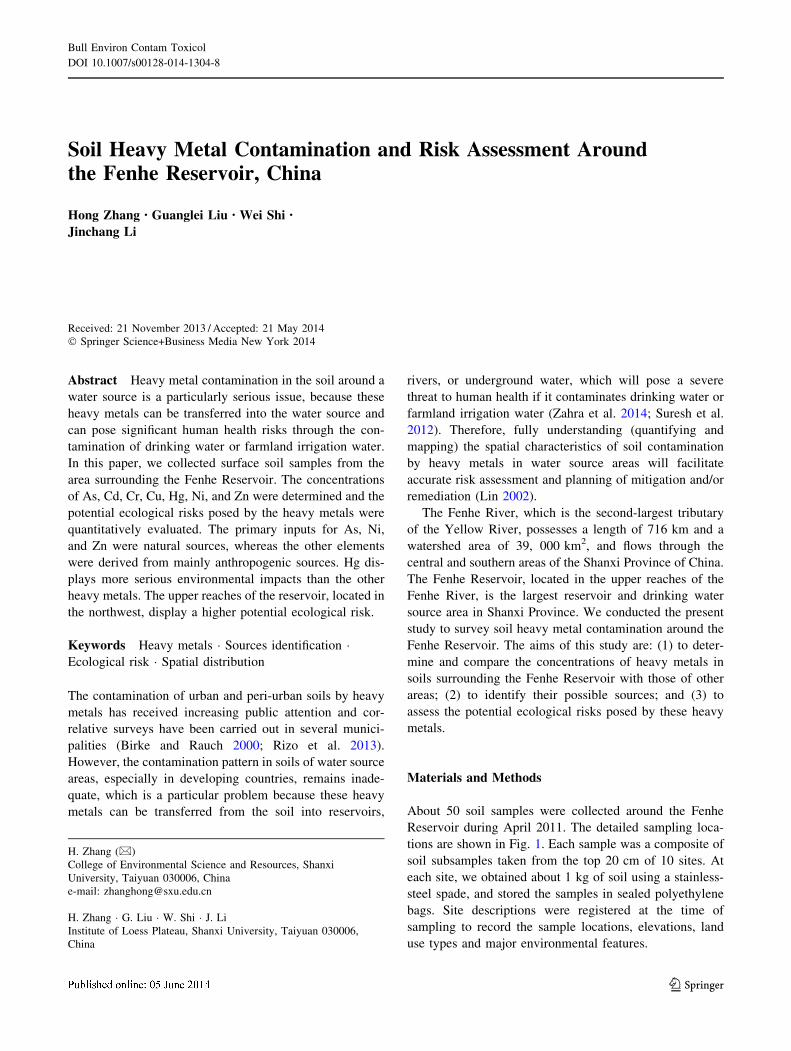
About 50 soil samples were collected around the Fenhe
Reservoir during April 2011. The detailed sampling loca-
tions are shown in Fig. 1. Each sample was a composite of
soil subsamples taken from the top 20 cm of 10 sites. At
each site, we obtained about 1 kg of soil using a stainless-
steel spade, and stored the samples in sealed polyethylene
bags. Site descriptions were registered at the time of
sampling to record the sample locations, elevations, land
use types and major environmental features.
H. Zhang (&)
College of Environmental Science and Resources, Shanxi
University, Taiyuan 030006, China
e-mail: [email protected]
H. Zhang � G. Liu � W. Shi � J. Li
Institute of Loess Plateau, Shanxi University, Taiyuan 030006,
China
123
Bull Environ Contam Toxicol
DOI 10.1007/s00128-014-1304-8
Each sample was air-dried, ground with agate mortar and
sieved to 200 mesh size and homogenized with cut sizes of
0.075 mm. All procedures of handling were carried out
without contacting any metals in order to avoid potential
cross-contamination of the samples. For analysis of Cr, Cu,
Zn, Ni, and Pb, samples were pressed into pellets having a
diameter of 3.1 cm under the pressure of 20 ton per cm2 and
then exposed to X-rays from a rhodium tube. The mea-
surements were carried out using a Rigaku ZSX 100e
wavelength dispersive X-ray fluorescence spectrometer. For
analysis of As and Hg, the soil samples were digested with
concentrated HNO3 and HCL in a microwave-accelerated
reaction system and were quantified using Atomic Fluores-
cence Spectrometer. For analysis of Cd, the soil samples
were digested with concentrated HF and H2SO4 in a
microwave-accelerated reaction system and were quantified
using graphite atomic absorption spectrometer.
Appropriate quality assurance procedures and precau-
tions were carried out to ensure reliability of the results.
Double distilled deionized water was used throughout the
study. Reagents blank determinations were used to correct
the instrument readings. Standard reference soil (GSS-
11\10\14) obtained from the China National Center for
Standard Materials were used for validation of the analyt-
ical procedure. Table 1 shows the analytical limits of
detection and relative standard deviation (RSD) of each
heavy metal.
Many factors can influence the concentrations of heavy
metals in soil and their impacts upon ecosystems. Principal
components analysis (PCA) has been widely used to
identify the sources of soil pollutants (Mico et al. 2006;
Gurhan and Semiha 2008). In the present study, we per-
formed PCA using SPSS 13.0 for Windows.
The potential ecological risks posed by the heavy metals
were quantitatively evaluated using Hakanson’s method
(1980; Muge et al. 2013). These risk indices are calculated
as follows:
Eir ¼ Ti
r �Ci
s
Cin
ð1Þ
RI ¼Xn
i¼1
Eir ð2Þ
where Eir is the potential ecological risk index of an indi-
vidual metal i; Tir is the toxic-response index for heavy
metals i, Hakanson (1980) suggested that appropriate Tir
values for As, Cd, Cr, Cu, Hg, Ni, and Zn were 10, 30, 2, 5,
40, 5, and 1, respectively. Cis is the measured concentration
of metal i at sampling sites s, Cin is the background value
(BGV) of heavy metal i in the research area. RI is the
potential ecological risk index that results from the com-
bination of multiple metals. The higher the E and RI are,
the higher the risk is. Table 2 summarizes the potential
ecological risk indices and corresponding risk grades.
Results and Discussion
Table 3 summarizes the results of heavy metal concentra-
tions in soils in the research area. The median was selected
as a representative of central tendency because the data
does not require a normal distribution. We have provided
Fig. 1 Location of the study
area and sampling sites
Table 1 The limits of detection and RSD of each heavy metal
Heavy metal Limits of detection (mg kg-1) RSD (%)
As 0.42 3.09
Cd 0.029 6.64
Cr 5 3.25
Cu 1 5.54
Hg 0.003 1.80
Ni 2 3.73
Zn 2 1.62
Bull Environ Contam Toxicol
123
the Grade I and Grade II values in the Chinese Environ-
mental Quality Standard for Soil as well as the soil BGV
for the Taiyuan Basin in Table 3. In the Chinese standard,
Grade I levels represent the average natural background
levels for uncontaminated soil of China, and Grade II
levels represent the levels at which a pollutant is hazardous
to agricultural production and human health.
The concentrations of heavy metals in the research area
are lower than the Grade I and Grade II criteria, suggesting
that the soils of the research area has not been contami-
nated related to the average natural background levels of
heavy metals in soils of China and were currently not
hazardous to agricultural production and human health.
However, Cr and Hg displayed relatively higher mean
concentrations than the corresponding background levels
for soil in the Taiyuan Basin, suggesting that both elements
were more likely to be affected by anthropogenic sources.
The coefficients of variation (CV) values were all relatively
small for the seven elements, suggesting that these
elements were derived predominantly from natural sources
or from dispersed anthropogenic sources.
In this study, the concentrations of heavy metals of soils
in this research area were in the approximate order of
magnitude when compared with those in other areas of
China (Table 4). The concentrations of heavy metals in
different research areas were various, which may be
attributed to the different natural background and human
activities.
PCA was applied here to identify the sources of soil
pollutants. The results of the efficiency of the method are
indicated in Table 5. It can be seen that the first 4 factors
explain over 86.61 % of the total variation. The first PC,
which explained 37.15 % of the total variance, was
strongly and positively related to As, Ni, and Zn. As, Ni,
and Zn showed significant correlations and their mean
concentrations were comparable to the corresponding
background levels in the research area. Therefore, it seems
reasonable to infer that PC1 is related to natural sources at
Table 2 Indices and grades of
potential ecological riskIndices Low Moderate High Very high Extremely high
E E \ 40 40 B E \ 80 80 B E \ 160 160 B E \ 320 E C 320
RI RI \ 150 150 B RI \ 300 300 B RI \ 600 RI C 600
Table 3 Descriptive statistics of heavy metal concentrations in soils in the research area
Heavy metal Median Minimum Maximum SD CV Grade I Grade II BGV
As 10.7 4.1 12.8 1.3 12.50 15 25 10.2
Cd 0.114 0.050 0.155 0.025 23.36 0.2 0.8 0.1
Cr 75.4 52.2 87.7 5.7 7.57 90 250 65.1
Cu 21.8 14.4 32.9 3.3 14.93 35 100 21.5
Hg 0.041 0.022 0.095 0.017 36.96 0.15 1.5 0.03
Ni 26.6 22.3 33.4 2.5 9.11 40 100 28.2
Zn 60.6 41.0 84.4 6.5 10.64 100 300 61.6
All concentrations were given in unit of mg kg-1 of dry weight
SD standard deviation, CV coefficient of variation (%), Grade I the average BGV of soil heavy metals of China (SEPA 2008), Grade II the value
of soil heavy metals in China for protecting agricultural production and human health (SEPA 2008), BGV background value of soil heavy metals
in the Taiyuan Basin (Wang et al. 2008)
Table 4 Heavy metals
concentrations (mg kg-1) in
different soil samples in China
– Means data not available
Sample site Number As Cd Cr Cu Hg Ni Zn References
Around the Fenhe
Reservoir, Taiyuan
50 10.7 0.114 75.4 21.8 0.041 26.6 60.6 This study
Roadside, Beijing 80 8.1 0.215 61.9 29.7 – 26.7 92.1 Chen et al.
(2010)
Suburban areas, Tianjin 86 9.5 0.49 101 67 0.97 – 100.6 Shi et al.
(2010)
Industrial district,
Shenyang
93 17.56 0.54 65.1 71.1 0.33 – 182.0 Li et al.
(2013)
Bull Environ Contam Toxicol
123
the regional scale. The second PC, which explained
24.59 % of the total variance, demonstrated high positive
factor loadings for Cu and Hg. Previous studies showed
that Cu and Hg are typically anthropogenically influenced
(McMartin et al. 2002). PC3 and PC4 accounted for
13.48 % and 11.39 % of the total variance, and showed
strong positive loadings for Cr and Cd, respectively, which
can be identified as another tracer of anthropogenic pol-
lution sources.
The potential ecological risk factors E for each metal
and the RI for all seven heavy metals combined of the
research area were summarized in Table 6. The results
show that the highest concentrations of Hg present a con-
siderably higher potential ecological risk than any other
elements, and that Cd poses a moderate potential ecologi-
cal risk. In contrast, As, Cr, Cu, Ni, and Zn pose a low
potential ecological risk. The differences result from the
fact that the ‘toxic-response’ factors for Cd and Hg are
higher than those for other elements. On the other hand, Hg
concentrations in soils in the study area are elevated, but
not dramatically; for example, the maximum concentration
of Hg is only 3.2 times the BGV for the study area (and the
ratios are even\1 when compared with the Grade I criteria
in Table 3). Based on the potential ecological risk factors
for all metals combined (RI), the minimum, mean, and
maximum potential ecological risk grades are low, low,
and moderate, respectively, which can be mainly attributed
to the fact that the study area is located far from any
metropolitan areas and does not support any heavy indus-
trial operations.
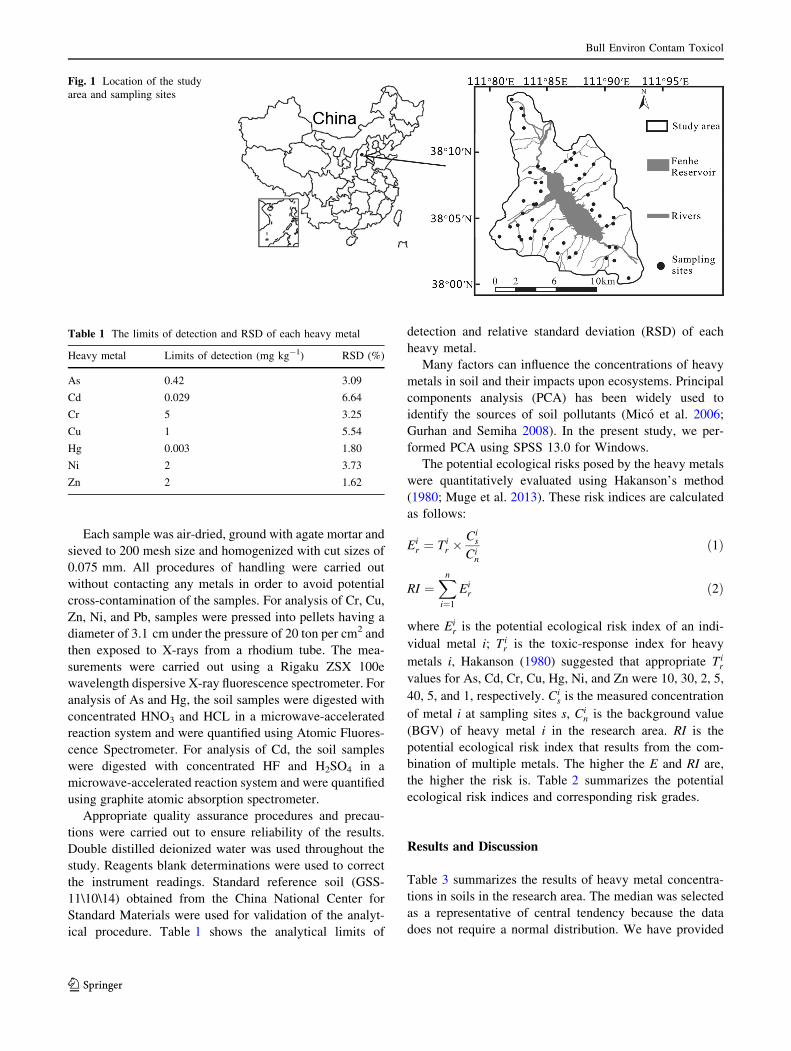
In order to indicate the spatial distribution of potential
ecological risk of heavy metals in the research area, we
mapped the distribution of RI by using of GIS-based Kri-
ging interpolation methods. The results were shown in
Fig. 2 and suggested that the northwestern part of the study
area exhibits a moderate potential ecological risk, whereas
other areas except local spots present mainly a relatively
low potential ecological risk. This should be a cause for
concern for the local government because the soils in the
area, located in the upper reaches of the Fenhe Reservoir,
can easily contaminate the reservoir through particulate
deposition by wind and precipitation.
The soils surrounding the Fenhe Reservoir are mostly
lightly polluted by heavy metals, since none of the seven
analyzed elements in any of our samples exceeded the
Grade I criteria that represent the natural background levels
for uncontaminated soil in China or the Grade II criteria
that were established to protect agricultural production and
human health. The concentrations of heavy metals in the
research area were in the approximate order of magnitude
comparing with those in other areas of China. The con-
centrations of As, Ni, and Zn were mainly affected by
natural sources and the concentrations of Cd, Cr, Cu, and
Fig. 2 Spatial distribution of RI in soils in the research area
Table 5 PCA results with first 4 factors
Heavy
metals
PC 1
(37.15 %)
PC 2
(24.59 %)
PC 3
(13.48 %)
PC 4
(11.39 %)
As 0.760 -0.379 0.264 0.216
Cd 0.108 -0.059 0.041 0.989
Cr 0.216 -0.029 0.931 0.045
Cu 0.512 0.635 -0.389 0.001
Hg -0.060 0.937 0.047 -0.067
Ni 0.913 0.014 0.027 0.105
Zn 0.815 0.260 0.182 -0.025
Table 6 Potential ecological
risk indices (E) for each metal
and the risk index (RI) for soil
heavy metals in the research
area
Heavy
metals
Toxic-response index
(Tir)
E RI
Min. Mean Max. Min. Mean Max.
As 10 4.07 10.18 12.57 82.69
low
116.35
low
180.51
moderateCd 30 14.91 31.99 46.50
Cr 2 1.50 2.17 2.52
Cu 5 3.34 5.13 7.65
Hg 40 29.33 61.09 126.67
Ni 5 3.96 4.79 5.92
Zn 1 0.67 0.99 1.37
Bull Environ Contam Toxicol
123
Hg were mainly controlled by various anthropogenic
sources. The potential ecological risks posed by Hg were
considerably higher than those for any other elements. The
northwestern parts of the study area are at a moderate
potential ecological risk, based on the multi-metal risk
index (RI). To conclude, the results of our study highlight
the influence of human activities, particularly agricultural
activities, on heavy metal levels in soils surrounding the
Fenhe Reservoir and the potential ecological risks posed by
these pollutants. This may thereby provide a basis for
developing soil quality policies for the region.
Acknowledgments This work was financially supported by the
National Natural Science Foundation of China under Grant 41271513.
References
Birke M, Rauch U (2000) Urban geochemistry: investigations in the
Berlin metropolitan area. Environ Geochem Health 22(3):233–248
Chen X, Xia XH, Zhao Y, Zhang P (2010) Heavy metal concentra-
tions in roadside soils and correlation with urban traffic in
Beijing, China. J Hazard Mater 181:640–646
Gurhan YM, Semiha I (2008) Multivariate analyses to determine the
origin of potentially harmful heavy metals in beach and dune
sediments from Kizkalesi coast, Turkey. Bull Environ Contam
Toxicol 81(1):57–68
Hakanson L (1980) An ecological risk index for aquatic pollution
control: a sedimentological approach. Water Res 14(8):975–1001
Li XY, Liu LJ, Wang YG et al (2013) Heavy metal contamination of
urban soil in an old industrial city in Northeast China. Geoderma
192:50–58
Lin Y (2002) Multivariate geostatistical methods to identify and map
spatial variations of soil heavy metals. Environ Geol 42(1):1–10
McMartin I, Henderson P, Plouffe A, Knight R (2002) Comparison of
Cu–Hg–Ni–Pb concentration in soils adjacent to anthropogenic
point sources: examples from four Canadian sites. Geochem
Explor Environ Anal 2(1):57–73
Mico C, Recatala L, Peris M, Sanchez J (2006) Assessing heavy metal
sources in agricultural soil of an European Mediterranean area
by multivariate analysis. Chemosphere 65(5):863–872
Muge A, Filiz K, Muhammet D, Tolga GL (2013) Heavy metal
concentrations in surficial and core sediments from Izmir bay: an
assessment of contamination and comparison against sediment
quality benchmarks. Bull Environ Contam Toxicol 91(1):69–75
Rizo OD, Morell DF, Lopez JOA et al (2013) Spatial distribution and
contamination assessment of heavy metals in urban topsoils from
Las Tunas city, Cuba. Bull Environ Contam Toxicol 91(1):29–35
SEPA (State Environmental Protection Administration of China)
(2008) Environmental quality standard for soils, GB15618-2008
Shi RG, Lv JG, Cai YM et al (2010) Levels, spatial distribution and
possible sources of heavy metals contamination of suburban soils
in Tianjin, China. Bull Environ Contam Toxicol 85(3):287–290
Suresh G, Sutharsan P, Ramasamy V, Venkatachalapathy R (2012)
Assessment of spatial distribution and potential ecological risk
of the heavy metals in relation to granulometric contents of
Veeranam lake sediments, India. Ecotoxicol Environ Saf
84:117–124
Wang XJ, Lai JQ, Kong H et al (2008) Analysis of the geochemical
distribution characteristics of heavy metal elements in soil in
Taiyuan basin and Taiyuan city (in Chinese). Earth Environ
36(1):72–80
Zahra A, Hashmi MZ, Malik RN, Ahmed Z (2014) Enrichment and
geo-accumulation of heavy metals and risk assessment of
sediments of the Kurang Nallah—feeding tributary of the Rawal
Lake reservoir, Pakistan. Sci Total Environ 470–471:925–933
Bull Environ Contam Toxicol
123