soil gas sampling for vapor intrusion assessments: key issues · soil gas sampling for vapor...
TRANSCRIPT

MA & CT, 12/2004 1
Dr. Blayne HartmanH&P Mobile Geochemistry
Solana Beach, CA
Soil Gas Sampling for Vapor Intrusion Assessments:
Key Issues

MA & CT, 12/2004 2
2
VI Requires Much Lower DLs• Typical Soil Gas Concentrations
– MTBE & Benzene near gasoline soil: >100 ug/L– PCE under dry cleaner: >100 ug/L
• Soil Gas Levels a Threat to GW: – MTBE: >10 ug/L– BTEX/PCE: >100 ug/L
• Soil Gas Levels “Failing” VI Criteria– Subslab: Benzene: 0.003 ug/L, PCE: 0.004 ug/L– At 5’: Benzene: 0.15 ug/L, PCE: 0.02 ug/L
The biggest difference between sampling soil gas for site assessments and for vapor intrusion is that we are measuring at concentration levels 1,000 to 10,000 times lower. So, the protocols require much greater care. The chances for false positives from equipment blanks are much greater.

MA & CT, 12/2004 3
3
The Most Common Goof
1 ug/L Benzene equals: • 1 ppbv• 1 ppmv• 330 ppbv• None of the Above
Solution: Handy-Dandy Unit Converter
Unit conversions are the most common error new practitioners in vapor intrusion make. The error if the units are inadvertently mixed is huge: greater than 300 times for benzene. A nice and simple, handy-dandy unit conversion spreadsheet can be found at www.handpmg.com.

MA & CT, 12/2004 4
4
Which Soil Vapor Method?
• Active• Passive (can’t use for risk)• Flux Chambers (unfamiliar method)
Active method most often employed for VI
There are three types of soil gas methods. Active refers to actively withdrawing vapor out of the ground. It gives quantitative values.
Passive refers to burying an adsorbent in the ground and letting the vapors passively contact and adsorb onto the collector. It does not give quantitative data and hence can not be used for risk applications, except for screening.
The active soil gas method is the one most applicable to vapor intrusion assessments.
MA & CT, 12/2004 5
5
Direct Flux Measurement (Flux Chambers)
• Pros:– Direct Measurement of Intrusion
• Cons:– Proper Location?– Protocols Debated– How to Use Data?– Unsophisticated Audience– Regulatory Acceptance Limited
Surface flux chambers are attractive because they give a direct measurement of the flux into the structure or out of the soil. This eliminates the need to know the effective diffusivity and the uncertainty inherent in the models. The biggest drawback with chambers is whether they can be placed in the proper locations in an existing structure. Also, few regulators, consultants, or vendors have used them, so they are unfamiliar of the protocols to use and how to interpret the data. As a result, regulatory acceptance is limited. In slab-on-grade structures or undeveloped lots, surface flux chambers may be the best method to use.

MA & CT, 12/2004 6
6
Soil Gas Sample Collection Methods
• Driven Probe/Rod Methods – Hand Equipment, Direct-Push
– Collect sample while probe in ground
• Vapor Mini-Wells/Implants– Inexpensive & easy to install/remove– Allow repeated sampling– Near surface & deep (down auger flights)– Can “nest” in same bore hole
There are 2 common ways to collect active soil gas samples: collection through a probe or rod driven into the ground or collection through a vapor well buried into the ground. Both methods give reliable data.
The vapor wells consist of small diameter, inert tubing and offer advantages when vertical profiles are desired or when repeated sampling events are likely. Multiple tubes can be “nested” in the same borehole.

MA & CT, 12/2004 7
7
Soil Gas Sampling Issues(VI Requires More Care & Experience)
• How Much to Collect?– Greater the volume, greater the uncertainty
• Containers– Tedlars, Summas, Syringes … Don’t Chill!
• Temporal Variation/Stability– Closer to surface, greater the effect
• Tracer/Leak Compound– Crucial for sub-slab & large sample volumes
The biggest difference between sampling soil gas for site assessments and for vapor intrusion is that we are measuring at concentration levels 1,000 to 10,000 times lower. So, the protocols require much greater care.
Smaller volumes create less headaches, containers must be inert and handled properly, samples are collected closer to the surface, and tracer/leak compounds are required to ensure sample integrity because small leaks can create significant effects at such low concentrations.
MA & CT, 12/2004 8
8
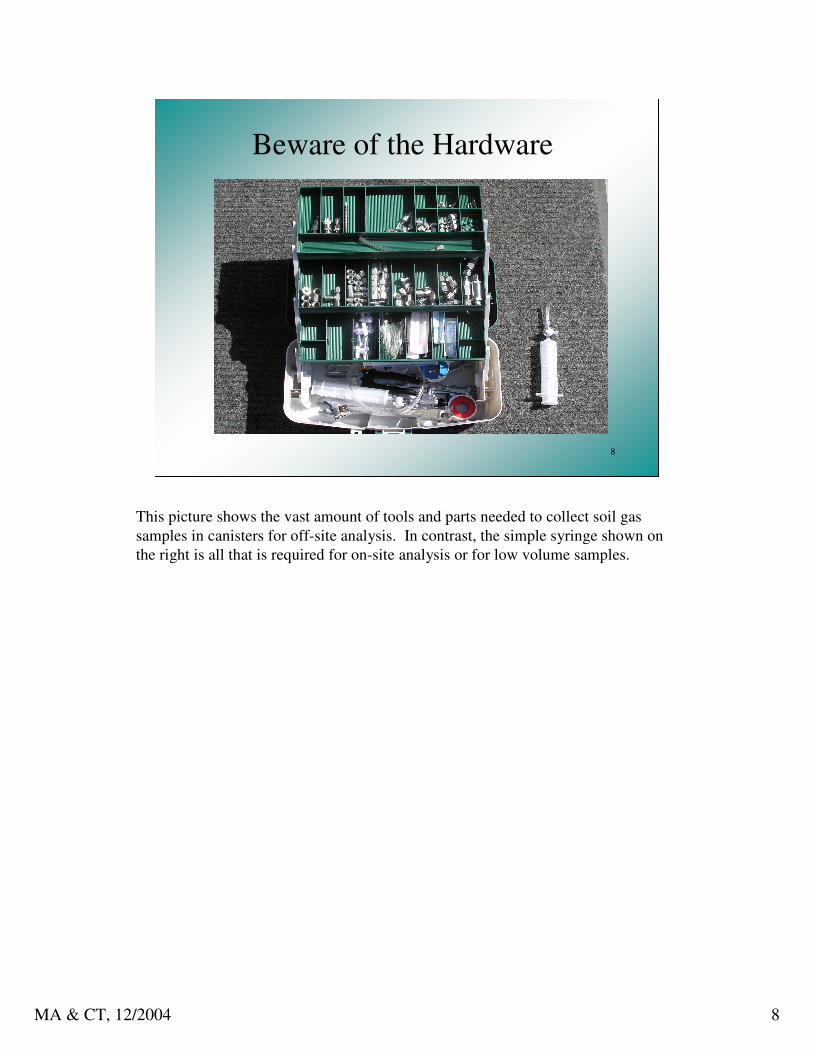
Beware of the Hardware
This picture shows the vast amount of tools and parts needed to collect soil gas samples in canisters for off-site analysis. In contrast, the simple syringe shown on the right is all that is required for on-site analysis or for low volume samples.

MA & CT, 12/2004 9
9
Beware of the Hardware
The set-up on the left is typical of the sampling train required to collect soil gas samples in canisters for offsite analysis. Note all of the fittings.
The syringe on the right is all that is required for on-site analysis.
MA & CT, 12/2004 10
10
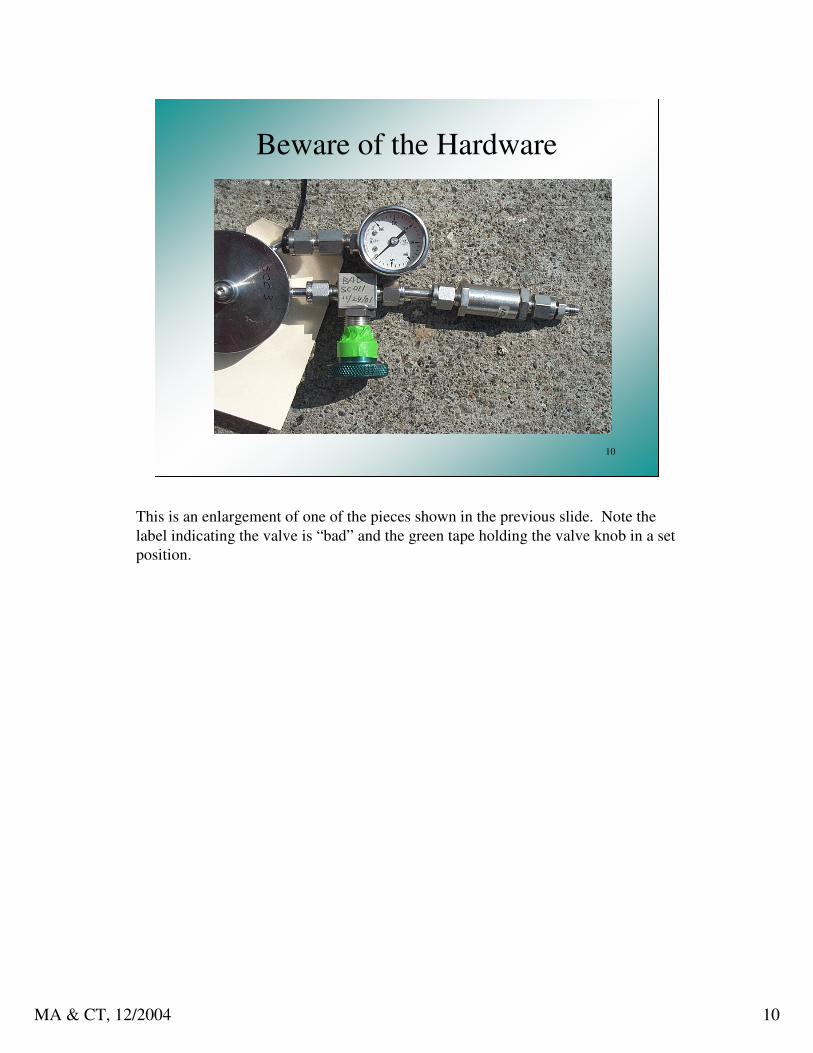
Beware of the Hardware
This is an enlargement of one of the pieces shown in the previous slide. Note the label indicating the valve is “bad” and the green tape holding the valve knob in a set position.

MA & CT, 12/2004 11
11
How Often to Sample?• Closer to Surface, More Variability
– 3’ to 5’ bgs generally considered stable– Upper few feet likely variable
• Seasonal Effects– Extreme temperature variations– Heating/cooling of structure– Heavy periods of rain
Vapor Implants Allow Easy Resampling
The closer to the surface, the more the potential temporal variation. Depths of 3’ to 5’ below the surface are generally considered stable and repeatable.
Larger variations can be expected in areas of extreme temperature variation (northern climates), during heavy periods of precipitation, and when the structure’s heating or ventilation systems are operative.
If conditions suggest that temporal variations may be significant and if the measured values are close to the fail level, then repeated sampling may be appropriate and vapor implants are a good approach.

MA & CT, 12/2004 12
12
Soil Gas Analysis Issues• Methods 8021 & 8260
– DLs > 10 ug/m3 on small volume samples– Can be done on-site– Less hardware
• Toxic Organics Methods (TO-14, TO-15,TO-17)– DLs < 10 ug/m3 on larger volume samples– Generally not available on-site– Levels > 100 ug/m3 can cause lab problems– Extensive hardware can lead to false positives– More Expensive!
Required Method Depends Upon Detection Level
A variety of analytical methods are available to measure soil gas samples, but no federal guidance document exists specifying any one. Methods 8021 and 8260 are soil & water methods but give accurate results for soil gas samples at detection levels above 10 ug/m3. The toxic organic methods (TO) are designed for ambient air samples, so they give accurate results for soil gas samples at much lower detection levels. The TO methods require extensive hardware and are far more expensive.
Neither sets of methods were designed for soil gas samples. Both sets have pros and cons. The first criteria for selection should be which method(s) reach the required detection limits.

MA & CT, 12/2004 13
13
Calibration RangeMDL to highest standard
assumes 20 cc sample
10-2 10-1 1 10 102 103 104 105
ug/m3
TO-15/14A SIM
8260 SCAN
TO-15/14A SCAN
8260 SIM
Normal Range
Extended by dilution
This slide shows the calibration range for the TO-15/14 method and 8260 method. Note that the TO-15 method is better for ultra-low detection levels (<5 ug/m3) and the 8260 method is better for higher concentration samples.
Note that the sample volume being used for both methods is only 20 cc of sample, so there is no need for samples larger than 1 liter to be collected for analytical purposes.
MA & CT, 12/2004 14
14
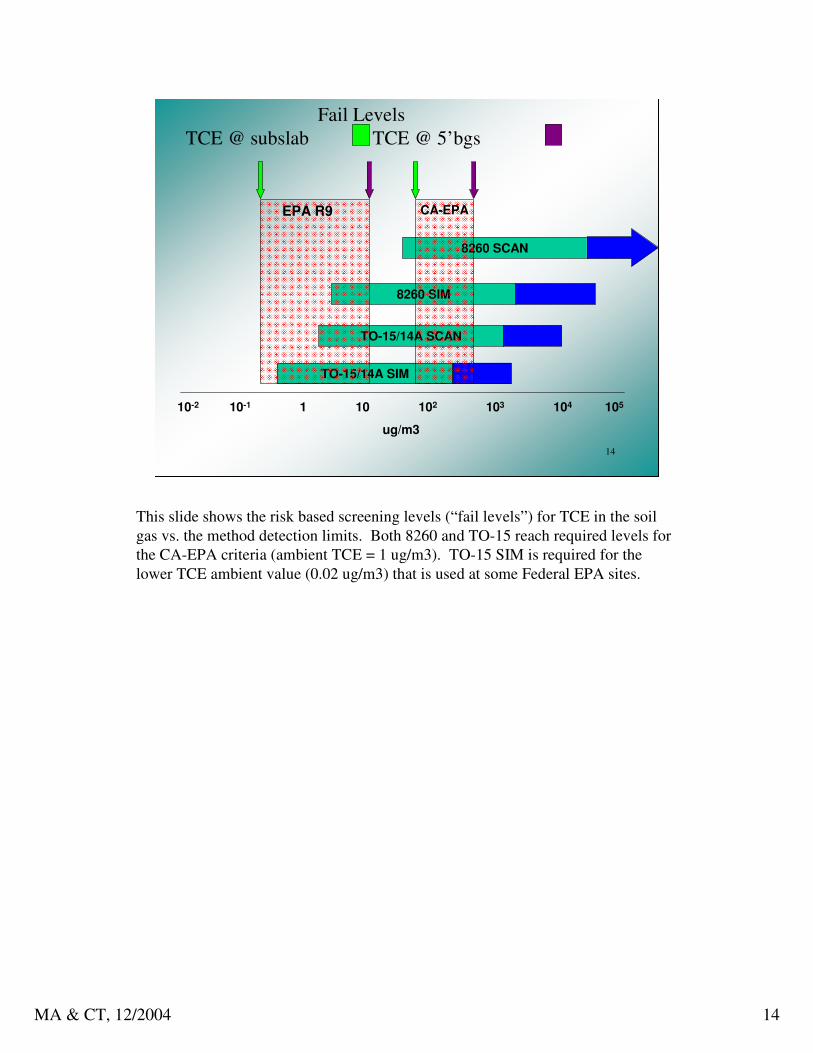
Fail LevelsTCE @ subslab TCE @ 5’bgs
10-2 10-1 1 10 102 103 104 105
ug/m3
TO-15/14A SIM
8260 SCAN
TO-15/14A SCAN
8260 SIM
EPA R9 CA-EPA
This slide shows the risk based screening levels (“fail levels”) for TCE in the soil gas vs. the method detection limits. Both 8260 and TO-15 reach required levels for the CA-EPA criteria (ambient TCE = 1 ug/m3). TO-15 SIM is required for the lower TCE ambient value (0.02 ug/m3) that is used at some Federal EPA sites.
MA & CT, 12/2004 15
15
10-2 10-1 1 10 102 103 104 105
ug/m3
TO-15/14A SIM
8260 SCAN
TO-15/14A SCAN
8260 SIM
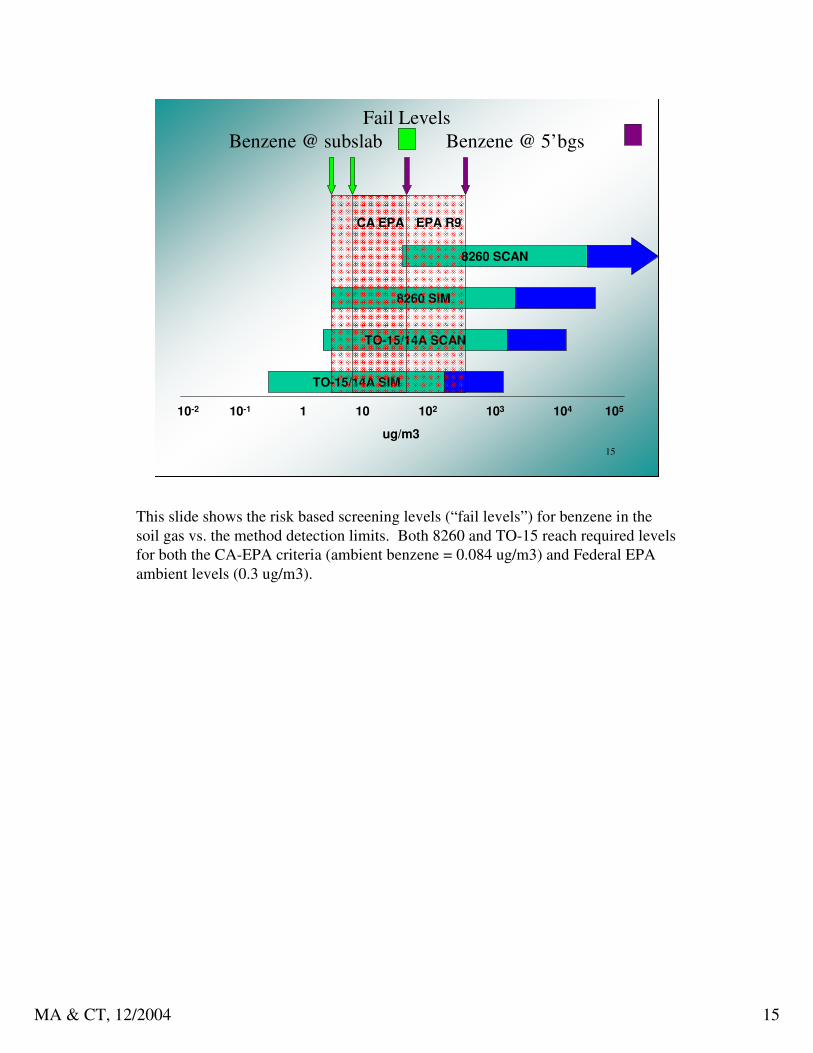
Fail LevelsBenzene @ subslab Benzene @ 5’bgs
CA EPA EPA R9
This slide shows the risk based screening levels (“fail levels”) for benzene in the soil gas vs. the method detection limits. Both 8260 and TO-15 reach required levels for both the CA-EPA criteria (ambient benzene = 0.084 ug/m3) and Federal EPA ambient levels (0.3 ug/m3).
MA & CT, 12/2004 16
16
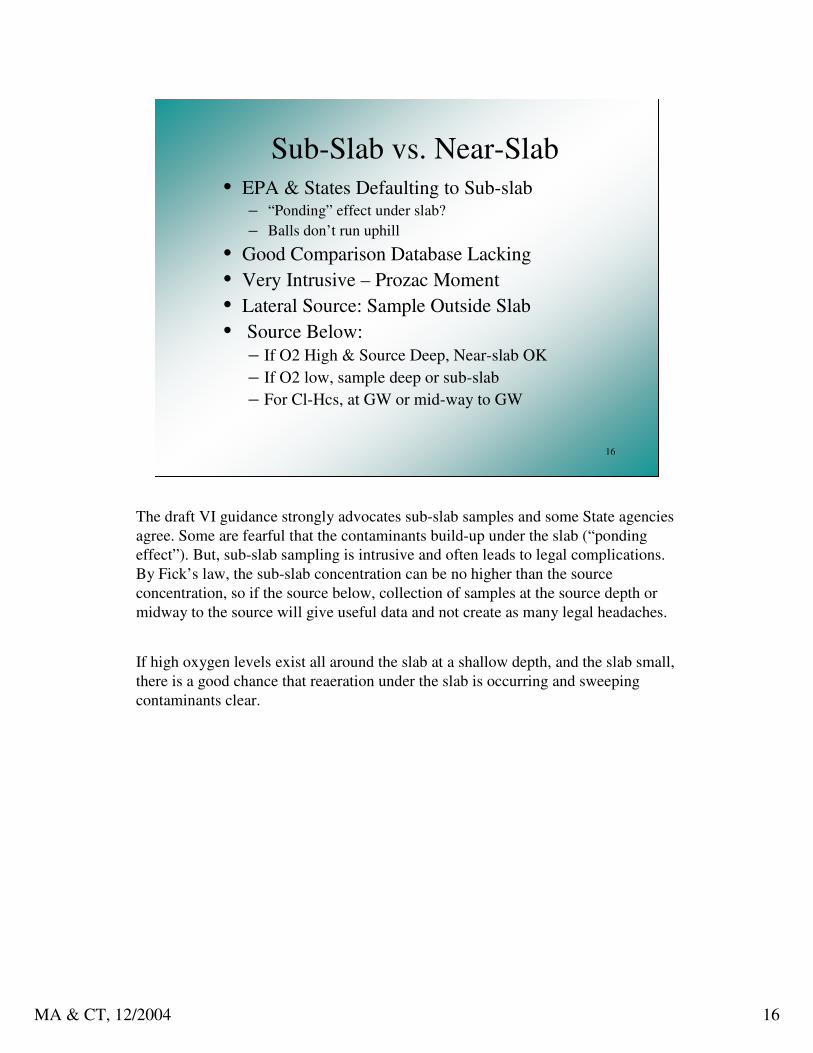
Sub-Slab vs. Near-Slab• EPA & States Defaulting to Sub-slab
– “Ponding” effect under slab?– Balls don’t run uphill
• Good Comparison Database Lacking• Very Intrusive – Prozac Moment• Lateral Source: Sample Outside Slab• Source Below:
– If O2 High & Source Deep, Near-slab OK– If O2 low, sample deep or sub-slab– For Cl-Hcs, at GW or mid-way to GW
The draft VI guidance strongly advocates sub-slab samples and some State agencies agree. Some are fearful that the contaminants build-up under the slab (“ponding effect”). But, sub-slab sampling is intrusive and often leads to legal complications. By Fick’s law, the sub-slab concentration can be no higher than the source concentration, so if the source below, collection of samples at the source depth or midway to the source will give useful data and not create as many legal headaches.
If high oxygen levels exist all around the slab at a shallow depth, and the slab small, there is a good chance that reaeration under the slab is occurring and sweeping contaminants clear.

MA & CT, 12/2004 17
17
Sub-Slab vs. Near Slab Sampling
0 2 4 6 8 10 12 14 16 18 20 22 24x (m)
-8
-6
-4
-2
0
Dep
th B
GS
(m)
0 2 4 6 8 10 12 14 16 18 20 22 24x (m)
-8
-6
-4
-2
0
Dept
h BG
S (m
)
-- from API, 2004
0 2 4 6 8 10 12 14 16 18 20 22 24
x (m)
-18
-16
-14
-12
-10
-8
-6
-4
-2
0
Dep
th B
GS
(m)
0 2 4 6 8 10 12 14 16 18 20 22 24
x (m)
-18
-16
-14
-12
-10
-8
-6
-4
-2
0
Dep
th B
GS
(m)0.001
1E-05
NO OXYGEN BELOW SLAB OXYGEN BELOW SLAB
������������� ������������������������������ �� ������ ������ ��� ���������������� ��������������� �� �� �������� � ������
The 2 figures to the left show model results for situations with high subsurface contamination and no oxygen replenishment. You can see the oxygen concentrations fall off quickly with depth near the house and there is no oxygen under the house for the organisms. Hence, sub-slab concentrations are much higher than near-slab. In such situations, sample sub-slab or outside the slab at deeper depths.
The 2 figures to the right show the situation where oxygen is being replenished. In this case, oxygen levels near-slab are greater than 10% and there is plenty of oxygen sub-slab for bioattenuation to occur. Hence, near-slab concentrations of the hydrocarbons are a good reflection of sub-slab concentrations.
MA & CT, 12/2004 18
18
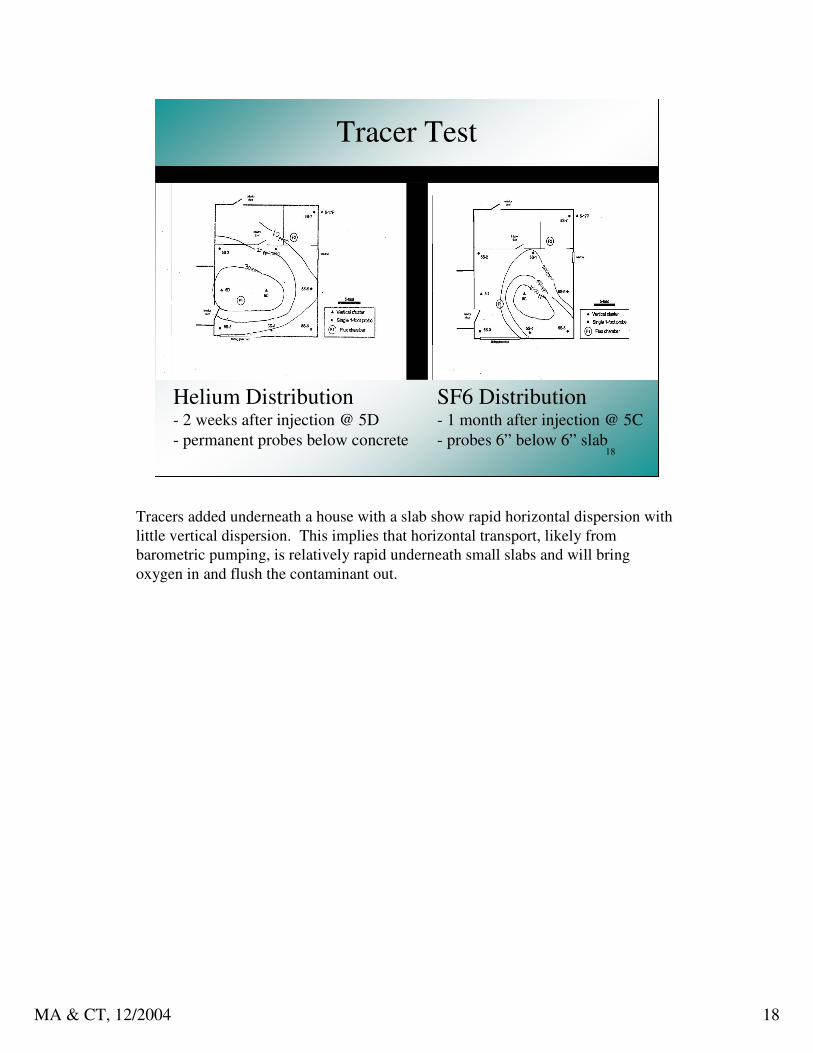
Helium Distribution- 2 weeks after injection @ 5D- permanent probes below concrete
SF6 Distribution- 1 month after injection @ 5C- probes 6” below 6” slab
Tracer Test
Tracers added underneath a house with a slab show rapid horizontal dispersion with little vertical dispersion. This implies that horizontal transport, likely from barometric pumping, is relatively rapid underneath small slabs and will bring oxygen in and flush the contaminant out.

MA & CT, 12/2004 19
19
Bioattenuation of HCs
• Existing data suggest O2 effective barrier• Attenuation > 1000 times• Vertical profiles of COC & O2
• DNA can confirm presence of tropic bugs
A vast number of studies have been performed clearly demonstrating that thebioattenuation of hydrocarbon vapors occurs in aerobic soils. In general, the studies show that when oxygen levels are 10% or greater (a published study by NJDEP suggested oxygen levels as low as 6% are sufficient), and a couple feet of vadosezone exist between the source and receptor, that the hydrocarbons aren’t escaping into the receptor. Attenuation factors can be as high as 10,000 times (alpha = 0.0001).
Documention that this process is occurring is done by collecting vertical profiles of the soil gas for the hydrocarbons, oxygen, and carbon dioxide. If shown to occur, many agencies are conservatively allowing a factor of 10 to 100 reduction in the alpha factor.

MA & CT, 12/2004 20
20
Methane Vertical Profile
This plot are four vertical profiles around a house in Santa Maria CA showing a large decrease in methane concentrations at the exact same depth. Methane decreased from 57,000 ppmv to less than 10 ppmv, a reduction of 10,000 times (alpha=0.0001).

MA & CT, 12/2004 21
21
Oxygen Vertical Profile
This plots shows the soil gas oxygen concentrations in the same vertical profiles. The oxygen falls off rapidly at a depth of 2 to 3 feet below the surface. This is the same depth that the methane also decreased significantly indicating the zone ofbioattenuation. Soil samples collected at this depth show DNA of methane consuming bacteria (methanotropes).
MA & CT, 12/2004 22
0.01 20 40 60 80 100
= field data COA-3 under asphalt Model Case 1 = No slab= field data COA-2 no asphalt Model Case 2 = With slab
No Slab
Case 2-Slab
0
10
8
2
4
6
Dis
tanc
e (f
eet)
Benzene content (ppm soil gas)
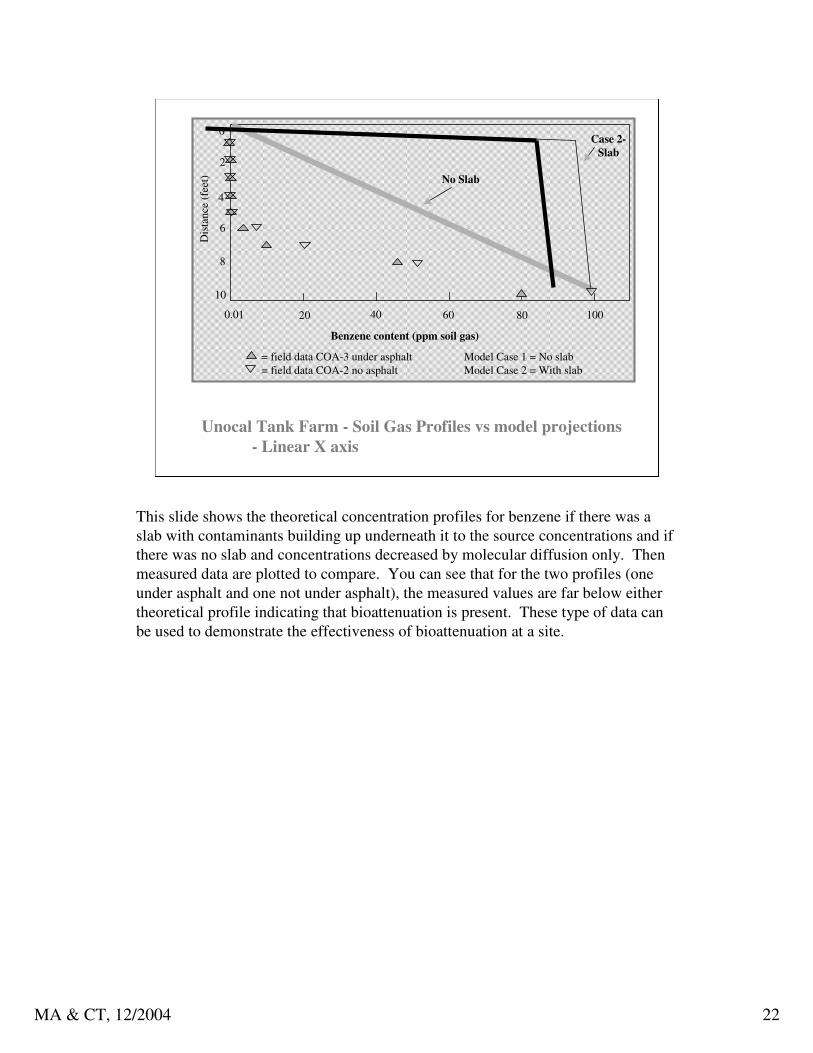
Unocal Tank Farm - Soil Gas Profiles vs model projections- Linear X axis
This slide shows the theoretical concentration profiles for benzene if there was a slab with contaminants building up underneath it to the source concentrations and if there was no slab and concentrations decreased by molecular diffusion only. Then measured data are plotted to compare. You can see that for the two profiles (one under asphalt and one not under asphalt), the measured values are far below either theoretical profile indicating that bioattenuation is present. These type of data can be used to demonstrate the effectiveness of bioattenuation at a site.
MA & CT, 12/2004 23
23
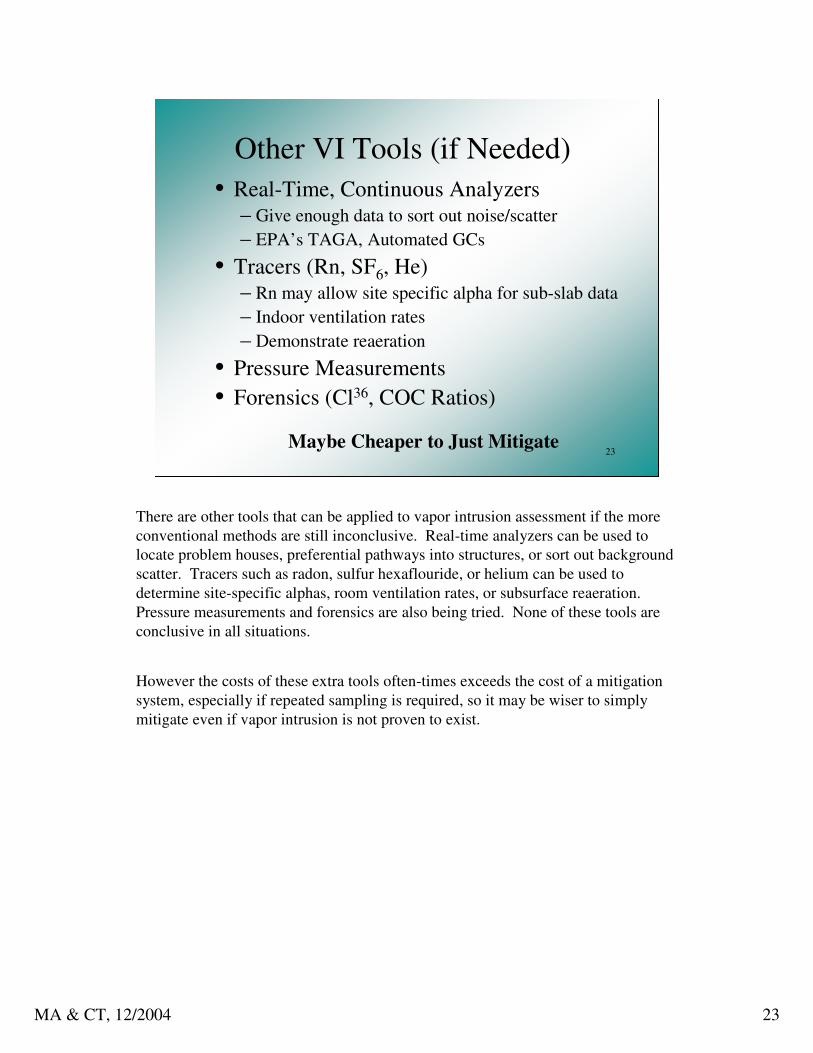
Other VI Tools (if Needed)• Real-Time, Continuous Analyzers
– Give enough data to sort out noise/scatter– EPA’s TAGA, Automated GCs
• Tracers (Rn, SF6, He)– Rn may allow site specific alpha for sub-slab data – Indoor ventilation rates– Demonstrate reaeration
• Pressure Measurements• Forensics (Cl36, COC Ratios)
Maybe Cheaper to Just Mitigate
There are other tools that can be applied to vapor intrusion assessment if the more conventional methods are still inconclusive. Real-time analyzers can be used to locate problem houses, preferential pathways into structures, or sort out background scatter. Tracers such as radon, sulfur hexaflouride, or helium can be used to determine site-specific alphas, room ventilation rates, or subsurface reaeration. Pressure measurements and forensics are also being tried. None of these tools are conclusive in all situations.
However the costs of these extra tools often-times exceeds the cost of a mitigation system, especially if repeated sampling is required, so it may be wiser to simply mitigate even if vapor intrusion is not proven to exist.

MA & CT, 12/2004 24
24
Importance of Enough Data
• Background Variable• Lots of Potential Scatter • Structures are “Mixing Containers”• Need to Separate Sources
As with any type of site investigation, it is difficult to reach any conclusions with any degree of confidence with only a handful of data points. Vapor intrusion assessments with 1 soil gas and/or indoor air analysis per residence are very difficult to interpret, but the data are so expensive to collect that this is quite commonly the case.
MA & CT, 12/2004 25
25
Huntington Beach Soil GasHUNTINGTON BEACH SITE - SOIL GAS
0
5
10
15
20
25
30
35
6:18
:00
PM
7:09
:00
PM
8:00
:00
PM
8:50
:00
PM
9:41
:00
PM
10:3
2:00
PM
11:2
3:00
PM
12:1
3:00
AM
1:04
:00
AM
1:55
:00
AM
2:45
:00
AM
3:36
:00
AM
4:27
:00
AM
5:18
:00
AM
6:08
:00
AM
6:59
:00
AM
7:50
:00
AM
8:41
:00
AM
9:31
:00
AM
10:2
2:00
AM
11:1
3:00
AM
12:0
3:00
PM
12:5
4:00
PM
1:45
:00
PM
2:36
:00
PM
3:26
:00
PM
4:17
:00
PM
5:08
:00
PM
5:59
:00
PM
6:23
:00
PM
Time
Val
ue (%
) CH4
CO2
O2
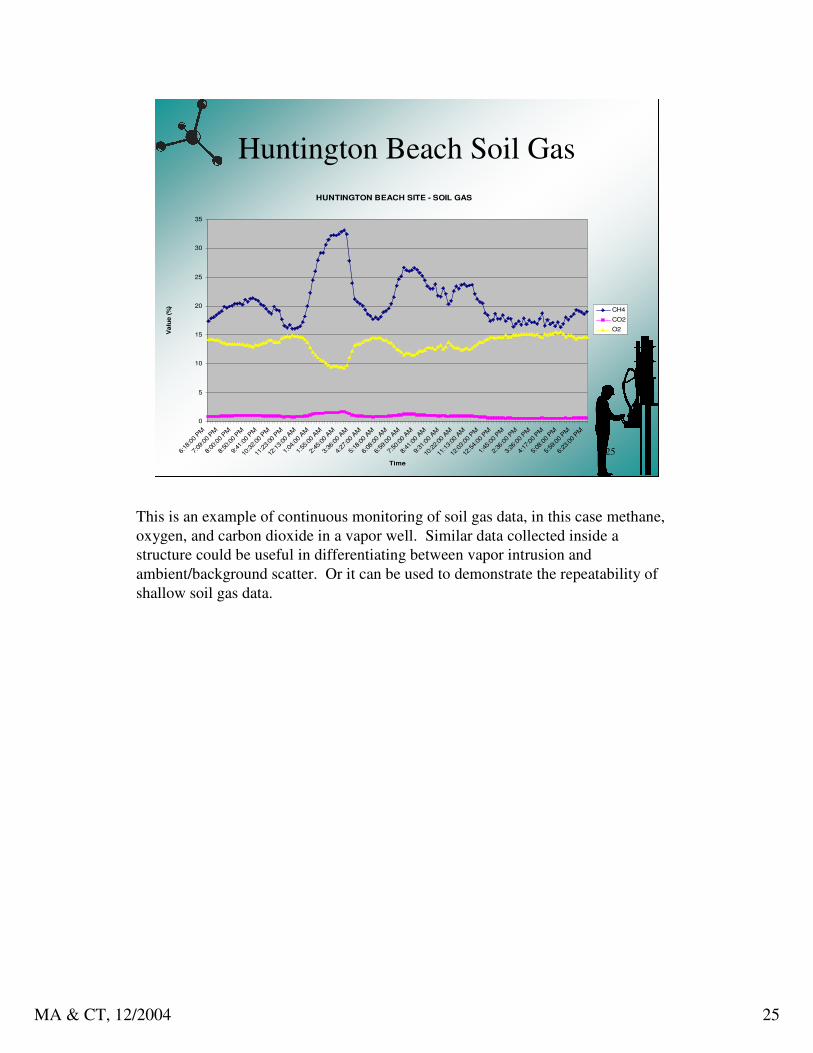
This is an example of continuous monitoring of soil gas data, in this case methane, oxygen, and carbon dioxide in a vapor well. Similar data collected inside a structure could be useful in differentiating between vapor intrusion and ambient/background scatter. Or it can be used to demonstrate the repeatability of shallow soil gas data.

MA & CT, 12/2004 26
26
COC Correlations in Redfield PreRemediation Indoor Air (w/o 3 TCE outliers)
TCE vs. 1,1,1-TCA1,1,1-TCA = 3.920 + 2.389 * TCE
Correlation: r = .301 (N=723)
TCE (ug/m3)
1,1,
1-TC
A (u
g/m
3)
-500
50100150200250300350400
-2 2 6 10 14 18 22 26
TCE vs. PCEPCE = 3.13 + .742 * TCE
Correlation: r = .227 (N=723)
TCE (ug/m3)
PC
E (u
g/m
3)
-200
20406080
100120140160
-2 2 6 10 14 18 22 26
Regression95% confid.
TCE vs. 1,1-DCE1,1-DCE = -.049 + 3.977 * TCECorrelation: r = .694 (N=723)
TCE (ug/m3)
1,1-
DC
E (u
g/m
3)
-200
20406080
100120140160
-2 2 6 10 14 18 22 26
These plots are indoor air data from the Redfield, CO site. The large data set allows trends in the data to be recognized and forensic approaches to be successful. This would not be possible with only a handful of data points.
(Slide compliments of David Folkes of Envirogroup)

MA & CT, 12/2004 27
27
• VI Risk Pathway the Hot Ticket• Active Soil Gas Data Preferred Method• VI Requires More Careful Techniques • Real-Time Data Eliminates Prozac Moments• 8260 and TO14/15 Give OK Results• Bio of HCs a Happening Thing• Near-slab Data Fine in Many Cases
Conclusions/Summary

MA & CT, 12/2004 28
28
Existing Documents & Training• Overview of SV Methods
– LustLine Article on Active Soil Gas Method, 2002– LustLine Article on Flux Chamber Method, 2003– LustLine Part 3 – FAQs, November 2004
• Regulatory Guidance– CA-EPA Collections/Analytical Protocols– CA-EPA (DTSC) Vapor Intrusion Document– San Diego County Collection/Analytical Protocols
Available at www.HandPmg.com
A summary of existing documents and training on the VI pathway and soil gas methods can be found at these locations:
MA & CT, 12/2004 29
29
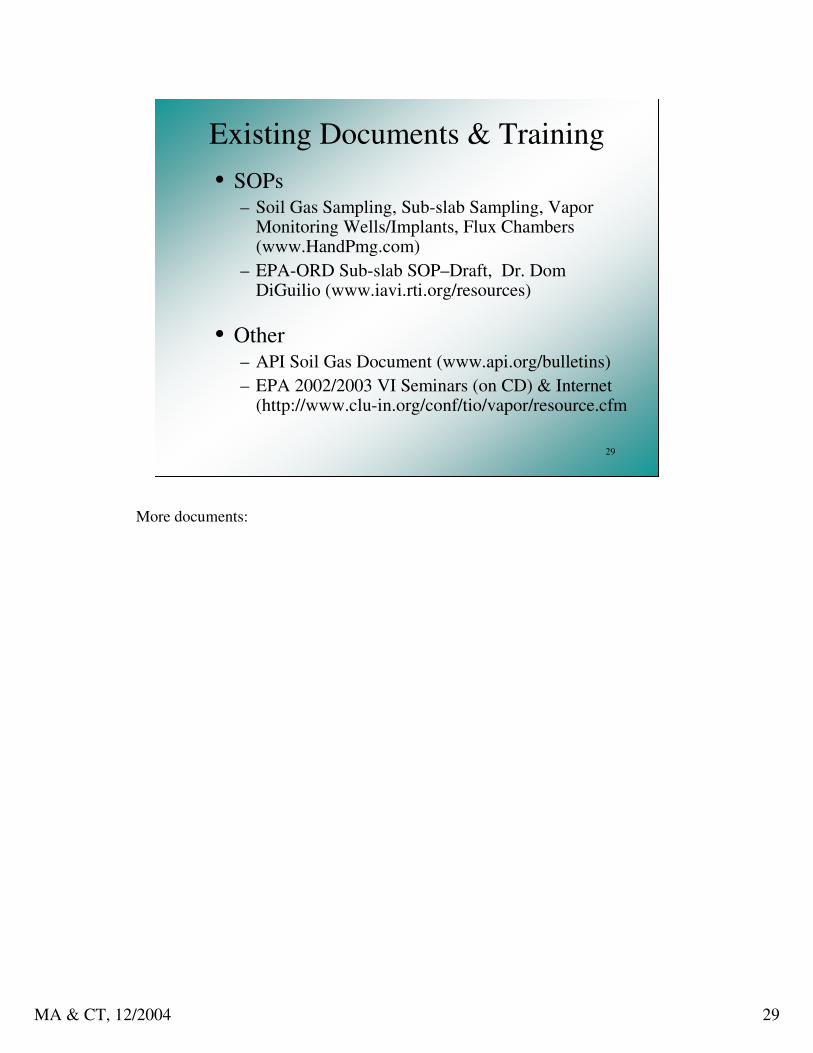
Existing Documents & Training• SOPs
– Soil Gas Sampling, Sub-slab Sampling, Vapor Monitoring Wells/Implants, Flux Chambers (www.HandPmg.com)
– EPA-ORD Sub-slab SOP–Draft, Dr. Dom DiGuilio (www.iavi.rti.org/resources)
• Other – API Soil Gas Document (www.api.org/bulletins)– EPA 2002/2003 VI Seminars (on CD) & Internet
(http://www.clu-in.org/conf/tio/vapor/resource.cfm
More documents:

MA & CT, 12/2004 30
30
Blayne Hartman, Ph.D.432 N. Cedros Avenue
Solana Beach, CA 92075(800) 834-9888
www.HandPmg.com