soil bulk density analysis in three dimensions by computed tomographic scanning1
TRANSCRIPT
SOIL SCIENCE SOCIETY OF AMERICAJOURNAL
VOL. 46 MAY-JUNE 1982 No. 3
DIVISION S-l—SOIL PHYSICS
Soil Bulk Density Analysis in Three Dimensions by Computed Tomographic Scanning1
A. M. PETROVIC, J. E. SIEBERT, AND P. E. RiEKE2
ABSTRACTCurrent soil bulk densitometric techniques lack the precision to
detect three-dimensional changes in density in a nondestructive man-ner. The x-ray transmission computed tomography (CT) scanner wasevaluated as a tool to determine soil bulk density. This scanner is anadvanced tool in diagnostic radiology used to obtain a nondestructivecross-sectional representation of the human body. Typical accuracyand precision for CT scanners are known for materials like humantissue with a linear attenuation coefficient near water. Machine re-sponse was evaluated near the upper limit of the measurement rangewhere denser materials, such as soil, are located.
Scanner analyses of soil and glass bead-air filled sphere samplesthat varied in bulk density from 0.14 to 1.64 g/cm3 revealed that apositive linear response occurred with increasing density. For theMetea sandy loam soil (Arenic Hapludalfs), this CT scanner wasfound to have precision in the order of 19 mg/cm3. Spatial resolutionor the ability to distinguish between two objects in the scanning planewas found to range from 1.25 by 1.25 by 2 mm3 to 6.4 mm in diameterby 2 mm. The greater resolution was obtained when density withinthe sample varied greatly. Errors in data can occur as a result ofcertain machine artifacts; however, many of these can be avoided byrelatively simple methods.
It was concluded that the CT scanner can be used to determinesoil bulk density with good three-dimensional spatial resolution. Thisis a potentially promising tool for research in the areas of compaction,soil management, and cultivation.
Additional Index Words: gamma ray densitometry, soil bulk den-sitometry, computed tomography (CT), compaction.
Petrovic, A. M., J. E. Siebert, and P. E. Rieke. 1982. Soil bulkdensity analysis in three dimensions by computer tomographic scan-ning. Soil Sci. Soc. Am. J. 46:445-450.
BULK density is widely used to characterize soilcompaction phenomena. The inability to detect
small zones of drastically changing bulk density withina profile (spatial resolution) persists as the principallimitation of soil densitometry. This is important sinceeven a thin layer of very dense soil can vastly alterthe hydraulic and thermal conductivities and gas ex-change properties of the entire soil profile.
Current methods of determining soil bulk densityinclude direct sampling by extraction of soil cores (18)or clods (1); in situ radiation methods such as singlebeam (27) and dual beam (5) gamma ray attenuationmeasurements; neutron scattering analyses (9); and,to a lesser extent, by the analyses of shear and com-pressional wave propagation through column samples(24). Values obtained with cores or clods representthe gross average density of the sample and give littleor no information concerning internal variation. Ra-diation techniques have improved on one-dimensionaldetection of bulk density variations in the range of 0.5mm (8). Resolution in orthogonal directions, however,is several centimeters. In addition, small errors canoccur in gamma ray densitometry if density within thebeam path is not homogenous or if it fluctuates in anonlinear fashion (21).
The field of diagnostic radiology has been faced witha similar problem in attempting to obtain accurate,nondestructive three-dimensional internal represen-tations of the human body. With recent advances inx-ray physics, detector technology, and mathematicalreconstruction theory, the x-ray transmission com-puted tomographic (CT) scanner has emerged. Thefirst usable CT scanner system was developed in 1969by Hounsfield (15), and units became available com-mercially in 1972. The advantage of the CT scannerover other radiographic processes is that a cross sec-tion of linear attenuation coefficients OA) is obtainedwith a recordable radiation attenuation difference aslow as 0.1% and a two-dimensional resolution of 2mm2 or less. There are numerous extensive reviewarticles on the physics, mathematics, and design of
1 Contribution from the Dep. of Crop and Soil Sciences, MichiganState Univ., East Lansing, MI 48824. Mich. Agric. Exp. Stn. Jour.Article no. 9,914. This research was supported in part by grantsfrom the Golf Course Superintendents Association of America andthe Michigan Turfgrass Foundation. Received 13 July 1981. Ap-proved 26 Jan. 1982.
2 Former Graduate Research Assistant, now Assistant Professor,Dep. of Floriculture and Ornamental Horticulture, Cornell Uni-versity; Chief Engineer, Dep. of Radiology; and Professor, Dep.of Crop and Soil Sciences, respectively.
445
446 SOIL SCI. SOC. AM. J . , VOL. 46, 1982
different CT scanners with extensive bibliographiessuch as Brooks and DiChiro (2, 3), McCullough (19),McCullough and Payne (20), Swindell and Barrett (25),and Ter-Pogossian et al. (26).
Current CT scanner designs are focused on themedical imaging application of body tissues. Hence,instrument performance has been optimized for x-rayabsorptions near that of water [/u = 0.191 cm"1 at x-ray tube voltage of 120 peak kilovolts (kVp) (19)]. Thetypical ju, for materials like soil, such as concrete [/u,= 0.346 cm"1 125 kVp x-ray tube voltage (13)], how-ever, lies near the upper measurement range of theinstrument where less is known about the instrument'sprecision.
The objectives of the research reported here are toinvestigate the precision, linearity, spatial resolution,and limitations of the CT scanner for determinationof soil bulk density.
Presently, studies are underway to determine otherapplications of CT scanning for soil scientists. Three-dimensional measurements of soil moisture by CTscanning has yielded inconsistent results. However,this type of application appears to be very promisingpotentially and of great value in soil physics research.
MATERIALS AND METHODSInstrumentation
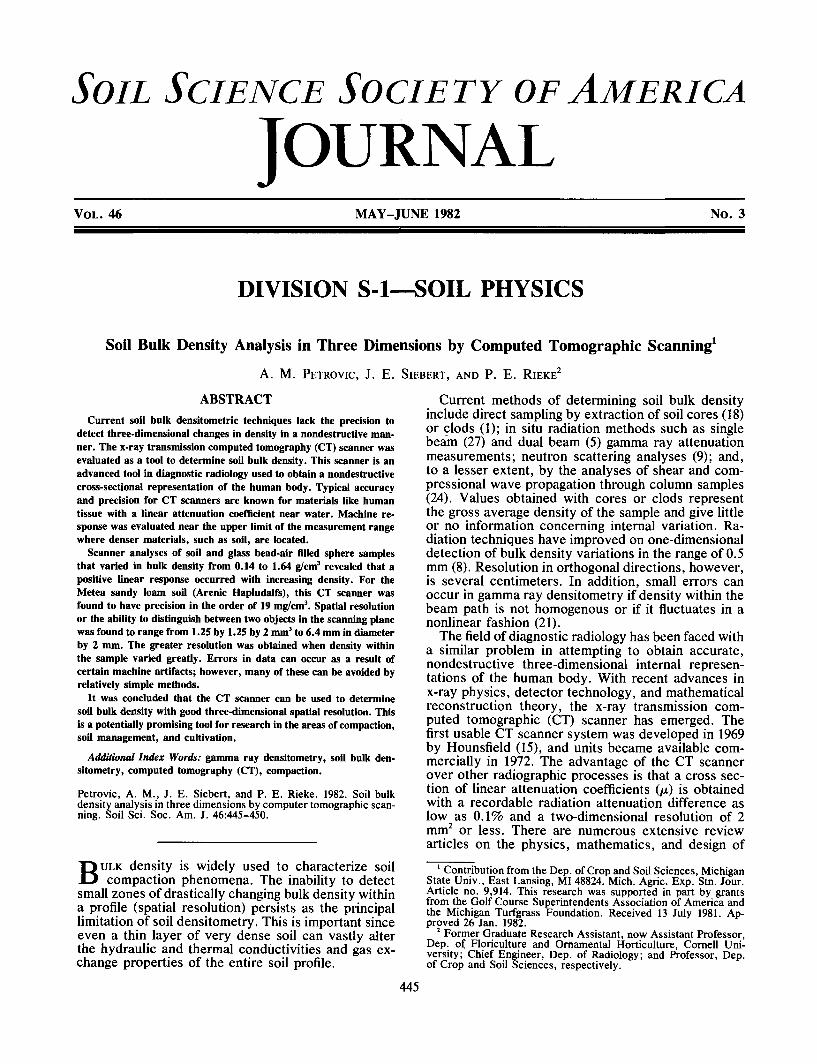
An American Science and Engineering, Inc. CT Scanner®housed at the Michigan State University Clinical Center wasused for these studies. This scanner is a fourth-generationtype which employs a divergent x-ray fan beam that rotatesinside the stationary ring of 600 scintillation detectors par-tially shown in Fig. 1. The beam is collimated to form a 50°sector with a variable thickness of 2 to 10 mm. Bismuthgerminate scintillation detectors are spaced at 0.6° intervalsaround the beam path. During a scan, the x-ray source (arotating tungsten anode medical x-ray tube) travels a 360-degree circular path within the detector ring. Each detectorperforms 1,200 attenuation measurements while illuminatedby the x-ray source. Either 6- or 12-second scan times maybe selected. For detailed CT scanner operation, see reviewarticles cited above. Current CT scanners cost about onemillion dollars.
A two-dimensional mapping of absorption values into a512 by 512 element array [fj.(x, y)] is reconstructed from theprojection data acquired during a scan. The array is graph-ically displayed as an image on a high resolution cathoderay tube monitor (see Fig. 4). As in most current commercial
CT scanners, a reconstruction algorithm, called the con-volution method or filtered-backprojection, generates theju,(;t, y) (4, 14). Image reconstruction utilizes a specializedextensive computer system to produce the resultant arrayin about 60 seconds.
Depending upon the selected mathematical scaling, theeffective size of the 512 by 512 matrix of picture elements(pixels) comprising the image range from 0.25 to 1.00 mm2
area in the actual scanning plane. Hence, an individual pixelvalue can represent the absorption value of a volume ele-ment from 0.25 by 0.25 by 2 mm3 up to 1 by 1 by 10 mm3.Objects up to 50 cm in diameter can be imaged.
As displayed, the brightness of a pixel is proportional toits numerical value [ju,(jt, y)]: the larger the p(x, y) value,the brighter the pixel. To portray the array effectively, theoperator interactively selects the mean value (window level)and the range (window width) of absorption values. Severalsoftware features assist the operator in printing out or plot-ting the numerical pixel values within interactively selectedrectangular areas. This rectangular area is called a cursor.The size and location of the cursor can be controlled. Av-erage pixel values and standard deviations are available in-stantly by cursor manipulation.
The instrument output is not in the conventional ju. unitsof cm'1 but rather in an internationally standardized numberscale known as Hounsfield units (H). Since the output frommost CT scanners is in Hounsfield units, all data shown willbe in H units. The linear scale is denned by two points: theabsorption values of air and water being - 1,OOOH and 0 H,respectively. Each H unit represents about a 0.1% changein the attenuation coefficient (/a).
Machine Response StudiesResponse characteristics evaluated were as follows: Lin-
earity in response vs. density changes for Hounsfield unitsranging from —800 H to +800 H; spatial resolution; andbeam hardening effect as influenced by sample size anddensity.
Samples of various proportions of glass beads and hollowair-filled spheres were used to study the linearity of scannerresponse with variations in bulk density. Aluminum cylin-ders 7.36 cm i.d. by 12.5 cm in depth with a side wallthickness of 1.3 mm were filled with mixtures of glass beads0.2 mm in diameter (Ballontini® impact beads, Potter In-dustries, Inc.) and glass bubbles 0.1 mm in diameter (Mi-crospheres®, 3M, Inc.) to attain bulk densities of 0.14, 0.80,1.00, 1.21, 1.32, and 1.55g/cm3. To facilitate uniform mixing,a small amount of distilled water was added to each mixture.
800 -
c
T3•5
1
-400 •
-800
0.4 0.6 0.8 tO 12 1.4 1.34 1.42 150 158
Fig. 1—Photograph of CT scanner showing the exposed ring of de-tectors and x-ray source.
1.6 1.26
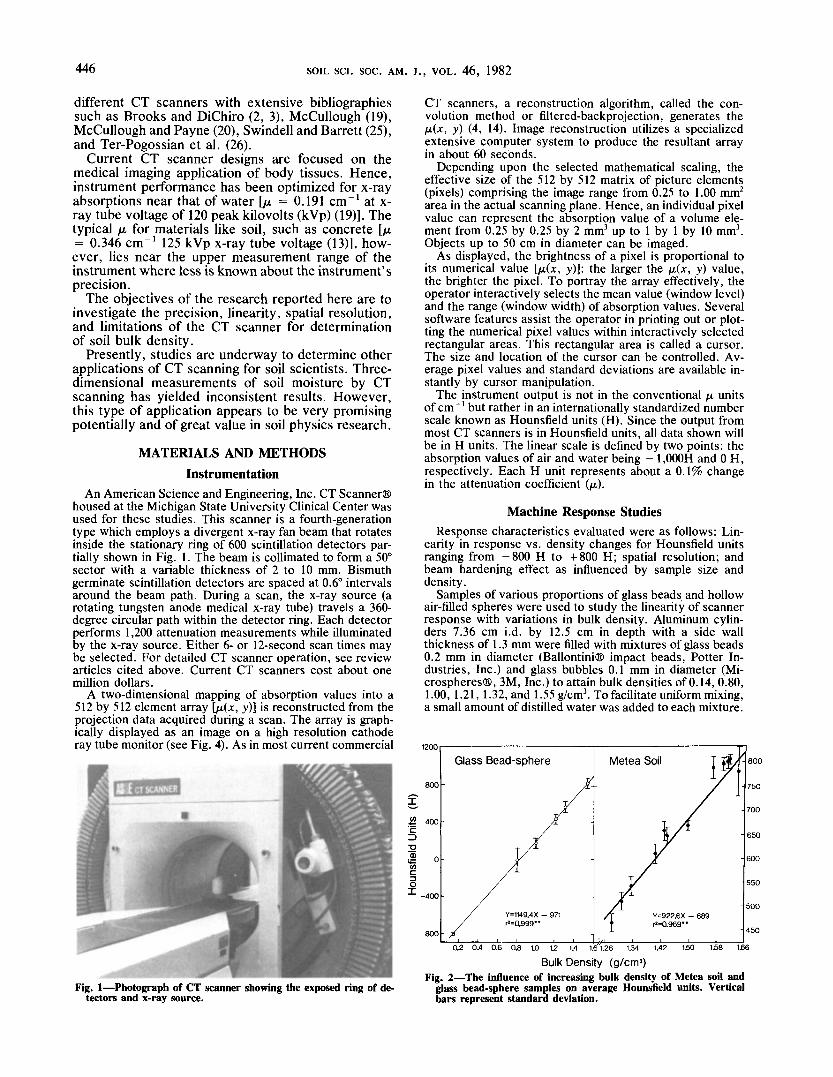
Bulk Density (g/cm3)Fig. 2—The influence of increasing bulk density of Metea soil and
glass bead-sphere samples on average Hounsfield units. Verticalbars represent standard deviation.
PETROVIC ET AL.: SOIL BULK DENSITY ANALYSIS IN THREE DIMENSIONS BY CT SCANNING 447
Each sample was allowed to air dry, then scanned in twoorientations and results averaged.
Spatial resolution is the ability to distinguish two objectscontained in the zone of analysis. Objects that differ greatlyin /A (high contrast) and objects that only vary slightly (lowcontrast) were used to determine the spatial resolving powerof this scanner.
High-contrast spatial resolution was examined by a testprocedure devised by an American Association of Physicistsin Medicine (AAPM) for CT scanners (16). The test consistsof scanning a 15-cm diameter acrylic cylinder containing apattern of air-filled square holes with side dimensions of0.75, 1.00, 1.25, 1.50, 1.75, 2.00, and 2.50 mm. Distancebetween holes was the same as the hole width for a givensize. The acrylic block was centered in a 21.5-cm diameteracrylic water tank.
Low contrast resolution was determined from a samplethat contained holes that had a 1% difference in ja(or 10 Hunits) from the surrounding material. A 21.5-cm diameteracrylic cylinder, with holes of 3.2, 6.4, 9.5, 12.7, 19.1, and25.4 cm in diameter filled with a fluid containing 50% giyc-erol and 50% propanol, was scanned.
Beam hardening or spectral shift is a phenomenon inwhich unequal filtration of the polychromatic x-ray beamoccurs as the beam penetrates a sample. Photons of lowerenergy are more readily absorbed than higher energy pho-tons by photoelectric interactions as they pass through ma-terial. So as an x-ray beam passes through, it "hardens,"becoming higher in effective photon energy. Attempts canbe made physically and mathematically (7, 17) to correctfor this phenomenon; however, beam hardening artifacts dooccur under certain conditions. The degree of beam hard-ening is related to the size, density, and atomic number ofthe sample. Two acrylic cylinders with diameters of 21.5and 30.5 cm were filled with water and used to demonstratethe effect of size on this type of artifact.
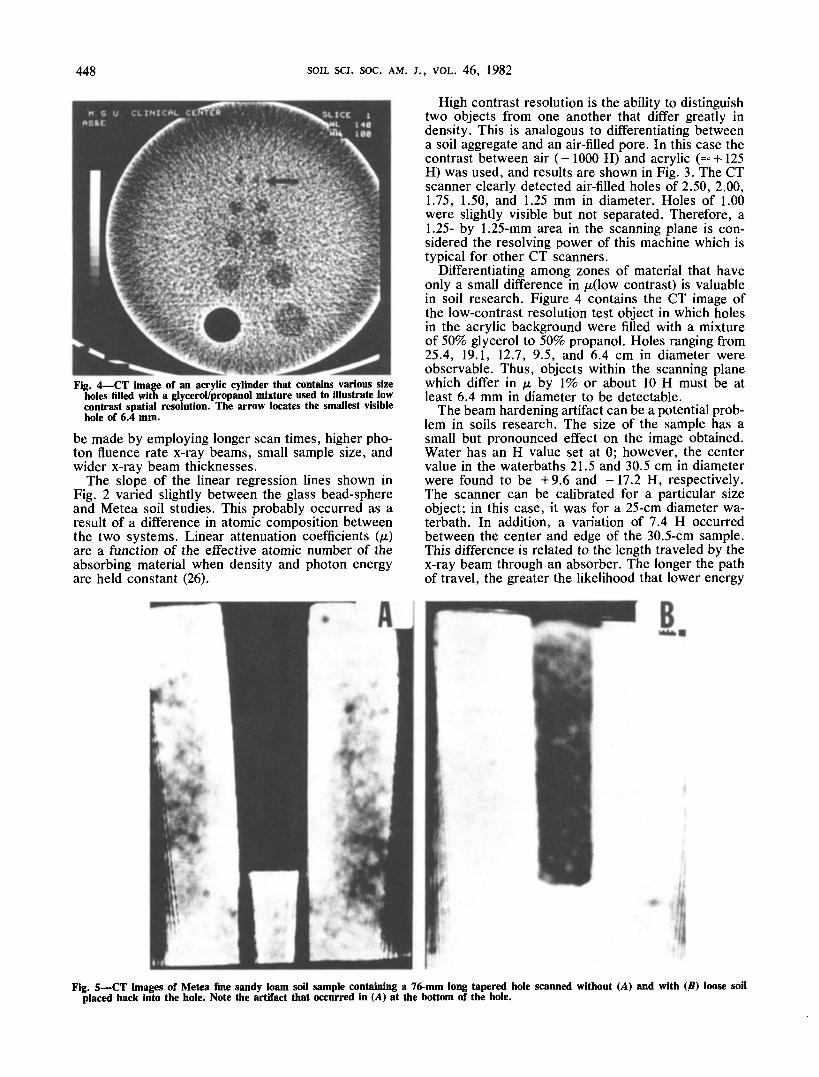
Zones of drastically changing density can also cause ar-tifacts. A topsoil sample of Metea fine sandy loam soil(loamy, mixed, mesic Arenic Hapludalf; see next sectionon soil preparation) was placed in a 7.36-cm i.d. by 12.5-cm long aluminum cylinder. A slightly tapered hole, 76 mmin length with an upper diameter of 18 mm and bottomdiameter of 16 mm, was made in the sample. The samplewas scanned and then rescanned after refilling the hole withloosely packed soil. To determine the effects of stones onmeasurement of density of the adjacent soil, three stonesvarying in size were placed in aluminum cylinders containingwater and glass beads and were then scanned.
Soil StudiesTo evaluate CT scanner response to a soil, samples col-
lected from the Ap horizon of a Metea fine sandy loam wereprepared and scanned. The first experiment involved scan-ning 12 samples of known average bulk densities rangingfrom 1.29 to 1.64 g/cm3 and obtaining the mean absorptionvalue (H) over the sample cross section. The soil, at amoisture content of 6.0 to 7.5% by weight, was passedthrough a 1.00-mm sieve and packed into 3.2-cm i.d. by 4-cm high acrylic cylinders. Samples were oven-dried at 105°Cfor at least 24 hours prior to scanning.
The CT scanner was calibrated for a 21.5 cm in diameteracrylic waterbath which set H for water at 0 ± 5 H. A water-filled aluminum cylinder used in these studies also had amean H value for water of 5 H. All samples were scannedwith the x-ray source operated at 125 keV and 30 mA. A12-second scanning mode was employed with a nominal 10-mm wide x-ray beam.
RESULTS AND DISCUSSIONMachine Response
Understanding the performance of the CT scannerin the range of Hounsfield units (H) > + 400 has notbeen well documented (16). As seen in Fig. 2, the CTscanner's response to increasing density in the glassbead-sphere samples was linear. Each unit rise in bulkdensity (mg/cm3) corresponded to a 1.15-H increase.Scanner analysis of Metea soil samples (Fig. 2) alsorevealed that the machine responded in a linear fash-ion to changing density.
The standard deviations found in Fig. 2 were usedto explain the density resolving power of the CT scan-ner for soil. Standard deviations (cr) of the Metea soilsamples ranged from 9 to 50 H, with most being about20 H. In contrast, the measurement of a uniform fieldof tap water yielded a value for a- of 3.5 H. Hence,the variation in the density and/or composition ofthese carefully prepared soil samples dominated overthe variation of the measurement technique. A changein soil density of 18.5 mg/cm3 would cause a 20-Hchange in absorption which is considered the lowerlimit of density resolution with this machine for theMetea soil. Improvements in density resolution can
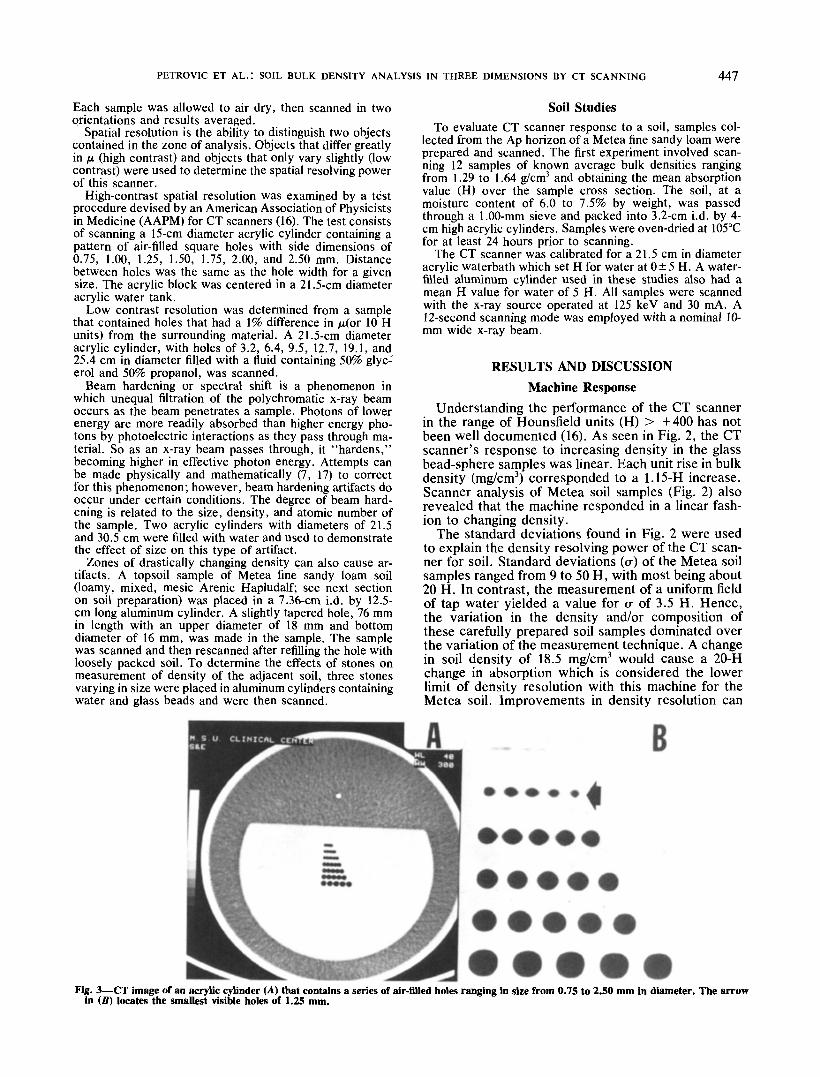
fig. 3—CT image of an acrylic cylinder (A) that contains a series of air-filled holes ranging in size from 0.75 to 2.50 mm in diameter. The arrowin (B) locates the smallest visible holes of 1.25 mm.
448 SOIL SCI. SOC. AM. J., VOL. 46, 1982
Fig. 4—CT image of an acrylic cylinder that contains various sizeholes filled with a glycerol/propanol mixture used to illustrate lowcontrast spatial resolution. The arrow locates the smallest visiblehole of 6.4 mm.
be made by employing longer scan times, higher pho-ton fluence rate x-ray beams, small sample size, andwider x-ray beam thicknesses.
The slope of the linear regression lines shown inFig. 2 varied slightly between the glass bead-sphereand Metea soil studies. This probably occurred as aresult of a difference in atomic composition betweenthe two systems. Linear attenuation coefficients (pi)are a function of the effective atomic number of theabsorbing material when density and photon energyare held constant (26).
High contrast resolution is the ability to distinguishtwo objects from one another that differ greatly indensity. This is analogous to differentiating betweena soil aggregate and an air-filled pore. In this case thecontrast between air (- 1000 H) and acrylic (== +125H) was used, and results are shown in Fig. 3. The CTscanner clearly detected air-filled holes of 2.50, 2.00,1.75, 1.50, and 1.25 mm in diameter. Holes of 1.00were slightly visible but not separated. Therefore, a1.25- by 1.25-mm area in the scanning plane is con-sidered the resolving power of this machine which istypical for other CT scanners.
Differentiating among zones of material that haveonly a small difference in /u,(low contrast) is valuablein soil research. Figure 4 contains the CT image ofthe low-contrast resolution test object in which holesin the acrylic background were filled with a mixtureof 50% glycerol to 50% propanol. Holes ranging from25.4, 19.1, 12.7, 9.5, and 6.4 cm in diameter wereobservable. Thus, objects within the scanning planewhich differ in pi by 1% or about 10 H must be atleast 6.4 mm in diameter to be detectable.
The beam hardening artifact can be a potential prob-lem in soils research. The size of the sample has asmall but pronounced effect on the image obtained.Water has an H value set at 0; however, the centervalue in the waterbaths 21.5 and 30.5 cm in diameterwere found to be +9.6 and -17.2 H, respectively.The scanner can be calibrated for a particular sizeobject; in this case, it was for a 25-cm diameter wa-terbath. In addition, a variation of 7.4 H occurredbetween the center and edge of the 30.5-cm sample.This difference is related to the length traveled by thex-ray beam through an absorber. The longer the pathof travel, the greater the likelihood that lower energy
Fig. 5—CT images of Metea fine sandy loam soil sample containing a 76-mm long tapered hole scanned without (A) and with (B) loose soilplaced back into the hole. Note the artifact that occurred in (A) at the bottom of the hole.
PETROVIC ET AL.: SOIL BULK DENSITY ANALYSIS IN THREE DIMENSIONS BY CT SCANNING 449
photons will be absorbed which will increase the ef-fective energy of the beam. This artifact is likely tooccur in soil bulk density analysis in which the centerof the sample will tend to have a slightly lower Hvalue than the edges. This difference should be ofminor importance; however, whenever possible, usesmaller diameter samples to minimize this artifact.
In experiments involving comparisons of CT im-ages, the size and composition of the sample containershould be standardized to avoid an artifact of thisnature. Errors introduced by the container can bereadily seen by scanning it filled with a uniform mediasuch as water.
A zone of drastically changing density, such as anair-filled hole or stone in soil, can cause the destruc-tion of information due to beam hardening and math-ematical anomalies. In the example where a longstraight zone containing a large density gradient (Fig.5A), lines or streaks developed in the plane of sym-metry at the density gradient interface. Filling the air-filled hole with loose uncompacted soil eliminated thestreaks at the bottom of the hole (Fig. 5B). The sizeof hole required to cause this type of artifact willdepend mainly on the density differential at the in-terface and the CT scanner used. Many CT scannersare better able to compensate for this artifact thanothers.
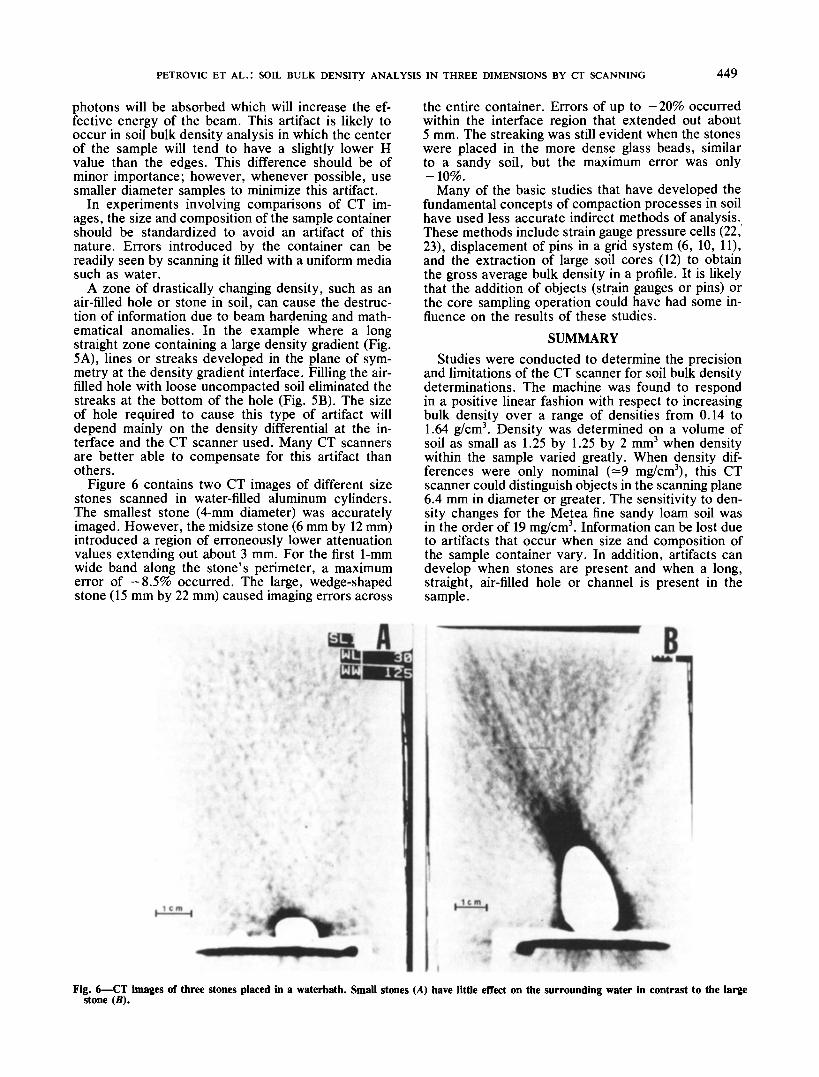
Figure 6 contains two CT images of different sizestones scanned in water-filled aluminum cylinders.The smallest stone (4-mm diameter) was accuratelyimaged. However, the midsize stone (6 mm by 12 mm)introduced a region of erroneously lower attenuationvalues extending out about 3 mm. For the first 1-mmwide band along the stone's perimeter, a maximumerror of -8.5% occurred. The large, wedge-shapedstone (15 mm by 22 mm) caused imaging errors across
the entire container. Errors of up to - 20% occurredwithin the interface region that extended out about5 mm. The streaking was still evident when the stoneswere placed in the more dense glass beads, similarto a sandy soil, but the maximum error was only-10%.
Many of the basic studies that have developed thefundamental concepts of compaction processes in soilhave used less accurate indirect methods of analysis.These methods include strain gauge pressure cells (22,23), displacement of pins in a grid system (6, 10, 11),and the extraction of large soil cores (12) to obtainthe gross average bulk density in a profile. It is likelythat the addition of objects (strain gauges or pins) orthe core sampling operation could have had some in-fluence on the results of these studies.
SUMMARYStudies were conducted to determine the precision
and limitations of the CT scanner for soil bulk densitydeterminations. The machine was found to respondin a positive linear fashion with respect to increasingbulk density over a range of densities from 0.14 to1.64 g/cm3. Density was determined on a volume ofsoil as small as 1.25 by 1.25 by 2 mm3 when densitywithin the sample varied greatly. When density dif-ferences were only nominal (—9 mg/cm3), this CTscanner could distinguish objects in the scanning plane6.4 mm in diameter or greater. The sensitivity to den-sity changes for the Metea fine sandy loam soil wasin the order of 19 mg/cm3. Information can be lost dueto artifacts that occur when size and composition ofthe sample container vary. In addition, artifacts candevelop when stones are present and when a long,straight, air-filled hole or channel is present in thesample.
Fig. 6—CT images of three stones placed in a waterbath. Small stones (A) have little effect on the surrounding water in contrast to the largestone (B).
450 SOIL SCI. SOC. AM. J. , VOL. 46, 1982
It is likely that soil science researchers will be un-able to purchase a CT scanner because of its highcost. However, most major hospitals and many uni-versity medical centers have CT scanners which mightbe available for research.
Having the technology to accurately measure spatialvariation in bulk density nondestructively for a volumeof soil as large as 500 by 500 by 10 mm3 to as smallas 1.25 by 1.25 by 2 mm3 will be a valuable tool forresearchers in the field of soil science.