soil aggregate abrasion by impacting sand and … soil... · soil aggregate abrasion by impacting...
TRANSCRIPT
Soil Aggregate Abrasion by Impacting Sand and Soil Particles
L. J. Hagen ASSOC. MEMBER
ASAE
ABSTRACT
DURING wind erosion, erodible particles (< 0.85 mm diameter) are removed continually in saltation and
suspension, but the supply of particles is rarely exhausted because new erodible-size particles are created constantly by abrasion. Little is known about the physics of soil abrasion, however. This study was undertaken to determine the effects of particle speed, size, impact angle, and stability on the abrasive erosion (W) of soil aggregates of various stabilities. A calibrated sandblasting device was used to abrade individual aggregates with weighed amounts of abrader in an enclosed chamber and the weight of soil abraded from the aggregates was determined. Regression equations relating aggregate abrasion to the experimental variables were then developed.
Sand abrader produced higher values of W than soil abrader. W also increased as a power of particle velocity. The power was near 2.0 for fragile aggregates and ranged from 1.5 to 2.3 for the most stable aggregates tested. The W of all aggregates decreased nonlinearly as aggregate stability increased. The largest W occurred at impact angles of 20 to 30 deg, and a small increase in W occurred as average particle diameter increased from 125 to 715 /um.
INTRODUCTION
The wind erosion equation (Woodruff and Siddoway, 1965) is the primary tool used to predict wind erosion and to design wind erosion control practices. Currently, the percentage of surface soil aggregates > 0.84 mm diameter is used in the equation as a measure of field erodibility. This measure indicates roughly the soil fraction that is readily available for wind erosion and the soil fraction that will resist erosion. However, this measure tells us little about the likely rates of abrasive breakdown once erosion begins. Yet on large, cloddy fields, abrasive breakdown is the source of most of the soil lost. For example, on a smooth field with 50% of the aggregates > 0.84 mm, the wind erosion equation predicts a loss < 2.0 T ha~iyr-i on a narrow field with little abrasion, but predicts a loss of 85 T ha~iyr-i on a wide field of the same cloddiness at Garden City, Kansas. In order to improve our ability to predict field erodibility, we must gain a better understanding of the influence of various factors on the abrasive breakdown of
Article was submitted for publication in July, 1983; reviewed and approved for publication by the Soil and Water Div. of ASAE in December, 1983. Presented as ASAE Paper No. 83-2075.
Contribution from the USDA-ARS, in cooperation with the Kansas Agricultural Experiment Station. Dept. of Agronomy contribution 83-187-J.
The author is: L. J. HAGEN, Agricultural Engineering, USDA-ARS, Kansas State University, Manhattan.
soil aggregates. The objective of this study was to determine the influence of particle velocity, size, impact angle, and stability on the abrasive erosion of soil aggregates.
REVIEW OF LITERATURE
There has been little careful experimentation on the abrasive erosion of soil aggregates and most of the information on abrasion has been developed from tests on homogeneous, brittle materials. In his book "Crushing and Grinding," Lowrison (1974) stated "abrasion cannot generally be defined and it is necessary to use clearly defined tests which allow results on the same material to be reproduced; clearly, the closer these tests are to the circumstances in which abrasion is to be predicted, the better."
Abrasive erosion (W) is usually reported as mass of material removed from the target per unit mass of impinging particles. We will first review how individual variables affect abrasive erosion as shown by experiments and then consider possible theoretical approaches to the problem.
For a given target and abrader (p), abrasive erosion is often described as
w - f ( v / , d / a) [1]
where V is particle velocity, d is particle diameter, a is angle of impact, and c and b are constants.
In a review of the literature, Preece and Macmillan (1977) found that the exponent "c" ranged from 2.0 to 6.5. Chepil (1958) suggested that in soil abrasion the exponent should be 2. In early tests, Chepil (1946) blew an abrader at target soil cylinders on the wind tunnel floor. If we assume that particle speeds were proportional to the reported windspeeds, then Chepil's data show "c" varying from 0.88 to 6.24. Later, Chepil (1951) placed trays of clods on the wind tunnel floor and blew an abrader over them. In these tests, W usually decreased as velocity increased, thus making " c " negative in most cases. The latter results suggest that variations in length of jump and lateral distribution of the saltating particles occur in the tunnel, so that an independent measurement of " c " there would be difficult.
Most experimental observations are at V p » those occurring in wind erosion, although many of the same phenomena likely occur. For example, Tilly and Sage (1970) observed that there was a minimum size and speed combination at which abrasion began. When the small particles didn't break, the exponent "c" was near 2 and they concluded that fragmentation caused additional abrasion. Preece and Macmillan (1977)
1984—TRANSACTIONS of the ASAE 805
suggested that the reason for the decrease in W with particle size is that the effective flow stress of the material increases as the stressed volume decreases (i.e., the probability of a flaw in the stressed volume is less).
In reviewing the data on brittle materials, Engel (1976) concluded that W is maximum when a is near 90 deg. One would expect soil aggregates to behave like brittle materials, but there are no data on soils to verify this hypothesis. Data of Tilly and Sage (1970) show that soft particles cause larger W at a = 90 deg than do hard particles. The increase in W may be caused by fragmentation. They also found that there was a linear relationship between quartz content and W caused by soil particles abrading compressor blades.
In considering various targets, Preece and Macmillan (1977) stated that there was no simple procedure to establish the solid particle resistance of a target. However, we know that in soils, abrasion resistance varies widely. Chepil (1958) reported that abrasion resistance varied directly with mechanical stability as measured by sieving. Unfortunately, sieving is not a very sensitive indicator of abrasion resistance; in Chepil's data, the mechanical stability of aggregates decreased about 5 percent for a fivefold increase in the abrasion rate. Chepil (1951) also found that abrasion resistance varied directly with fineness of soil texture.
Engel (1976) has reported a theoretical solution to the brittle abrasion problem. In its simplest approximate form for spheres, the result was:
TOP V I E W
W ~ E^ '^ „3 iU/M-2y 2.4M/M~2
K' R- [2]
where E is modulus of elasticity, 6^ is fracture stress in bending, R is particle radius, V is particle velocity, and ju is the flaw distribution parameter. Because of the difficulty in determining the parameters, this approach to calculating W appears more difficult than measuring W directly for soil aggregates.
A second approach has been to use dimensional analyses on all the possible variables and then form dimensionless TT-terms. Finally, regression analyses were applied to the data to determine the significance of the various rr-terms.
Another approach has been to apply regression analyses directly to the independent variables to form prediction equations for W. Because of the analytical difficulties posed by nonhomogeneous materials, the latter two approaches have been most successful.
EXPERMENTAL PROCEDURES
Soil samples of Haynie very fine sandy loam, Keith silt loam, and Wymore silty clay loam were collected from the surface of tilled fields and air-dried. The soil samples were then rotary sieved to separate the fractions to be used as targets and abrader. Local quartz, river sand was also washed and sieved for use as an abrading material. The three sieved size fractions used for abrader were 100 to 150, 290 to 420, and 590 to 840 / m in diameter. The target aggregates were generally larger than 4 cm in diameter, and one side was leveled with a knife to use for the impaction surface.
A commercial sandblasting nozzle was used to fire the particles at the target aggregates. Average particle velocity was determined by calibrating the nozzle using a modification of a method suggested by Ruff and Ives
I NOZZLE
J o -
il
PARTICLE CATCHER
CO-ROTATING DISKS
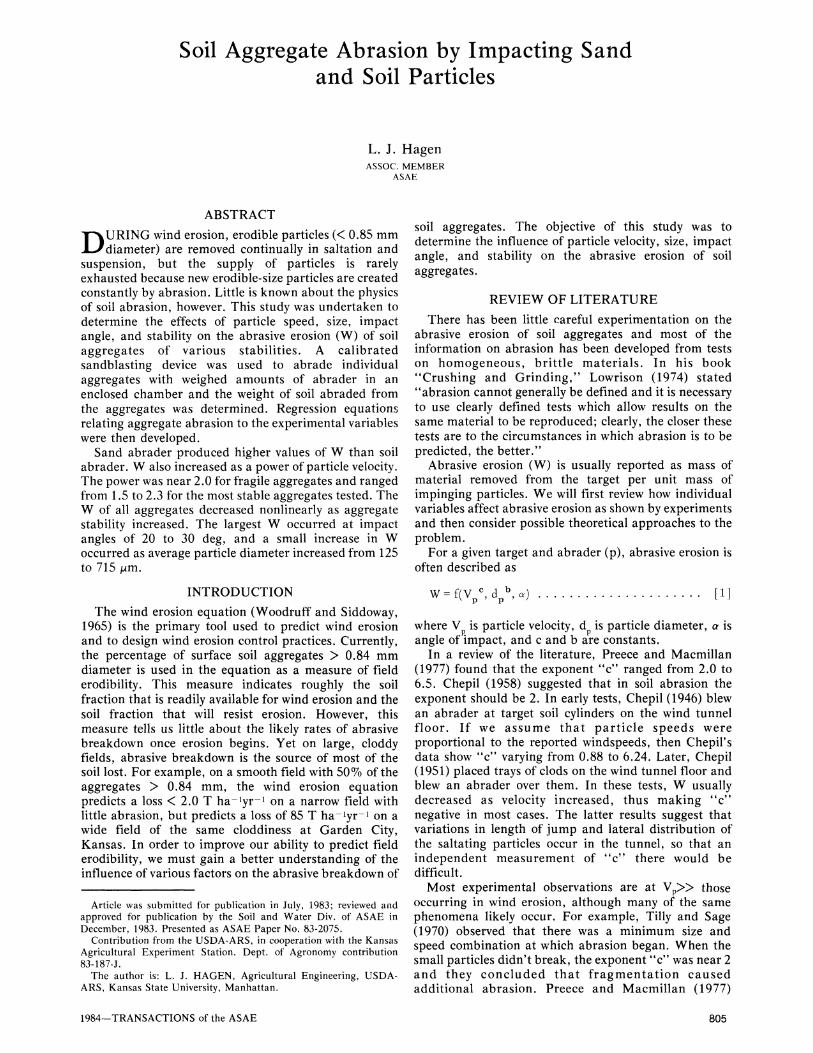
Fig. 1—Schematic diagram of appartus used to determine particle velocity as a function of nozzle air pressure.
(1975) and the apparatus illustrated in Fig. 1. The nozzle was positioned at a radius R from the center of two co-rotating disks. The disks were rotated at an angular velocity v, spaced a distance L apart, and each had a narrow slot offset from the other an arc length S. The v at which the maximum number of particles were caught after passing both slots corresponded to the average particle velocity (Vp) between the disks and was calculated from the equation
Vp = Ri L/S [3]
To maintain constant particle velocity during each calibration and abrasion test, a pressure regulator was used to provide constant air pressure to the nozzle and a vibratory feeder was used to provide a constant feed rate of 1.67 g/s of abrader. Wolak et al. (1977) have measured particle velocity as a function of radial position within a nozzle jet and found that particle velocity at the jet periphery was about 92% of the centerline particle velocity. Thus, particle velocity within the jet may be rather uniform.
In this study, four impact velocities (V ) were used for each abrader size. The various V were obtained by varying the air pressure, and they ranged from 4.0 to 12.0 m/s for the smallest particles to 3.0 to 9.0 m/s for the largest particles. These ranges of V would likely also occur in wind erosion events. Individual target aggregates were abraded with weighed amounts of abrader until about 2 to 6 g of soil was abraded from their surface. The soil abrader was always of the same texture as the target aggregate, while the sand abrader was used on targets of all textures. Three impact angles (a) of 15, 30, and 90 deg were obtained by changing the angle of the nozzle relative to the impact surface of the target.
After abrasion, each target aggregate was subjected to a drop test similar to that described by Farrell et al. (1967). The aggregates were dropped inside a tube onto a concrete floor from a height of 2 or 3 m and the resultant particle size distribution determined by sieving. Energy input to the aggregate was calculated from the drop height. New surface area created by the drop was calculated from the size distribution, assuming that the particles were spherical. The ratio of energy input to new surface area created was used as a measure of aggregate
806 TRANSACTIONS of the ASAE—1984
stability (SJ. Samples of the soil abrader also were impacted on a
steel plate mounted inside a particle sizing apparatus. New surface area created by the impact and kinetic energy at impact were calculated and ratios determined in a manner similar to the aggregate tests to provide a measure of soil particle stability (S ).
The data were analyzed using multiple regression on the following primary variables:
TABLE 2. ANALYSIS OF VARIANCE, STANDARD ERRORS OF THE VARIABLE COEFFICIENTS, AND PARTIAL F'S FOR
SAND ABRADER MODEL.
W = ffa, d , V , S ^ ' p ' P ' £
[4]
where a is angle of abrader impact in degrees, d is average particle diameter in /i m, V is average particle impact velocity in cm/s, S is aggregate stability in J/m^, and W is abrasive erosion in g/kg. Secondary variables constructed from the primary variables and their interactions also were added to the data set. In the analyses, there were 223 observations of aggregate abrasion using soil as the abrader and 296 observations using sand as the abrader.
RESULTS AND DISCUSSION
A number of multiple linear regression models were considered in the data analyses, and a transformation using natural logarithms was finally selected. For soil abrader, the best 7-variable model found using a stepwise regression procedure was
In W = - 7.84835 + (2.0568 + 0.00156 S^
-0.0000333 a^) in V^ + (-1.3557 + 0.0004612 d^
+ 0.011784 OL) In S - (0.067573 S ) In a [5]
The coefficient of multiple determination (R2) for this model was 0.78. All the independent variables were significant at the 0.01 or 0.02 level (Table 1). For sand abrader, the best 7-variable model was
TABLE 1. ANALYSIS OF VARIANCE, STANDARD ERRORS OF THE VARIABLE COEFFICIENTS,
AND PARTIAL F'S FOR SOIL ABRADER MODEL.
Source
Regression Error Total
Degrees of freedom Mean square
7 215 2 2 2
45 .72 0 .4195
Overall F
1 0 9 . 0 t
Variable
C n V p
S | (fin Vp)
a 2 (fin Vp)
finSa
dp (fin Sa)
oi (fin Sa)
Sa (fin OL)
* Significant at 0 .02 level, tSignif icant at 0 .01 level.
Standard error
0 .118987
0 .000475
0 .000003
0 .183242
0 .000159
0 .003017
0 .028650
Partial F
2 8 9 . 8 t
1 0 . 8 t
1 0 7 . 4 t
5 4 . 7 t
8 .3 t
1 5 . 3 t
5.56*
Source
Regression
Error
Total
Degrees of freedom Mean square
7
288
295
82 .859
0 .3281
Overall F
2 5 2 . 5 t
Variable
finVp
Sa (fin Vp)
OL (fin Vp)
fin Sa
dp (fin Sa)
Q;2 (fin Sa)
S | (fin a)
Standard error
0 .102648
0 .010581
0 .000274
0 .161456
0 .000117
0 .000013
0 .000784
Partial F
3 6 5 . 9 t
1 1 . 3 t
8 .8 t
8 .8 t
8 .0 t
1 4 3 . 6 t
1 5 . 2 t
tSignif icant at 0 .01 level.
In W = - 7.7424 + (1.9636-0.3555 S
+ 0.000811 Oi) In Vp + (-0.478857 + 0.000329 d^
0.000156 0:2) In S +(0.003054 8^^)^0:. [6]
The W for this model was 0.86. Again, all the independent variables were significant at 0.01 level (Table 2). Computer plots of the residuals of both models were examined and appeared to have a satisfactory behavior.
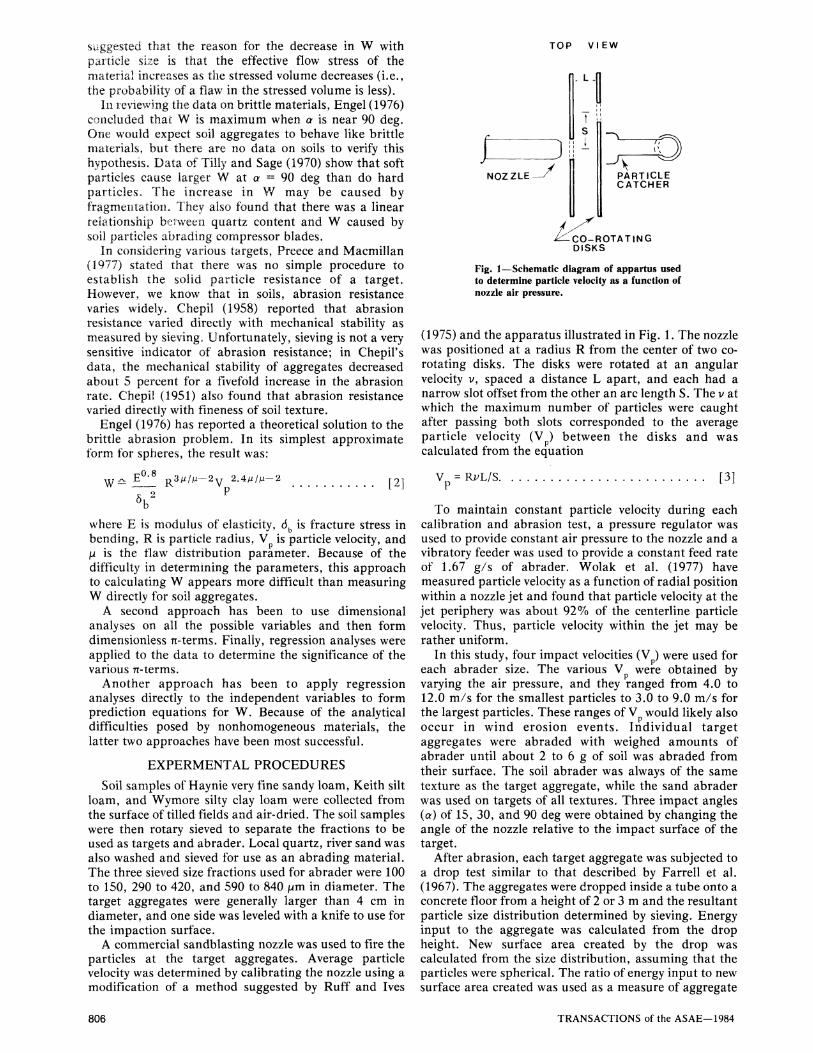
The data were analyzed in two groups based on the type of abrader, because soil and sand particles behave differently on impact. For example, fine sandy loam soil particles impacted at 90° on a steel plate exhibited an S directly proportional to Vp and inversely proportional to dp (Fig. 2). This complex behavior of Sp needs further investigation and could probably be used to reduce some of the unexplained variance in equation [5]. In contrast, Lowrison (1974) reported primary sand particles had an S of 894 J/m^ and thus would not break down significantly for the Vp used in this study. In general, the sand abrader produced larger W than the soil abrader.
-
-
-
1 1
/ •
/ /
/
/
1
/
^o
1
I -T
dp(pM)
• 100 - 150 o 290 - 420 A 5 9 0 - 8 4 0
-
1 1 1
0 4 8 12 16 18 20
Vp (M/S)
Fig. 2—Effect of particle velocity (V ) and diameter (d ) on particle stability (S ) of very fine sandy loam soil.
1984—TRANSACTIONS of the ASAE 807
t£ 60
^\ CURVE
\\ 2
A8RADER
SAND SOIL SAND SOIL
oC Vp dp
(DEG)(CM/S) (pM)" 15 600 355 15 600 355 90 600 355 90 600 355
1 1 ^ ^ ^ " — 1 ' '"1" ••" —•-• — — '
^ 60
^ 40
-
-
-
1
CURVE
1 2 3 4
2^
1
! ABRADER
SAND SOIL SAND SOIL
^"^-
1
So Vp dp
(J/M2)(CM/S)(MM)
2 600 355 2 600 355 10 600 355 10 600 355 -
•
^ ^
1 "="1
$ 40
6 8 So (J /M^
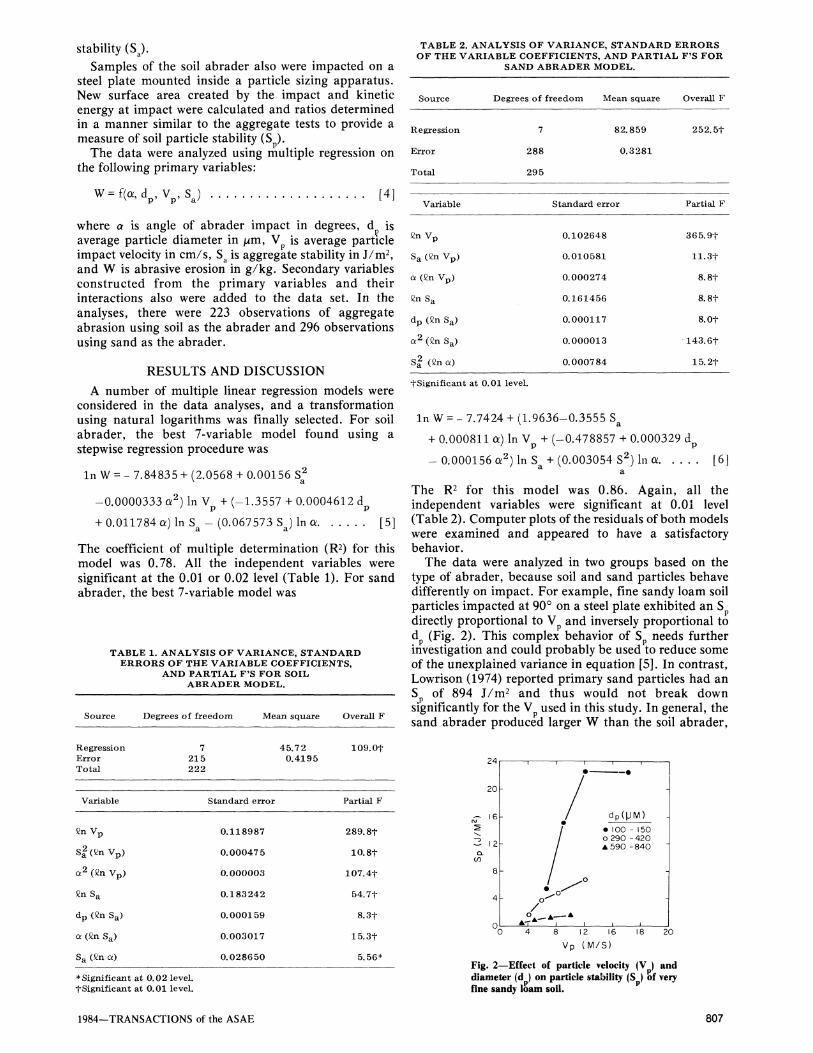
Fig. 3—Predicted aggregate abrasive erosion (W) as a function of aggregate stability (S ).
0 15 30 45 60 75 90 oL (DEG.)
Fig. 4—Predicted aggregate abrasive erosion (W) as a function of impact angle {a).
CURVE ABRADER So Vp dp
1 SAND 2 SAND 3 SAND 4 SAND 5 SAND 6 SAND
=1=^=X-
(J/M 2 2 2 10 10 10
^
2)(CM/S){PM) 600 7 1 5 600 355 600 125 600 715 600 355 600 125
Fig. 5—Predicted aggregate abrasive erosion (W) as a function of impact angle (a) for three diameters (d ) of sand abrader.
but on sandy soils, repeated impacts may cause the particles to become like the sand abrader and increase W.
To illustrate the effect of various independent variables on the dependent variable W, several plots of predicted results were made. Fig. 3 shows that as S increased from about 1 to 6 J/m^, there was a sharp drop in W, while beyond 6, W decreased slowly. Fragile, fine sandy loam aggregates with S of 0.5 J/m^ could be found in the field, but after a single rotary sieving, only aggregates with S about 0.75 J/m^ or more survived. However, the aggregates that survive sieving can possess a wide range of W, as shown in Fig. 3. Thus, there is a need for a simple, sensitive test for dry aggregate stability (or other property), which is highly correlated to W. Whether the drop test used here, the crushing index proposed by Skidmore and Powers (1982), or some other test should be selected is a subject of continuing research at our laboratory.
The effect of a on W is illustrated in Fig. 4. The largest W occurred at 30 deg for the sand abrader and 15 deg for the soil abrader. Because the nozzle produced too large an impact area, as of less than 15 deg were not tested. Tests on materials other than soil always show W decreasing as a approaches zero, however (Engel, 1976). The effect of a on W of the aggregates was unexpected because brittle mataerials usually exhibit the largest W at a of about 90 deg. In recent abrasion tests of rocks and other materials, Greeley et al. (1982) also found that natural materials often exhibit surprising combinations of brittle and ductile behavior. The results in Fig. 4 suggest that rough or ridged surfaces that promote large a may be more resistant to abrasion than smooth surfaces, particularly if the surface aggregates are fragile.
As dp increased, so did W for the aggregates; however, dp had less effect on W than a, S , or Vp (Fig. 5). There are two possible mechanisms that could cause W to increase with dp. First, as dp increased, the likelihood of the impact area containing a weak or flawed area also increased. Second, as dp increased, the maximum impact stress during each impact also increased, as described by Engel (1976).
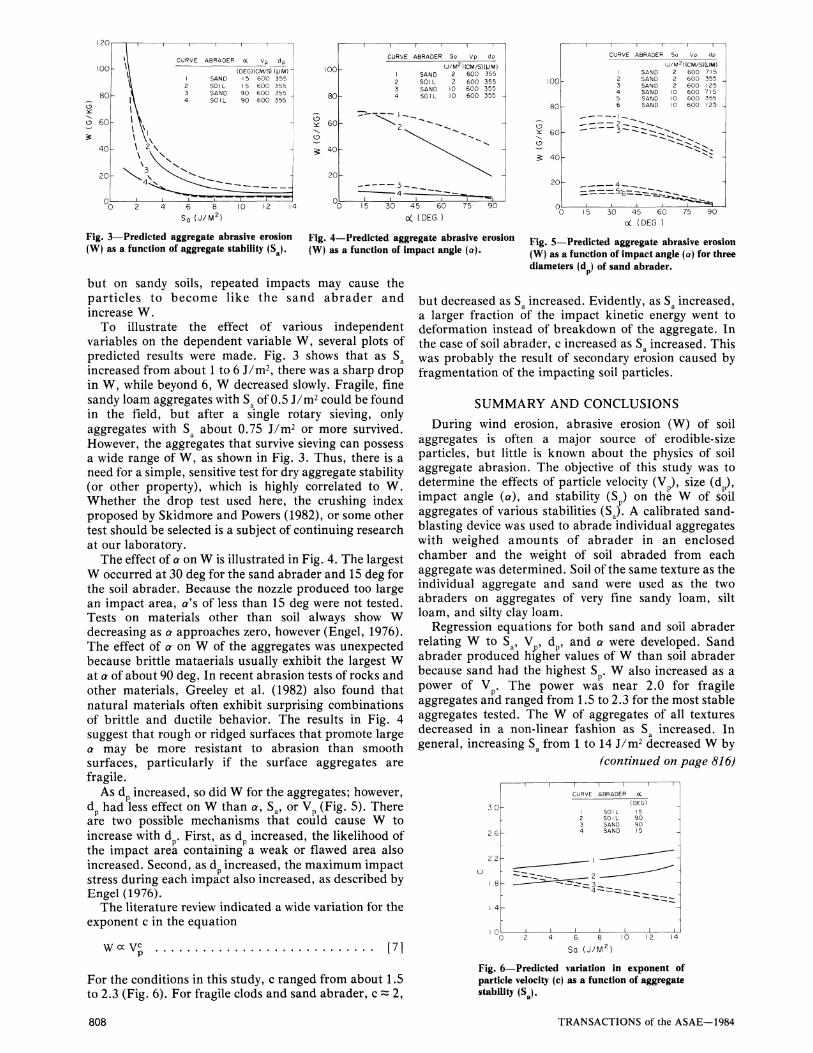
The literature review indicated a wide variation for the exponent c in the equation
Wocv^ [7]
For the conditions in this study, c ranged from about 1.5 to 2.3 (Fig. 6). For fragile clods and sand abrader, c ^ 2,
but decreased as S increased. Evidently, as S increased, a larger fraction of the impact kinetic energy went to deformation instead of breakdown of the aggregate. In the case of soil abrader, c increased as S increased. This was probably the result of secondary erosion caused by fragmentation of the impacting soil particles.
SUMMARY AND CONCLUSIONS
During wind erosion, abrasive erosion (W) of soil aggregates is often a major source of erodible-size particles, but little is known about the physics of soil aggregate abrasion. The objective of this study was to determine the effects of particle velocity (V ), size (d ), impact angle (a), and stability (Sp) on the W of soil aggregates of various stabilities (S^). A calibrated sandblasting device was used to abrade individual aggregates with weighed amounts of abrader in an enclosed chamber and the weight of soil abraded from each aggregate was determined. Soil of the same texture as the individual aggregate and sand were used as the two abraders on aggregates of very fine sandy loam, silt loam, and silty clay loam.
Regression equations for both sand and soil abrader relating W to S , V , dp, and a were developed. Sand abrader produced higher values of W than soil abrader because sand had the highest S . W also increased as a power of Vp. The power was near 2.0 for fragile aggregates and ranged from 1.5 to 2.3 for the most stable aggregates tested. The W of aggregates of all textures decreased in a non-linear fashion as S increased. In general, increasing S from 1 to 14 J/m^ decreased W by
(continued on page 816)
-
-
— 1 1 1
CURVE
2 3 4
s^^^II
1 1 1
1
2 3 4
ABRADER
SOIL SOIL SAND SAND
=E 1 1
I 1 '
oC (DEG)
15 90 90 15
C 1 1
6 8 So (J /M^
Fig. 6—Predicted variation in exponent of particle velocity (c) as a function of aggregate stability (S j .
808 TRANSACTIONS of the ASAE—1984
layer could limit volatilization and reduce the true values to less than the numbers predicted.
SUMMARY
1. In laboratory tests where inflow air had from 0 to 100% relative humidity, pesticide concentrations in air were not significantly affected by whether or not water was simultaneously evaporating.
2. Aeration of pesticide solutions or suspensions, by creation of aerosols, may enhance pesticide losses to the air (although initially in the condensed phase and not as a vapor).
3. Pesticide concentrations in air increased with temperature under equilibrium conditions roughly as predicted by the Clapeyron-Clausius equation.
4. Propachlor concentrations in air under equilibrium conditions were nearly equal to the vapor pressure over a saturated solution times the fraction of saturation, following Henry's Law (the agreement for alachlor was not as good, possibly because of poor literature values for its solubility or saturated vapor pressure).
5. The ratios of pesticide to water losses agreed roughly with those predicted by the equation:
pesticide loss VP^M^V. (c'/Co)
water loss VP^M^v.( l-R.H./100)
6. Using pesticide disposal and water evaporation data for a specific pit, this equation was used to predict that containment problems relative to volatilization could occur for pesticides with vapor pressures greater than 1 X 10 ^ mm Hg; whereas, losses for pesticides with vapor pressures less than 1 x 10^ were predicted to be less than 10% of that disposed of.
References 1. American Chemical Society. 1980. Pesticide profits below
mature market status. Chem. Eng. News 58(17):10-13. 2. Becker, R., and H. Stockdale. 1980. Pesticides used in Iowa
crop production in 1978 and 1979. Coop. Ext. Serv. Publ. Pm-964, Iowa State Univ., Ames.
3. Egg, R., D. L. Redell, and R. Avant. 1980. Disposal of water pesticides in roofed and unroofed evaporation pits. ASAE Paper No. 80-2111, 1980 Summer Meeting, San Antonio, TX.
4. Environmental Protection Agency. 1981. Safe disposal methods for agricultural pesticide wastes. Completion report (Order No. PB 81-197 584; National Technical Information Service).
5. Moore, W. J. 1962. Physical Chemicstry, 3rd ed. Prentice-Hall, Inc., Englewood Cliffs, NJ.
6. Ryan, S. O. 1974. A study of pesticide use, storage and disposal in Iowa, Ph.D. Dissertation, Iowa State University, Ames.
7. Waldron, A. C , and E. L. Park. 1981. Pesticide use on major crops in the North Central Region—1978. Ohio Agric. Res. Dev. Cent. Res. Bull. 1132.
8. Weed Science Society of America. 1974. Herbicide Handbook, 3rd ed. W. F. Humprey Press, Geneva, NY.
Soil Aggregate Abrasion (continued from page 808)
at least a factor of 10. The aggregate response to a was unexpected in that the aggregates behaved somewhat like ductile materials and had the largest W at a of 15 to 30 deg. Finally, a small increase in W occurred as average dp increased from 125 to 715 yim.
References 1. Chepil, W. S. 1946. Dynamics of wind erosion: IV. The
translocating and abrasive action of the wind. Soil Sci. 61:167-177. 2. Chepil, W. S. 1951. Properties of soil which influence wind
erosion: V. Mechanical stability fo structure. Soil Sci. 72:465-478. 3. Chepil, W. S. 1958. Soil conditions that influence wind
erosion. USDA Tech. Bui. No. 1185, 40 pp. 4. Engel, P. A. 1976. Impact wear of materials. Elsevier Sci. Pub.
Co., New York, 339 pp. 5. Farrell, D. A., E. L. Greacen, and W. E. Larson. 1967. The
effect of water content on axial strain in a loam soil under tension and
compression. Soil Sci. Soc. Am. Proc. 31:445-450. 6. Greeley, R., L. N. Rodman, S. H. Williams, B. R. White, J. B.
Pollack, D. H. Krinsley, and J. R. Marshall. 1982. Rate of wind abrasion on Mars. J. Geophys. Res. 87(B12): 10,009-10,024.
7. Lowrison, G. C. 1974. Crushing and grinding. Butterworth and Co. Ltd., London, 286 pp.
8. Preece, C. M., and N. H. Macmillan. 1977. Erosion. Annual Review of Materials Science 7:95-122.
9. Ruff, A. W., and L. K. Ives. 1975. Measurements of solid particle velocity in erosive wear. Wear 35:195-199.
10. SKidmore, E. L., and D. H. Powers. 1982. Dry soil aggregate stability: energy based index. Soil Sci. Soc. Am. J. 46(6): 1274-1279.
11. Tilly, G. P., and Wendy Sage. 1970. The interaction of particle and material behavior in erosion processes. Wear 16:447-465.
12. Wolak, J., P. Worm, I. Patterson, and J. Bodoia. 1977. Parameters affecting the velocity of particles in an abrasive jet. J. Engr. Materials and Tech. 99:147-152.
13. Woodruff, N. P., and F. H. Siddoway. 1965. A wind erosion equation. Soil Sci. Soc. Am. Proc. 29(5):602-608.
816 TRANSACTIONS of the ASAE—1984