software quality attributes and trade-offs - uio.no · software quality attributes and trade-offs...
TRANSCRIPT

Software quality attributes and trade-offs
Authors: Patrik Berander, Lars-Ola Damm, Jeanette Eriksson, Tony Gorschek, Kennet Henningsson, Per Jönsson, Simon Kågström, Drazen Milicic, Frans Mårtensson,
Kari Rönkkö, Piotr Tomaszewski
Editors: Lars Lundberg, Michael Mattsson, Claes Wohlin
Blekinge Institute of Technology June 2005
Preface
This compendium was produced in a Ph.D. course on “Quality attributes and trade-offs”. The 11 Ph.D. students that followed the course all worked in the same research project: BESQ (Blekinge – Engineering Software Qualities), see http://www.bth.se/besq.
The goal of the course is to increase the competence in key areas related to engineering of software qualities and by this establish a common platform and understanding. The latter should in the long run make it easier to perform future cooperation and joint projects. We will also discuss techniques and criteria for reviewing scientific papers and book chapters. The course is divided into a number of sections, where one (or a group of) student(s) is responsible for each section. Each section should be documented in written form.
This compendium is organized in 8 chapters:
1. Software Quality Models and Philosophies, by D. Milicic
This chapter gives an overview to different quality models. It also discusses what quality is by presenting a number of high-profile quality gurus together with their thoughts on quality (which in some cases actually results in a more or less formal quality model).
2. Customer/User-Oriented Attributes and Evaluation Models, by J. Eriksson, K. Rönkkö, S. Kågström
This chapter looks at the attributes: Reliability, Usability, and Efficiency from a user perspective.
3. Management-Oriented Attributes and Evaluation Models, by L-O. Damm
The software industry constantly seeks ways to optimize product development after what is expected from their customers. One effect of this is an increased need to become better at predicting and measuring management related attributes that affect company success. This chapter describes a set of such management related attributes and their relations and trade-offs.
4. Developer-Oriented Quality Attributes and Evaluation Methods, by P. Jönsson
This chapter focuses on developer-oriented quality attributes, such as: Maintainability, Reusability, Flexibility and Demonstrability. A list of developer-oriented quality attributes is synthesized from a number of common quality models: McCall’s quality model, Boehm’s quality model and ISO 9126-1.
5. Merging Perspectives on Software Quality Attributes, by P. Berander In the three previous chapters, various quality attributes are discussed from different perspectives. This chapter aims to merge these three different perspectives and discuss the relations between them.
6. Decision Support and Trade-off Techniques, by T. Gorschek, K. Henningsson
Dealing with decisions concerning limited resources typically involves a trade-off of some sort. This chapter discusses the concept of trade-off techniques and practices as a basis for decision support. In this context a trade-off can become a necessity if there are limited resources and two (or more) entities require the consumption of the same resource, or if two or more entities are in conflict.
7. Trade-off examples inside software engineering and computer science, by F. Mårtensson
During software development, tradeoffs are made on a daily basis by the people participating in the development project. In this chapter we will take a look at some of the methods that are available for structuring and quantifying the information necessary to make tradeoffs in some situations. We will concentrate on software developing projects and look at four different examples where trade-off methods have been applied.
8. Trade-off examples outside software engineering and computer science, by P. Tomaszewski
This chapter discusses the definition of tradeoffs and the difference between a trade-off and a break-through solution. The chapter also gives trade-off examples from the car industry, the power supply area, electronic media, and selling.

___ Chapter One __________________________________________
1. Software Quality Models and Philosophies
1.1. Introduction
The purpose of this chapter is to provide an overview to different quality models. It will also discuss what quality is by presenting a number of high-profile quality gurus together with their thoughts on quality (which in some cases actually results in a more or less formal quality model). The chapter is structured as follows: To be able to discuss the topic of quality and quality models, we as many others, must fist embark on trying to define the concept of quality. Section 1.2 provides some initial definitions and scope on how to approach this elusive and subjective word. Section 1.3 provides a wider perspective on quality by presenting a more philosophical management view on what quality can mean. Section 1.4 continues to discuss quality through a model specific overview of several of the most popular quality models and quality structures of today. The chapter is concluded in Section 1.5 with a discussion about presented structures of quality, as well as some concluding personal reflections.
1.2. What is Quality
To understand the landscape of software quality it is central to answer the so often asked question: what is quality? Once the concept of quality is understood it is easier to understand the different structures of quality available on the market. As follows, and before we embark into the quality quagmire, we will spend some time to sort out the question: what is quality. As many prominent authors and researchers have provided an answer to that question, we do not have the ambition of introducing yet another answer but we will rather answer the question by studying the answers that some of the more prominent gurus of the quality management community have provided. By learning from those gone down this path before us we can identify that there are two major camps when discussing the meaning and definition of (software) quality [1]: 1) Conformance to specification: Quality that is defined as a matter of products and services whose measurable
characteristics satisfy a fixed specification – that is, conformance to an in beforehand defined specification. 2) Meeting customer needs: Quality that is identified independent of any measurable characteristics. That is,
quality is defined as the products or services capability to meet customer expectations – explicit or not.
1.3. Quality Management Philosophies
One of the two perspectives chosen to survey the area of quality structures within this technical paper is by means of quality management gurus. This perspective provides a qualitative and flexible [2] alternative on how to view quality structures. As will be discussed in Section 1.5, quality management philosophies can sometimes be a good alternative to the more formalized quality models discussed in Section 1.4.
1.3.1. Quality according to Crosby In the book “Quality is free: the art of making quality certain” [3], Philip B. Crosby writes:
The first erroneous assumption is that quality means goodness, or luxury or shininess. The word “quality” is often used to signify the relative worth of something in such phrases as “good quality”, “bad quality” and “quality of life” - which means different things to each and every person. As follows quality must be defined as “conformance to requirements” if we are to manage it. Consequently, the nonconformance detected is the absence of quality, quality problems become nonconformance problems, and quality becomes definable.
Crosby is a clear “conformance to specification” quality definition adherer. However, he also focuses on trying to understand the full array of expectations that a customer has on quality by expanding the, of today’s measure, somewhat narrow production perspective on quality with a supplementary external perspective. Crosby also emphasizes that it is important to clearly define quality to be able to measure and manage the concept. Crosby summarizes his perspective on quality in fourteen steps but is built around four fundamental "absolutes" of quality management:
1) Quality is defined as conformance to requirements, not as “goodness” or “elegance” 2) The system for causing quality is prevention, not appraisal. That is, the quality system for suppliers attempting
to meet customers' requirements is to do it right the first time. As follows, Crosby is a strong advocate of prevention, not inspection. In a Crosby oriented quality organization everyone has the responsibility for his or her own work. There is no one else to catch errors.
3) The performance standard must be Zero Defects, not "that's close enough". Crosby has advocated the notion that zero errors can and should be a target.
4) The measurement of quality is the cost of quality. Costs of imperfection, if corrected, have an immediate beneficial effect on bottom-line performance as well as on customer relations. To that extent, investments should be made in training and other supporting activities to eliminate errors and recover the costs of waste.
1.3.2. Quality according to Deming Walter Edwards Deming’s “Out of the crisis: quality, productivity and competitive position” [4], states:
The problem inherent in attempts to define the quality of a product, almost any product, where stated by the master Walter A. Shewhart. The difficulty in defining quality is to translate future needs of the user into measurable characteristics, so that a product can be designed and turned out to give satisfaction at a price that the user will pay. This is not easy, and as soon as one feels fairly successful in the endeavor, he finds that the needs of the consumer have changed, competitors have moved in etc.
One of Deming’s strongest points is that quality must be defined in terms of customer satisfaction – which is a much wider concept than the “conformance to specification” definition of quality (i.e. “meeting customer needs” perspective). Deming means that quality should be defined only in terms of the agent – the judge of quality.
Deming’s philosophy of quality stresses that meeting and exceeding the customers' requirements is the task that everyone within an organization needs to accomplish. Furthermore, the management system has to enable everyone to be responsible for the quality of his output to his internal customers. To implement his perspective on quality Deming introduced his 14 Points for Management in order to help people understand and implement the necessary transformation: 1) Create constancy of purpose for improvement of product and service: A better way to make money is to
stay in business and provide jobs through innovation, research, constant improvement and maintenance. 2) Adopt the new philosophy: For the new economic age, management needs to take leadership for change into
a learning organization. Furthermore, we need a new belief in which mistakes and negativism are unacceptable.
3) Cease dependence on mass inspection: Eliminate the need for mass inspection by building quality into the product.
4) End awarding business on price: Instead, aim at minimum total cost and move towards single suppliers. 5) Improve constantly and forever the system of production and service: Improvement is not a one-time
effort. Management is obligated to continually look for ways to reduce waste and improve quality. 6) Institute training: Too often, workers have learned their job from other workers who have never been trained
properly. They are forced to follow unintelligible instructions. They can't do their jobs well because no one tells them how to do so.
7) Institute leadership: The job of a supervisor is not to tell people what to do nor to punish them, but to lead. Leading consists of helping people to do a better job and to learn by objective methods.
8) Drive out fear: Many employees are afraid to ask questions or to take a position, even when they do not understand what their job is or what is right or wrong. To assure better quality and productivity, it is necessary that people feel secure. "The only stupid question is the one that is not asked."
9) Break down barriers between departments: Often a company's departments or units are competing with each other or have goals that conflict. They do not work as a team; therefore they cannot solve or foresee problems. Even worse, one department's goal may cause trouble for another.
10) Eliminate slogans, exhortations and numerical targets: These never help anybody do a good job. Let workers formulate their own slogans. Then they will be committed to the contents.
11) Eliminate numerical quotas or work standards: Quotas take into account only numbers, not quality or methods. They are usually a guarantee of inefficiency and high cost. A person, in order to hold a job, will try to meet a quota at any cost, including doing damage to his company.
12) Remove barriers to taking pride in workmanship: People are eager to do a good job and distressed when they cannot.
13) Institute a vigorous programme of education: Both management and the work force will have to be educated in the new knowledge and understanding, including teamwork and statistical techniques.
14) Take action to accomplish the transformation: It will require a special top management team with a plan of action to carry out the quality mission. A critical mass of people in the company must understand the 14 points.

1.3.3. Quality according to Feigenbaum The name Feigenbaum and the term total quality control are virtually synonymous due to his profound
influence on the concept of total quality control (but also due to being the originator of the concept). In “Total quality control” [5] Armand Vallin Feigenbaum explains his perspective on quality through the following text: Quality is a customer determination, not an engineer’s determination, not a marketing determination, nor a general management determination. It is based on upon the customer’s actual experience with the product or service, measured against his or her requirements – stated or unstated, conscious or merely sensed, technically operational or entirely subjective – and always representing a moving target in a competitive market. Product and service quality can be defined as: The total composite product and service characteristics of marketing, engineering, manufacture and maintenance though witch the product and service in use will meet the expectations of the customer.
Feigenbaum’s definition of quality is unmistakable a “meeting customer needs” definition of quality. In fact, he goes very wide in his quality definition by emphasizing the importance of satisfying the customer in both actual and expected needs. Feigenbaum essentially points out that quality must be defined in terms of customer satisfaction, that quality is multidimensional (it must be comprehensively defined), and as the needs are changing quality is a dynamic concept in constant change as well. It is clear that Feigenbaum’s definition of quality not only encompasses the management of product and services but also of the customer and the customer’s expectations.
1.3.4. Quality according to Ishikawa Kaoru Ishikawa writes the following in his book “What is quality control? The Japanese Way” [6]:
We engage in quality control in order to manufacture products with the quality which can satisfy the requirements of consumers. The mere fact of meeting national standards or specifications is not the answer, it is simply insufficient. International standards established by the International Organization for Standardization (ISO) or the International Electrotechnical Commission (IEC) are not perfect. They contain many shortcomings. Consumers may not be satisfied with a product which meets these standards. We must also keep in mind that consumer requirements change from year to year and even frequently updated standards cannot keep the pace with consumer requirements. How one interprets the term “quality” is important. Narrowly interpreted, quality means quality of products. Broadly interpreted, quality means quality of product, service, information, processes, people, systems etc. etc.
Ishikawa’s perspective on quality is a “meeting customer needs” definition as he strongly couples the level of quality to every changing customer expectations. He further means that quality is a dynamic concept as the needs, the requirements and the expectations of a customer continuously change. As follows, quality must be defined comprehensively and dynamically. Ishikawa also includes that price as an attribute on quality – that is, an overprized product can neither gain customer satisfaction and as follows not high quality.
1.3.5. Quality according to Juran In “Jurans’s Quality Control Handbook” [7] Joseph M. Juran provides two meanings to quality:
The word quality has multiple meanings. Two of those meanings dominate the use of the word: 1) Quality consists of those product features which meet the need of customers and thereby provide product satisfaction. 2) Quality consists of freedom from deficiencies. Nevertheless, in a handbook such as this it is most convenient to standardize on a short definition of the word quality as “fitness for use”
Juran takes a somewhat different road to defining quality than the other gurus previously mentioned. His point is that we cannot use the word quality in terms of satisfying customer expectations or specifications as it is very hard to achieve this. Instead he defines quality as “fitness for use” – which indicates references to requirements and products characteristics. As follows Juran’s definition could be interpreted as a “conformance to specification” definition more than a “meeting customer needs” definition. Juran proposes three fundamental managerial processes for the task of managing quality. The three elements of the Juran Trilogy are: •
•
•
Quality planning: A process that identifies the customers, their requirements, the product and service features that customers expect, and the processes that will deliver those products and services with the correct attributes and then facilitates the transfer of this knowledge to the producing arm of the organization. Quality control: A process in which the product is examined and evaluated against the original requirements expressed by the customer. Problems detected are then corrected. Quality improvement: A process in which the sustaining mechanisms are put in place so that quality can be achieved on a continuous basis. This includes allocating resources, assigning people to pursue quality projects, training those involved in pursuing projects, and in general establishing a permanent structure to pursue quality and maintain the gains secured.

1.3.6. Quality according to Shewhart As referred to by W.E. Deming, “the master”, Walter A. Shewhart defines quality in “Economic control of
quality of manufactured product” [8] as follows: There are two common aspects of quality: One of them has to do with the consideration of the quality of a thing as an objective reality independent of the existence of man. The other has to do with what we think, feel or sense as a result of the objective reality. In other word, there is a subjective side of quality.
Although Shewhart’s definition of quality is from 1920s, it is still considered by many to be the best and most superior. Shewhart talks about both an objective and subjective side of quality which nicely fits into both “conformance to specification” and “meeting customer needs” definitions.
1.4. Quality Models
In the previous section we presented some quality management gurus as well as their ideas and views on quality – primarily because this is a used and appreciated approach for dealing with quality issues in software developing organizations. Whereas the quality management philosophies presented represent a more flexible and qualitative view on quality, this section will present a more fixed and quantitative [2] quality structure view.
1.4.1. McCall’s Quality Model (1977) One of the more renown predecessors of today’s quality models is the quality model presented by Jim McCall
et al. [9-11] (also known as the General Electrics Model of 1977). This model, as well as other contemporary models, originates from the US military (it was developed for the US Air Force, promoted within DoD) and is primarily aimed towards the system developers and the system development process. It his quality model McCall attempts to bridge the gap between users and developers by focusing on a number of software quality factor that reflect both the users’ views and the developers’ priorities.
The McCall quality model has, as shown in Figure 1, three major perspectives for defining and identifying the quality of a software product: product revision (ability to undergo changes), product transition (adaptability to new environments) and product operations (its operation characteristics).
Product revision includes maintainability (the effort required to locate and fix a fault in the program within its operating environment), flexibility (the ease of making changes required by changes in the operating environment) and testability (the ease of testing the program, to ensure that it is error-free and meets its specification).
Product transition is all about portability (the effort required to transfer a program from one environment to another), reusability (the ease of reusing software in a different context) and interoperability (the effort required to couple the system to another system).
Quality of product operations depends on correctness (the extent to which a program fulfils its specification), reliability (the systems ability not to fail), efficiency (further categorized into execution efficiency and storage efficiency and generally meaning the use of resources, e.g. processor time, storage), integrity (the protection of the program from unauthorized access) and usability (the ease of the software).
Portability
Reusability
Interoperability
Correctness Reliability
Efficiency Integrity
Usability
Maintainability
Flexibility
Testability
Product revision
Product operations Product transition
Figure 1: The McCall quality model (a.k.a. McCall’s Triangle of Quality) organized around three types of quality characteristics.

The model furthermore details the three types of quality characteristics (major perspectives) in a hierarchy of factors, criteria and metrics:
11 Factors (To specify): They describe the external view of the software, as viewed by the users. • • •
23 quality criteria (To build): They describe the internal view of the software, as seen by the developer. Metrics (To control): They are defined and used to provide a scale and method for measurement.
Correctness
Effiency
Integrity
Usability
Reliability
Consistency
Completeness
Tracebility
Accuracy
Error tolerance
Storage effiency
Execution effiency
Access control
Access audit
Operability
Training
Communicativeness
Figure 2: McCall’s Quality Model illustrated through a hierarchy of 11 quality factors (on the left hand side of the figure) related to 23 quality criteria (on the right hand side of the figure).
The quality factors describe different types of system behavioral characteristics, and the quality criterions are
attributes to one or more of the quality factors. The quality metric, in turn, aims to capture some of the aspects of a quality criterion.
The idea behind McCall’s Quality Model is that the quality factors synthesized should provide a complete software quality picture [11]. The actual quality metric is achieved by answering yes and no questions that then are put in relation to each other. That is, if answering equally amount of “yes” and “no” on the questions measuring a quality criteria you will achieve 50% on that quality criteria1. The metrics can then be synthesized per quality criteria, per quality factor, or if relevant per product or service.
1 The critique of this approach is that the quality judgment is subjectively measured based on the judgment on the person(s) answering the questions.

Maintainability
Portability
Reusability
Interoperability
Flexibility
Conciseness
Simplicity
Instrumentation
Self-descriptiveness
Generality
Expandability
Modularity
Software-system independence
Machineindependence
Communication commonality
Data commonality
Testability
Figure 3: McCall’s Quality Model (cont.) illustrated through a hierarchy of 11 quality factors (on the left hand side of the figure) related to 23 quality criteria (on the right hand side of the figure).
1.4.2. Boehm’s Quality Model (1978) The second of the basic and founding predecessors of today’s quality models is the quality model presented by
Barry W. Boehm [12;13]. Boehm addresses the contemporary shortcomings of models that automatically and quantitatively evaluate the quality of software. In essence his models attempts to qualitatively define software quality by a given set of attributes and metrics. Boehm's model is similar to the McCall Quality Model in that it also presents a hierarchical quality model structured around high-level characteristics, intermediate level characteristics, primitive characteristics - each of which contributes to the overall quality level.
The high-level characteristics represent basic high-level requirements of actual use to which evaluation of software quality could be put – the general utility of software. The high-level characteristics address three main questions that a buyer of software has:
As-is utility: How well (easily, reliably, efficiently) can I use it as-is? • • •
•
•
•
•
•
•
•
Maintainability: How easy is it to understand, modify and retest? Portability: Can I still use it if I change my environment?
The intermediate level characteristic represents Boehm’s 7 quality factors that together represent the qualities expected from a software system:
Portability (General utility characteristics): Code possesses the characteristic portability to the extent that it can be operated easily and well on computer configurations other than its current one. Reliability (As-is utility characteristics): Code possesses the characteristic reliability to the extent that it can be expected to perform its intended functions satisfactorily. Efficiency (As-is utility characteristics): Code possesses the characteristic efficiency to the extent that it fulfills its purpose without waste of resources. Usability (As-is utility characteristics, Human Engineering): Code possesses the characteristic usability to the extent that it is reliable, efficient and human-engineered. Testability (Maintainability characteristics): Code possesses the characteristic testability to the extent that it facilitates the establishment of verification criteria and supports evaluation of its performance. Understandability (Maintainability characteristics): Code possesses the characteristic understandability to the extent that its purpose is clear to the inspector. Flexibility (Maintainability characteristics, Modifiability): Code possesses the characteristic modifiability to the extent that it facilitates the incorporation of changes, once the nature of the desired change has been determined. (Note the higher level of abstractness of this characteristic as compared with augmentability).
The lowest level structure of the characteristics hierarchy in Boehm’s model is the primitive characteristics metrics hierarchy. The primitive characteristics provide the foundation for defining qualities metrics – which was one of the

goals when Boehm constructed his quality model. Consequently, the model presents one ore more metrics2 supposedly measuring a given primitive characteristic.
Portability
Human Engineering
Testability
Understandability
Efficiency
Self Containedness
DeviceIndependence
Accuracy
Completeness
Consistency
Robustness/Integrity
Accountability
Device Efficiency
Acessibility
Communicativiness
Self Descriptiveness
Reliability
Structuredness
Conciseness
Legibility
Augmentability
Modifiability
Maintainability
General Utility
As-is Utility
Figure 4: Boehm's Software Quality Characteristics Tree [13]. As-is Utility, Maintainability, and Portability are necessary (but not sufficient) conditions for General Utility. As-is Utility requires a program to be Reliable and adequately Efficient and Human-Engineered. Maintainability requires that the user be able to understand, modify, and test the program, and is aided by good Human-engineering
Though Boehm’s and McCall’s models might appear very similar, the difference is that McCall’s model
primarily focuses on the precise measurement of the high-level characteristics “As-is utility” (see Figure 4 above), whereas Boehm’s quality mode model is based on a wider range of characteristics with an extended and detailed focus on primarily maintainability. compares the two quality models, quality factor by quality factor. Figure 5
Criteria/goals McCall, 1977
Boehm, 1978
Correctness * * Reliability * * Integrity * * Usability * * Effiency * * Maintainability * * Testability * Interoperability * Flexibility * * Reusability * * Portability * * Clarity * Modifiability * Documentation * Resilience * Understandability * Validity * Functionality Generality * Economy *
2 Defined by Boehm as: ”a measure of extent or degree to which a product possesses and exhibits a certain (quality) characteristic”.

Figure 5: Comparison between criteria/goals of the McCall and Boehm quality models [14]. As indicated in Figure 5 above Boehm focuses a lot on the models effort on software maintenance cost-
effectiveness – which, he states, is the primary payoff of an increased capability with software quality considerations.
1.4.3. FURPS/FURPS+ A later, and perhaps somewhat less renown, model that is structured in basically the same manner as the
previous two quality models (but still worth at least to be mentioned in this context) is the FURPS model originally presented by Robert Grady [15] (and extended by Rational Software [16-18] - now IBM Rational Software - into FURPS+3). FURPS stands for:
Functionality – which may include feature sets, capabilities and security • •
•
•
•
Usability - which may include human factors, aesthetics, consistency in the user interface, online and context-sensitive help, wizards and agents, user documentation, and training materials Reliability - which may include frequency and severity of failure, recoverability, predictability, accuracy, and mean time between failure (MTBF) Performance - imposes conditions on functional requirements such as speed, efficiency, availability, accuracy, throughput, response time, recovery time, and resource usage Supportability - which may include testability, extensibility, adaptability, maintainability, compatibility, configurability, serviceability, installability, localizability (internationalization)
The FURPS-categories are of two different types: Functional (F) and Non-functional (URPS). These categories can be used as both product requirements as well as in the assessment of product quality.
1.4.4. Dromey's Quality Model An even more recent model similar to the McCall’s, Boehm’s and the FURPS(+) quality model, is the quality
model presented by R. Geoff Dromey [19;20]. Dromey proposes a product based quality model that recognizes that quality evaluation differs for each product and that a more dynamic idea for modeling the process is needed to be wide enough to apply for different systems. Dromey is focusing on the relationship between the quality attributes and the sub-attributes, as well as attempting to connect software product properties with software quality attributes.
Implementation
Correctness Internal Contextual Descriptive
Functionality, reliability Maintainability, efficiency, reliability
Maintainability, reusability, portability,reliability
Maintainability, reusability, portability,usability
Implementation
Correctness Internal Contextual Descriptive
Functionality, reliability Maintainability, efficiency, reliability
Maintainability, reusability, portability,reliability
Maintainability, reusability, portability,usability
Software product
Product properties
Quality attributes
Figure 6: Principles of Dromey’s Quality Model
Figure 6
As illustrates, there are three principal elements to Dromey's generic quality model
3 The "+" in FURPS+ includes such requirements as design constraints, implementation requirements, interface requirements and physical requirements.

1) Product properties that influence quality 2) High level quality attributes 3) Means of linking the product properties with the quality attributes.
Dromey's Quality Model is further structured around a 5 step process: 1) Chose a set of high-level quality attributes necessary for the evaluation. 2) List components/modules in your system. 3) Identify quality-carrying properties for the components/modules (qualities of the component that have the most
impact on the product properties from the list above). 4) Determine how each property effects the quality attributes. 5) Evaluate the model and identify weaknesses.
1.4.5. ISO
1.4.5.1 ISO 9000 The renowned ISO acronym stands for International Organization for Standardization4. The ISO organization is
responsible for a whole battery of standards of which the ISO 9000 [21-25] (depicted in below) family probably is the most well known, spread and used.
Figure 7
Figure 7: The ISO 9000:2000 standards. The crosses and arrows indicate changes made from the older ISO 9000 standard to the new ISO 9000:2000 standard.
ISO 19011:2000”Guidelines for Auditing
Quality ManagementSystems”
ISO 9004:2000”Guidelines for Quality
Management of Organizations”
ISO 9000:2000”Concepts andTerminology”
ISO 9004-2:1991ISO 9000-3:1996
ISO 19011:2000”Guidelines for Auditing
Quality ManagementSystems”
ISO 9004:2000”Guidelines for Quality
Management of Organizations”
ISO 9000:2000”Concepts andTerminology”
ISO 9004-2:1991ISO 9000-3:1996
ISO 9003:1994
ISO 9000:2000
ISO 9001:2000”Requirements for Quality Assurance”
ISO 9000:1994
ISO 9000-1:1994
ISO 9000-2:1997ISO 9004-1:1994 ISO 9004-4:1993
ISO 9004-3:1993
ISO 9001 is an international quality management system standard applicable to organizations within all type of businesses. ISO 9001 internally addresses an organization’s processes and methods and externally at managing (controlling, assuring etc.) the quality of delivered products and services. ISO 9001 is a process oriented approach towards quality management. That is, it proposes designing, documenting, implementing, supporting, monitoring, controlling and improving (more or less) each of the following processes: • • • • • • • • • •
Quality Management Process Resource Management Process Regulatory Research Process Market Research Process Product Design Process Purchasing Process Production Process Service Provision Process Product Protection Process Customer Needs Assessment Process
4 ISO was chosen instead of IOS, because iso in Greek means equal, and ISO wanted to convey the idea of equality - the idea that they develop standards to place organizations on an equal footing.

Customer Communications Process • • • • • • • • • • •
Internal Communications Process Document Control Process Record Keeping Process Planning Process Training Process Internal Audit Process Management Review Process Monitoring and Measuring Process Nonconformance Management Process Continual Improvement Process
1.4.5.2 ISO 9126 Besides the famous ISO 9000, ISO has also release the ISO 9126: Software Product Evaluation: Quality
Characteristics and Guidelines for their Use-standard5 [26] (among other standards).
Portability
Maintainability
Efficiency
Usability
Reliability
Functionality
ISO/IEC9126
Portability
Maintainability
Efficiency
Usability
Reliability
Functionality
ISO/IEC9126
How efficientis the
software?
How easy is to modify the software?
How easy is to transfer the software to anotherenvironment?
Are the requiredfunctionsavailable in the software?
How reliable is the software?
Is the software easy to use?
Figure 8: The ISO 9126 quality model
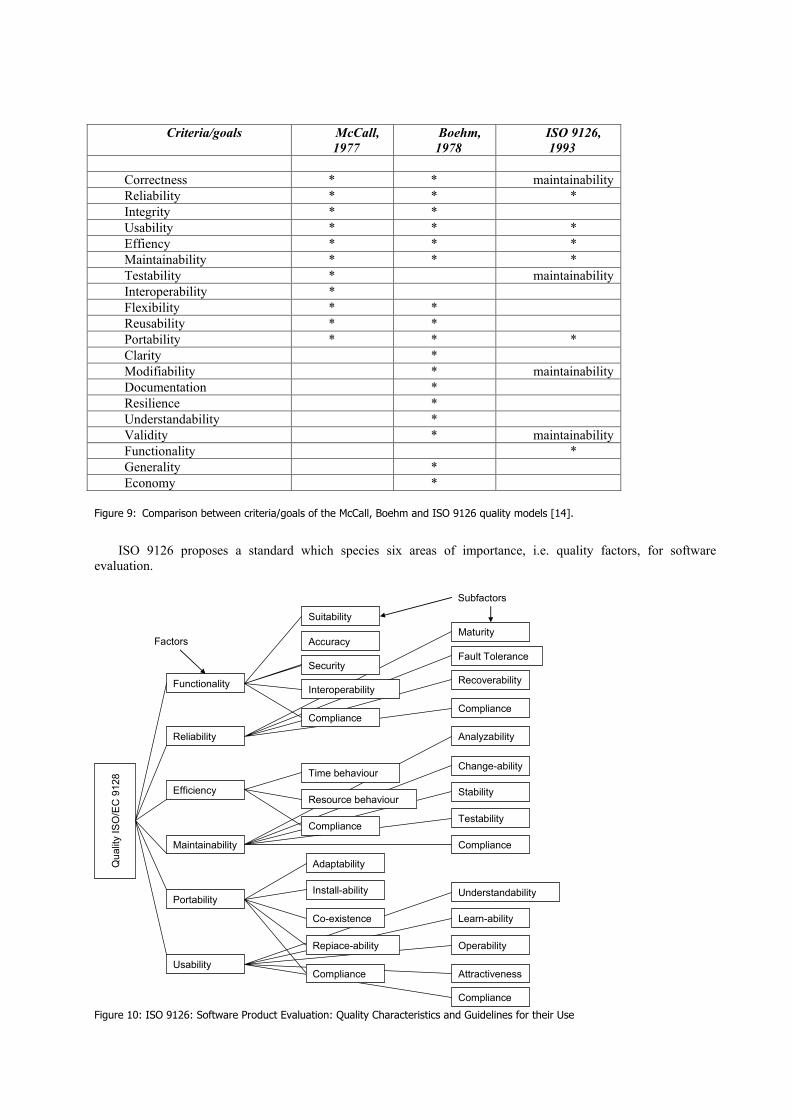
This standard was based on the McCall and Boehm models. Besides being structured in basically the same manner as these models (see ), ISO 9126 also includes functionality as a parameter, as well as identifying both internal and external quality characteristics of software products.
Figure 10
5 ISO/IEC 9126:2001 contains 4 parts - Part 1: Quality Model - Part 2: External Metrics - Part 3: Internal Metrics - Part 4: Quality in use metrics
Criteria/goals McCall, 1977
Boehm, 1978
ISO 9126, 1993
Correctness * * maintainability Reliability * * * Integrity * * Usability * * * Effiency * * * Maintainability * * * Testability * maintainability Interoperability * Flexibility * * Reusability * * Portability * * * Clarity * Modifiability * maintainability Documentation * Resilience * Understandability * Validity * maintainability Functionality * Generality * Economy *
Figure 9: Comparison between criteria/goals of the McCall, Boehm and ISO 9126 quality models [14].
ISO 9126 proposes a standard which species six areas of importance, i.e. quality factors, for software evaluation.
Qua
lity
ISO
/EC
912
8
Functionality
Reliability
Efficiency
Maintainability
Portability
Usability
Suitability
Accuracy
Install-ability
Adaptability
Maturity
Fault Tolerance
Recoverability
Compliance
Compliance
Analyzability
Change-ability
Stability
Testability
Understandability
Learn-ability
Operability
Attractiveness
Compliance
Compliance
Interoperability
Security
Time behaviour
Resource behaviour
Compliance
Compliance
Repiace-ability
Co-existence
Subfactors
Factors
Figure 10: ISO 9126: Software Product Evaluation: Quality Characteristics and Guidelines for their Use

Each quality factors and its corresponding sub-factors are defined as follows: •
•
•
•
•
•
Functionality: A set of attributes that relate to the existence of a set of functions and their specified properties. The functions are those that satisfy stated or implied needs. - Suitability: Attribute of software that relates to the presence and appropriateness of a set of functions for specified tasks. - Accuracy: Attributes of software that bare on the provision of right or agreed results or effects. - Security: Attributes of software that relate to its ability to prevent unauthorized access, whether accidental or deliberate, to programs and data. - Interoperability: Attributes of software that relate to its ability to interact with specified systems. - Compliance: Attributes of software that make the software adhere to application related standards or conventions or regulations in laws and similar prescriptions. Reliability: A set of attributes that relate to the capability of software to maintain its level of performance under stated conditions for a stated period of time. - Maturity: Attributes of software that relate to the frequency of failure by faults in the software. - Fault tolerance: Attributes of software that relate to its ability to maintain a specified level of performance in cases of software faults or of infringement of its specified interface. - Recoverability: Attributes of software that relate to the capability to re-establish its level of performance and recover the data directly affected in case of a failure and on the time and effort needed for it. - Compliance: See above. Usability: A set of attributes that relate to the effort needed for use, and on the individual assessment of such use, by a stated or implied set of users. - Understandability: Attributes of software that relate to the users' effort for recognizing the logical concept and its applicability. - Learnability: Attributes of software that relate to the users' effort for learning its application (for example, operation control, input, output). - Operability: Attributes of software that relate to the users' effort for operation and operation control. - Attractiveness: - - Compliance: Attributes of software that make the software adhere to application related standards or conventions or regulations in laws and similar prescriptions. Efficiency: A set of attributes that relate to the relationship between the level of performance of the software and the amount of resources used, under stated conditions. - Time behavior: Attributes of software that relate to response and processing times and on throughput rates in performing its function. - Resource behavior: Attributes of software that relate to the amount of resources used and the duration of such use in performing its function. - Compliance: See above. Maintainability: A set of attributes that relate to the effort needed to make specified modifications. - Analyzability: Attributes of software that relate to the effort needed for diagnosis of deficiencies or causes of failures, or for identification of parts to be modified. - Changeability: Attributes of software that relate to the effort needed for modification, fault removal or for environmental change. - Stability: Attributes of software that relate to the risk of unexpected effect of modifications. - Testability: Attributes of software that relate to the effort needed for validating the modified software. - Compliance: See above. Portability: A set of attributes that relate to the ability of software to be transferred from one environment to another. - Adaptability: Attributes of software that relate to on the opportunity for its adaptation to different specified environments without applying other actions or means than those provided for this purpose for the software considered. - Installability: Attributes of software that relate to the effort needed to install the software in a specified environment. - Conformance: Attributes of software that make the software adhere to standards or conventions relating to portability. - Replaceability: Attributes of software that relate to the opportunity and effort of using it in the place of specified other software in the environment of that software.
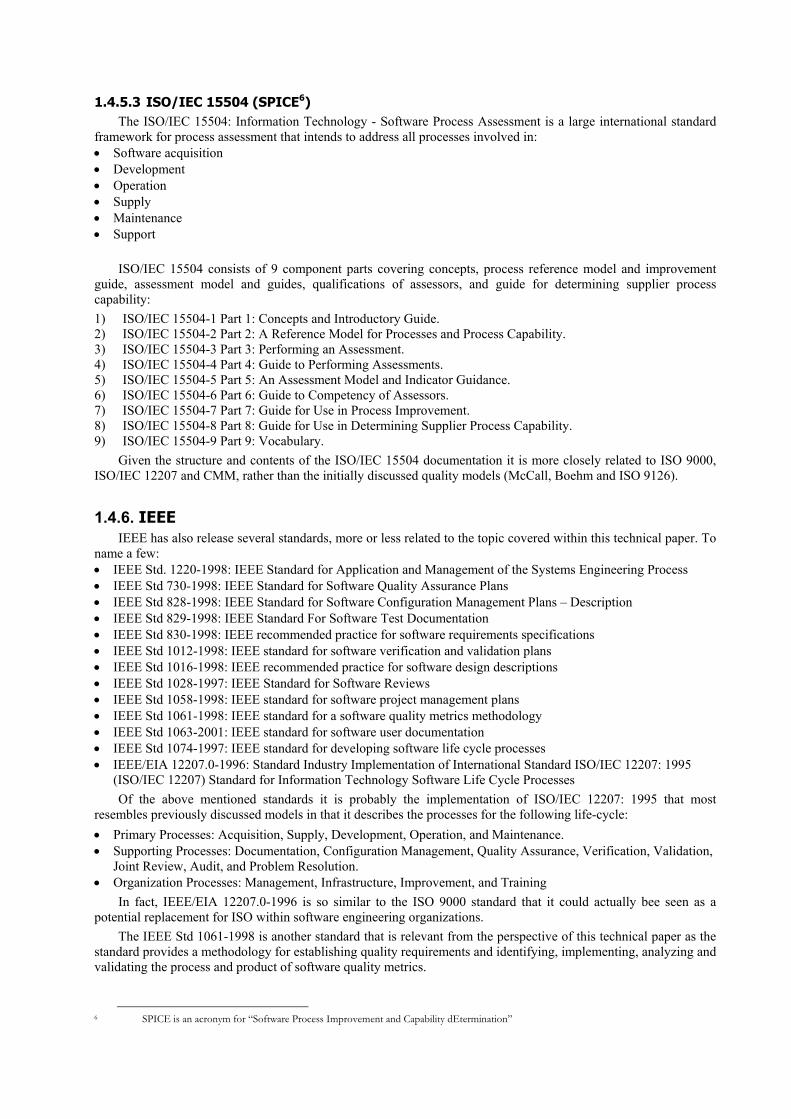
1.4.5.3 ISO/IEC 15504 (SPICE6) The ISO/IEC 15504: Information Technology - Software Process Assessment is a large international standard
framework for process assessment that intends to address all processes involved in: • • • • • •
• • • • • • • • • • • • •
• •
•
Software acquisition Development Operation Supply Maintenance Support ISO/IEC 15504 consists of 9 component parts covering concepts, process reference model and improvement
guide, assessment model and guides, qualifications of assessors, and guide for determining supplier process capability: 1) ISO/IEC 15504-1 Part 1: Concepts and Introductory Guide. 2) ISO/IEC 15504-2 Part 2: A Reference Model for Processes and Process Capability. 3) ISO/IEC 15504-3 Part 3: Performing an Assessment. 4) ISO/IEC 15504-4 Part 4: Guide to Performing Assessments. 5) ISO/IEC 15504-5 Part 5: An Assessment Model and Indicator Guidance. 6) ISO/IEC 15504-6 Part 6: Guide to Competency of Assessors. 7) ISO/IEC 15504-7 Part 7: Guide for Use in Process Improvement. 8) ISO/IEC 15504-8 Part 8: Guide for Use in Determining Supplier Process Capability. 9) ISO/IEC 15504-9 Part 9: Vocabulary.
Given the structure and contents of the ISO/IEC 15504 documentation it is more closely related to ISO 9000, ISO/IEC 12207 and CMM, rather than the initially discussed quality models (McCall, Boehm and ISO 9126).
1.4.6. IEEE IEEE has also release several standards, more or less related to the topic covered within this technical paper. To
name a few: IEEE Std. 1220-1998: IEEE Standard for Application and Management of the Systems Engineering Process IEEE Std 730-1998: IEEE Standard for Software Quality Assurance Plans IEEE Std 828-1998: IEEE Standard for Software Configuration Management Plans – Description IEEE Std 829-1998: IEEE Standard For Software Test Documentation IEEE Std 830-1998: IEEE recommended practice for software requirements specifications IEEE Std 1012-1998: IEEE standard for software verification and validation plans IEEE Std 1016-1998: IEEE recommended practice for software design descriptions IEEE Std 1028-1997: IEEE Standard for Software Reviews IEEE Std 1058-1998: IEEE standard for software project management plans IEEE Std 1061-1998: IEEE standard for a software quality metrics methodology IEEE Std 1063-2001: IEEE standard for software user documentation IEEE Std 1074-1997: IEEE standard for developing software life cycle processes IEEE/EIA 12207.0-1996: Standard Industry Implementation of International Standard ISO/IEC 12207: 1995 (ISO/IEC 12207) Standard for Information Technology Software Life Cycle Processes Of the above mentioned standards it is probably the implementation of ISO/IEC 12207: 1995 that most
resembles previously discussed models in that it describes the processes for the following life-cycle: Primary Processes: Acquisition, Supply, Development, Operation, and Maintenance. Supporting Processes: Documentation, Configuration Management, Quality Assurance, Verification, Validation, Joint Review, Audit, and Problem Resolution. Organization Processes: Management, Infrastructure, Improvement, and Training In fact, IEEE/EIA 12207.0-1996 is so similar to the ISO 9000 standard that it could actually bee seen as a
potential replacement for ISO within software engineering organizations. The IEEE Std 1061-1998 is another standard that is relevant from the perspective of this technical paper as the
standard provides a methodology for establishing quality requirements and identifying, implementing, analyzing and validating the process and product of software quality metrics.
6 SPICE is an acronym for “Software Process Improvement and Capability dEtermination”

1.4.7. Capability Maturity Model(s) The Carnegie Mellon Software Engineering Institute (SEI), non-profit group sponsored by the DoD work at
getting US software more reliable. Examples of relevant material produces from SEI is the PSP [27;28] and TSPi [29]. While PSP and TSPi briefly brushes the topic of this technical paper, SEI has also produced a number of more extensive Capability Maturity Models that in a very IEEE and ISO 9000 similar manner addresses the topic of software quality:
CMM / SW-CMM [28;30;31] • • •
P-CMM [32] CMMI [33] - PDD-CMM - SE-CMM - SA-CMM The CMM/SW-CMM depicted in below addresses the issue of software quality from a process
perspective. Figure 11
Figure 11: Maturity Levels of (SW-)CMM
Level 1:
Initial
Level 2:
Repeatable
Level 3:
Defined
Level 4:
Managed
Level 5:
Optimizing
Process discipline
Process control
Continuousprocess improvement
Process definition
Project management
Engineering management
Quantitativemanagement
Change management
Table 1: Maturity levels with corresponding focus and key process areas for CMM.
Level Focus Key Process Area Level 5 –
Optimizing level
Continuous improvement Process Change Management
Technology Change Management Defect Prevention
Level 4 – Managed level Product and process quality Software Quality Management
Quantitative Process Management
Level 3 – Defined level Engineering process
Organization Process Focus Organization Process Definition
Peer Reviews Training Program
Intergroup Coordination Software Product Engineering
Integrated Software Management
Level 2 – Repeatable level Project Management
Requirements Management Software Project Planning
Software Project Tracking and Oversight
Software Subcontract Management Software Quality Assurance
Software Configuration Management Level 1 –
Initial level Heroes No KPAs at this time
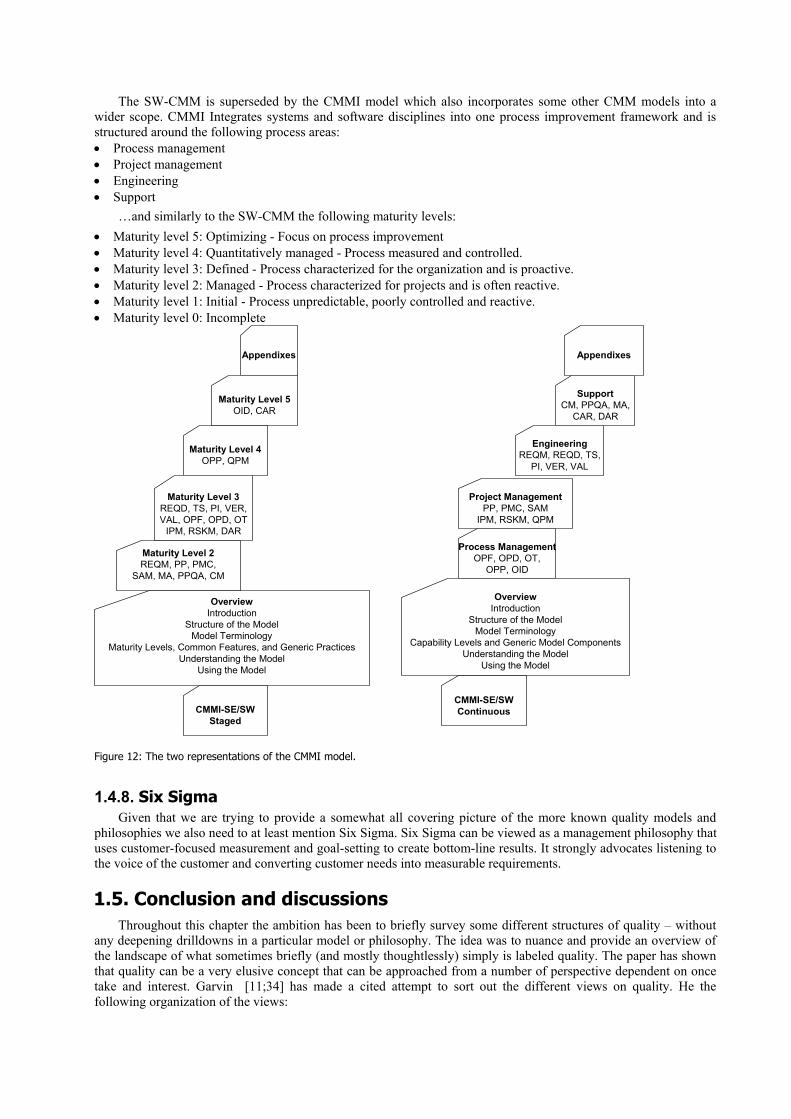
The SW-CMM is superseded by the CMMI model which also incorporates some other CMM models into a wider scope. CMMI Integrates systems and software disciplines into one process improvement framework and is structured around the following process areas:
Process management • • • •
• • • • • •
Project management Engineering Support …and similarly to the SW-CMM the following maturity levels:
Maturity level 5: Optimizing - Focus on process improvement Maturity level 4: Quantitatively managed - Process measured and controlled. Maturity level 3: Defined - Process characterized for the organization and is proactive. Maturity level 2: Managed - Process characterized for projects and is often reactive. Maturity level 1: Initial - Process unpredictable, poorly controlled and reactive. Maturity level 0: Incomplete
Appendixes
Maturity Level 4OPP, QPM
Maturity Level 5OID, CAR
Appendixes
CMMI-SE/SWStaged
OverviewIntroduction
Structure of the ModelModel Terminology
Maturity Levels, Common Features, and Generic PracticesUnderstanding the Model
Using the Model
Maturity Level 2REQM, PP, PMC,
SAM, MA, PPQA, CM
Maturity Level 3REQD, TS, PI, VER,VAL, OPF, OPD, OT
IPM, RSKM, DAR
SupportCM, PPQA, MA,
CAR, DAR
EngineeringREQM, REQD, TS,
PI, VER, VAL
Project ManagementPP, PMC, SAM
IPM, RSKM, QPM
Process ManagementOPF, OPD, OT,
OPP, OID
OverviewIntroduction
Structure of the ModelModel Terminology
Capability Levels and Generic Model ComponentsUnderstanding the Model
Using the Model
CMMI-SE/SWContinuous
Figure 12: The two representations of the CMMI model.
1.4.8. Six Sigma Given that we are trying to provide a somewhat all covering picture of the more known quality models and
philosophies we also need to at least mention Six Sigma. Six Sigma can be viewed as a management philosophy that uses customer-focused measurement and goal-setting to create bottom-line results. It strongly advocates listening to the voice of the customer and converting customer needs into measurable requirements.
1.5. Conclusion and discussions Throughout this chapter the ambition has been to briefly survey some different structures of quality – without
any deepening drilldowns in a particular model or philosophy. The idea was to nuance and provide an overview of the landscape of what sometimes briefly (and mostly thoughtlessly) simply is labeled quality. The paper has shown that quality can be a very elusive concept that can be approached from a number of perspective dependent on once take and interest. Garvin [11;34] has made a cited attempt to sort out the different views on quality. He the following organization of the views:
•
•
•
•
•
Transcendental view, where quality is recognized but not defined. The transcendental view is a subjective and non quantifiable of defining software quality. It often results in software that transcends customer expectations. User view on quality or “fitness for purpose” takes the starting point in software that meets the users’ needs. Reliability (failure rate, MTBF), Performance/Efficiency (time to perform a task), Maintainability and Usability are issues within this view. Manufacturing view on quality focuses on conformance to specification and the organizations capacity to produce software according to the software process. Here product quality is achieved through process quality. Waste reduction, Zero defect, Right the first time (defect count and fault rates, staff effort rework costs) are concepts usually found within this view. Product view on quality usually specifies that the characteristics of product are defined by the characteristics of its subparts, e.g. size, complexity, and test coverage. Module complexity measures, Design & code measures etc. Value based view on quality measures and produces value for money by balancing requirements, budget and time, cost & price, deliver dates (lead time, calendar time), productivity etc. Most of the quality models presented within this technical paper probably could be fitted within the user view,
manufacturing view or product view – though this is a futile exercise with little meaning. The models presented herein are focused around either processes or capability level (ISO, CMM etc.) where quality is measured in terms of adherence to the process or capability level, or a set of attributed/metrics used to distinctively assess quality (McCall, Boehm etc.) by making quality a quantifiable concept. Though having some advantages (in terms of objective measurability), quality models actually reduce the notion of quality to a few relatively simple and static attributes. This structure of quality is in great contrast to the dynamic, moving target, fulfilling the customers’ ever changing expectations perspective presented by some of the quality management gurus. It is easy to se that the quality models represent leaner and narrower perspectives on quality than the management philosophies presented by the quality gurus. The benefit of quality models is that they are simpler to use. The benefit of the quality management philosophies is that they probably more to the point capture the idea of quality.
1.6. References [1] Hoyer, R. W. and Hoyer, B. B. Y., "What is quality?", Quality Progress, no. 7, pp. 52-62, 2001. [2] Robson, C., Real world research: a resource for social scientists and practitioner-researchers, Blackwell
Publisher Ltd., 2002. [3] Crosby, P. B., Quality is free : the art of making quality certain, New York : McGraw-Hill, 1979. [4] Deming, W. E., Out of the crisis : quality, productivity and competitive position, Cambridge Univ. Press,
1988. [5] Feigenbaum, A. V., Total quality control, McGraw-Hill, 1983. [6] Ishikawa, K., What is total quality control? : the Japanese way, Prentice-Hall, 1985. [7] Juran, J. M., Juran's Quality Control Handbook, McGraw-Hill, 1988. [8] Shewhart, W. A., Economic control of quality of manufactured product, Van Nostrand, 1931. [9] McCall, J. A., Richards, P. K., and Walters, G. F., "Factors in Software Quality", Nat'l Tech.Information
Service, no. Vol. 1, 2 and 3, 1977. [10] Marciniak, J. J., Encyclopedia of software engineering, 2vol, 2nd ed., Chichester : Wiley, 2002. [11] Kitchenham, B. and Pfleeger, S. L., "Software quality: the elusive target [special issues section]", IEEE
Software, no. 1, pp. 12-21, 1996. [12] Boehm, B. W., Brown, J. R., Kaspar, H., Lipow, M., McLeod, G., and Merritt, M., Characteristics of
Software Quality, North Holland, 1978. [13] Boehm, Barry W., Brown, J. R, and Lipow, M.: Quantitative evaluation of software quality, International
Conference on Software Engineering, Proceedings of the 2nd international conference on Software engineering, 1976.
[14] Hyatt, Lawrence E. and Rosenberg, Linda H.: A Software Quality Model and Metrics for Identifying Project Risks and Assessing Software Quality, European Space Agency Software Assurance Symposium and the 8th Annual Software Technology Conference, 1996.
[15] Grady, R. B., Practical software metrics for project management and process improvement, Prentice Hall, 1992.
[16] Jacobson, I., Booch, G., and Rumbaugh, J., The Unified Software Development Process, Addison Wesley Longman, Inc., 1999.
[17] Kruchten, P., The Rational Unified Process An Introduction - Second Edition, Addison Wesley Longman, Inc., 2000.
[18] Rational Software Inc., RUP - Rational Unified Process, www.rational.com, 2003. [19] Dromey, R. G., "Concerning the Chimera [software quality]", IEEE Software, no. 1, pp. 33-43, 1996.

[20] Dromey, R. G., "A model for software product quality", IEEE Transactions on Software Engineering, no. 2, pp. 146-163, 1995.
[21] ISO, International Organization for Standardization, "ISO 9000:2000, Quality management systems - Fundamentals and vocabulary", 2000.
[22] ISO, International Organization for Standardization, "ISO 9000-2:1997, Quality management and quality assurance standards — Part 2: Generic guidelines for the application of ISO 9001, ISO 9002 and ISO 9003", 1997.
[23] ISO, International Organization for Standardization, "ISO 9000-3:1998 -- Quality management and quality assurance standards – Part 3: Guidelines for the application of ISO 9001_1994 to the development, supply, installation and maintenance of computer software (ISO 9000-3:1997)", 1998.
[24] ISO, International Organization for Standardization, "ISO 9001:2000, Quality management systems – Requirements", 2000.
[25] ISO, International Organization for Standardization, "ISO 9004:2000, Quality management systems - Guidelines for performance improvements", 2000.
[26] ISO, International Organization for Standardization, "ISO 9126-1:2001, Software engineering - Product quality, Part 1: Quality model", 2001.
[27] Humphrey, W. S., Introduction to the Personal Software Process, Addison-Wesley Pub Co; 1st edition (December 20, 1996), 1996.
[28] Humphrey, W. S., Managing the software process, Addison-Wesley, 1989. [29] Humphrey, W. S., Introduction to the team software process, Addison-Wesley, 2000. [30] Paulk, Mark C., Weber, Charles V., Garcia, Suzanne M., Chrissis, Mary Beth, and Bush, Marilyn,
"Capability Maturity Model for Software, Version 1.1", Software Engineering Institute, Carnegie Mellon University, 1993.
[31] Paulk, Mark C., Weber, Charles V., Garcia, Suzanne M., Chrissis, Mary Beth, and Bush, Marilyn, "Key practices of the Capability Maturity Model, version 1.1", 1993.
[32] Curtis, Bill, Hefley, Bill, and Miller, Sally, "People Capability Maturity Model® (P-CMM®), Version 2.0", Software Engineering Institute, Carnegie Mellon University, 2001.
[33] Carnegie Mellon, Software Engineering Institute, Welcome to the CMMI® Web Site, Carnegie Mellon, Software Engineering Institute, http://www.sei.cmu.edu/cmmi/cmmi.html, 2004.
[34] Garvin, D. A., "What does 'Product Quality' really mean?", Sloan Management Review, no. 1, pp. 25-43, 1984.

___ Chapter Two _________________________________________
2. Customer/User-Oriented Attributes and Evaluation Models
2.1. Introduction
In ISO 8402 quality is defined as the ability to satisfy stated and implied needs. The main question to answer when discussing quality is “Whom will be satisfied and experience quality?”. In this section the answer is the user. We distinguish between user, customer and system-as-user of a software product. We will mainly focus on the human user as he or she is the outermost outpost in the quality chain as we will soon see. The difference between a customer and a user is that a customer experiences product quality through received information about the product but the users experience quality through their own use.
In ISO 9126:1 there are three approaches to software quality; internal quality (quality of code), external quality (quality of execution) and quality in use (to which extent the user needs are met in the user’s working environment). The three approaches depend on and influence each other as illustrated in Figure 1 from ISO 9126-1. There is a fourth approach to software quality and that is the software development process that influence how good the software product will be. Process quality may improve product quality that on its part improves quality in use.
depends on
influences process quality
effect of software product software product
context of use
depends on depends on
influences influences quality in use
external quality
internal quality
process
process measures Figure 1: The three approaches to software quality.
external measures
internal measures Quality in use measures
To evaluate software quality means to perform a systematic investigation of the software capability to
implement specified quality requirements. To evaluate software quality a quality model should be defined. There are several examples of quality models in literature (McCall et al. 1977, Boehm et Al. 1978, Bowen 1985, ISO 9126-1, ISO 9241:11, ISO 13407). The quality model consists of several quality attributes that are used as a checklist for determine software quality (ISO 9126-1). The quality model is dependent of the type of software and you can either use a fixed already defined quality model or define your own (Fenton 1997). For example, ISO 13407 is a fixed quality model directed towards providing guidance on human centred design activities throughout the life cycle of computer based interactive systems. ISO 13407 explicitly uses the definition of usability from ISO 9241:11. An example of a ‘defined own’ quality model could be Jokela et al (2002) that uses the ISO 9241:11 definition of usability as the quality model in their study. To evaluate a software product we will also need an evaluation model, software measurements and if possible supporting software tools to facilitate the evaluation process (Beus-Dukic & Bøegh, 2003).
Figure 2 clarifies how we perceive and understand the concepts of software qualities. This understanding will act as a base for the discussion in this Section. During the development process a quality model is chosen or defined based on the requirements of the specific software that is being built. The quality model is successively built into the code of the software product. The quality of the code can be measured by measuring the status of the quality attributes of the quality model. This is done by using internal metrics, for example how many faults are detected in the code. The same quality model and quality attributes are used to evaluate the external quality, but they might have a slightly different meaning and will be measured in a different way because external quality is measured during execution. In terms of fault detection, the number of failures while executing a specific section may be counted. The objective for a software product is to have the required effect in a specific context of use (ISO 9126-1) and this effect can either be estimated or measured in real use. We either estimate or measure the quality in use.
External quality is implied by internal quality and internal quality in turn is implied among other things by process quality. Therefore process and internal quality will not be discussed in this section since the user only experiences these kinds of qualities indirectly.
Quality in use is the combined effect of the quality attributes contained in all the selected quality models and quality in use is what the users behold of the software quality when the software product is used in a particular

environment and context of use. When measuring quality in use, we measure to which extent users can achieve their goal in a specific environment, instead of measuring the properties of the software itself. But this is a challenge when a customer intends to acquire a software product from a retailer. When a customer is to buy software, the customer knows about the context and the different types of users and other things that can affect the use of the software, but the software have never been employed in the real environment and it is therefore impossible to base a decision on real use. The customer has to rely on simulations and other representations of the real context and use which might require other types of evaluation methods than used in the ‘real world’. The evaluation will result in qualified estimations of the quality and effect of the software product (called Quality in use pre-measures in Figure 2).
When the software product has come in use the product meet the real environment and its complexity. The attributes of the software product are filtrated through the use context, different situation, changed tasks, different types of users, different user knowledge etc. This fact leads to that some attributes are emphasized and others disregarded by the user. Remember that the users only evaluate attributes of the software product which are used for the user’s task (ISO 9126-1). When evaluating quality in use i.e. effectiveness, productivity, safety and user satisfaction of a software product in this kind of setting other types of methods might be needed (called quality in use post-measure in Figure 2).
quality in use
process quality
internal quality in code
external quality in behaviour
Process puts in quality into the product based on a quality
Quality in use post-measures
Quality in use pre-measures Estimated effect of software
Reliability Maintainability Usability Efficiency etc.
software d t
Reliability Maintainability Usability Efficiency etc.
Reliability Maintainability Usability Efficiency etc.
Context
Interface
external internal
Experienced software quality Real effect of software product
Figure 2: Our view of software quality. We discuss issues concerning evaluation methods and measurements for evaluating software quality in terms of
three software attributes especially interesting for users. We have chosen to discuss reliability, usability and efficiency. The reason is that in ISO 9126-1 it is stated that end users experience quality through functionality, reliability, usability and efficiency and we regard good functionality as “The capability of the software product to provide functions which meet stated and implied needs when the software is used under specified conditions.” (ISO 9126-1), and this is a prerequisite for experiencing quality at all. This leaves us with the quality attributes reliability, usability and efficiency. In the reliability part the quality model ISO 9126 and several definitions of reliability is used as base for discussion. In the usability part the usability definition ISO 9241:11 is used as a quality model.
Finally, we will leave out evaluation tools as we regard it as out of scope for this Section. We conclude with a short summary stating that to be able to come to terms with software quality both quantitative and qualitative data has to be considered in the evaluation process.
2.2. Reliability
Many people view reliability as the most important quality attribute (Fenton, 1997) and the fact that reliability is an attribute that appears in all quality models (McCall et al. 1977, Boehm et. al 1978, Bowen 1985, ISO 9126-1) supports that opinion. But how important is reliability to users? Of cause all users want software systems they can rely on and reliability is most critical when users first begin to use a new system. A system that isn’t reliable will rapidly gain a bad reputation and a bad reputation may be hard to overcome later on. The risk that users avoid using parts of the system or even work around the parts is high and when users have started to avoid parts of the system it can be hard to come to terms with work-arounds later on. This is a strong argument for determining the expected use for a software system and for using the expected use to guide testing. (Musa, 1998)
We can agree upon the fact that reliability is important but what exactly is reliability and how is it defined? What reliability theory wants to achieve is to be able to predict when a system eventually will fail (Fenton, 1997). Reliability can be seen as a statistical study of failures and failures occur because there are faults in the code. The failure may be evident but it is difficult to know what caused the failure and what has to be done to take care of the problem (Hamlet, 1992).

Musa (1998) claims that the standard definition of software reliability is provided by Musa, Iannino & Okumoto in 1987. The definition says that reliability for software products is the probability for the software to execute without failure for some specified time interval. Fenton (1997) has exactly the same definition which supports Musa’s claim. Fenton says that the accepted view of reliability is the probability of successful operation during a given period of time. Accordingly the reliability attribute is only relevant for executable code. (Fenton, 1997). This means that reliability is related to failure, not faults. Failure tells us there exist faults in the software code but faults just indicate the possibility or risk of failure. Stated this way it indicates that reliability is an external attribute measured by external quality measures. We will return to this discussion shortly.
We will keep Fenton’s and Musa et al.’s definition in mind when turning to the more general definition of reliability in ISO 9126-1. There reliability is defined as “The capability of the software product to maintain a specified level of performance when used under specified conditions.” But the quality model in ISO 9126-1 also provide us with four sub characteristics of reliability; maturity, fault tolerance, recoverability and reliability conformance (Figure 3 from ISO 9126-1). Maturity means the “capability of the software product to avoid failure as a result of faults in the software” (ISO 9126-1) and fault tolerance stands for the “capability of the software product to maintain a specified level of performance in cases of software faults or of infringement of its specified interface” (ISO 9126-1). The ISO definition is broader and doesn’t mention probability or period of time but both of the definitions state that reliability has something to do with the software performing up to a certain level. The ISO definition differs significantly from the above definitions by involving “under specific circumstances”. This indicates that reliability should be measured by quality in use measurements.
Portability
External and internal quality
MaintainabilityReliability Usability EfficiencyFunctionality
Understandability Learnability Operability Attractiveness Usability compliance
Adaptability Installability Co-existence Replacability Portability compliance
Time Behaviour Resource utilisation Efficiency compliance
Analysability Changability Stability Testability Maintainability compliance
Maturity Fault tolerance Recoverability Relaiability compliance
Suitability Accuracy Interoperability Security Functionality compliance
Figure 3: External and internal quality.
Then we have a third definition also commonly used and is said to originate from (Bazovsky, 1961) but we haven’t been able to confirm it. The definition may look like a merge of the two above but it is related to hardware and is older than the other definitions. The definition says: Reliability is “the probability of a device performing its purpose adequately for the period of time intended under the operating conditions encountered”. This definition considers probability, time and context and therefore quality in use measures is required for evaluating reliability quality for a software system. The same goes for the fourth definition really is a combination of the first two as it concerns software reliability and not hardware reliability. The definition says that software reliability is “the probability for failure-free operation of a program for a specified time under a specified set of operating conditions” (Wohlin et al., 2001). This is the definition we will use as a base for further discussion.
As mentioned above, Musa (1998) is arguing for determining the expected use for a software system and for using the expected use to guide testing. This means that a reliability definition considering use and use context as an issue is appropriate. The tests will most often not take place in real use and therefore measures used to evaluate reliability according to this third definition will be of type quality in use pre-measures (Figure 2). The quality measures will probably be estimations even if there isn’t any hindrance of evaluating the software reliability during real use.
2.2.1. Evaluation Models and Measurements As the purpose of reliability models are to tell about what confidence we should have in the software (Hamlet,
1992) we need some kind of models and measurements or metrics to evaluate reliability. The process to measure reliability consists of four steps (Wohlin et al., 2001):
1. Usage specification is created and information about the use is collected.
2. Test cases are generated from the usage specification and the cases are applied to the system.
3. For each test case the outcome is evaluated and checked to determine if a failure has occurred.
4. Estimation of the reliability is calculated.
Steps 2-4 are iterated until the failure intensity objective is reached. The usage specification specifies the intended use of the software and it consists of a usage model (possible use
of the system) and a usage profile (probability and frequency of specific usage). The usage specification can be based on real usage of similar systems or it can be based on knowledge of the application itself. (Wohlin et al., 2001) Different users use the software in different ways and thereby experience reliability in different ways. This makes it difficult to estimate reliability.
It is infeasible to incorporate reliability evaluation in ordinary testing because the data causing problems isn’t usually typical data for the ordinary use of the software product. Another thing is that testing might for example count faults but there isn’t any direct correlation between faults and reliability, however counting numbers of faults can be useful for predicting the reliability of the software. (Wohlin, 2003) But by usage-based testing we can relate reliability to use. Usage-based testing is a statistical testing method and involves characterizing intended use of the software product and also to sample test cases randomly from the use context. Usage-based testing also includes knowing if the gained outputs are correct or not. Usage-based testing also contains reliability models. (Wohlin et al., 2001)
To specify the use in usage-based testing there are several models that can be used. Operational profile is the most used usage model. (Wohlin et al., 2001) The operational profile consists of a set of test data. The frequency of the test data has to equal the data frequency in normal use. It is important that the test data is as ‘real’ as possible otherwise the reliability will not be applicable to real use of the system. If possible, it is preferable to generate the test data sets automatically but it is a problem when it comes to interactive software. It might also be difficult to generate data that is not likely to occur. The most important issue to consider is if the test data really is representative for the real use of the system. (Wohlin, 2003)
The user’s role in the reliability process is that they set the values of the failure intensity objectives and they are also involved in developing operational profiles (Musa, 1998). Involving the users might be a way to ensure that the data sets are appropriate. The most common mistakes when measuring reliability is that some operations are missed when designing the operational profile or the test isn’t done in accordance with the profile. Then the estimated reliability isn’t valid for real use of the software. (Musa, 1998) To be able to decide for how long a product has to be tested and what effort to put into the reliability improvement some failure intensity objective is needed to be able to decide if the desired level of reliability is reached. (Musa, 1998) If there is a statistical data sample based on simulated usage it should be used for statistical testing which among other things also can help appointing an acceptable level of reliability for the software product. The software is then tested and improved until the goal is reached. (Wohlin, 2003)
The next step (4) in evaluating reliability is to calculate the reliability by observing and counting the failures and note the times for the failures and then eventually compute the reliability when enough failures have occurred. For this we need some model. Reliability models are used to estimate reliability. Reliability models use directly measurable attributes to derive indirect measurements or reliability. For example time between failures and number of failures in a specific time period can be used in a reliability model to estimate software reliability. (Wohlin et al., 2001)
Reliability growth models may help providing such information (Wood, 1996). Hamlet (1992) differs between reliability growth models and reliability models. According to Hamlet reliability growth models are applied during debugging. They model repetitive testing, failure and correction. Hamlet’s opinion differs from for example Fenton’s (1997) opinion that says that reliability growth models are to be applied to executable code. Instead Hamlet (1992) means that reliability models are applied when the program has been tested and no failures where observed. The reliability model predicts the MTTF (Mean Time To Failure). In this presentation we will adhere to Fenton’s point of view.
A reliability growth model is a mathematical model of the system and shows how reliability subsequently increases as found faults are removed from the code. The reliability growth often tends to flatten during time as frequent faults are discovered. There are two types of reliability growth models, equal-steps and random-steps. In an equal-step reliability growth model the reliability increased with equal step every time a fault is detected and removed. In a random-step reliability growth model the reliability randomly falls a little bit to simulate that some removal of faults results in new faults. The most appropriate might be the random-step growth model because reliability doesn’t have to increase when a fault is fixed because a change might introduce new faults as well. (Wohlin, 2003)
There are some problems with growth models. One thing is that they sometimes take for granted that a fix is correct and another problem is that they sometimes suppose that all fixed faults contribute to increase reliability. (Wohlin, 2003) That isn’t necessarily true, because perhaps the fixed faults were small and had a very little impact on how the software performed.
The relationship between the introduced concepts is shown in Figure 4.

Operation
Modeling Estimate
Usage specification Software reliability model
Data Sample
Usage-based testing
Figure 4 ( from Wohlin et.al, 2001) For the readers interested in more details concerning models is recommended to read “Software Reliability”, in
Encyclopedia of Physical Sciences and Technology (third edition), Vol. 15, Academic Press, 2001 written by C. Wohlin, M. Höst, P. Runeson and A. Wesslén.
2.2.2. Evaluation Models and Measurements The reliability attribute has a long history. As we have seen reliability is strongly merged with failures and fault
tolerance and therefore it might be natural to mainly reach for quantitative data in the evaluation process. But there are issues worth mention that haven’t come to surface in the presentation above. Even if we focus on reducing the software failures we have to reflect over which types of failures occur. Some failures can have greater effect on the quality in use than others and such failures must be identified and fixed early to preserve the experience of high quality. It can be difficult to discern such failures without inquiring users working with the system. But as we have seen that an estimation of the system’s reliability often is needed before the system come in real use and it is here the operational profile is helpful. It is also possible to evaluate the quality in use for similar systems in real use and use quality in use post-measures to improve another software product.
There are also other issues that can influence the experienced quality. For example less influential failures can in a specific context be experienced as worrisome to the user even though it isn’t anything to worry about. The conclusion is that to be able to evaluate and improve the reliability by using reliability growth models in an efficient way additional qualitative studies using quality in use post-measures may be needed to be able to prioritize in a way that support the users and increase the experienced software quality.
2.3. Usability
2.3.1. Introduction The aim of the usability part is to provide a well grounded understanding of what usability means from an
industrial perspective. To accomplish this, a real world example of usability needs is applied. In the end of the road usability metrics are developed to satisfy industrial needs, but what does that mean in practice? A lot of research contributions have been produced so far, but how does these meet industrial needs? What does the industrial history written by practitioners reveal? How useful are usability metrics when applied in an industrial case? These are empirical questions and should be treated as such. In the present usability part one industrial account of what usability metrics might mean is provided together with an historical view of lessons learned by other practitioners.
The usability part is built up as follows. First an overview describing problems with approaching usability is presented. Issues are: transforming research results, qualitative versus numeric needs, and practical design needs versus scientific needs. Second, the industrial company and their usability metrics needs are presented, where management from the industrial company puts forward a number of questions about usability metrics. Third, usability is defined. Fourth, an industrial case of applying usability metrics in the presented company is described. Fifth, the results from the industrial metrics case are questioned. Sixth, the field of usability tests as understood by practitioners is visited. Seven, conclusions are made based on both the industrial case and the practitioners historical account. Finally, the questions from the industrial management are addressed.

2.3.1.1 Overall View During the latest decades there have been intensive researches in methods improvement with the aim to increase
the quality and usability of software products. Serious problems have been revealed both in the developments of software and the introduction of applications in work life. Development projects fail, applications of poor quality are delivered at sky-high costs, and delivered software products demonstrate technical shortages and often are difficult to understand and use (Fuggetta, 2000). It is also known that people who are the subject to poor software tools get ineffective in their usage and work, burden, irritated and stressed. One explanation to ‘bad’ technology is that ‘end-users’ are not in the focus of innovation and re-organization work. It has also been stated that software development organizations sometimes consciously use fuzzy concepts or blurred definitions when refereeing to ‘usability’ in their development work; with the aim to make it difficult for stakeholders to put demands on it (p.57 Gulliksen and Göransson, 2002). For many industrial practitioners who have approached usability it also turns out to be a methodologically complex issue to handle for: end-user representation and participation during developing mass market products, trustworthiness of end-user representations, understanding end-user techniques, high level management support (Grudin, 2002; Pruitt and Grudin, 2003), branch related external reasons (Rönkkö et al. 2004), ignorance, internal organization, politics, societal changes, and diffuse power groups (Beck, 2002). All these are identified issues that complicate the understanding of how to incorporate end-users in a methodology. Obviously, ‘usability’ is a multifaceted challenge.
2.3.1.2 Transforming Scientific Results Together with this multifaceted challenge there also follows other concerns of a more general methodological
nature. Historical reviews and future challenges were identified in the volume that marked the millennium shift in software engineering. One concluding account was that an unsatisfactory situation remains in industry, this despite decades of intense research within a diversity of research communities focusing on software quality (Fuggetta 2000; Finkelstein and Kramer 2000). It seems to be one thing to find solutions as a researcher and another to be able to combine and transform research results in industrial practice (Finkelstein and Kramer 2000). Why and how problems in industry do not fit with the different academic research results remained an unsolved challenge.
2.3.1.3 Qualitative Textual Results vs Numeric Development Needs One part of the above described challenge of transforming research results is the problematic of understanding
and transforming the complexity of users’ ‘worlds’ to the simplicity needed in the software development process. A fundamental methodological disagreement and challenge between proponents of traditional requirement elicitation techniques and contextual elicitation techniques is recognized here (Nuseibeh and Easterbrook, 2000). In the latter perspective, the local context is vital for understanding the social and organizational behavior. Hence, the requirement engineer, usability researcher, usability tester, etc. must be immersed in the local context to be able to know how the local members create and refine their social structures. The complexity in context is hard to capture in any other form than textual ones, i.e. stories from the field.
Context is also multifaceted and multithreaded, whereby the results change with the chosen stakeholder-perspective applied. In the former, the elicitation techniques used are based on abstracted models independent of the detailed complexity in context (Ibid.). For obvious reasons the end-users’ ‘worlds’ includes local context; and usability is about how to satisfy end-users within their local context. Whereby, approaching usability per definition has been part of this historical requirements and software engineering methodological disagreement. If combining ‘contextual’ requirements techniques with ‘abstract’ development practices, the problem becomes that of -how to relate the qualitative form of result and outcome from immersing oneself in a local context to the abstracted and independent form of input requested in a software development process? Industry unavoidably confronts this difficulty when introducing ‘usability’ in their organizations, whereby questions about measurement and metrics raise. In the next Section 2.3.1.4 questions asked by industry are presented, and in Section 2.3.8 an academic answer is provided.
2.3.1.4 Practical Design Needs vs Scientific Validity Needs Another fundamental methodological misunderstanding that has been discovered is the mismatch between
‘practical design needs’ and ‘scientific validity needs’. One methodological problem area that has struggled with both challenges for more than a decade is usability test (Dumas and Redish, 1999). This area will be elaborated in the forthcoming discourse, were real world examples capturing industrial question marks and needs of usability metrics is discussed. The examples touch upon the nature of both a mismatch between ‘practical design needs’ and ‘scientific validity’ and how to handle qualitative results gained from ‘immersing oneself in a local context’ to reach the ‘abstracted and independent form of input requested in a software development process’. Together these challenges demonstrate methodological complexity that follows with approaching ‘usability metrics’.
2.3.2. Visiting ‘Industrial expectations on usability metrics’
2.3.2.1 The Company UIQ Technology AB is a young, internationally focused company. It was founded in 1999, and has more than
130 employees in Ronneby, Sweden. It is a fully-owned subsidiary to Symbian Ltd (UK). The company develops and licenses user interface platforms for mobile phones using the Symbian OS. The product, UIQ, is a user-friendly and customisable user interface for media-rich mobile phones based on Symbian OS. The company operates in a competitive environment with powerful opponents. UIQ Technology develops and licenses user-interface platforms for leading mobile phone manufacturers, in this way supporting the introduction of new advanced mobile phones on the market. Its main assets are technical architecture, a unique product, an independent position (i.e. not being directly tied to a specific phone manufacturer) and experienced staff. Its customers are mobile phone manufacturers. Some of the leading handset manufactures using UIQ in their advanced mobile phones are Sony Ericsson (P800 and P900, P910), Motorola (A920, A1000) and BenQ (P30 smartphone).
2.3.2.2 Expectations on Usability Metrics In the ongoing research cooperation with UIQ Technology AB the following question was put forward 2004
from the academia to the management: ‘-what kind of help do you need in the subject of usability metrics’. Strikingly, the answer strongly concerned how to abstract local context related information so it can be used as independent information in their software development process: In what ways is usability a measurable unit? -How do we solve the problematic issue to reach objective results from subjectively measured information during usability tests? –How can we put a number on learn ability, efficiency, usability and satisfaction, etc.?-How do we actually compare, weigh, and relate such usability aspects to reach a good product? (Manager Interaction design team 2004-10-05).
The company had some experiences from usability metrics through a metrics project carried out 2001 in one development project. The metrics project demonstrated that the ‘feeling of being experienced’ user of their product increased during the test series. The usability scale ‘SUS – A quick and dirty usability scale’ (Brooke 1986) was used in this project together with an in house developed user test capturing some core issues of their applications. Another part of their answer related to the decision of which contextual information is relevant: -Which end-users should be included? –How do different choices of target groups, their characteristics, knowledge and experiences affect the results? –What about the context or lack of context? (Ibid.) Together with above questions there also followed questions that were of an epistemological nature: If usability is measurable, what does it actually demonstrate? (Ibid.) Note that this question is a reflexive7 question and meant measurable in a way that accounts for the specific circumstances and needs in UIQ Technology’s circumstances. Hence, it refers to their ‘general mass market end-user’ and the rich amount of qualitative information experienced by a interaction designer in, for example, a usability test situation (that is not easily captured and revealed to others through the use of numeric quality attributes).
Other questions were related to the area of marketing: Does the same usability test demonstrate aspects that can be used in marketing and sales purposes? Is it possible to label a by us usability tested UI product, and market our developed method used for this purpose, in the same manner as some successful movements managed to label concerns for ethic and nature? (Ibid.) Today there exist groups of organized and unorganized people that preferably buy, for example, financial services with responsible social action, products produced in a way that respect ethical considerations and human rights, and products produced with respect and care for the nature. Obviously, such constellations of power groups are influential consumers and marketers of products; and the questions put forward was if ‘usability’ could engage people’s choice of technology in a similar way, and if they could establish this method to be a ‘standard’. All these are questions that points to the multifaceted challenge of handling usability metrics. Through elaborating answers to the questions put forward above, a broader understanding of usability, usability metrics, and the initially introduced methodological conflicting interests, becomes clearer. Year 2004, a new metrics project has been the subject of discussions in UIQ Technology AB. The new project is considered to be based on the ‘SUS - A quick and dirty usability scale’ as they already have practical experiences of this evaluation method. The above relation to marketing and sale issues has high priority. Later in this text the questions put forward by UIQ are answered from an academic point of view aimed to provide an overall understanding of usability metrics.
2.3.3. Defining Usability The definition of usability ISO 9241:11 was used in UIQ Technology’s metrics project as the quality model. In
that standard usability is a measurable attribute, but what does that actually imply for practitioners acting under real
7 A reflexive formulation includes the conditions of its production at the same time as it makes those conditions observable (for a member) as an act of a recognizable sort.

world contingencies? In general, usability as a quality attribute has attracted growing interest the recent ten years and continues to do so. Today usability brings together technical fields as participatory design, human factors psychology, human computer interaction, software process, and requirements engineering together among many other areas. All share the same goal to focus on users and make usable products. This diversity of fields is both strength and weakness. It becomes strength if different areas learn to work with each other, and becomes a weakness if they don’t. In the latter case a blur of definitions, concepts, perspectives and strives captured in very similar terminology, will exist. The interested reader is pointed to some of the existing method and methodology books in the subject (Nielsen 1993; Cooper 1999; Rosson and Carroll 2002; Vredenburg et al. 2002). This discourse will, as already mentioned, instead focus on elaborating usability. This discourse starting in the definition from ISO 9241:11 presents usability compared to chosen real world contingencies that usability practitioners meet. The aim is to understand usability and usability metrics under the prevailing methodological constraints that industry confronts.
2.3.3.1 ISO 9241:11, 1998 If perceiving the ISO as one standard built up of many sub standards, there exist two important standards that
concerns usability of interactive systems, ISO 9241:11 and ISO 13407. The former is the definition of usability and the latter a guidance for designing usability. The Human-centered process for interactive systems ISO 13407 describes usability at a level of principles, planning and activities; and it uses ISO 9241:11 as its reference for understanding usability. In an interpretative analysis of the two standards performed by Jokela et al. (2003) it was concluded that ISO 13407 only provided partly guidance for designing usability; the descriptions of users and environments are handled, but very little is mentioned about the descriptions of user goals, usability measures, and generally for the process of producing various outcomes (Ibid.). Further there exists a high level of complexity in the subject since products often have many different users were each of them may have different goals, and the levels of sufficient effectiveness, efficiency and satisfaction may vary between users and goals. The same people that are users at their workplace might also be ‘home users’ of the very same product during their spare time, i.e. same users change role, context and goals. Few research results exist on how to manage such complexity of determining usability (Ibid.). Jokela et al. have by own judgment successfully determined usability using the standard definition of usability in ISO 9241:11 as the only guideline for the process, this as ISO 13407 did not provide the support expected. Following Jokela et al.’s recommendation only ISO 9241:11 will be used to in the continuation of the present discourse. This quality model was also already connected to UIQ Technology’s in the metrics project. This latter definition of usability also seems to position itself as the main reference concerning usability in literature (Ibid.).
The definition of usability in ISO 9241:11, 1998 is: The extent to which a product can be used by specified goals with effectiveness, efficiency and satisfaction in a specified context of use.
• Effectiveness: The accuracy and completeness with which users achieve specified goals.
• Efficiency: The resources expended in relation to the accuracy and completeness with which users achieve goals.
• Satisfaction: Characteristics from discomfort, and positive attitude to the use of the product.
• Context of use: characteristics of the users, tasks and the organizational and physical environment.
Obviously, this is a definition that places the user interests in the first room, and does not consider usability an
absolute quantity; it is rather a relative concept. The guiding sub attributes to reach usability are: accuracy, completeness, resources expended, discomfort and attitude to use. These can only be understood in reference to the characteristics of the user, i.e. his/her goals with tasks within a specific social, organizational and physical environment.
2.3.4. Visiting an ‘Industrial Metrics Experience’ At UIQ Technology a metrics project was carried out 2001 in one development project. A mixed usability
evaluation tool was used. The first part of the evaluation tool was developed by the former usability researchers Mats Hellman (today manager of interaction design team) from UIQ Technology AB, Ronneby together with Pat Jordan from Symbian, London. This part constituted six use cases to be performed on a high fidelity mock-up (Retting 1994) within decided time frames. The usability scale SUS (Brooke 1986) based on ISO 9241:11 was the second part of the evaluation tool. The latter was chosen based on the facts that it is simple to understand and use, and provided with an already established creditability in the usability community. SUS is a ‘simple’ ten-item Likert scale providing a view of subjective assessments of usability. In this scale statements are made indicating the degree of agreement or disagreement on a 5 point scale. The technique used for selecting the items for the scale is to identify the things that lead to extreme expressions of attitude; consequently extreme ends of the spectrum are
preferred. If a large pool of suitable statements is used, the hope is that general agreements of extreme attitudes exist in the end between respondents.
When the SUS part of the usability tests were introduced to the respondents in the test situation they had used the evaluated system in the first use case part of the test. In the SUS part immediate responses were recorded, i.e. only short time for thinking about each item was accepted. Afterward each test a short debriefing discussion took place.
The tests were repeated three times with the same seven respondents in each test during a development projects proceeding. The official aim was to gain an answer of how mature the chosen parts were perceived to be by an end-user in relation to different phases of the development’s proceeding. Another aim was to get experiences from working with usability metrics. Six use cases should be completed by a user at each occasion, and then ten questions answered. Use cases:
- adding the details of a person to the contact list (210 seconds), - viewing a booked meeting to find location (30 seconds), - add a item to the agenda (210 seconds), - send a SMS (60 seconds), - set an alarm (180 seconds), - making a call from contacts (30 seconds).
Questions: - I think I would like to use this system frequently, - I found the system unnecessarily complex, - I thought the system was easy to use, - I think that I would need the support of a technical person to be able to use this system, - I found the various functions in this system very well integrated, - I thought there was too much inconsistency in the system, - I would imagine that most people would learn to use this system very quickly, - I found the system very cumbersome to use, - I felt confident using the system, - I needed to learn a lot of things before I could get going with this system.
The tests were performed using an emulator on a laptop with touch screen (2001 there did not exist any released advanced mobile phones with the UIQ platform). For each completed use case one point was scored. Each question could score between zero and four. An overall metric was derived which was weighted 50% on the tasks (first part) and 50% on the attitudinal measure (second part), calculated as follows [(number of core tasks completed/6) x 50) + ((attitudinal measure/40) x 50]. The presented result and metrics was that the total user system verification average from test one to test three had increased from 68,3% to 79,9%.
2.3.5. What did the metrics imply? The resulting metrics from the usability test demonstrates a progress. But what does the progress actually
imply? In what ways did the usability method provide useful knowledge and to whom? If starting with reference to ISO 9241:11 relevance of the method could be questioned. How did such laboratory test relate to the identified users and their context of use? Which were the organizational, physical, and social contingencies in which real world users’ act?
2.3.5.1 User, Context and Goals Within this set of tests the present author constituted one of the seven users. In the role of user I was confused.
Fragments of an, for me, unknown system were presented and the time it took me to accomplish specific tasks was clocked. After this first part of the test a situation followed a situation where the attitude of handling these fragments was to be provided. Notes made after the three tests reveal existing end-user confusion about what the statements: ‘I would like to use this system frequently’, ‘its complexity’, ‘easy to use’, well integrated’, etc. actually meant? The following questions was noted after the test occasions: – where?, in which situations?, under what circumstances?, private?, in which role?, when practicing private interests?, at work?, with which aims?, in a hurry?, a critical situation? Obviously, the context and goals of use was missing.
The situation and context of the test was constituted by the laboratory situation itself. In what ways the chosen end-users actually did constitute end-users could be asked. Consider some tasks in the test: adding a person’s details to the contact list (210s), a SMS (60s), etc. The user and context of course make a difference for the design. For example, if the targeted end-users were people working in time critical situations, i.e. police, firemen, doctors on the road, nurses or ambulance men that needed to send SMS, or make critical calls from contacts in stressed and messy situations makes a difference. What if the end-users were senior citizens, or disabled in some way? How do the pre-chosen information-fields of persons details fit with the information a youth wants to use and uses anyhow in their

social interaction? What items does a single and working mother want to capture and use to ease the existence and planning of her life? What items does a plumber want to capture and use to ease the craft work? Working with usability without specified end-users risks ending up as in the same problematic as the classical car example so nicely demonstrates, i.e. ending up in a car that is both a sports car, truck, bus, and family vehicle. Such a car might satisfy a lot of identified user needs, but does actually not support any single user category. Who want to use and buy such a car?
2.3.5.2 Mobility and Touch and Feel The system in question was a mobile one. What does mobility actually mean?
• does it mean to be physically moving holding a digital device in the hand?, • or does it mean to travel away for periods of longer time?, • or perhaps to travel on a daily basis within a routine round? • Does the place of use make a difference? • What if you are performing a task standing on a crowded market place contra if you are sitting alone in
your sofa at home? • What if, who ever the end-users is, the task is to be performed standing in a moving crowded bus? Working on the emulator in the laboratory excluded both the ‘touch and feel’ of the artifact as well as the
mobility aspect.
2.3.5.3 Validity Then there is also the question of validity. How many respondents does it take to get a valid result? Is seven
respondents enough? How many tests have to be performed to be sure? Is three test occasions enough? What is the difference between less formal usability testing and active intervention contra formal usability testing? What is an adequate placement of this specific test series? Obviously it is difficult to understand what the numbers stands for, therefore it could be asked -what use could anyone have of the reached numeric result? What if the test produced another format than numbers as the result? Would a test in which there were no quantitative measures qualify as usability test?
2.3.5.4 Still, a Useful Result Was Produced What was left for the respondents to act upon in the laboratory setting at UIQ Technology was to, within a
specified time, figure out and accomplish selected tasks within a preplanned set of possible procedures. Still, the lack of context, user identities and user goals does not mean that the performed test did not provide useful information. In this case progress was revealed, i.e. the maturity of the growing system was confirmed. And the test leader got a lot of informal reactions and comments on the forthcoming system from different people. All thanks to the arranged test situation. Before continuing with academically answers to an overall understanding of usability metrics, let us take a look at some of the historically reached knowledge in the field of usability testing.
2.3.6. Visiting the ‘Field of Usability Testing’ Dumas and Redish (1999, p.26) are two practitioners that have practiced usability testing for more than a decade
and authored books in the subject. These authors have summarized the development that taken place in usability testing up to the millennium shift.
2.3.6.1 Historical Snapshots The community continues to grow with people from a wide variety of disciplines and experiences. The practice
have evolved from formal tests in the end of a process to informal, iterative and integrated tests. Usability has become more informal and practitioners are relying more on qualitative data than on quantitative data. The efforts made are more focused on identifying problems and less on justifying the existence of problems. It is also more accepted that the value of usability testing is in diagnosing problems rather than validating products. Many specialists are doing more active intervention, i.e. probes respondents understanding of whatever is being tested. In this way it is reached a better understanding of participants’ problems, and evolving mental models of the product.
The borders among different usability techniques are also blurring, when a team goes to a user site to observe or interview they might just as well present a few scenarios for the users to try out. Hence it is difficult to know if it is contextual enquiry, task analysis, or usability validation. A greater realization exist that it is not needed large number of respondents to identify problems to be fixed. Due to the earlier involvement and iterative nature of the test process typically three to six people have demonstrated to be useful and large enough sample. In Dumas and Redish’s opinion some basic quantitative measures are necessary to substantiate problems; quantitative measures such as number of participants who had problems, wrong choices, time to complete tasks, etc are needed. They also suggest that at least two or three people representing a subgroup of users are the minimum number to avoid that the

behavior captured are idiosyncratic. The reporting from usability tests have become much less formal, often small notes on the major findings and a few rows of recommendations are all that is reported. The reasons to above described development are: pressure to do more with fewer resources, that usability testing has become more integrated with the development process, ever more rapid development and release cycles, that usability specialists and those that act on their results have more confidence in the process and its results.
2.3.6.2 Formative and Summative Evaluation Models Obviously usability testing has matured as an own practice in industry; it has distanced itself from the early
ideas that were closer to research study. Comparing terminology between usability testing and research study demonstrates the distance: Diagnosing problems versus validating products; it is convenience sample versus random sample; it is small sample versus large sample (Ibid.). Different forms of usability intentions have been formulated. Formative evaluation model is ‘user testing with the goal of learning about the design to improve its next iteration’ (Nielsen 1994). This implies a collection of "find-and-fix" usability engineering methods that focus on identifying usability problems before the product is completed. Formative evaluation can be contrasted with summative evaluation model, which affords a quantitative comparison between an own product (most often a completed product) and a competitive product or an identified quantitative standard (i.e., measurable usability objectives) (Rohn et al. 2002). The difference in terminology gives information about different uses and needs, and the questions what usability is could be asked again. The answers will depend on perspective taken and planned usage, usability mean different things depending on stakeholders’ interest in how to use the usability result.
2.3.6.3 Practitioners’ Definition of Usability With above development in practice it is interesting to know how these authors and practitioners define usability
(Ibid., pp. 4-5). 1. Usability means focus on Users. 2. People use products to be productive. 3. Users are busy people trying to accomplish tasks. 4. Users decide when a product is easy to use.
This is a quite open definition, perhaps more a guideline than definition. To focus on users means that you have to ‘work with’ people who represent actual or potential users, and realize that no one can substitute for them. People consider products easy to learn and use in terms of - time it takes to do what they want, - number of steps they go through, and - their success in predicting the right action to take. People connect usability with productivity, and their tolerance for time spent learning and using tools is very low. Products must be consistent and predictable to make it worth the effort to learn and use them, and usability testers must find out how much time a user is willing to spend figuring out the product. Perhaps the most important realization is that it is the users, not the developers or designers that determine when a product is easy to use.
2.3.7. Fragments Left So unsurprisingly, despite the logical fact captured in ISO 9241:11, 1998, that it is impossible to specify the
products fitness for its purpose without first defining who the intended users are, the goals and tasks those users will perform with it, and the characteristics of the organizational, physical and social environment in which the tasks will be used, shortcuts are necessary in practice. The described choices of delimiting ‘real world features’ bears witness to the complexity practitioners stands in front of when approaching usability. This is exemplified by the UIQ Technology’s metrics situation: a mass market product with a continuously evolving technology and decreasing prices, this technology also change the society and culture in unpredictable ways (e.g. SMS, MMS, video phone), together with a general end-user that in its turn have usage area that is only delimited by our imagination. These features do not in themselves provide obvious or natural bounders for framing use. Also in Jokela et al.’s (2003) application of ISO 9241:11 it was decided to exclude parts, i.e. for reasons of being able to handle the complexity they excluded the environment from their tests. Dumas and Redish’s (1999) historical revisit witnessed of both a maturity and a pragmatic adjustment towards a tougher industrial climate. And even if somebody would take on the challenge to consider all influencing factors, a new problem will arise: would it actually anyhow be possible to really know what factors affected what? In this light a practical view seems adequate. It is better to determine some chosen parts of usability factors somehow than not determine them at all.
2.3.8. Implications for a ‘Metrics Project Suggestion’ This usability metrics discourse had its starting point in one question raised by academia to industrial
management: what kind of help do you need in the subject of usability metrics? In this part short answer based on present discourse is provided. In this way aimed to support industrial future needs of metrics.

2.3.8.1 Objectivity and Numbers on Subjective Material -How do we solve the problematic issue to reach objective results from subjectively measured information during usability tests? –How can we put a number on learnability, efficiency, usability and satisfaction, etc.?-How do we actually compare, weight, and relate such usability aspects to reach a good product? (Manager Interaction design team 2004-10-05) The answer to the first question is a counter question: -Why is objectivity an issue? The lessons learned in the
field of usability tests pointed to the fact that design and science have different contexts and different objectives. Metrics for design aims at diagnosing problems whereby a ‘find and fix’, i.e. a formative evaluation model is to be strived for. From a natural sciences perspective objectivity is an issue for ensuring validity of research results. For all practical design purposes the natural science understanding of objectivity can be ignored when putting numbers on design attributes as learnability, efficiency, usability etc. The idea is that, if the design process needs numbers on attributes then put numbers on them. Still, how these numbers might be compared and weighted depend on trustworthiness of them. Then the question again in a sense becomes the one of ensuring validity and thereby reaching objectivity, i.e. trustworthiness. In social science influenced by natural science, a large random sample is needed to reach scientific objectivity and validity. But how large samples a design attribute needs to be valid is not a scientific issue, instead it depends on its targeted audience and their claims.
As already described, practitioners have stated that at least two or three people representing a subgroup of users are the minimum number to avoid idiosyncratic behaviour.
This sample has demonstrated to be enough, at least if the aim is to find indications on troubles with the design of a growing product during a project. In the world of industrial design the audience often is internal managers, some designers and external clients. Hence, the answer is related to its purpose, it depends on what function these metrics are meant to fulfil and how they are used. The rule of thumb seems to be: the larger claims and target group that have to be convinced, the more rigour and larger samples are needed.
2.3.8.2 End-User Categorization -Which end-users should be included? –How do different choices of target groups, their characteristics, knowledge and experiences affect the results? –What about the context or lack of context? (Ibid.) The first question is a question of deciding target group, i.e. normally a question for management, sales
departments and clients. In UIQ Technology’s case this issue is complicated because they are placed in the bottom of the food chain of a mass market; their mission is to provide actors in the telecom branch with a general user interface platform. Hence they have to handle multiple clients simultaneously, competing clients that apply own design and mixed solutions, and also clients that might use UIQ Technology software partners applications. These are clients that in their turn might be dependent on mobile operators’ opinions and very tight marketing windows to launch their products (see Rönkkö et al. 2004). Hence the ‘normal’ situation for management, sales and clients in UIQ Technology’s case is complicated by the web of stakeholders and multiple requirements to consider. At some occasions the Interaction Design team themselves team are the ones best acquainted to predict future design needs. This is due to that they are continuously involved in following users demands, needs and trends for future technology.
The following sub-questions in Section 2.3.8.2 are answers that have to be sought through empirical studies. It is interesting how the search of answers to these empirical questions relate to a hermeneutic (Anderson 1997) understanding of objectivity as the previous questions, in Section 2.1, was much related to the natural science understanding of objectivity. From an ethnographic (hermeneutic) view, objectivity means a different thing than that in natural science. The critical divergence of interest between natural science and hermeneutic objectivity in the design related questions above is actually not between science and subjectivism (i.e. the objectivity issue in natural science); it is between rationalistic conceptions of purpose, goals and intention of studied people and an empirically grounded, behavioural approach to the problems that studied people encounter and the solutions they manage.
In the latter ethnographic view, this issue is not the problem of a valid answer as in natural science, but that of a valid question. Thus interaction designers can ask questions about the necessity of existing ‘work around’ discovered in a test of a product, such as why it is that such a ‘work around’ is in existence, and why is it is that such use is largely invisible to many other industrial designers or their products produced? The questions ‘new’ take arise in the first place not only because some fieldwork has been done but also because a particular analytic stance is taken, i.e. usage from members’ point of view. This stance has to do with the investigation of ordinary, practical and mundane issues encountered by users of mobile products as they go about their work, i.e. the problems they encounter and the strategies they adopt. Dumas and Redish’s (1999) historical revisit of usability tests in industry witnessed of a movement from quantitative data towards qualitative data. Pruitt and Grudin’s (2003) efforts in implementing usability in a mass market product exemplify how ethnography plays an important role to reach trustworthiness of qualitative empirically grounded design material.
2.3.8.3 Is Usability Measurable? In what ways is usability a measurable unit? (Ibid.) The idea of measuring usability is to gain units or results useful for design. Hence the two ideas of objectivity
described above are at work here. What benefit are there of usability measures and their resulting units if they are not trustworthy? Sections 2.3.8.1 and 2.3.8.2 above described the objectivity problem in relation to measuring usability. The natural science stance makes claims on large random samples to produce objectivity to rationalistic measures (first section), i.e. towards quantitative comparisons and use of a summative evaluation model. If the question of measurable unit instead is directed towards reaching units for diagnosing problems, a different approach and result will appear (second section, second part), i.e. when learning about the design to improve its next iteration the use of a formative evaluation model is preferred. Measures of usability in this latter approach is not interested in valid answers to rationalistic conceptions of purpose, goals and intention of studied people as in the natural science approach, but that of identifying valid questions. The point is, when you have found the valid usability questions you have also found valid design problems of relevance from the studied people’s (end-users) point of view. This latter qualitative (hermeneutic objectivity) measure of usability is built upon the idea that the investigators knows what others do not and cannot know as they lack the personal field experience of the investigator. The objectivity in the measured usability unit in this latter perspective comes precisely from –the members’ point of view that is reached through the investigator becoming intimately familiar with the setting studied. So far in this section two ways of reaching trustworthy measurable usability units have been presented as answer to ‘in what ways usability is a measurable unit’. Both perspectives are strongly connected to different ramifications in science. There exists a third ramification connected to industrial design.
When applying usability as a measurable unit in industry both scientific perspectives are relevant as they warrant or provide scientific trademark on usability efforts made. But a more pragmatic design perspective can also be identified as being just a ‘faint shadow’ of both scientific perspectives. The development in the field of usability tests provides traces about such a historical development (Dumas and Redish 1999). The industrial practice in the field of usability tests have evolved from formal tests in the end of the development process to informal, iterative and integrated usability tests. There is more focus on diagnosing problems through qualitative data than on validating products based on quantitative data. The borders among techniques are blurring. Small numbers of respondents are used and tests might result in just a few rows of recommendations. For all practical design purposes the scientific claims of objectivity are often ignored, i.e. fewer resources, better integration with development process, and ever more rapid development and release cycles, together more confidence in results reached are reasons identified. In the industrial world the audiences who judge the trustworthiness of usability results often are internal designers, managers and external clients. How large and random samples a design attribute needs to be valid, or to which extent a usability tester must immerse himself or herself with the respondents world, is no longer a scientific issue. Instead it depends on its industrial stakeholders’ practical concerns context and claims. ‘Practical design needs’ and ‘scientific objectivity needs’ obviously differ, and influences the question of in what way usability is a measurable unit (as described above).
2.3.8.4 Usability Tests and Marketing -Does the same usability test demonstrate aspects that can be used in marketing and sales purposes? Is it possible to label the by us usability tested UI products in the same manner as some successful movements managed to label concerns for ethic and nature? If usability is measurable, what does it actually demonstrate? (Ibid.) If an answer is to be derived from this discourse it is, yes and yes on the first two questions. As already
mentioned in Section 2.3.8.1, such an answer is related to its purpose and consequently depends on what function the metrics in question are meant to fulfil. The desire to perform a comparison between an own product and competitive products implies that a summative evaluation model is adequate. The question concerns the validity of a usability test and its results. The rule of thumb was; the larger claims and target group to convince the more rigour and larger samples are needed. Thereby it seems as the scientific ideas of objectivity have reinforced its status through this desire. Usability tests that have followed rigour scientific procedures gain both high status and trustworthiness. And if a product successfully passes rigorously handled end-user tests better than competing products there appears a marketing possibility.
Another less scientific, more pragmatic and speculative marketing possibility would be to start from a strong marketing position in some aspect compared to the competitors and claim that –we reached this position through the applying this usability test, and look, we are still the best in test! In this case, it is the fact that they have positioned themselves in a leading position on the market that creates the high status and trustworthiness.
2.3.9. Summary Comments and Acknowledgement In this section it is revealed and discussed challenges that demonstrate the methodological complexity that
follows with approaching ‘usability metrics’ in industrial context. This report is considered to provide a theoretical starting point for practical usability metrics projects.
Special thanks go to the Mats Hellman manager of the ID team for asking the industrial questions which have made this report possible. Mats have also given valuable reflections on the questions asked and the answers provided. Also thanks to those, management, marketing and sales people who provided with their opinions on the industrial questions asked.
2.4. Efficiency (Interactive Performance)
2.4.1. Introduction In this Section, we will discuss tradeoffs and tradeoff-techniques for performance in interactive applications,
used by people (as opposed to computers). The area is by itself very broad, ranging from research in human-computer interaction, through operating systems research and into areas such as computer architecture and programming techniques.
One interesting issue making the matter more complex is that interactive performance is not solely centered on computers. In the end, computers are just tools which humans use to get tasks performed. The most important thing is therefore the performance of the person, i.e. how quickly and effortlessly the person gets the task done. With this in mind, it is easy to see that interactive performance is also highly connected to the user-interface design. Particularly bad UI-design might even cause pen and paper-based methods to prevail over computer applications.
There are many other examples where interactive performance can be a problem, and we will list a few here. On the very low end, a large delay between keyboard input and output of characters on the screen is a very frustrating situation. Although uncommon with modern high-performance computers, this can still be noticed when working on a remote system over a slow connection. Another, more and more common, example is watching movies on the computer. Performance problems (for instance due to background work) when watching movies manifest themselves by frame skips, which makes the viewing less pleasant. Common to these is that the important performance indicator is latency, and not throughput, which we explain next.
2.4.2. Interactive Performance There are two overarching performance indicators, latency and throughput. Throughput refers to the amount of
work which gets done in a certain amount of time (i.e. the amount passing through a program from input to output in a given time). Latency is instead the amount of time required to finish a operation. These two are related but they are not prerequisites for each other, i.e. a system might have good throughput but still have long latencies. In some cases, improving one can degrade the other, e.g., shorter scheduling turnaround times usually affects latencies positively but throughput negatively. It should be noted that for non-interactive tasks, it is usually more important to maximize throughput (at the expense of latency).
The definition of interactive performance below is the author's. Adequate interactive performance is here defined as:
An application has adequate interactive performance if the user of the application (provided enough background knowledge) can perform the task quickly and effortlessly without perceived lag.
For interactive applications, latency is generally more important than throughput. First of all, throughput generally does not mean anything for an application that is started and stopped by the user directly. Moreover, long latencies make the application feel slow and unresponsive and users are easily frustrated by such applications. However, it is not immediately clear what the acceptable latencies are.
Latency and responsiveness are discussed in the Human Interface Guidelines supplied by major desktop environments. The guidelines usually don't specify absolute numbers for allowed latencies, but a number of rules give qualitative indications on limits to the latency. For instance, the Apple human software design guidelines specify that “When a user initiates an action, provide an indication that your application has received the user’s input and is operating on it”. Note that this does not directly imply any latency limit, but simply says that if the application can guarantee some (developer perceived) latency limit, it should notify the user that an operation is ongoing. An exception is the Gnome human interface guidelines, which has a section about acceptable response times.
The Gnome human interface guidelines specifies that an application should react to direct input, for example mouse motion or keyboard input, within 100 milliseconds. Note that this does not imply that the application must finish its task within 0.1 second, but that the user must be able to see that the application state has been changed. The Gnome guidelines has three other event categories with limits, which deal with events such as progress bars and
events that users expect will take time. For these, the response time must be within one second and ten seconds respectively.
These numbers suggest that the latency limits are based on rules of thumb and experience. Indeed, evaluating the performance of interactive applications is hard since it is closely related to subjective "feelings" towards the use of an application. Also, improved performance (i.e. lowered latency) beyond the limits of human perception would not provide any additional benefits. The 100 ms figure is commonly used as a limit, but there have been research questioning the validity of that (Dabrowski et al, 2001). Because of the difficulty in evaluating interactive performance, this has been done using a set of quite diverse methods.
A first extreme is presented by Guynes 1988, which uses a psychological test to asses the anxiety felt by student subjects before and after performing a task on systems with varied response times. There have also been quantitative evaluations, however. In Endo et al, 1996, the authors construct a measurement system for Microsoft Windows whereby they intercept the event handling API in Windows (for screen updates, mouse clicks etc.) and correlate the events with a measurement of the system idle time. Their method allows them to plot the frequency of user-perceptible delays (set to 100 milliseconds).
2.4.2.1 Layers For the purpose of this report, we divide the development of interactive applications into three layers: Design: the design of the application, both in terms of user-interface and the process of planning and designing
the application. Programming: the implementation of the application design. This involves actual coding and algorithms as
well as programming-level methods to achieve performance. We have chosen to include some programming aspects dealing with low-level details into the next category.
Architecture: this category contains both computer architecture, operating systems and optimizations performed (e.g. by the compiler) dependent on the computer architecture.
For each of these layers, there are tradeoffs which must be made and trade-off techniques. These are described in later sections. Further, Smith (2002) describes a number of principles which apply to performance engineering. The most important of these from our standpoint are: ● The centering principle: Focus on the part of the application with the greatest impact on performance.
● The fixing point principle: Establish connections at the earliest point in time possible, keeping them during the application lifetime. The concept of connections here depends on the context, it could be for instance network connections, object file linking or opening a file.
● The locality principle: Keep resources as close as possible to their use.
● Shared resources principle: Share resources if it is possible.
● Parallel processing principle: Processing in parallel is beneficial for performance.
These principles are general, and can be used in each of the layers. We now turn to describing the layers and some implications they have on performance.
2.4.2.2 Design Performance can be influenced to a great extent already during the design of the application. In the user-
interface design, the locality principle should be kept in mind for good performance. For example, keeping related operations close to each other on the screen (or logically in the application) makes working with the application more efficient. Further, layout decisions can be used to enhance performance, in Microsoft Office for example, only the most commonly used menu options are showed by default. In the average case, the user does not have to skim through many menu items in this manner.
Further, design considerations related to the implementation can highly influence the application performance. For example, in many cases multithreaded applications have better interactive performance (described more later) then those using a single-threaded model but at the same time can make the application harder to implement. Overall, design patterns can be very important for performance. For instance, the pipes and filters pattern can help performance if execution in the different parts of the pipe can be interleaved (e.g., like in a 3D rendering pipeline).
2.4.2.3 Programming Executing threads in parallel has been done for a long time in interactive systems to perform long-running jobs
in the background, for instance print jobs, while still retaining the application responsiveness (Hauser et al, 1993). There are many general optimization tricks that can be applied to interactive applications, e.g., reducing the frequency of dynamic memory allocations and deallocations and laying out memory access patterns to match cache behavior.

Further, bad implementation in general can cause performance degradation. This is especially important in frequently executed portions of code, where sloppy programming can become a major performance problem.
2.4.2.4 Architecture Low-level considerations, such as the computer architecture (memory system, processor architecture etc),
operating system and compiler technology can also be important for performance. Adding processors to the system does not automatically increase the performance of interactive applications.
However, it can sometimes be beneficial. Running multiple concurrent threads in a process on a multiprocessor machine might be counter-productive if (due to memory access patterns for the threads) cache lines are moved back and forth between processors8. A current trend for multiprocessor CPUs are CMP (Chip Multi-Processing) and SMT (Symmetric Multi-Threading, in-CPU support for running concurrent threads) chips. On most of these chips, transferring cache line ownership across processor (or thread) boundaries are significantly cheaper since the cache lines are transferred within the CPU chip. These new hardware trends can help decrease the application response time (Flautner et al, 2000).
The operating system scheduler is an important component for interactive performance. A scheduler that gives equal time slices to all tasks could easily make an interactive application lose its responsiveness if there is a heavy background task running. One simple improvement of the scheduler is to simply decrease the timer tick interval (and thus switch between tasks at a faster rate). This has been analyzed by Etsion et al (2003) and it was found that faster task switching had significant positive effects on interactive applications with a modest overhead. Note that for throughput-oriented applications, faster task switching generally lowers the performance. The new version 2.6 of the Linux kernel also employs a smaller timer tick interval.
However, more advanced methods are sometimes needed. In (Etsion et al, 2004), the authors describe a method whereby the I/O system is segregated between human interface (HUI) and non-human interface devices. The HUI devices are devices such as mice, keyboards and graphics devices. Programs that interact with HUI devices (such as the X server drawing on the screen) are given priority over other programs when active. Compared to a standard scheduler, this approach leads to a more responsive environment under heavy load. Many operating systems also provide some way of prioritizing interactive applications, e.g. Windows XP and standard Linux, although these are generally less elaborate than the method above. Linux 2.6 for instance detects interactive processes by measuring the time spent waiting for (any) I/O. Interactive processes often spend more time waiting for I/O, and therefore I/O bound applications are prioritized.
2.4.3. Tradeoffs There is a number of tradeoffs related to interactive performance, some of which we have touched upon earlier
in the report. Multithreading vs single-threading: As we saw, multithreaded operation can potentially improve application
responsiveness. At the same time however, implementing a multithreaded application can be substantially harder because of concurrency issues not present in single-threaded applications.
Dynamic vs static allocation: Dynamic allocation (i.e. using malloc/free or new/delete) is often natural to use when implementing object-oriented programs. However, calls to malloc and free are very expensive and should be avoided in loops and other performance-critical sections.
Trading space for time: Sometimes a tradeoff between space and time can be made. Space in this context means memory and time is CPU processing. For instance, it is sometimes possible to pre-calculate values and then just look them up in a table (Smith, 2002). This sacrifices memory but saves some processing.
Fixing point: Performance vs. flexibility. One example relates to the time to link together object files, which can be done at compile tile or (dynamically) at runtime. The latter option is generally more flexible in that the user can link in new functionality during runtime, while the former provides better performance.
Ease of use: There are cases where performance and ease of use are in conflict. For instance, wizards are often easy to use for guiding users through one-time or tasks performed seldom. However, the same operation would probably be quicker to do in some more traditional way, e.g., a command-line tool or a GUI interface. This can be a problem if the user-interface designers use wizards for tasks that are performed often.
2.4.4. Summary Comments In this part, we have discussed performance implications for interactive applications. The area of interactive
performance is a broad one, ranging from interface design through architecture and into low-level considerations in
8Memory caches are used to speed up memory access by providing a smaller “cache” of the most frequently used memory areas. A cache line is the block which is transferred from the memory to the cache (and from the cache to the CPU).

the operating system and hardware. While there is a multitude of problems related to interactive performance (placing of GUI elements, latency etc.), there are also many ways of making the performance better.
2.5. Conclusions
As we have seen what quality models and quality attributes to employ when evaluating the quality of a software product depends on the type of system and its aimed context of use. There are also different evaluation methods and external metrics to use depending on what quality attribute to evaluate.
When it comes to quality in use there are two different approaches; depending on the purpose of the evaluation, quality in use can be measured at different levels or in different time spaces (see Figure 2). If it is suitable or even preferable to evaluate the software before it is in real use mainly quantitative methods are used. The result will be estimations of the effect of the software product. But if it is feasible to evaluate the software while it is used in a real setting or in settings similar to the real environment qualitative evaluation methods will be needed to state the real effect of the software product. Quality in use is a measure of how well the product lives up to certain specified goals (described in sections 2.2, 2.3.3 and 2.4.2). To assess how well, from reliability, usability and performance perspectives, these goals are achieved both quantitative and qualitative data has to be considered in the evaluation process.
2.6. References
Anderson, R. (1997) ‘Work, Ethnography, and System Design’, in Encyclopedia of Microcomputing, editors Kent, A. and Williams, J., Marcel Dekker, New York, 20. pp. 159-183.
Apple Inc., Apple Software Design guidelines,
http://developer.apple.com/documentation/MacOSX/Conceptual/AppleSWDesign Bazovsky, I., Reliability Theory and Practice, Prentice-Hall, Inc., Englewood Cliffs, New Jersey, 1961, pp. 1-
16. Beck, E. “P for Political – Participation is not enough”, Scandinavian Journal of Information Systems, 13, 2003,
pp. 7-20. Beus-Dukic L & Bøegh J., COTS Software Quality Evaluation, Proceedings of 2nd international Conference on
COTS-Based Software Systems 2003, Ottawa, Canada. Boehm, B.W, Brown, J.R., Kaspar, J.R., et.al, Characteristics of Software Quality, TRW Series of Software
Technology, Amsterdam, North Holland, 1978. Bowen, T. P., Wigle, G. B., Tsai, J. T. 1985. Specification of software quality attributes. Tech. Rep. RADC-TR-
85-37, Rome Air Development Center. Brooke, J. SUS – A Quick and Dirty Usability Scale, available from Internet <http:www. > (26 Oct 2004). Cooper, A. ‘The Inmates are Running the Asylum’, Macmillan, USA, 1999. James R. Dabrowski and Ethan V. Munson, Is 100 Milliseconds Too Fast?, In CHI '01 extended abstracts on
Human factors in computing systems, Seattle, Washington, pp. 317-318, 2001. Dumas, Joseph, F., Janice C. Redish, A Practical Guide to Usability Testing, Greenwood Publishing Group Inc.,
Westport, CT, 1999. Yasuhiro Endo and Zheng Wang and J. Bradley Chen and Margo Seltzer, Using latency to evaluate interactive
system performance, SIGOPS Operating Systems Review, 30(SI):185-199, 1996. Yoav Etsion and Dan Tsafrir and Dror G. Feitelson, Desktop scheduling: how can we know what the user
wants?, In Proceedings of the 14th international workshop on Network and operating systems support for digital audio and video, Cork, Ireland, PP. 110-115, 2004.
Yoav Etsion and Dan Tsafrir and Dror G. Feitelson, Effects of clock resolutionon the scheduling of interactive and soft real-time processes, In Proceedings of the 2003 ACM SIGMETRICS international conference on Measurement and modeling of computer systems, San Diego, CA, USA, pp. 172-183, 2003.
Fenton, N. E.. & Pfleeger, S.E , Software Metrics – A Rigourous & Practical Approach,Camebridge Academic
Press, UK, ISBN 1-85032-275-9, 1997. Finkelstein, A. and Kramer, J. Software Engineering: A Roadmap, in ‘The Future of Software Engineering’,
Finkelstein, A. (ed.), New York: ACM, 2000, pp. 5-22. Kristian Flautner and Rich Uhlig and Steve Reinhardt and Trevor Mudge, Thread-level parallelism and
interactive performance of desktop applications, In Proceedings of the ninth international conference on Architectural support for programming languages and operating systems, Cambridge, MA, USA, pp. 129-138, 2000.
Fuggetta, A. ‘Software Process: A Roadmap’, in The Future of Software Engineering, Finkelstein, A. (ed.),
New York: ACM, 2000, pp. 25-34. The Gnome project, Gnome Human Interface Guidelines, http://developer.gnome.org/projects/gup/hig/2.0/ Gulliksen, J. and Göransson, B. ’Användarcentrerad Systemdesign’, Studentlitteratur, Sweden, 2002. Grudin, J. “The West Wing: Fiction can Serve Politics”, Scandinavian Journal of Information Systems, 15,
2003, pp. 73-77. Jan L. Guynes, Impact of system response time on state anxiety,Communications of the ACM 31(3):342-347,
1988. Hamlet, D. Are We Testing the True Reliability?, IEEE Software, July 1992. Carl Hauser and Christian Jacobi and Marvin Theimer and Brent Welch and Mark Weiser, Using threads in
interactive systems: a case study, SIGOPS Operating Systems Review,27(5):94-105. ISO (1994) ISO DIS 8402: Quality Vocabulary. ISO/IEC 9126-1 (2000) Software product quality – Part 1: Quality model Jokela Timo, Netta Iivari, Juha Matero, Minna Karukka, Full papers: The standard of user-centered design and
the standard definition of usability: analyzing ISO 13407 against ISO 9241-11, Proceedings of the Latin American conference on Human-computer interaction, Rio de Janeiro, Brazil, 2003, pp. 53-60.Prentice Hall, Upper Saddle River, 2002.
McCall, J.A., Richards, P.K., Walters, G.F., Factors in Software Quality”, RADC TR-77-369, 1977. Musa, John, Software Reliability Engineering, NcGraw-Hills Companies, Inc, USA, ISBN 0-07-913271-5,
1998. Musa, J., Iannino, a., Okumoto, K., Software Reliability: Measurements, Prediction, Application. New Yourk:
McGraw Hill, 1987. Nielsen, J. Usability Laboratories: A 1994, Survey, http://www.useit.com/papers/uselabs.html Nielsen, J. Usability Engineering, Academic Press, Inc., San Diego, 1993. Nuseibeh, B. and Easterbrook, S. Requirements Engineering: A Roadmap, in The Future of Software
Engineering, Finkelstein, A. (ed.), New York: ACM, 2000, pp. 37-46. Pruitt, J. and Grudin, J. ‘Personas: Practice and Theory’, Proceedings of Designing for User Experiences,
DUX’03, CD ROM, 15 pages, 2003. Retting, M. ‘Prototyping for Tiny Fingers’ Communications of the ACM, Vol 37, No 4, 1994, pp. 21-27.

Rohn, Janice A., Jared Spool, Mayuresh Ektare, Sanjay Koyani, Michael Muller, Janice (Ginny) Redish, Usability in practice: alternatives to formative evaluations-evolution and revolution, In Proceedings of Conference on Human Factors in Computing Systems, CHI '02 extended abstracts on Human factors in computing systems, Minneapolis, Minnesota, USA, 2002, pp. 891-897.
Rosson, M. and Carroll, J. Usability Engineering, Scenario-Based Development of Human-Computer
Interaction, Morgan Kaufmann Publishers, 2002. Rönkkö, K., Hellman, M., Kihlander, B. and Dittrich, Y. ‘Personas is not Applicable: Local Remedies
Interpreted in a Wider Context’ Proceedings of the Participatory Design Conference, PDC ’04, Toronto, Canada, July 27-31, 2004. pp. 112-120.
Connie U. Smith, Lloyd G. Williams, Performance solutions – a practical guide to creating responsive,
scalable software, Pearson Education, Indianapolis USA, 2002. Wohlin, C, 2003, Software Reliability Engineering, Verification and Validation course, Idenet, Blekinge
Institute of Technology, Claes, 29/11/04, https://idenet.bth.se/servlet/download/element/26043/Reliability-HT03.pdf.
C. Wohlin, M. Höst, P. Runeson and A. Wesslén, “Software Reliability”, in Encyclopedia of Physical Sciences
and Technology (third edition), Vol. 15, Academic Press, 2001. Vredenburg, K., Isensee, S. and Right, C. User-Centred Design, An Integrated Approach, Prentice Hall, Upper
Saddle River, 2002. Wood, A. Predicting Software Reliability, IEEE Computer, November 1996.
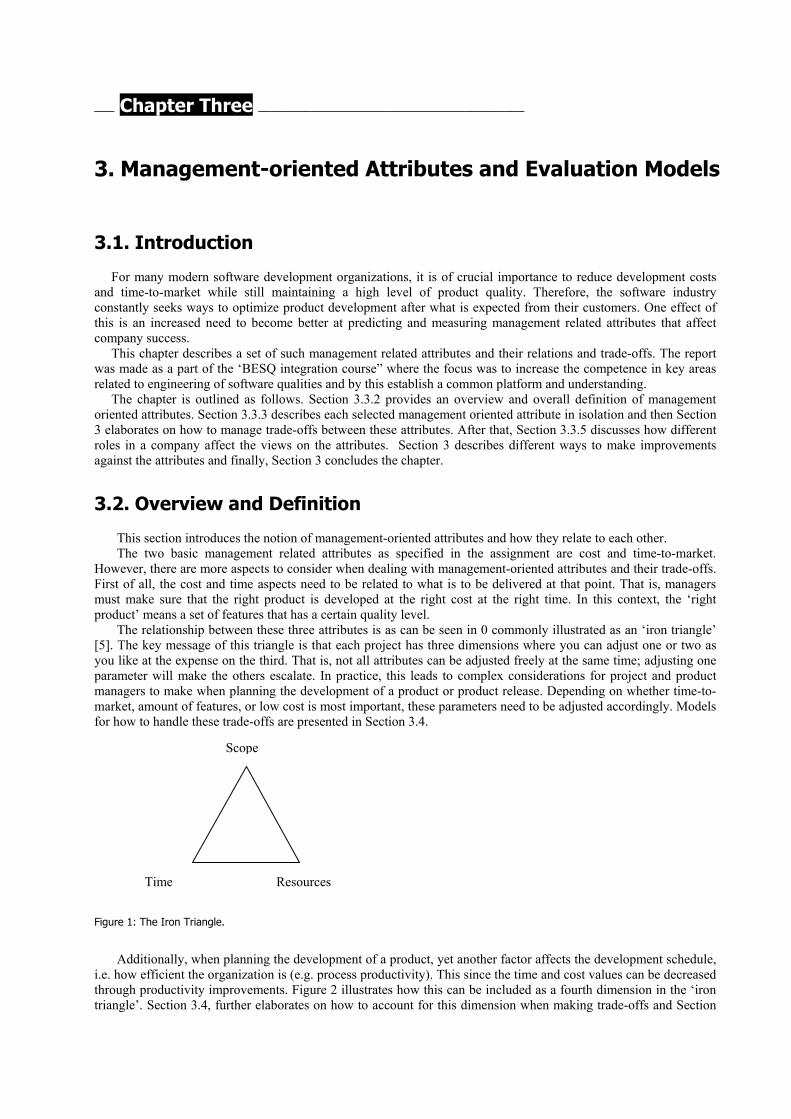
___ Chapter Three ________________________________________
3. Management-oriented Attributes and Evaluation Models
3.1. Introduction
For many modern software development organizations, it is of crucial importance to reduce development costs and time-to-market while still maintaining a high level of product quality. Therefore, the software industry constantly seeks ways to optimize product development after what is expected from their customers. One effect of this is an increased need to become better at predicting and measuring management related attributes that affect company success.
This chapter describes a set of such management related attributes and their relations and trade-offs. The report was made as a part of the ‘BESQ integration course” where the focus was to increase the competence in key areas related to engineering of software qualities and by this establish a common platform and understanding.
The chapter is outlined as follows. Section 3.3.2 provides an overview and overall definition of management oriented attributes. Section 3.3.3 describes each selected management oriented attribute in isolation and then Section 3 elaborates on how to manage trade-offs between these attributes. After that, Section 3.3.5 discusses how different roles in a company affect the views on the attributes. Section 3 describes different ways to make improvements against the attributes and finally, Section 3 concludes the chapter.
3.2. Overview and Definition
This section introduces the notion of management-oriented attributes and how they relate to each other. The two basic management related attributes as specified in the assignment are cost and time-to-market.
However, there are more aspects to consider when dealing with management-oriented attributes and their trade-offs. First of all, the cost and time aspects need to be related to what is to be delivered at that point. That is, managers must make sure that the right product is developed at the right cost at the right time. In this context, the ‘right product’ means a set of features that has a certain quality level.
The relationship between these three attributes is as can be seen in 0 commonly illustrated as an ‘iron triangle’ [5]. The key message of this triangle is that each project has three dimensions where you can adjust one or two as you like at the expense on the third. That is, not all attributes can be adjusted freely at the same time; adjusting one parameter will make the others escalate. In practice, this leads to complex considerations for project and product managers to make when planning the development of a product or product release. Depending on whether time-to-market, amount of features, or low cost is most important, these parameters need to be adjusted accordingly. Models for how to handle these trade-offs are presented in Section 3.4.
Figure 1: The Iron Triangle
Additionally, wheni.e. how efficient the orthrough productivity imtriangle’. Section 3.4, f
Scope
Time
.
planningganizatioprovemeurther ela
Resources
the development of a product, yet another factor affects the development schedule, n is (e.g. process productivity). This since the time and cost values can be decreased nts. Figure 2 illustrates how this can be included as a fourth dimension in the ‘iron borates on how to account for this dimension when making trade-offs and Section

3.6 discusses improvement methods than can improve productivity. However, note that a project manager can normally not explicitly manage this attribute due to its long-term nature.
Figure 2: The Iron Triangle 3D.
In accordance with the relationship described in Figure 2 [6] (when replacing scope with product size and process with productivity), Putnam and Myers have defined the following relationship between these management attributes [12]
Product size = Productivity index * Effort * Time
Based on this formula, managers can decide which parameters to adjust in order to obtain the wanted product. However, since ‘product size’ is a rather incomplete view on what product is delivered, this report will further on instead use the term ‘content’, which not only includes a set of features but also the non-functional quality requirements set on the delivered features. Also note that the four attributes included in this definition are based on a project view of what matters when developing a product. Section 3.5 discusses some issues around what happens when changing perspective on management oriented attributes. That is, what type of management perspective that currently is in focus, e.g. project, product or line management. Depending on the role, different priorities are made and different sub-attributes might affect the calculations.
From the formula above and further extensions of it, the variables can be modeled and compared in graphs so that optimal relationships can be obtained in each given situation. With this trade-off thinking in focus, the next section studies these variables in isolation and then Section 3.4 studies them in relation to each other.
3.3. Description of the Selected Attributes
This section lists the selected management-oriented attributes as introduced in the previous section. For each attribute, the following aspects are covered:
• An overview of the attribute • How to predict the value of the attribute (when the other attributes are considered as fixed) • How to measure/evaluate the attribute • Ways to improve against the attribute (in isolation)
The purpose with the attribute descriptions is to provide an explanation of how to interpret each attribute as a basis for relationship discussions in consecutive chapters.
3.3.1. Time Overview:
This attribute states the amount of schedule time that is required to complete the work, i.e. lead-time. It is commonly measured as weeks, months or years. Since the time attribute determines the delivery date of a project, it is directly related to the ‘time-to-market’ factor, which by many is considered the most important factor when planning a project, e.g. in market-driven development.
How to predict the value of the attribute:
Determining how long time it will take to complete a project is directly dependant on the contents of the product. However, the lead-time is also affected by the effort attribute since different staffing strategies lead to different lead-times depending on whether a higher cost is acceptable to shorten the lead-time or not [12]. Section 3.4 discusses these trade-off decisions more thoroughly.
How to measure/evaluate the attribute:
Measuring the time it took to complete a project is obviously a lot easier than predicting how long it will take. Commonly, the delivery precision of the project is in focus when measuring this attribute. This especially since

software development projects have a strong tendency not to be completed on time [12]. Typically, this occurs due to poor planning or late changes.
3.3.2. Effort Overview:
Effort represents the manpower needed to conduct the work, measured as hours, man-months, or in monetary terms. How to predict the value of the attribute:
This attribute is predicted according to the same pattern as for time, i.e. it is strongly content oriented and to some extent also time related. Section 3.4 discusses these trade-off related predictions more thoroughly. How to measure/evaluate the attribute:
The used effort is most likely measured the same way as it was predicted, i.e. through reported hours on the activities in the project. The spent hours can then be transformed into monetary terms by multiplying with the cost/hour for each employee. If feasible, other non-labor costs such as hardware and license costs might also need to be included in this measure. However, in software development, the labor costs usually account for a very high percentage of the costs and therefore other costs might be discarded.
3.3.3. Content Overview:
The last basic attribute represents the size of the functional content developed in a project, i.e. some size estimate of a set of features with certain non-functional characteristics. That is, the features normally have some requirements on for example performance, availability, usability, etc. Further, a certain quality level for example measured in form of correctness is required. How to predict the value of the attribute:
The natural way of predicting the size of a product is by dividing it into smaller parts and then estimate the size of each part. However, the actual size estimation approach for each part differs between organizations. According to Putnam and Myers, development managers tend to use one of the following approaches when predicting the size of a product [12] • The conservative approach where the manager gives vague statements about that it will take a long time but will
have a very hard time to defend them • The manager gives estimates that pleases higher-level management, i.e. a deadline that he or she have no clue
about if it is going to be met • The manager on purpose underestimates to get permission to go ahead with internal assignment or win an
external contract that the organization needs Obviously, neither of these approaches is recommendable. Instead, more specific measurement approaches such
as LoC, Function Point measurement or COCOMO could be used [4, 12]. Of these LoC could be considered as relatively unreliable since lines of code depends on type of application, coding conventions etc. The strength of techniques such as Function Point measurements is that they are independent of implementation techniques and also consider application complexity and non-functional requirements. However, to be able to use such techniques a more or less complete requirements or use case specification is required. Further, such techniques are more complex and require both skills and extra efforts to apply. The accuracy of these methods has also been questioned.
How to measure/evaluate the attribute:
The actual content of the product could naturally be measured using the same measurement methods as when doing predictions. That is, for example by doing an update of previous Function Point analysis or by counting lines of code in the product. The defect density of the product could also be a relevant content measure. This is however very hard to measure unless waiting until the product has been in operation for quite some time and then counting number of defects found in operation. Instead, estimates of number of defects left could be obtained for example through mathematical reliability models [12].

3.3.4. Productivity Overview:
Productivity can be defined as a set of characteristics of an organization that makes it develop a product at a certain speed [12]. This implies that productivity is not a simple expression that can be precisely defined [12]. However, examples of characteristics included in productivity are [12]: • The state of the management practices in use in the project • The extent to which good requirements, design, coding, inspection, and test methods are used • The state of technology and software environment, such as level of programming language in use, software
tools, development equipment, and machine capabilities • The skills and experience of team members • The complexity of the application type
How to predict the value of the attribute: Since productivity primarily is an organizational attribute, i.e. except for product complexity it is not product
dependent, it can be predicted from previous productivity measures obtained in the particular organization.
How to measure/evaluate the attribute: Productivity is measured as a product of the other attributes as listed above, i.e.
Productivity=content/(effort*time) The obtained productivity value can be seen as an index value that can be used to compare for example projects,
products and application types. For example, taken from a larger database of productivity measures, the telecom companies included on average had a productivity index of 11 [12].
Since productivity is directly dependent on time, effort and product size, the accuracy of the obtained productivity value is consequently dependent on the accuracy of the other attributes. Therefore, it is not possible to obtain accurate productivity measures without having good size measures (accurate time and effort measures are not very hard to obtain). However, as indicated in Section 3.3.3, accurate size measurements require more advanced techniques such as Function Point analysis. Delivering many lines of code per man-month may be much less productive than for example just writing a few lines of code and incorporating the rest from reusable assets or third-party software; it is the amount of functionality that matters [4].
3.4. Trade-offs
Since software development projects commonly have requirements on developing certain features within a certain time and below a certain cost, managers commonly need to make trade-offs between the attributes. The purpose of this section is to determine the relationships between the attributes. Additionally, this section provides a discussion regarding how to determine the impact of modifying one attribute (impact on the other attributes).
3.4.1. Overview Table 1 provides an overview of whether the described management attributes are in conflict or not. A negative
dependency (-) means that changing one attribute affects the other one negatively and a positive (+) dependency the opposite. Additionally, ‘0’ states that the attributes are independent of each other.
As can be seen in the table, all attributes are in conflict with each other except productivity, which is independent of the other attributes. This because there is not an explicit dependency, e.g. a change in time does not affect productivity. Therefore, productivity is not relevant in a trade-off discussion between the other attributes. Productivity is instead the factor to consider when an optimal trade-off between the other attributes is no longer enough. However, note that productivity improvements implicitly lead to improvements for the other attributes.
Table 1. Conflicts between management attributes Time Effort Content Productivity
Time
Effort -
Content - -
Productivity 0 0 0

3.4.2. Resource/time-oriented trade-offs This is probably the most basic trade-offs situation, i.e. a product with a certain content is to be developed.
What is then the optimal cost and delivery date? The basic principle is that resources can be allocated to a project in different ways. Figure 3 shows a typical
resource utilization curve [8]. As can be seen in the figure, projects normally need the most resources during the execution phase. The rate of building up manpower has an effect on time and effort, i.e. a high build-up rate can decrease the development time at the expense of a higher development cost [12]. Further, it is well-known that adding more resources late will make a project even later [5]. Other aspects that affect the time in relation to effort is the chosen way to divide the work. That is, activities in a project tend to have a dependency on each other in a way that some activities must be finished before others can be started. A typical method for managing this is the Critical Path Method (CPM) [10].
Figure 3: Project Resource Utilization Curve.
Typically, the challenge of project planning is to be able to develop the product as fast as possible, i.e. have short time-to-market. Therefore, models oriented at finding the shortest possible development time on the expense of for example cost are commonly sought. Figure 4 demonstrates an example of such a model and as can be seen in the figure, the effort and number of people increases as time decreases [12].
Figure 4: Minimum development time.
3.4.3. Content-oriented trade-offs When it is not enough to optimize schedule versus time, a cut in content is the next approach to achieve an
acceptable development plan. This third case is special since it involves an internal trade-off within one of the attributes. That is, content is not
only about features but also about the non-functional characteristics of the features. Therefore, it is possible to choose between few features with high non-functional requirements versus many features with lower non-functional requirements.
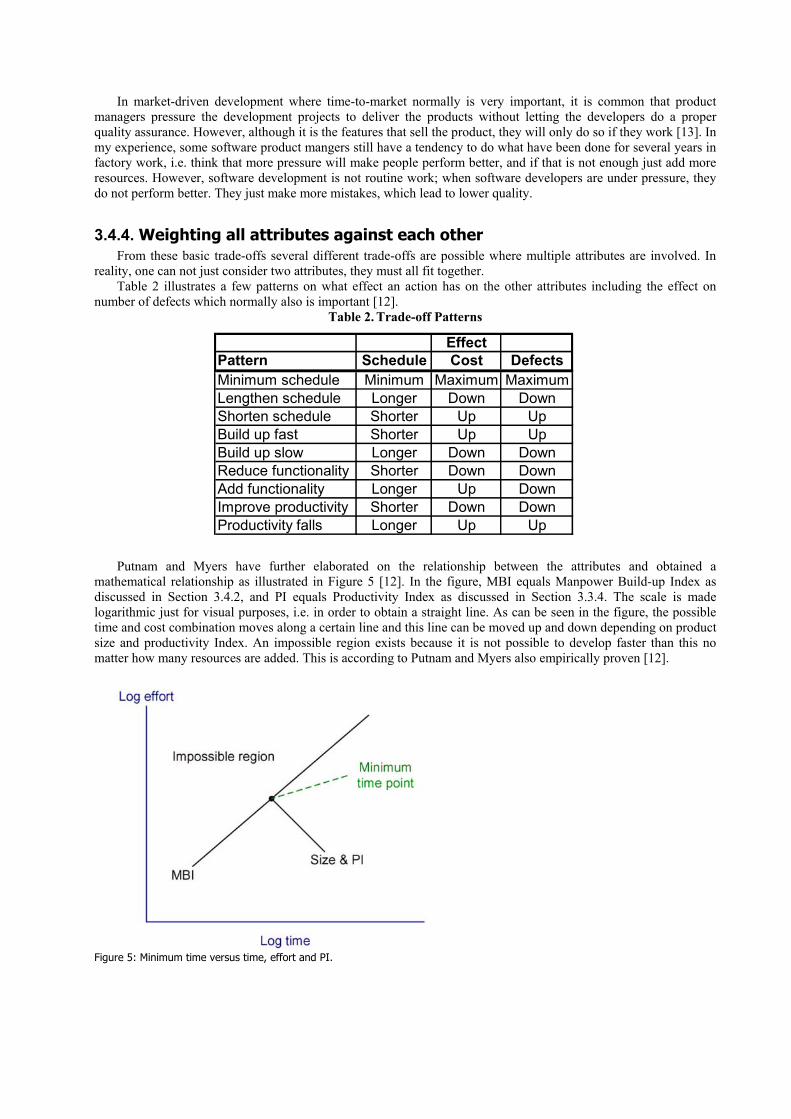
In market-driven development where time-to-market normally is very important, it is common that product managers pressure the development projects to deliver the products without letting the developers do a proper quality assurance. However, although it is the features that sell the product, they will only do so if they work [13]. In my experience, some software product mangers still have a tendency to do what have been done for several years in factory work, i.e. think that more pressure will make people perform better, and if that is not enough just add more resources. However, software development is not routine work; when software developers are under pressure, they do not perform better. They just make more mistakes, which lead to lower quality.
3.4.4. Weighting all attributes against each other From these basic trade-offs several different trade-offs are possible where multiple attributes are involved. In
reality, one can not just consider two attributes, they must all fit together. Table 2 illustrates a few patterns on what effect an action has on the other attributes including the effect on
number of defects which normally also is important [12]. Table 2. Trade-off Patterns
EffectPattern Schedule Cost DefectsMinimum schedule Minimum Maximum MaximumLengthen schedule Longer Down DownShorten schedule Shorter Up UpBuild up fast Shorter Up UpBuild up slow Longer Down DownReduce functionality Shorter Down DownAdd functionality Longer Up DownImprove productivity Shorter Down DownProductivity falls Longer Up Up
Putnam and Myers have further elaborated on the relationship between the attributes and obtained a mathematical relationship as illustrated in Figure 5 [12]. In the figure, MBI equals Manpower Build-up Index as discussed in Section 3.4.2, and PI equals Productivity Index as discussed in Section 3.3.4. The scale is made logarithmic just for visual purposes, i.e. in order to obtain a straight line. As can be seen in the figure, the possible time and cost combination moves along a certain line and this line can be moved up and down depending on product size and productivity Index. An impossible region exists because it is not possible to develop faster than this no matter how many resources are added. This is according to Putnam and Myers also empirically proven [12].
Figure 5: Minimum time versus time, effort and PI.

3.5. Roles in Relation to the Attributes
Although the relationships between the management oriented attributes are equal no matter what role perspective is put on them, the perspective a role has affects which attributes that is considered most important. This section compares the differences in looking at the attributes depending on if the person doing the trade-off is a project, product, or line manager. The aspect of profitability is also discussed in this context due to its affect on the roles. Note that the role perspectives are not generally valid for all organizations; smaller companies might for example, not even have the different roles as listed below.
Project manager: A project manager rates time versus effort as most important followed by content and productivity, since the latter commonly is unchangeable. The reason for this is that a project manager must make sure to allocate resources in relation to delivery dates in order to make sure that the content to develop will be finished in time. That is, the responsibility is commonly to make sure that a requirements specification is developed on time and within budget. However, in practice, the project manager might take part in content changes also but this is not explicitly a part of the role. Productivity improvements are also of interest for the project manager if they can be obtained within the time frame of the project.
Product manager: Product managers focus on time versus content followed by effort. They have this priority because the main concern of a product manager is the release plan including certain features at certain release dates [9]. Cost also has some importance since it affects the profit, which product managers normally have as the primary goal to maximize. Maintenance costs and enhancement costs are also of some interest since product managers normally have a life-cycle responsibility for the product.
Line manager: Line managers must make sure to have an efficient organization that through the projects generates both short- and long-term profits. Line management is therefore really the only people that need to consider all attributes jointly. Future maintenance costs and enhancement costs are naturally also important for line managers. Additionally, people issues such as learning effects also matters.
In my experience, different priorities commonly lead to conflicts in practice. Nevertheless, the different managers are in the end all aiming for high profitability. They just do it in different ways. The different views on profitability can be formulated as follows:
Profit (project perspective) = Sales income - (Effort + Cost of sales + cost of maintenance) + (functionality and knowledge to reuse in future releases).
Profit (product perspective) = sales income (release 1-X) - (Cost of sales(release 1-X) + cost of maintenance(release 1-X) ).
Profit (company perspective) = sales income (release 1-X) - (Cost of sales(release 1-X) + cost of maintenance(release 1-X) ) + (functionality and knowledge to reuse in other products).
As can be seen in the formulas, it is the project perspective that differs the most since it only focuses on one release. One should also be aware of that maximizing profits also involves other product management related aspects such as marketing rules, pricing etc. that are much more complex to formulate [9]. The attributes selected in this report only focused on product related aspects. Figure 6 provides an overview of other aspects that affect the success of an organization, i.e. Atkinson states that the iron triangle is no longer enough [1]. In the figure, the system represents product attributes such as for example maintainability and reliability. Organizational benefits represent for example profits, strategic goals, and organizational learning. Finally, stakeholder benefits represent for example user satisfaction and contractor profits.
The Iron Triangle The System
Benefits (organizational)
Benefits (stakeholders)
Figure 6: Management success criteria.
3.6. Improvement Methods
When trade-offs between attributes are fully optimized, the productivity index is the only remaining factor to improve if a project needs to develop a product faster, at a lower cost, or with more functionality. More specifically, Figure 5 in the previous section demonstrated how productivity improvement affects the other attributes. Improved productivity could for example be obtained through increased competence level of the project members or improved

development methods and tools, e.g. software process improvement. Figure 7 illustrates how different productivity levels (indices) affect required effort and time to complete a project. As can be seen in the figure, the difference is significant depending on how productive the company is. This section discusses how to achieve higher productivity levels.
Figure 7: Productivity effect on time and effort.
3.6.1. Approaches to Productivity Improvement
3.6.1.1 Software Process Improvement The essence of Software Process Improvement (SPI) is to have a more mature process according to some goal
such as using best practices or introducing few defects. One of the most widely used SPI models is the Capability Maturity Model (CMM) [11]. The essence of CMM is for organizations to strive for achieving higher maturity levels and thereby becoming better at software development. Examples of models that origin from the manufacturing business are Total Quality Management (TQM) and Six Sigma [2] where the latter has its primary focus on defect density. These models are to some extent also used in software process improvement. Finally, ISO SPICE is an example of a process improvement model that focuses on assessment [14].
Process improvement programs such as the ones mentioned above could aid in making an organization more productive. However, such improvement methods are due to upfront costs commonly only beneficial in the long-term perspective. Therefore, short-term productivity improvements that are beneficial already in the first projects should also be identified. These improvements include light-weight versions of the above-suggested long-term improvements and other process improvements that has negligible upfront costs. Using a bottleneck focus as described in the next section is one way of achieving short-term improvements.
A possible approach for achieving long-term improvements without delaying short-term schedules is to define long-term improvement goals and then break them down into small improvements that can give return on investment directly in the first project. However, this is not possible if for example a larger technology change is going to be made.
3.6.1.2 Remove Bottlenecks Most bottlenecks a company can remove are very specific for each organization. Therefore, it is hard to specify
typical bottlenecks that apply for many organizations. Nevertheless, one such bottleneck that most likely is present in all organizations is insufficient tool support. A typical difference between good and bad development environments is about how good tools that are available [12]. Introducing new tools does however cost money in form of education, implementation effort, licenses etc. Therefore, larger tools changes must be considered as long/term investments.
A common approach to process improvement is to identify process flaws through fault analysis [7]. In fact, some claim that fault analysis is the most promising approach to software process improvement [7]. The idea with fault analysis is to group the faults found in a product into categories and identify types of faults that occur more frequently than others. From such distributions, specific improvements can be implemented to decrease the amount

of such faults in consecutive projects. Since faults are cheaper to find and remove in earlier stages of projects, such improvements would also lead to increased productivity [4].
3.6.2. Measuring Productivity Improvement The foundation for measuring productivity improvement is obviously to be able to measure productivity (as
described in Section 3.3.4). That is, especially accurate size measurements need to be obtained. Nevertheless, measurement is the key to successful productivity improvement programs [11]. Through measurements, managers can evaluate the performed improvements and then from these measurements identify further improvements. With measured confidence in that the improvements pay of, it is easier to support further improvements with funding and leadership [11].
For more specific improvements such as bottleneck removals, techniques that focus on measuring individual improvements might be preferable to choose when performing evaluations. An example of such a technique is Goal Question Metrics (GQM) [1]. If performing fault-based improvements, fault metrics are naturally also more suitable to use for follow-up evaluations.
3.7. Conclusion This section report evaluated and discussed the notion of management-oriented attributes. The content of the
report is based on a formula that expresses the relationship between different management attributes. The stated formula was:
Content = Productivity index * Effort * Time
The attributes in the formula were defined as follows:
Content: A set of features with certain non-functional characteristics
Productivity index: A set of characteristics that makes an organization develop a product at a certain speed.
Effort: The manpower needed to conduct the work
Time: The amount of schedule time required to complete the work, i.e. lead-time
Between these attributes, several trade-offs can be made depending on if minimum time or cost is required or on what content to include. The report presented some models for how to handle such trade-offs. Further, since roles such as product and line managers commonly also consider other long-term related management attributes, the report also provided a discussion around roles in relation to management attributes. Finally, the report discussed how to achieve and measure productivity improvements.
3.8. References 1. Atkinson R., Project management: cost, time and quality, two best guesses and a phenomenon, its time to accept
other success criteria, International Journal of Project Management, Elsevier, Vol. 17, No. 6, 1999, pp. 337-342. 2. Basili V. R. , Weiss D. M., A Methodology for Collecting Valid Software Engineering Data, IEEE Transactions
on Software Engineering, November 1984, pp. 728-738. 3. Biehl R., Six Sigma for Software, IEEE Software, IEEE, Vol. 21, No. 2, 2004, pp. 68-71. 4. Boehm, B. W., Software Engineering Economics, Prentice-Hall, 1981. 5. Brooks, P., The Mythical Man-Month: Essays on Software Engineering, Addison-Wesley Publishing Co., 1974 6. Cockburn A., Process: the Fourth Dimension (Tricking the Iron Triangle), Humans and technology, Technical
Report TR 2003.02, Oct. 4, 2003. 7. Grady, R., Practical Software Metrics for Project Management and Process Improvement, Prentice Hall, 1992 8. Jurison, J., Software Project Management: The Manager’s View, Communications of AIS Volume 2, Article
17, 1999 9. Karlsson, J., ”Marknadsdriven Produktledning - Från kundbehov och Krav till Lönsamma Produkter”, VI
report, Focal Point AB, 2003 10. Nicholas, J. M, Project Management for Business and Technology Second Edition, Prentice Hall, Inc, New
Jersey, U.S.A., 2001. 11. Paulk, M. C., Weber, C. V., Curtis, B., and Chrissis, M. B., The Capability Maturity Model: Guidelines for
Improving the Software Process, Addison Wesley Longman, Inc., 1995. 12. Putnam, L. H., Myers, W. “Measures for Excellence-Reliable Software on Time, within Budget”, Prentice-Hall,
Inc, U.S.A., 1992.

13. Rakitin, S. R, Software Verification and Validation for Practitioners and Managers, Second Edition, Artech House, 2001.
14. SPICE. 1993-. ISO-SPICE (Software Process Improvement and Capability determination), Special Initiative for Software Process Assessment Standardization, ISO/IEC JTC1/SC7/WG10.

___ Chapter Four ________________________________________
4. Developer-Oriented Quality Attributes and Evaluation
Methods
4.1. Introduction
Quality attributes have been discussed previously throughout the compendium. In this chapter, we focus on developer-oriented quality attributes. Bosch defines developer-oriented quality attributes to be those of particular relevance from a software engineering perspective [1]. He exemplifies by listing a number of such attributes: Maintainability, Reusability, Flexibility and Demonstrability.
Here, we synthesise a list of developer-oriented quality attributes from a number of common quality models: McCall’s quality model, Boehm’s quality model and ISO 9126-1. The aggregated body of attributes is large and not restricted to developer-oriented attributes, which is why we select and discuss only a subset of it. The quality models used and the selection of relevant attributes are presented in Section 4.2.
When dealing with quality attributes of any kind, it is crucial to know how to achieve them, i.e. how to build the system in order to maximise their values. As with most other quality attributes related to the product (as opposed to the process), developer-oriented attributes greatly affect the basic structure of the product, its software architecture. Consequently, they should be dealt with early in the product’s lifecycle, during the architecture design phase. Architecture design is generally recognised to be the activity where the most fundamental decisions about the product’s structure must be made [1, 2]. In Section 4.3, we describe how to deal with each quality attribute, with focus on the software architecture aspects.
Quality attributes can affect each other both positively, meaning that they strengthen each other, and negatively, meaning that they are in conflict with each other. In case of a conflict between two attributes, it is necessary to make a trade-off between them. In deciding on a trade-off, it is important that the attributes are balanced appropriately. For developer-oriented attributes, conflicts can arise if the mechanisms for achieving the attributes are in conflict. Of course, it can also be the case that a particular mechanism favours several attributes. We discuss trade-offs in Section 4.4.
In improving an existing system, or considering different alternatives for building a system, it is useful to evaluate the system with respect to relevant quality attributes. For this purpose, there exist a number of evaluation methods, some of which are tailored for specific attributes. We discuss such methods briefly in Section 4.5.
4.2. Quality Attributes
In this section, we look at a number of common quality models and select the developer-oriented quality attributes that they encompass. A difficulty is, as we will see, that quality models tend to differ with respect to classification and definition of attributes. In other words, the selection of relevant developer-oriented attributes is largely subjective and depends on assumptions regarding definition and decomposition. For example, as we will see in section 4.2.2.3, the attribute Understandability is seen as either a developer-oriented a use-oriented attribute, depending on which model we refer to.
To ensure a consistent interpretation of the quality attributes, we provide definitions to the attributes primarily according to SEI’s Software Technology Roadmap glossary [4], but also according to ISO 9126-1 [5]. Definitions in SEI’s glossary are mainly from the 1990 IEEE Standard Computer Dictionary, but also from other sources.
4.2.1. Quality Models There exist a number of different quality models, but we focus here on three of the most common ones [3]:
• • •
McCall’s model Boehm’s model ISO/IEC 9126-1

The models differ in several respects. McCall’s model was created already in 1977 and consists of a hierarchy where external quality factors (attributes) relate to product quality criteria (characteristics). Figure 1 shows the model less the characteristics to the right. The attributes in the model are divided into three categories that form a life-cycle view: product operations (running and operating), product revision (changing and updating) and product transition (moving to a different context) [6]. We can use this categorisation to weed out developer-oriented attributes; they are the ones in the product revision and product transition categories.
Figure 1: McCall’s and Boehm’s Quality Models Compared.
Boehm’s model was published in 1978 (based on previous studies, see [14]), and differs from McCall’s model in that it adds characteristics of hardware performance [3]. In addition, Boehm’s model categorises attributes according to a utility view, i.e. viewing the product as a provider of utility to its different stakeholders. Figure 1 shows Boehm’s quality model less the characteristics to the left. The attributes in the model stem from three different types of utility: as-is utility, maintainability and portability. As developer-oriented attributes we se those that do not fall under as-is utility.
ISO 9126-1 was devised in 1991, in an effort to bring the different prevailing views of quality into one model [5]. As with McCall’s and Boehm’s models, ISO 9126-1 is hierarchical, connecting quality attributes to characteristics. It differs, however, in that the hierarchy is stricter, clearly separating the attributes and their sub-attributes. Figure 2 shows the hierarchy of the ISO model. The standard suggests that Functionality, Reliability, Usability and Efficiency can be seen as quality-in-use, which means that we can see Maintainability and Portability and their decompositions as developer-oriented attributes.

Figure 2: ISO 9126-1 Quality Attributes.
Two problems with the quality models described above are that they do not provide any rationale for (1) why certain attributes and characteristics are included while others are not; and (2) why the hierarchies are formed the way they are, i.e. the placement of attributes and characteristics [3]. This makes the selection of develop-oriented quality attributes slightly more difficult, as the models may contradict each other.
Next, we look at each of the described models and extract the relevant developer-oriented attributes.
4.2.2. Selected Attributes The quality models described previously overlap in terms of quality attributes. In order to be complete, we look
at a union of all appropriate developer-oriented attributes defined by the models. Some attributes are excluded for reasons described below.
4.2.2.1 McCall’s model As mentioned earlier, McCall’s model relates external quality factors, i.e. attributes, to product quality criteria.
The attributes are divided into three categories: product operations, product revision and product transition. Table 1 lists the quality attributes in two latter categories, as they can be seen as developer-oriented attributes, together with their definitions from the SEI glossary.
Table 1. Quality Attributes in McCall’s model
Attribute Definition [4]
Maintainability “The ease with which a software system or component can be modified to correct faults, improve performance, or other attributes, or adapt to a changed environment.”
Testability “The degree to which a system or component facilitates the establishment of test criteria and the performance of tests to determine whether those criteria have been met.”
Flexibility “The ease with which a system or component can be modified for use in applications or environments other than those for which it was specifically designed.”
Portability “The ease with which a system or component can be transferred from one hardware or software environment to another.”
Reusability “The degree to which a software module or other work product can be used in more than one computing program or software system.”
Interoperability “The ability of two or more systems or components to exchange information and to use the information that has been exchanged.”

Although Correctness is categorised in the product operations category, it can be seen as an attribute with some developer-orientation. Its definition suggests that there is a view of it that should be highly relevant from a software engineering perspective: “The degree to which a system or component is free from faults in its specification, design, and implementation.” [4]. Consequently, we will treat it as a developer-oriented attribute in this chapter.
Portability and Flexibility have similar definitions in Table 1, although they are not the same. Portability implies a larger environmental shift than Flexibility. For example, a portable system would be easy to move between operating systems such as Microsoft Windows and Linux, or between hardware platforms such as PC and Macintosh, while retaining the functionality. Flexibility, on the other hand, implies that the system can be easily expanded, for example, in order to match changes in the environment such as new services, updated system components and so on. Nevertheless, the two attributes certainly overlap. Lassing et al., for example, seem to include Portability in Flexibility [16].
4.2.2.2 Boehm’s model Boehm’s model is similar to McCall’s, but puts a utility perspective on the quality attributes in the model. The
as-is utility perspective contains the attributes Reliability, Efficiency and Human engineering, while the remaining perspectives contain the attributes Portability and Maintainability, with Maintainability further decomposed into Testability, Understandability and Modifiability [3]. Table 2 lists and defines the two attributes that are added compared to McCall’s model. While the attribute definitions appear in the SEI glossary, they actually originate from Boehm’s definition of the model.
Table 2. Additional Attributes in Boehm’s model
Attribute Definition [4]
Understandability “The degree to which the purpose of the system or component is clear to the evaluator.”
Modifiability “The degree to which a system or component facilitates the incorporation of changes, once the nature of the desired change has been determined.”
Note the decomposition of Maintainability into more specific attributes. ISO 9126-1 contains a similar
decomposition of Maintainability, while McCall’s model puts Maintainability as an “atomic” attribute next to both Portability and Testability. In order to avoid confusion, we will not discuss Maintainability further in this chapter, but only the more specific attributes it can be decomposed into.
4.2.2.3 ISO 9126-1 ISO 9126-1 is a standardised hierarchical model like McCall’s and Boehm’s, but differs still. The hierarchy
contains two levels of attributes, where the top-level attributes are Functionality, Reliability, Usability, Efficiency, Maintainability and Portability. As pointed out earlier, the standard hints that all top-level attributes except Maintainability and Portability concern quality-in-use.
As with Boehm’s model, Maintainability is decomposed further into a number of sub-attributes (four). However, Portability, which in Boehm’s model corresponds directly to a number of characteristics, is here decomposed into sub-attributes.
We can also see that Interoperability, being an attribute in McCall’s model, here is a sub-attribute to Functionality. In ISO 9126-1, Interoperability is defined as: “The capability of the software product to interact with one or more specified systems.” [5]. This view is clearly less internal than that of the definition from SEI, which explains the placement of the attribute. We will stick to the previous definition and see Interoperability as a developer-oriented attribute.
Moreover, Understandability is part of the decomposition of Usability, while Understandability in Boehm’s model is more of a developer-oriented attribute. The reason for this is that the attribute is defined differently: “The capability of the software product to enable the user to understand whether the software is suitable, and how it can be used for particular tasks and conditions of use.” [5]. To avoid confusion, we will not discuss Understandability further in this chapter.
The ISO 9126-1 definitions of the sub-attributes of Maintainability and Portability can be seen in Table 3. Testability has been excluded, since its definition concurs with the one previously presented (from McCall’s model).

Table 3. Quality Attributes in ISO 9126-1
Attribute Definition [5]
Analysability “The capability of the software product to be diagnosed for deficiencies or causes of failures in the software, or for the parts to be modified to be identified.”
Changeability “The capability of the software product to enable a specified modification to be implemented.”
Stability “The capability of the software product to avoid unexpected effects from modifications of the software.”
Adaptability “The capability of the software product to be adapted for different specified environments without applying actions or means other than those provided for this purpose for the software considered.”
Installability “The capability of the software product to be installed in a specified environment.”
Co-existence “The capability of the software product to co-exist with other independent software in a common environment sharing common resources.”
Replaceability “The capability of the software product to be used in place of another specified software product for the same purpose in the same environment.”
It can be seen that Changeability corresponds to Modifiability as defined in Boehm’s model. We will further on
only use the term Changeability as referring to both Changeability and Modifiability. Moreover, Installability, Co-existence and Replaceability can be said to belong to a site-specific user or
operations perspective rather than a developer perspective. Although they may be border cases, we choose to exclude them from further discussions in this chapter.
Adaptability, being the only remaining sub-attribute of Portability, is defined in a way that roughly corresponds to the definition of Portability from the SEI glossary. Since the definitions are similar and the definition of Portability is easier to comprehend, we will not discuss Adaptability further in this chapter.
4.2.2.4 Result Based on the discussions in sections 4.2.2.1, 4.2.2.2 and 4.2.2.3, we present here the list of quality attributes
that will be discussed in the remainder of this chapter. The list is shown in Table 4.
Table 4. Final Quality Attributes
Attributes
Correctness Testability Flexibility Portability Reusability
Interoperability Analysability Changeability Stability
In the next section, we look at each quality attribute in Table 4 and see how it can be achieved when designing and building a software system. Conflicts, synergies and required trade-offs are discussed in Section 4.4.
4.3. How to Manage
In this section, we look at each quality attribute listed in Table 4 and discuss supporting characteristics and mechanisms. As the quality models link attributes to characteristics, they form valuable sources in the discussions. However, we also look at other work where the attributes have been investigated.
Before diving into the attributes, one mechanism that we will encounter warrants a short explanation. The mechanism is to use simple solutions when designing and implementing the system. It is very difficult to determine what a simple solution to a problem really is. A key observation, however, is that simple is a relative concept rather

than an absolute one. In other words, finding a simple solution is not about using function-oriented design and writing code using only basic programming constructs, but rather about selecting the simpler solution of a number of possibly complicated ones. For example, Häggander et al. found, in evaluating Performance and Maintainability of the parser component of an anti-fraud application, that it was beneficial to replace the in-house constructed adaptable design with one based on commonly available tools for parser generation. The new solution, still constituting a complicated design, required substantially less development effort and could thus be said to be simpler.
It should also be noted that we will not present specific metrics for measuring the use of mechanisms and achievement of attributes. As has been stated, the lack of a rationale for how characteristics and mechanisms actually contribute to the achievement of attributes is a problem of quality models in general, and it is out of the scope of this chapter to deal with that problem.
4.3.1. Correctness Definition: “The degree to which a system or component is free from faults in its specification, design, and
implementation” [4]. Correctness, which appears in McCall’s quality model, can be seen as a developer-oriented quality attribute
given that it should be relevant for developers that seek to ease their efforts in developing and maintaining the system. McCall’s model links Correctness to three quality criteria, i.e. characteristics [3]: • • •
• • •
• •
• •
•
Traceability Completeness Consistency
In other words, striving for traceability, completeness and consistency would be a recipe for reaching Correctness. Traceability would make it possible to know the relationships of a particular entity to other entities, and thereby with higher confidence state its correctness. Completeness facilitates the assessment of Correctness as there are no parts of the system that are not covered in execution. Finally, consistency is a part of Correctness as an inconsistent system would have a higher error probability. The problem with these characteristics is that it is equally hard to reach them as it is to reach Correctness in the first place. For example, how do we ensure completeness and consistency? Granted, traceability is more tangible and can be accomplished through a structured approach to developing and interconnecting artefacts in the system.
Barber and Holt discuss Correctness as exhibited through three properties of a software architecture [7]: Safety Liveness Completeness
Safety means simply put that the system does not ever perform anything “bad”, while liveness correspondingly means that the system eventually performs something “good”. Barber and Holt suggest that model checking can be used to evaluate safety and liveness, provided that the architecture specifications exist in a form suitable for a model checking tool. Furthermore, they state that while model checking is not suitable for capturing completeness errors, simulation is. Simulation can be used to visualise the system’s execution profile, in order to spot completeness errors. However, two downsides are (1) that human intervention for interpreting the simulation results is necessary; and (2) that simulation can show completeness errors, but not prove their absence [7].
Cleanroom is a software engineering process with the objective of generating zero-defect software with high probability [8]. In Cleanroom, verification of Correctness is an integral activity that replaces unit testing and debugging. Verification of Correctness is performed by analysing the expansions of Cleanroom’s boxes: black box, state box and clear box. The boxes provide increasingly detailed views of the system, and it is necessary to verify the expansion of one box into another for consistency and closure. Furthermore, Correctness of increments is ensured through mental proofs in team reviews [8].
Based on the above, it seems to be time-consuming to achieve high Correctness. While full Correctness can never be guaranteed, some measures can be taken to increase the probability of having high Correctness:
Ensure traceability by linking artefacts to each other during development. Transfer architecture specifications into forms suitable for model-checking. Use model-checking regularly to check for safety and liveness errors. Run simulations on a regular basis to capture completeness errors. Use a structured way of expanding an abstract specification of the system into a detailed specification. Verify each expansion step to ensure consistency and closure. Perform team reviews to mentally prove Correctness of the system.

4.3.2. Testability Definition: “The degree to which a system or component facilitates the establishment of test criteria and the
performance of tests to determine whether those criteria have been met” [4]. Testability is an attribute that occurs in both McCall’s model and Boehm’s model. In the models, it corresponds
to the following characteristics [3]: • • • • • • •
• • • • •
•
•
• • • •
Simplicity Instrumentation Self-descriptiveness Modularity and structuredness Accountability Accessibility Communicativeness
A simple solution is easier to test than a complex one, simply because it is easier to construct covering test cases. Instrumentation means that it is possible to put probes in the system in order to achieve test data. A self-descriptive system is documented and readable. A modular system is divided into distinct modules, which means that testing efforts can be isolated if necessary. It follows that fewer test combinations should be required, as the communication paths are clearer. Similarly, structuredness implies that the parts of the system are organised in a consistent manner. A system with accountability is a system for which it is possible to measure the usage of the code [14]. Typically, such measurements are performed by coverage tools, which exist for several different programming languages. Accessibility means that the system allows usage of its parts in a selective manner [14], which helps testing as test cases can be constructed with higher flexibility. Finally, communicativeness means that it is possible to easily specify and understand inputs to and outputs from the system [14], which again facilitates the construction of test cases.
Freedman points out that a system or component can show certain behaviours that decreases the perceived Testability [15]. One such behaviour is input inconsistencies, which means that as a specific input is repeated, the output does not stay the same. This does not necessarily indicate a fault in the component or system, but can also mean that the output is not functionally dependent on the input alone. Input inconsistencies are typically seen in database systems and distributed systems [15]. Another behaviour is output inconsistencies, which means that the output does not fully cover the output domain, even though all known variations of input are given. This can imply a fault in the system, but also that the missing output values are generated for yet unknown states in the system [15]. Either way, input and output inconsistencies decrease Testability. Freedman captures the absence of input and output inconsistencies in two system characteristics, observability and controllability, respectively.
Since testing is much about passing input data and checking output, it helps to have clearly defined component and communication interfaces. One way of achieving this is to rely on existing middleware systems for communication, such as OMG’s CORBA or Microsoft’s COM/DCOM.
The way we design and implement a system can affect Testability much, and may facilitate testing efforts substantially. Some guidelines for improving Testability are:
Construct simple solutions that facilitate the creation of test cases. Ensure modularity and a structured organisation of the parts of the system. Document the system properly. Provide mechanisms that allow probing of the code, e.g. debug output mechanisms. Enable the use of selected parts of the system in an isolated manner, e.g. by not tying the parts to fixed data and complex control flows (implies having low coupling between modules). Provide ways to easily specify inputs and ensure that output is understandable. Try to avoid input and output inconsistencies by specifying and connecting input and output domains. Define clear component and communication interfaces, for example by using standardised middleware systems such as CORBA or COM/DCOM.
4.3.3. Flexibility Definition: “The ease with which a system or component can be modified for use in applications or
environments other than those for which it was specifically designed” [4]. Flexibility is part of McCall’s quality model, and links to the following four characteristics [3]: Simplicity Expandability Generality Modularity

Simplicity favours Flexibility since it generally fosters understandability. A simple and understandable system is easier to modify than a complex one. A system has high expandability when it is easy to add new functionality to it. Adding new functionality is one part of modifying for use in other environments or applications. Generality means general solutions that by nature are prepared for being utilised in other contexts than the ones for which they were constructed. Modularity, finally, increases Flexibility since we can add, remove or switch modules in a controlled fashion.
Lassing et al. analyse Flexibility in an architecture by using the SAAM evaluation method (see Section 4.5.1). They define a number of scenarios that express environmental changes to the system, and discuss how the system handles the scenarios [16].
Flexibility is in general considered in its broader meaning – to be flexible. In many cases, Flexibility is seen as the property of being flexible, as opposed to static. This way, Flexibility represents an openness which in turn encompasses many different aspects and attributes of a system. Leaning on our original definition, however, we can give the following guidelines for achieving Flexibility: •
•
•
• •
• • • •
• •
• • •
Favour simple solutions before complex ones, since they are easier to modify and thus convey higher Flexibility. Ensure that it is easy to add new functionality to the system. Object-orientation and polymorphism is one way of doing this, support for loadable modules is another. Try to create general solutions that are easy to adapt or that in themselves provide enough breadth to cover future modifications. Create modular solutions to allow for easy removal and addition of functionality. Design with Flexibility scenarios in mind, i.e. try to envision future possible environmental changes.
4.3.4. Portability Definition: “The ease with which a system or component can be transferred from one hardware or software
environment to another” [4]. Portability is included in McCall’s model, Boehm’s model and in ISO 9126-1. The characteristics that support it
are [3]: Simplicity Software system independence Machine/device independence Self-containedness
As we saw with Flexibility, a simple solution is easier to modify than a complex one. In the case of Portability, it is essential that solutions are simple and understandable, since the transition to a different platform is very challenging in itself. Software system independence and machine/device independence is desirable for reaching Portability, but is often not entirely possible. Systems that are prepared for being ported to different platforms sometimes incorporate an exchangeable Hardware Abstraction Layer (HAL) that decouples the system from the native platform. An example of such a system is Microsoft Windows, in which different HALs provide support for different numbers of CPUs9. Self-containedness is a property which means that the system relies little on externally provided services [14], which means that it should be easy to decouple from the current platform.
Matinlassi evaluates Portability in an architecture by using a custom evaluation method that is scenario-based [17], similar to what Lassing et al. do for Flexibility [16]. Matinlassi stresses the fact that architectural descriptions must be designed to serve quality evaluation. He also suggests two aspects that play important roles when evaluating Portability: component responsibility and component allocation. Responsibility descriptions are useful to assess the impact of the scenarios on the architecture. Furthermore, porting a system is likely to affect component allocation. Therefore, it is useful to have a deployment view of the architecture where component allocation is visible [17].
Certain programming languages support Portability out-of-the-box. A Java program, for example, is portable since it is compiled to byte code that is interpreted in runtime by an interpreter. Interpreters exist for most platforms.
To sum up, Portability is enhanced through the following mechanisms: Use simple solutions to allow for less porting effort. Try to avoid tying the system to the platform too much. If necessary, consider constructing an abstraction of the platform. Use as few external services as possible – rely heavily on internal functionality. Clearly define component responsibility in the architecture. Provide a deployment view of the architecture. Consider using a programming language that is portable in itself.
9 Previous versions of Windows could be run on both Intel platforms and Alpha platforms thanks to the Hardware Abstraction Layers.

4.3.5. Reusability Definition: “The degree to which a software module or other work product can be used in more than one
computing program or software system” [4]. Reusability appears in McCall’s model, and is decomposed into the following characteristics [3]:
• • • • •
• • • • • • • •
• •
Simplicity Generality Modularity Software system independence Machine independence
A simple solution, as opposed to a complex one, is easier to understand and should therefore be easier to reuse in a different system. Similarly, writing general functionality as opposed to specific ensures a certain breadth which is useful in reuse situations. A modular system is a system where functionality is isolated in distinct modules. The converse would be a monolithic system, where all functionality is captured in one single unit. Having distinct modules suggests that functionality can be decoupled from the system. Finally software system and machine independence also provides breadth in the sense that functionality is not locked onto a certain system or platform.
Buschmann discusses software architecture and reuse, and provides some additional tangible guidelines for Reusability [9]. He states that having loosely coupled modules fosters reuse. A modular design is a great step towards Reusability, but if the modules are entangled in complex ways, they will be very hard to reuse anyway. Furthermore, he argues that coordinated artefacts, i.e. artefacts that follow similar design and implementation principles and that show similar internal and external structures, are easier to reuse. He also suggests architectural styles and patterns, i.e. pre-defined mechanisms for solving specific problems or for providing well-known functional and non-functional behaviour, as possible building blocks in reusable systems. Finally, he mentions frameworks as semi-finished and ready-to-use building blocks for specific application domains, and customisable open systems that can be adapted to different contexts.
Boxall and Araban argue that an important ingredient for Reusability of components is the understandability of their interfaces [10]. They define a number of metrics to assess the interface understandability. The metrics are based on a number of relevant assumptions. For example, they state that interfaces with lower argument count per procedure are easier to understand. Furthermore, they suggest that an interface that is consistent and systematic with respect to argument naming and typing fosters understandability and thereby Reusability.
Chiang discusses different middleware systems, such as CORBA, COM/DCOM and Sun’s Java Enterprise Beans, and argues that a component that communicates via such a middleware system is less dependent on the context and has therefore higher Reusability [12]. This view is shared with Davis et al. [11]. Chiang claims, however, that components communicating through a middleware system have high interaction complexities with the middleware itself. To solve this problem, Chiang proposes the use of adapters that provide yet another level of indirection in order to increase Reusability even more [12].
It may be difficult to design for Reusability, because modules and components are often primarily created for functional reasons, not for being reused. However, we have above seen a number of principles and mechanisms for building systems or parts of systems that have high probabilities of being reusable:
Construct simple and general solutions to increase understandability and thereby ease of reuse. Build a modular system, but ensure that modules are as loosely coupled as possible. Do not lock onto a specific operating system or hardware platform. Keep similar design and implementation principles and component structures among different components. Make use of architectural styles and patterns as building blocks with well-known properties. Employ frameworks and open systems as adaptable and ready-to-use building blocks. Use standardised middleware systems such as CORBA or COM/DCOM for communication. Define consistent and systematic component interfaces.
4.3.6. Interoperability Definition: “The ability of two or more systems or components to exchange information and to use the
information that has been exchanged” [4]. Interoperability appears in both McCall’s model and ISO 9126-1. However, in the latter it has a different, more
use-oriented definition. Here, we go with the definition in SEI’s glossary, which corresponds to its appearance in McCall’s model.
In McCall’s model, Interoperability is decomposed into two characteristics [3]: Communications commonality Data commonality

The basic concept captured by these two characteristics is that to reach high Interoperability, it is necessary to communicate in the same way and to represent data in the same way as the systems with which interaction is desired.
Davis et al. list a set of software architecture characteristics concerning system, control and data [11]. They state that it is possible to compare the architectures of interoperating systems with respect to the presented characteristics in order to find possible Interoperability conflicts. An example of a system characteristic is whether a component uses blocking or non-blocking communication. An example of a control characteristic is whether the control structure is single-threaded or multi-threaded. Finally, an example of a data characteristic is whether method of data communication is point-to-point, broadcast or multicast.
Based on their characteristics for system, control and data, Davis et al. evaluate a number of systems in order to find Interoperability conflicts. The conflicts they find stem from the use of different data formats, synchronous vs. asynchronous communication, different communication protocols, different data transfer methods and different control flows in the systems [11].
Standardised middleware systems can be used as enablers of Interoperability, as they dictate and pursue solutions to the data and control issues that otherwise can lead to Interoperability conflicts. Chiang mentions CORBA, COM/DCOM, and Java Enterprise Beans as examples of middleware systems [12]. All of these provide mechanisms that a component can use for communicating with other components without regard to location and programming language, for example.
Chung et al. look at Web services as a means to reach Interoperability between applications [13]. Web services are web-based applications that provide services through the use of standardised protocols such as XML, Simple Object Access Protocol (SOAP) and Web Services Description Language (WSDL). The use of open standards boosts Interoperability, even though it leaves open issues of business and application logic.
Interoperability requires informed decisions very early in a system’s lifecycle, before or during the design of the system’s architecture. Decisions must be based on an assessment of relevant technologies and solutions employed by other systems with which to interact. Typically, the following measures and mechanisms support Interoperability: • • •
• • • • • • •
• • • •
Ensure common/compatible data communication protocols, data representation models and control structures. Make use of existing middleware systems for language and location independence. Use open standards for communication.
4.3.7. Analysability Definition: “The capability of the software product to be diagnosed for deficiencies or causes of failures in the
software, or for the parts to be modified to be identified” [5]. Analysability is part of the decomposition of Maintainability in ISO 9126-1. While ISO does not mention any
characteristics that support Analysability, we can deduce some important characteristics based on the definition. The first part, “the capability of the software product to be diagnosed for deficiencies or causes of failures in the software”, is similar to the definition of Testability. Therefore, it seems reasonable to assume that the characteristics that support Testability also support Analysability. In short, these are (see Section 4.3.2 for details):
Simplicity Instrumentation Self-descriptiveness Modularity and structuredness Accountability Accessibility Communicativeness
The second part of the definition of Analysability, “or for the parts to be modified to be identified”, is connected to the field of change impact analysis. Some mechanisms that facilitate change impact analysis are [18]:
Traceability Simplicity Modularity Formal specifications (such as Architecture Description Languages or object models)
Traceability allows a modification of one system artefact to be traced to other system artefacts that also will be affected. This requires the definition of traceability links between artefacts during development. When determining the impact of a change, simple solutions are easier to assess than complex one. With complex solutions, there is a high risk that some impact is overlooked. Modularity favours change impact analysis since functionality is divided into distinct modules. This makes it easier to determine if a modification is isolated to one specific part of the

system. Finally, formal specifications can be used with tools that automatically determine impact based on predefined rules and assumptions.
Combining the two perspectives, we can see the following as guidelines for achieving Analysability: • • •
• •
•
• • •
Aim for high Testability (see Section 4.3.2). Establish traceability links between system artefacts during development. Consider using formal specifications to enable tool automation.
4.3.8. Changeability Definition: “The capability of the software product to enable a specified modification to be implemented” [5]. Like Analysability, Changeability is an attribute defined in ISO 9126-1, and lack consequently supporting
characteristics from the model. However, Kabaili et al. state that low coupling is commonly seen as a supporting measure of Changeability [19]. They attempt to show that high cohesion is such a measure as well, but fail to find a significant correlation.
Liu et al. promote the “design for change” paradigm, in which you prepare the system for future changes already during the design phase [21].
Based on previous discussions, we can assume that simplicity favours Changeability, since complex solutions by nature are difficult to modify.
In total, the Changeability of a system is supported by the following mechanisms: Aim for simple solutions, since they are easier to modify than complex ones. Strive for low coupling in the system, as it limits change impact and makes it easier to incorporate a modification. Design with change in mind, i.e. try to envision future changes.
4.3.9. Stability Definition: “The capability of the software product to avoid unexpected effects from modifications of the
software” [5]. Stability is in this context not directly connected to the ability of the system to show stable behaviour when
used. However, if modifications often have unexpected effects, then system’s Stability from a use perspective will be affected.
Stability is related to Changeability, in that a system with low Changeability is likely to show low Stability as well. This follows from the fact that trying to modify a system with low Changeability is associated with great risk and can result in faults.
Chaumun et al. show that object-oriented classes with high degree of usage in terms of method invocation and variable access from other classes often are greatly affected by changes [20]. In order to have high Stability, changes should be isolated as much as possible to allow control of the performed modifications. Central classes (or components) with much access are likely sources of problems with low Stability.
Bahsoon and Emmerich approach architecture Stability by performing predictive evaluations of likely future changes to the system [22]. The likely changes are based on an evolutionary view of the system. This is similar to what we have seen before with Flexibility and Changeability, i.e. to have future changes in mind during design.
Some guidelines for achieving high Stability, based on the above, are: Aim for high Changeability (see Section 4.3.8). Avoid central classes (or components) with much access from other parts of the system. Perform predictive evaluations of likely future changes (implies designing for change).
4.4. Trade-offs
In this section, we look at conflicts and synergies between the quality attributes discussed in the previous section. A conflict arises between two attributes when it is impossible, or difficult, to realise both of them at the same time. This can happen for example if a particular mechanism favours the first attribute but hinders the second. When two quality attributes are in conflict, it is necessary to make a trade-off with the objective of finding an appropriate balance of the two attributes. Synergetic attributes are attributes that have much in common and are realised in similar ways.
Looking at the mechanisms and characteristics that support the discussed quality attributes, it is clear that there is a potentially conflicting mechanism, namely that of using simple solutions. We have discussed what it means to have a simple solution earlier, but it is also now appropriate to shed some additional light on it. Portability, for example, seems to have an internal conflict between using simple solutions and not tying too hard to the platform. Minimising coupling towards the platform calls for constructs such as platform abstraction or compliance with
system standards (such as POSIX), which may or may not be a step away from having a simple solution. However, it may be the case that platform abstraction is the simplest among a number of alternatives for achieving low platform coupling, implying that the conflict is not necessarily present. Having said that, though, we recognise that there are solutions that, despite being the simplest, definitively contradict simplicity. With such solutions, it is likely necessary to make trade-offs between quality attributes, and possibly also within a particular attribute itself.
There are a number of mechanisms that are shared between attributes, as can be seen below. If two quality attributes share a particular mechanism, using that mechanism obviously favours both attributes. As we will see, there are mechanisms that in this manner favour a large number of attributes.
The following attributes are favoured by simple solutions: •
•
•
•
•
•
•
•
• • •
Testability, Flexibility, Portability, Changeability, Reusability, Stability, Analysability
The following attributes are favoured by general solutions, i.e. solutions that by nature are prepared to handle future situations:
Flexibility, Reusability
The following attributes are favoured by having a modular design:
Testability, Flexibility, Reusability, Analysability
The following attributes are favoured by designing with change in mind:
Flexibility, Changeability, Stability, Analysability
The following attributes are favoured by using a middleware system, such as CORBA, for communication:
Interoperability, Reusability, Testability
The following attributes are favoured by having traceability between system artefacts:
Correctness, Analysability
The following attributes are favoured by low coupling between components or modules:
Changeability, Stability, Testability
The following attributes are favoured by not tying too hard to a specific platform:
Portability, Reusability
We see that using simple solutions, having a modular design and designing for change are three mechanisms that facilitate most of the quality attributes. We suggest that these are the three most influential mechanisms.
It is also possible to look at attributes that share many mechanisms and from that draw conclusions about synergies. One obvious synergy is Stability and Changeability, since the former as stated draws on the latter. Similarly, there is a synergy between Analysability and Testability. We will not present an extensive breakdown of possible synergies here mainly because we consider it more important to look at the mechanisms.
4.5. Evaluation Methods
Since developer-oriented attributes should be taken care of in the product’s architecture design, they can in general be evaluated using methods for architecture evaluation. Even though architecture design is an early activity, architecture evaluation can be performed both during development and as post-evaluation during maintenance. It is, however, essential to evaluate early in order to detect problems related to quality attributes before they get unmanageable. While there are a number of evaluation methods, we will only present three of them here:
Software Architecture Analysis Method (SAAM) Architecture Trade-off Analysis Method (ATAM) Bosch’s generic architecture evaluation method
Both ATAM and SAAM are common methods for architecture evaluation developed by the Software Engineering Institute. For more complete overviews of evaluation methods, see [22] and [25].
Evaluation methods can be used in mainly two distinct situations: to assess the suitability of one particular architecture, and to compare different candidate architectures to find the most appropriate one. A third, less articulated situation, is to assess the “theoretical maximum” with respect to quality attributes of an architecture [1].

4.5.1. SAAM The Software Architecture Analysis Method is a method created for describing and analysing software
architectures. The method promotes the use of three perspectives for describing an architecture: functionality, structure and allocation. The structural perspective is supported by the definition of a simple language, to ensure consistency among candidate architectures [23].
SAAM consists of five main steps [22, 23]: 1. Find a functional partitioning of the domain. 2. Map the functional partitioning onto the architecture’s decomposition 3. Select quality attributes 4. Select scenarios which test the quality attributes 5. Evaluate the degree to which the architecture supports each scenario
SAAM was created primarily for quality attributes such as Modifiability, Variability and Achievement of functionality [22]. It is a scenario-based method, in which scenarios are classified as direct or indirect. Direct scenarios are those that the architecture supports without modification, while indirect scenarios are those for which the architecture needs to be modified to support. When two or more indirect scenarios require modifications of the same module or component, the scenarios are said to interact in that module or component. High scenario interaction indicates weak points in the architecture, possible because of component responsibility issues or insufficient decomposition [22].
Note that SAAM defines Modifiability in a way that it fits the attributes Flexibility, Changeability and possibly Portability discussed previously in this chapter.
4.5.2. ATAM The Architecture Trade-off Analysis method was created to help mitigate the inherent problems with designing
a system for multiple, possibly conflicting, quality attributes. ATAM is a successor to SAAM, facilitating the identification of trade-off points between quality attributes and providing extensive process support [24, 25].
ATAM is an iterative spiral model, in which each iteration adds to the understanding of the system, reducing risks and generating more informed designs. The method consists of four main phases [24]: 1. Scenario and requirements gathering 2. Architectural views and scenario realisation 3. Model building and analyses 4. Trade-offs
Phase 1 encompasses two interchangeable steps: collection of scenarios and collection of requirements. These two steps are often not sequential, as it can be the case that scenarios drive requirements collection or vice versa. The purposes of collecting scenarios are to create a shared vision of the system, to facilitate communication among stakeholders and to operationalise functional as well as non-functional requirements.
There are three types of scenarios in ATAM: use case scenarios, growth scenarios and exploratory scenarios [22]. Growth scenarios represent anticipated changes for the system, and are therefore suitable for evaluating attributes such as Flexibility, Changeability, Stability, and Analysability. Exploratory scenarios are more extreme and involve stress-testing the architecture in terms of exposing it to large-scale and complex changes.
Phase 2 also consists of two interchangeable steps: create architectural views and realise scenarios. In this phase, competing candidate architectures are designed based on requirements, scenarios and possibly existing systems and legacy architectures. It is imperative to describe the architecture using views and elements that are relevant for the quality attributes being evaluated.
In phase 3, the relevant quality attributes are analysed in isolation for all candidate architecture. This means that each attribute is considered by itself, without regard to other attributes. The expected output is a set of statements about the behaviour of each candidate architecture.
Finally, phase 4 consists of the steps sensitivity analysis and trade-off identification. Sensitivity analysis is the activity of assessing which quality attributes are sensitive to changes in the architecture. In the trade-off identification that follows, the elements of the architecture to which several attributes are sensitive are considered as trade-off points.
After the four phases have been completed, the method can be repeated until the analyses show that the requirements have been met and a suitable architecture has been found [24].
4.5.3. Generic Bosch proposes a generic architecture design and evaluation method which consists of three main steps [1]:
• Functional architecture design

• •
• • • • •
• • •
• • •
Quality attribute assessment Architecture transformation
In functional architecture design, an initial architecture is created mainly based on the functional requirements of the system. While it often is difficult not to consider basic non-functional requirements, these should not receive any particular attention in this step.
In quality attribute assessment, scenario profiles for the relevant quality attributes are constructed. Each scenario profile is used to assess one particular attribute, and is tailored accordingly. For example, operational attributes have corresponding profiles with use scenarios, while attributes such as Changeability and Flexibility have corresponding profiles with change scenarios. For evaluating the architecture, Bosch provides four different evaluation methods: scenario-based evaluation, simulation-based evaluation, mathematical modelling and experience-based evaluation. These can be used based on need, knowledge and experience. For example, simulation-based evaluation consists of five steps [1]:
Define and implement the system context Implement architectural components Implement the scenario profile Run the simulation Predict the quality attribute(s)
In predicting a quality attribute, values obtained from the simulation (or any other type of evaluation, for that matter) are weighed and combined in order to form one value for the attribute.
The third step, architecture transformation, is performed based on the evaluation results. If the evaluation shows that the architecture does not fulfil its quality requirements, it must be transformed, for example by imposing architectural styles and patterns.
Bosch’s method is iterative, meaning that after architecture transformation, the architecture is re-evaluated to see if the transformation has been successful. The re-evaluation involves repeating all steps in the assessment step, e.g. to perform a full simulation again. The reason for this is that while a transformation may successfully augment the architecture with respect to one attribute, it may actually degrade the architecture with respect to another. It is therefore essential to perform a complete re-evaluation.
4.5.4. Evaluation Method Summary To sum up the evaluation methods presented above with respect to the quality attributes discussed in this
chapter, we see that:
SAAM is suitable for evaluating Flexibility, Changeability and possibly Portability. ATAM is suitable for evaluating, for example, Flexibility, Changeability, Stability, and Analysability. Bosch’s generic method is suitable for evaluating most of the attributes.
Two attributes that are difficult to evaluate using the methods presented are Correctness and Testability. While one way of achieving (and evaluating) Correctness is to run simulations, it is probably more appropriate to perform reviews and inspections. Furthermore, Testability can be evaluated through actual testing, possibly early on using high-level test cases.
4.6. Summary
We have looked at three different quality models: McCall’s model, Boehm’s model and ISO/IEC 9126-1. From the models, we have selected nine quality attributes with orientation towards developers. These are Correctness, Testability, Flexibility, Portability, Reusability, Interoperability, Analysability, Changeability and Stability. We have looked at the attributes in detail and discussed and suggested mechanisms for supporting and improving them. Many mechanisms are shared among the attributes, indicating that the attributes are synergetic rather than conflicting.
Based on the suggested mechanisms, we have briefly looked at synergies between attributes by listing the attributes that are favoured by each mechanism. This has resulted in an important insight; the three most influential mechanisms seem to be:
Stick to simple solutions (simplicity) Create modular designs (modularity) Design for change (envision future changes)

We have also looked at three evaluation methods geared towards software architecture evaluation: SAAM, ATAM and Bosch’s generic method. These methods can be used for assessing the suitability of a particular architecture with respect to one or more quality attributes. In the context of developer-oriented attributes, either one of the methods is appropriate to use. However, SAAM has a more narrow target group of attributes than the others.
When designing a software system, it is essential to consider quality attributes early on, in the architecture design phase. Adhering to certain mechanisms facilitates the support of quality attributes, which is crucial for meeting the system’s quality requirements. The purpose of this chapter has been to provide an overview of common quality attributes and also to recommend ways of approaching them. This is important in industry (and academia to some extent as well), as quality attribute often are discussed without a holistic view of their implications, strengths and shortcomings.
4.7. References
[1] Bosch, J. (2000): Design & Use of Software Architectures, Addison-Wesley. [2] Hofmeister, C., Nord, R., Soni, D. (2001): Applied Software Architecture, Addison-Wesley. [3] Pfleeger, S. L. (1998): Software Engineering - Theory and Practise, Prentice-Hall. [4] Software Engineering Institute: Glossary - Software Technology Roadmap,
http://www.sei.cmu.edu/str/indexes/glossary, last checked Nov. 30, 2004. [5] ISO/IEC 9126-1 (1991): Software Product Evaluation - Quality Characteristics and Guidelines for their Use,
ISO/IEC Standard ISO-9126. [6] McCall, J. A. (2002): Quality Factors, Encyclopedia of Software Engineering, online version,
http://www.mrw.interscience.wiley.com/ese/articles/sof265/abstract-fs.html, last checked Dec. 01, 2004. [7] Barber, K. S., Holt, J. (2001): Software Architecture Correctness, IEEE Software, 18(6):64-65. [8] Linger, R. C., Hevner, A. R. (1993): Achieving Software Quality Through Cleanroom Software Engineering,
Proc. of the 26th Hawaii Intl. Conf. on System Sciences, vol. 4, pp. 740-748. [9] Buschmann, F. (1994): Software Architecture and Reuse – An Inherent Conflict?, Proc. of 3rd Intl. Conf. on
Advances in Software Reusability, pp. 218-219. [10] Boxall, M. A. S, Araban, S. (2004): Interface Metrics for Reusability Analysis of Components, Proc. of the
2004 Australian Software Engineering Conference, pp. 40-50. [11] Davis, L., Gamble, R. F., Payton, J. (2002): The Impact of Component Architectures on Interoperability,
Journal of Systems and Software, 61(1):31-45. [12] Chiang, C. C. (2003): The Use of Adapters to Support Interoperability of Components for Reusability,
Information and Software Technology, 45(3):149-156. [13] Chung, J., Lin, K., Mathieu, R. G. (2003): Web Services Computing – Advancing Software Interoperability,
Computer, 36(10):35-38. [14] Boehm, B. W., Brown, J. R., Lipow, M. (1976): Quantitative Evaluation of Software Quality, Proc. of the
2nd Intl. Conf. on Software Engineering, pp. 592-605. [15] Freedman, R. S. (1991): Testability of Software Components, IEEE Trans. on Software Engineering, 17(6):
553-565. [16] Lassing, N., Rijsenbrij, D., van Vliet, H. (1999): Towards a Broader View on Software Architecture Analysis
of Flexibility, Proc. of the 6th Asia Pacific Software Engineering Conf., pp. 238-245. [17] Matinlassi, M. (2004): Evaluating the Portability and Maintainability of Software Product Family
Architecture – Terminal Software Case Study, Proc. of the 4th Working IEEE/IFIP Conf. on Software Architecture, pp. 295-298.
[18] Bohner, S. A., Arnold, R. S. (1996): Software Change Impact Analysis, IEEE Computer Society Press. [19] Kabaili, H., Keller, R. K., Lustman, F. (2001): Cohesion as Changeability Indicator in Object-Oriented
Systems, Proc. of 5th European Conf. on Software Maintenance and Reengineering, pp. 39-46. [20] Chaumun, M. A., Kabaili, H., Keller, R. K., Lustman, F., Saint-Denis, G. (2000): Design Properties and
Object-Oriented Software Changeability, Proc. of 5th European Conf. on Software Maintenance and Reengineering, pp. 45-54.
[21] Liu, Y., Khong, S. C., Xun, Y., Yuan, M. (2000): Improving Object Oriented Analysis by Explicit Change Analysis, Proc. of the 36th Intl. Conf. on Technology of Object-Oriented Languages and Systems, pp. 2-7.
[22] Bahsoon, R., Emmerich, W. (2003): Evaluating Software Architectures – Development, Stability and Evolution, Proc. of ACS/IEEE Intl. Conf. on Computer Systems and Applications, Tunis, Tunisia.
[23] Kazman, R., Bass, L., Aboyd, G., Webb, M. (1994): SAAM – a Method for Analyzing the Properties of Software Architectures, Proc. of the 16th Intl. Conf. on Software Engineering, pp. 81-90.
[24] Kazman, R., Klein, M., Barbacci, M., Longstaff, T., Lipson, H., Carriere, J. (1998): The Architecture Tradeoff Analysis Method, Proc. of the 4th IEEE Intl. Conf. On Engineering of Complex Computer Systems, pp. 68-78.

[25] Babar, M. A., Zhu, L., Jeffery, R. (2004): A Framework for Classifying and Comparing Software Architecture Evaluation Methods, Proc. of the 2004 Australian Software Engineering Conference, pp. 309-318.
[26] Häggander D., Bengtsson PO., Bosch J., Lundberg L. (1999): Maintainability Myth Causes Performance Problems in SMP Application, Proc. of the 6th Asia Pacific Software Engineering Conference, pp. 516-519.
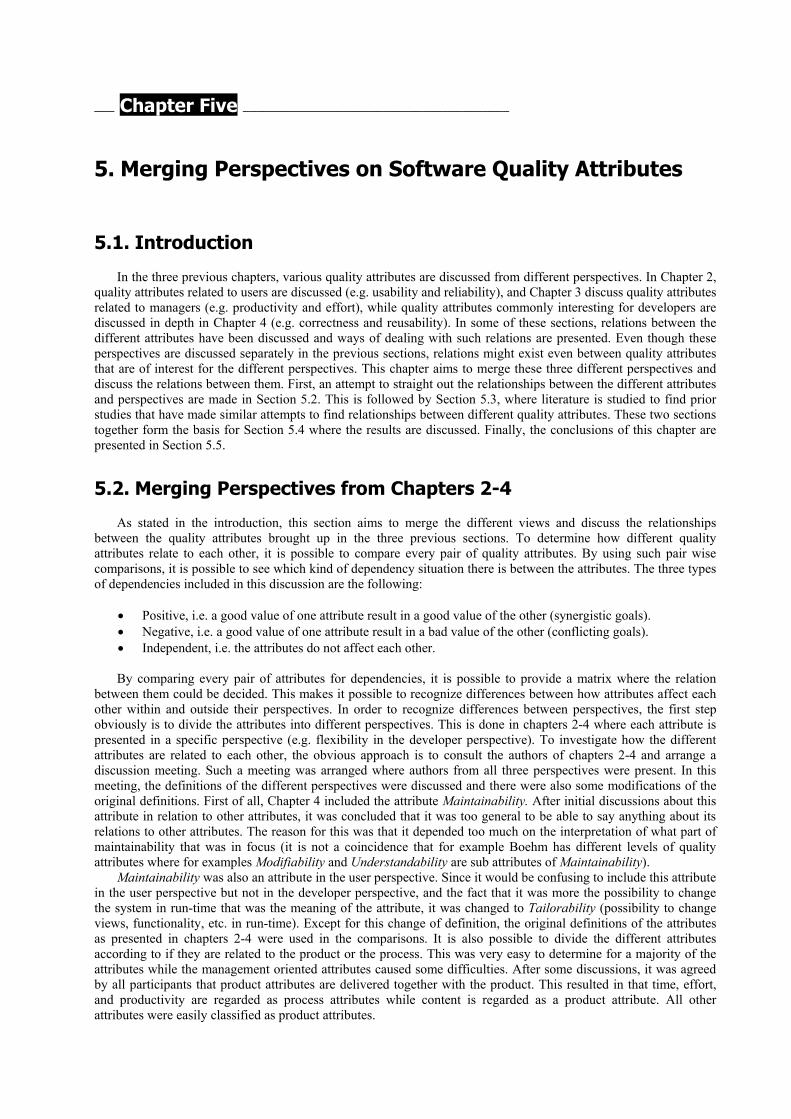
___ Chapter Five ________________________________________
5. Merging Perspectives on Software Quality Attributes
5.1. Introduction
In the three previous chapters, various quality attributes are discussed from different perspectives. In Chapter 2, quality attributes related to users are discussed (e.g. usability and reliability), and Chapter 3 discuss quality attributes related to managers (e.g. productivity and effort), while quality attributes commonly interesting for developers are discussed in depth in Chapter 4 (e.g. correctness and reusability). In some of these sections, relations between the different attributes have been discussed and ways of dealing with such relations are presented. Even though these perspectives are discussed separately in the previous sections, relations might exist even between quality attributes that are of interest for the different perspectives. This chapter aims to merge these three different perspectives and discuss the relations between them. First, an attempt to straight out the relationships between the different attributes and perspectives are made in Section 5.2. This is followed by Section 5.3, where literature is studied to find prior studies that have made similar attempts to find relationships between different quality attributes. These two sections together form the basis for Section 5.4 where the results are discussed. Finally, the conclusions of this chapter are presented in Section 5.5.
5.2. Merging Perspectives from Chapters 2-4
As stated in the introduction, this section aims to merge the different views and discuss the relationships between the quality attributes brought up in the three previous sections. To determine how different quality attributes relate to each other, it is possible to compare every pair of quality attributes. By using such pair wise comparisons, it is possible to see which kind of dependency situation there is between the attributes. The three types of dependencies included in this discussion are the following:
• Positive, i.e. a good value of one attribute result in a good value of the other (synergistic goals). • Negative, i.e. a good value of one attribute result in a bad value of the other (conflicting goals). • Independent, i.e. the attributes do not affect each other. By comparing every pair of attributes for dependencies, it is possible to provide a matrix where the relation
between them could be decided. This makes it possible to recognize differences between how attributes affect each other within and outside their perspectives. In order to recognize differences between perspectives, the first step obviously is to divide the attributes into different perspectives. This is done in chapters 2-4 where each attribute is presented in a specific perspective (e.g. flexibility in the developer perspective). To investigate how the different attributes are related to each other, the obvious approach is to consult the authors of chapters 2-4 and arrange a discussion meeting. Such a meeting was arranged where authors from all three perspectives were present. In this meeting, the definitions of the different perspectives were discussed and there were also some modifications of the original definitions. First of all, Chapter 4 included the attribute Maintainability. After initial discussions about this attribute in relation to other attributes, it was concluded that it was too general to be able to say anything about its relations to other attributes. The reason for this was that it depended too much on the interpretation of what part of maintainability that was in focus (it is not a coincidence that for example Boehm has different levels of quality attributes where for examples Modifiability and Understandability are sub attributes of Maintainability).
Maintainability was also an attribute in the user perspective. Since it would be confusing to include this attribute in the user perspective but not in the developer perspective, and the fact that it was more the possibility to change the system in run-time that was the meaning of the attribute, it was changed to Tailorability (possibility to change views, functionality, etc. in run-time). Except for this change of definition, the original definitions of the attributes as presented in chapters 2-4 were used in the comparisons. It is also possible to divide the different attributes according to if they are related to the product or the process. This was very easy to determine for a majority of the attributes while the management oriented attributes caused some difficulties. After some discussions, it was agreed by all participants that product attributes are delivered together with the product. This resulted in that time, effort, and productivity are regarded as process attributes while content is regarded as a product attribute. All other attributes were easily classified as product attributes.

The next step was to compare all the attributes with each other in order to determine the dependencies between the attributes. The first approach was to compare every pair once without taking order effects into account. After comparing several attributes, it was concluded that the order of the comparisons made impact on whether the pairs had positive, negative or neutral relations. This resulted in that every pair had to be compared twice, in different order. However, after some work with this approach, it was concluded that this would not make sense. The reason for this was that it was shown that a situation like the one presented in Table 1 could be approached.
Table 2. Dependency Matrix. + Represents Positive Dependency, - Represents Negative Dependency, and o Represents no Relationship between the Attributes.
A B C D A + + - B - o o C + o + D - - +
In this table, it is possible to see that it depends on which order attribute A and B are compared. High values of
A facilitate high values of B while high values of B result in low values of A. However, this is not very logical since it would then just to switch order between attributes to obtain high values in both (instead of implementing B before A and loose quality of A, we implement A before B and we will get B for free). Instead, it was decided to work with the assumption that the attributes should have the same effect on each other independently of order. This implies that it is only necessary to compare every pair of attribute once. To create a matrix where every pair of attributes are compared once, and being able to provide the dependencies between the attributes, it was concluded that some assumptions must be:
• The dependencies are determined by analyzing if one attribute automatically is changed (positively or negatively) by the change of the other (i.e. what would maximizing one variable result in the other).
• Dependencies are analyzed from the perspective that it is a new system that shall be developed, and that it is the effort to obtain a value of the attribute that is interesting (e.g. high Testability will not result in high Correctness until the Testability has been used to test the system).
• The relations are investigated from a short term perspective (e.g. the benefits of having reusable components do not influence the fulfillment of other attributes).
• All attributes except for those compared are fixed. The above assumptions were discussed with the authors of the other chapters. However, since time did not
permit the authors to be a part of the further investigation of the relationships, and because the authors had not investigated the dependencies between the attributes within their perspectives, the comparisons between all attributes were performed off line by the author of this section. The result is as presented in Table 2.
Some clarifications have to be done in relation to this table. First of all, the attributes from the developer perspective are marked in light grey, the management attributes are marked in dark grey while attributes from the user perspective are marked in black. The attributes that relate to products are written with default font while the attributes on processes are written in italic and bold text. Since Table 2 was constructed by one person only (by logical reasoning), it is probable that all theses relations are not correct. However, the resulting table has been discussed and verified by the authors of two of the other perspectives (management and developer) to assure its correctness.

Table 3. Dependency Matrix.
Cor
rect
ness
Ana
lyza
bilit
y C
hang
eabi
lity
Stab
ility
Test
abili
ty
Flex
ibili
ty
Porta
bilit
y
Reu
sabi
lity
Inte
rope
rabi
lity
Tim
e (L
ead-
time)
Effo
rt (C
ost)
Con
tent
Prod
uctiv
ity
Rel
iabi
lity
Tailo
rabi
lity
Inte
ract
ive
Per
form
ance
Analyzability o Changeability o + Stability o + + Testability o o o o Flexibility o + + + o Portability o + + + o + Reusability o o o o o o + Interoperability o o o o o + + + Time (Lead- time) - - - - - - - - - Effort (Cost) - - - - - - - - - - Content - - - - - - - - - - - Productivity - - - - - - - - - o o o Reliability + o o o o o - o o - - - - Tailorability o - - - - + - o + - - - - - Interactive Performance o o o o o - - - o - - - - o - Usability o o o o o o o o o - - - - o o o
As can be seen in the comparisons related to the developer perspective, no attributes are in conflict. The
attributes either support each other or they have no relationship. In the management perspective, the attributes are either not dependent on each other or they do affect each other negatively. This is also true for the user perspective. If looking at comparisons between the different perspectives, it is clear that the management attributes always have negative dependencies on other attributes. This is not very surprising since improving the other attributes always carries some amount of costs. It is interesting to see that comparisons between user attributes and developer attributes could have positive, negative and neutral dependencies. However, it is also possible to see that most of the dependencies are negative which indicate that trade-offs commonly have to be made between user attributes and developer attributes. Such trade-offs are always necessary to make when dealing with management attributes and any other attributes from other perspectives.
The construction of the above table was performed by one person (and verified by two more) by logical reasoning rather than finding final evidence about how different attributes affect each other. It is possible to find other dependencies if reasoning differently or stating other assumptions (the other authors had different opinions about some relations when they reviewed the table) and hence it would be interesting to compare the result of this matrix with results from similar comparisons made previously. In the next section (Section 5.3) other similar comparisons are presented.
5.3. Related Work
In Section 5.2, a dependency table was constructed to investigate how different quality attributes relates to each other. As discussed, it was recognized that the dependencies could differ based on how the reasoning was made. In this section, some previous similar work are presented and discussed. For example, McCall performed a similar discussion with slightly different quality attributes to compare. In his work, the attributes are looked at as quality goals when developing software. Attributes that have a positive relationship here are seen as attributes with synergistic goals. Attributes with negative relationships are seen as having conflicting goals and more costly to achieve together. The result is presented in Table 3 where synergistic goals are marked with a +, conflicting goals are marked with a -, and unrelated attributes are marked with an o (note that attributes not considered in this course are removed from the table).

Table 4. Dependency Matrix (McCall), “If a high degree of quality is present for a factor [attribute], what degree of quality isexpected for the other.”[5].
Cor
rect
ness
Rel
iabi
lity
Usa
bilit
y
Test
abili
ty
Flex
ibili
ty
Porta
bilit
y
Reu
sabi
lity
Reliability + Usability + + Testability + + + Flexibility + - + + Portability o o o + o Reusability o - o + + + Interoperability o o o o o + o
As can be seen in this table, a similar result was retrieved as in Table 2. However, the relations between the
attributes differ between the two matrices. For example, Testability and Flexibility was seen as unrelated attributes in Table 2 while these two attributes are considered as having a positive relationship in Table 3 (i.e. synergistic goals).
Deutsch and Willis [1] present another matrix where different quality attributes have been compared. In this matrix, the two-way approach mentioned earlier has been utilized, i.e. every pair is compared twice. If the level of quality is raised for an attribute in one left-hand row, the effect on the attributes in the columns is either positive (+), conflicting (-), or nonexistent (o). The result of this comparison is presented in Table 4 (note that attributes not considered in this course are removed from the table). A positive relationship here comes about when raising the quality of one attribute result in a quality improvement of another attribute as a by-product. For negative relationships, the relationships are opposite.
Table 5. Dependency Matrix (Deutsch and Willis) [1].
Cor
rect
ness
Flex
ibili
ty
Inte
rope
rabi
lity
Porta
bilit
y
Rel
iabi
lity
Reu
sabi
lity
Usa
bilit
y
Ver
ifiab
ility
Correctness + + + Flexibility + - Interoperability Portability Reliability + Reusability + + - Usability + Verifiability
It should be noted that Testability that was brought up in the two proceeding tables is here changed to the
attribute Verifiability. If looking at the result from this table, even though this table is two-way, it is possible to find some differences from the previous tables. For examples, Correctness is regarded as influencing Flexibility positively while these two were unrelated in Table 2. At the same time, Table 4 presents Correctness and Reusability as having a positive relationship while Table 3 regarded them as having no relationships. This shows that all these three attempts to find the relationships between quality attributes have come up with different answers. This conclusion is also drawn in [3] where comparisons in literature and industry have been investigated. The result of that study shows that the relations differ between industry and literature. Further, differences between different industrial cases are also found which indicate that the dependency between attributes are highly dependent on context, application domain etc. Hence, it does not seem possible to conduct generic comparisons as presented in this section (for all attributes in every environment, application domain etc.). A problem with the comparison between the tables above is that it is not explicitly stated what basis (e.g. assumptions) the authors have for putting positive or negative relations between attributes. Further, it is also a problem that the definitions of the attributes not

always are stated explicitly. Both these two circumstances have also been noted in [3]. In the next section, a discussion about the implications of these findings is presented.
5.4. Discussion
As can be seen in the previous section, the results of the different matrices differ and the reasons for the variations could be many. These reasons could for example be related to that definition of the quality attributes are different, the attributes are compared in different domains, the experience of the persons who has constructed the matrix differ, and the interpretation of which mechanisms that are used to obtain a good value of the quality attributes are different.
In Section 5.2, it was discussed that Maintainability was eliminated since it was on a too high level. However, is not something unique to Maintainability. Usability, for example, was really hard to compare with other attributes since it very much depended on which part of Usability that actually was referred to (see table 5.2 where all relationships with Usability are regarded as independent). Even though other attributes are on a lower level, they can still be hard to determine relations between. Often, a number of assumptions have to be made before it is possible to determine the relations (and even then it might be hard). Often, it boils down to assumptions on which mechanisms that are used to fulfill a high level of a certain quality attribute. For example, in Table 5.2, Correctness and Reliability were regarded as having positive dependencies since a few numbers of faults in the software results in both a correct product and a reliable system. However, if making the assumption that high reliability is obtained by providing mechanisms for Error tolerance or Recoverability, it is not as evident that it would result in a positive relationship. In such a case, they might be unrelated, or even negatively related.
The above discussion suggests that it is not possible to provide matrices as presented in Section 5.2 on a quality attribute level (at least not for many of the attributes). Neal and Ralph also noted this problem and they argued that solutions as the one presented in Table 4 is inappropriate when discussing trade-offs between quality attributes [6]. Instead, they argue that an approach suggested by Vincent et al. [9] should be taken when discussing trade-offs. In this approach, they introduce quality criteria (which basically are lower level attributes) that should be compared to the higher level quality attributes. These different criteria are not exclusive for each attribute but could influence any attribute positively, negatively or not at all. A result of such comparison is presented in Table 5.
In Table 5 it is possible to see that the criteria in the left-hand column are compared against the attributes in the top row. These criteria are more close to the mechanisms that are used to fulfill an attribute. This way, it is possible to determine which mechanisms that have positive and negative relations with the attributes. In Dromey, these different criteria are referred to as quality characteristics and they help the software to satisfy the quality attributes [2]. This means that the characteristics may be used to support the higher level quality attributes [2]. However, some of the criteria that are presented above are not seen as characteristics by Dromey. For example, Error tolerance is regarded as a criterion in the above table while it is seen as a mix between a characteristic and an attribute by Dromey. Further, Dromey states that Modularity and Correctness clearly are characteristics. This uncovers another schism between the two models since Correctness are seen as an attribute in Table 5 while Dromey sees it as a characteristic. Dromey further argue that Correctness have wrongly been assigned as a quality attribute in the quality model by McCall.
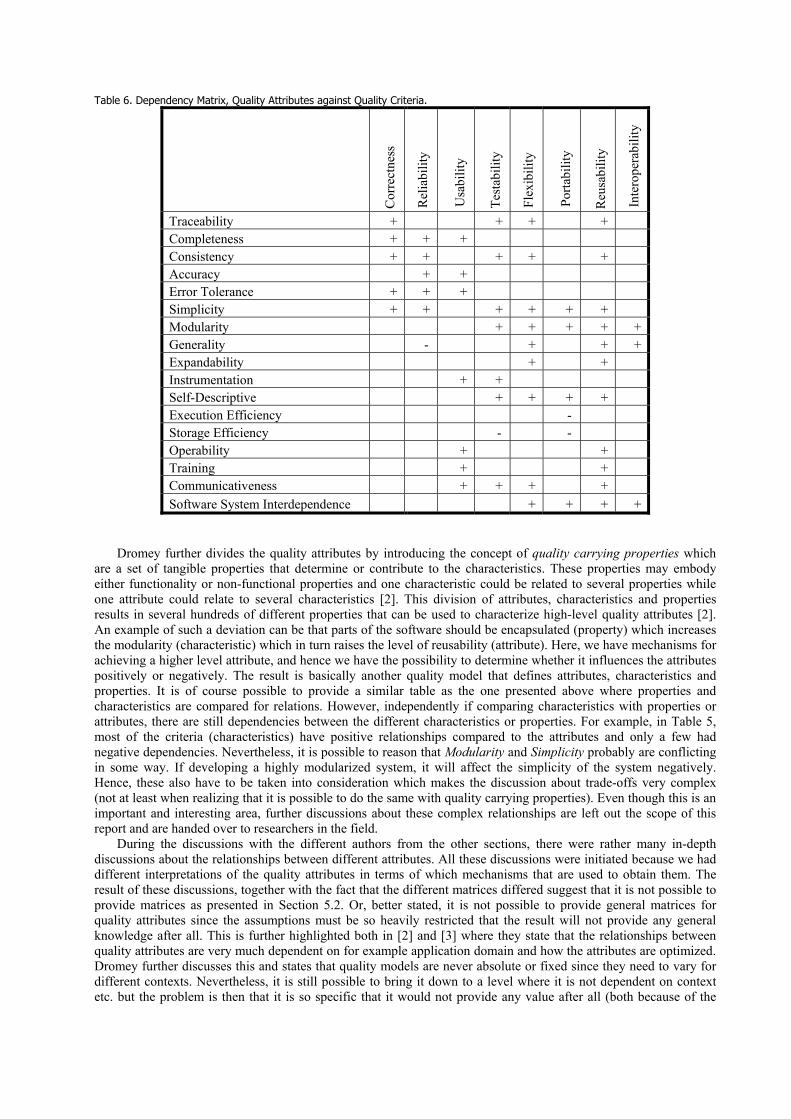
Table 6. Dependency Matrix, Quality Attributes against Quality Criteria.
Cor
rect
ness
Rel
iabi
lity
Usa
bilit
y
Tes
tabi
lity
Fle
xibi
lity
Por
tabi
lity
Reu
sabi
lity
Int
erop
erab
ility
Traceability + + + + Completeness + + + Consistency + + + + + Accuracy + + Error Tolerance + + + Simplicity + + + + + + Modularity + + + + + Generality - + + + Expandability + + Instrumentation + + Self-Descriptive + + + + Execution Efficiency - Storage Efficiency - - Operability + + Training + + Communicativeness + + + + Software System Interdependence + + + +
Dromey further divides the quality attributes by introducing the concept of quality carrying properties which
are a set of tangible properties that determine or contribute to the characteristics. These properties may embody either functionality or non-functional properties and one characteristic could be related to several properties while one attribute could relate to several characteristics [2]. This division of attributes, characteristics and properties results in several hundreds of different properties that can be used to characterize high-level quality attributes [2]. An example of such a deviation can be that parts of the software should be encapsulated (property) which increases the modularity (characteristic) which in turn raises the level of reusability (attribute). Here, we have mechanisms for achieving a higher level attribute, and hence we have the possibility to determine whether it influences the attributes positively or negatively. The result is basically another quality model that defines attributes, characteristics and properties. It is of course possible to provide a similar table as the one presented above where properties and characteristics are compared for relations. However, independently if comparing characteristics with properties or attributes, there are still dependencies between the different characteristics or properties. For example, in Table 5, most of the criteria (characteristics) have positive relationships compared to the attributes and only a few had negative dependencies. Nevertheless, it is possible to reason that Modularity and Simplicity probably are conflicting in some way. If developing a highly modularized system, it will affect the simplicity of the system negatively. Hence, these also have to be taken into consideration which makes the discussion about trade-offs very complex (not at least when realizing that it is possible to do the same with quality carrying properties). Even though this is an important and interesting area, further discussions about these complex relationships are left out the scope of this report and are handed over to researchers in the field.
During the discussions with the different authors from the other sections, there were rather many in-depth discussions about the relationships between different attributes. All these discussions were initiated because we had different interpretations of the quality attributes in terms of which mechanisms that are used to obtain them. The result of these discussions, together with the fact that the different matrices differed suggest that it is not possible to provide matrices as presented in Section 5.2. Or, better stated, it is not possible to provide general matrices for quality attributes since the assumptions must be so heavily restricted that the result will not provide any general knowledge after all. This is further highlighted both in [2] and [3] where they state that the relationships between quality attributes are very much dependent on for example application domain and how the attributes are optimized. Dromey further discusses this and states that quality models are never absolute or fixed since they need to vary for different contexts. Nevertheless, it is still possible to bring it down to a level where it is not dependent on context etc. but the problem is then that it is so specific that it would not provide any value after all (both because of the

level and the rapidly increasing amount of comparisons). Instead, it might be better to provide dependency matrices for specific environments where it is possible to generalize the attributes or the characteristics.
It seems that it could be concluded from Table 5.2 that management attributes are in conflict with the attributes interesting to other perspectives. This indicate that the trade-offs that always have to be made are in relation to these attributes. However, if taking a long-term perspective, it is also possible to argue that an attribute such as Reusability is positively correlated to for example Time since a software component with high reusability probably will facilitate lower costs if developing similar functionality in the future. The same discussion is valid also for Changeability, since the cost in a long-term perspective will be lower if the system is easy to change (assuming that 50-75% of the development cost is related to maintenance activities [7][8]). The result of this argumentation also results in that it is very hard to say something general about how attributes interesting for management are related to other attributes since the management attributes also are strongly related to what assumptions that are made.
5.5. Conclusions
In this section, the intention was to compare the attributes from Section 2-4 in order to get an understanding of how attributes from different perspectives are related. This was done by investigating the dependencies of all pairs of attributes. The resulted in a matrix were all the dependencies were outlined. However, since discussions with the authors of Sections 2-4 indicated that it was hard to state something general about these dependencies; comparisons with similar efforts for outlining dependencies were made. These comparisons indicated that the dependencies between different attributes were influenced by many factors since all matrices provided different results. When analyzing the reasons for these differences more closely, it was found that it is not possible to do such dependency analyses for quality attributes since quality attributes are on a too high level. Instead, several assumptions have to be made in order for them to be comparable. By making such assumptions, however, the generalizability of the results is limited. The conclusion of this is that it is possible to provide matrices of this kind but it is mainly applicable within a specific company or in a specific domain where similar mechanisms are used to reach high levels of certain quality attributes.
5.6. References
[1] Deutsch, M. S., and Willis, R. R. (1988): Software Quality Engineering – A Total Technical and Management Approach, Prentice Hall, Englewood Cliffs, NJ, USA.
[2] Dromey, G. R. (1998): Software Product Quality: Theory, Model, and Practice, Technical Report, Software Quality Institute, Griffith University, Brisbane, QLD, Australia.
[3] Henningsson K., and Wohlin, C. (2002): ‘Understanding the Relations Between Software Quality Attributes – A Survey Approach’, Proceedings 12th International Conference for Software Quality, Proceedings on CD.
[4] Häggander, D., Bengtsson, P-O., Bosch, J., and Lundberg, L. (1999): ‘Maintainability Myth Causes Performance Problems in Parallel Applications’, Proceedings of the Third International IASTED Conference on Software Engineering and Applications.
[5] McCall, J. A. (1994): ‘Quality Factors’, Encyclopedia of Software Engineering, Vol. 2 (O-Z), (Ed. Marciniak, J. J.).
[6] Neal, R. and Rowe, J. M (1996): Defining Factors and Criteria for a Quality Quantification Model in Systems Development, Information & Systems Engineering, 2 (3/4): pp. 239-252.
[7] Pfleeger, S. L. (2001): Software Engineering – Theory and Practice, 2nd Edition, Prentice Hall, Upper Saddle River, NJ, USA.
[8] Sommerville, I. (2001): Software Engineering, 6th Edition, Addison-Wesley Publishers, London, UK. [9] Vincent, J., Waters, A., and Sinclair, J. (1988): Software Quality Assurance, Vol. 1: Practice and I
mplementation, Prentice-Hall, Englewood, NJ, USA, cited in [6].
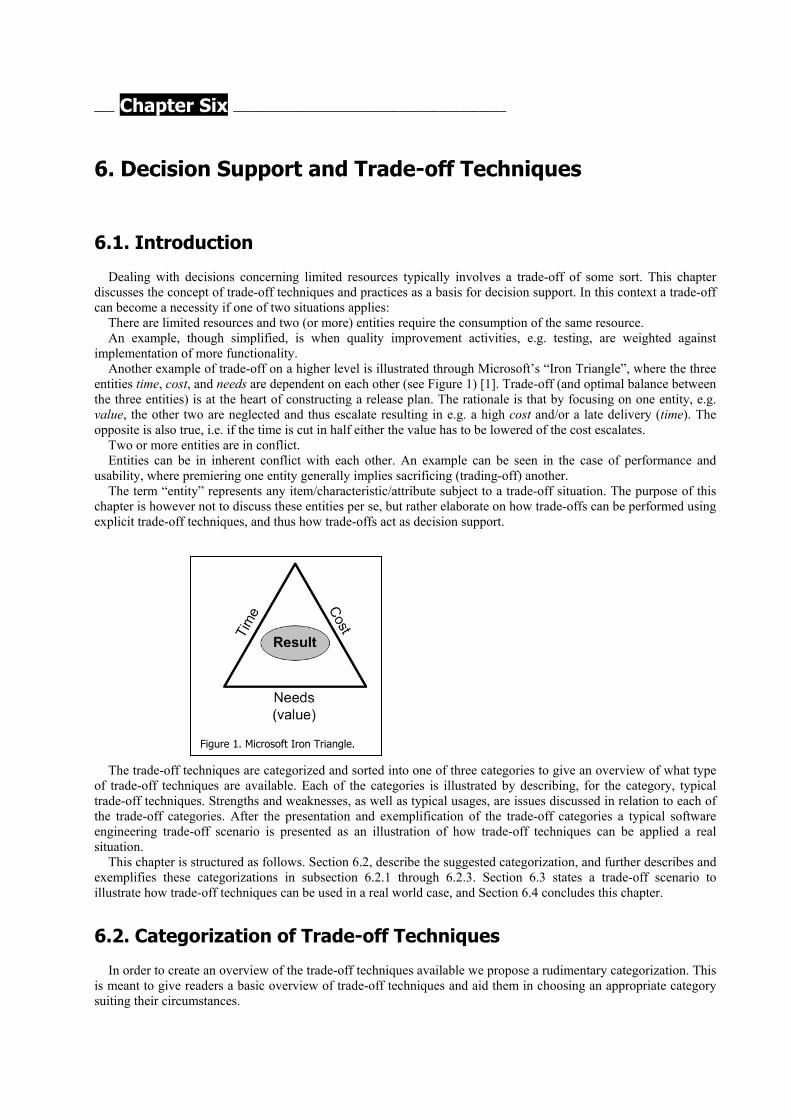
___ Chapter Six _________________________________________
6. Decision Support and Trade-off Techniques
6.1. Introduction
Dealing with decisions concerning limited resources typically involves a trade-off of some sort. This chapter discusses the concept of trade-off techniques and practices as a basis for decision support. In this context a trade-off can become a necessity if one of two situations applies:
There are limited resources and two (or more) entities require the consumption of the same resource. An example, though simplified, is when quality improvement activities, e.g. testing, are weighted against
implementation of more functionality. Another example of trade-off on a higher level is illustrated through Microsoft’s “Iron Triangle”, where the three
entities time, cost, and needs are dependent on each other (see Figure 1) [1]. Trade-off (and optimal balance between the three entities) is at the heart of constructing a release plan. The rationale is that by focusing on one entity, e.g. value, the other two are neglected and thus escalate resulting in e.g. a high cost and/or a late delivery (time). The opposite is also true, i.e. if the time is cut in half either the value has to be lowered of the cost escalates.
Two or more entities are in conflict. Entities can be in inherent conflict with each other. An example can be seen in the case of performance and
usability, where premiering one entity generally implies sacrificing (trading-off) another. The term “entity” represents any item/characteristic/attribute subject to a trade-off situation. The purpose of this
chapter is however not to discuss these entities per se, but rather elaborate on how trade-offs can be performed using explicit trade-off techniques, and thus how trade-offs act as decision support.
Figu
The trade-off techni
of trade-off techniquestrade-off techniques. Sthe trade-off categorieengineering trade-off situation.
This chapter is strucexemplifies these cateillustrate how trade-off
6.2. Categoriz
In order to create anis meant to give readersuiting their circumstan
re 1. Microsoft Iron Triangle.
ques are categorized and sorted into one of three categories to give an overview of what type are available. Each of the categories is illustrated by describing, for the category, typical trengths and weaknesses, as well as typical usages, are issues discussed in relation to each of s. After the presentation and exemplification of the trade-off categories a typical software scenario is presented as an illustration of how trade-off techniques can be applied a real
tured as follows. Section 6.2, describe the suggested categorization, and further describes and gorizations in subsection 6.2.1 through 6.2.3. Section 6.3 states a trade-off scenario to techniques can be used in a real world case, and Section 6.4 concludes this chapter.
ation of Trade-off Techniques
overview of the trade-off techniques available we propose a rudimentary categorization. This s a basic overview of trade-off techniques and aid them in choosing an appropriate category ces.

Three trade-off technique categories are proposed:
Experience based – relying on purely experience for supplying the needed information to performing the trade-off
Model based – relying on constructing an e.g. graphical model for illustrating and concretize the relations between trade-off entities, thus facilitating the trade-off
Mathematically based – relying on a mathematical formula for constructing and representing the trade-off, thus making it possible to feed the mathematical construct with appropriate values and receiving the best solution (either maximization or minimization or optimal with regards to certain criteria)
It should be noted that the categorization is not exact, i.e. many trade-off techniques are combinatory in nature. However, the description of each category below gives insight into both trade-off techniques and the semantics of the categorization that we have chosen.
6.2.1. Experience Based Trade-off Methods Experience based trade-off techniques are commonly used, but rarely expressed in literature, as they are ad-hoc in
nature, and the execution is up to the person performing the trade-off. An example is the estimation technique Expert Judgment, based on facilitating tacit knowledge possessed by one or a few experienced experts [2].
When discussing trade-off it is a conscious choice to start with the experience based trade-off techniques, as this technique greatly affects the other trade-off techniques being mentioned later in this chapter, as the experience of the party performing the trade-off is almost always an ingredient in any trade-off performed.
The experience based techniques express themselves by not providing graphical modeling or quantification for the trade-off. Information gathered in the paper by Henningsson [3] express the tacit knowledge and also explores the motivation for the focus on negative relations based on the experienced problems. The solution to the trade-off, by the experience based approach, is to include or exclude possible solutions based on the pure experience from persons.
6.2.1.1 Examples As discussed in Section 6.2.1, there are not that many clearly expressed methods presented in literature. However,
a typical example of experience based trade-off technique is the Delphi estimation technique [4]. The Delphi technique makes use of expert judgment on an individual basis, but combines several experts’ estimations to create agreement among the estimators, thus producing a true value of that estimation based on multiple individual judgments compiled to one result.
In the Delphi method each of the experts submits their own estimates according to their best knowledge, regardless of what method of trade-off (decision) they use. The estimates are then presented to the group of persons using the Delphi method. If there are large deviation between the incoming estimates, some or all experts revise their submitted values, and the process iterates with a new round of presenting values and if the deviations are still too large, values may be revised again [2].
The trade-off performed by the Delphi technique takes place when the scope of the entity, e.g. time, resource, quality etc, for judgment is adjusted to resemble the other experts involved in the estimate. The reason for the difference in estimate typically comes from different opinions about the scope of the entity. The trade-off in the Delphi technique is the revision of values for the experts, typically by addressing the estimation with a new scope in mind, either re-evaluating the size or complexity of the estimation object, thus increasing or decreasing the scope thus affecting the outcome estimation.
Other examples of experienced based trade-off techniques are typically decisions made with no supporting model or mathematical formula. Typical examples are related to management decision when experience is the main factor for making the trade-off, for example what to include or exclude from a product, if the added functionality and investment in development would pay off in terms of increased revenue or not.
6.2.1.2 Domain Usages, Typical Usages The experience based trade-off models are used for situations where the information available is rather scarce and
in addition where there are a lot of implicit, complex relations and impacts to consider that are not easily made explicit or quantified, but are rather implicit and experience/context based. Additionally, the time and effort possible to invest in performing the trade-off is limited.
Experience based trade-off techniques makes use of the tacit knowledge possessed by the persons gained from experience handling and recognizing similar situations and structures (i.e. previous trade-offs). Through the experience it is possible for the persons performing the trade-off include a number of factors in the decision process without having the information clearly expressed, formulated or quantified. Additionally, it is not made clear what

information is used, nor what information had the deceive impact on the decision made, i.e. repeatability and evaluation of the decision in question can be hard.
Taking the term experience based trade-off to the extreme any decision taken regarding the prioritization or trade-off between two activities or solutions, not involving explicit methodology, could be labeled as experience based trade-off. Thus, this category can be seen the most widely used in practice (industry).
6.2.1.3 Strengths and Weaknesses In this section a number of strengths and weaknesses are presented for previously illustrated experience based
trade-off techniques. The emphasized issues are applied to different degrees for each individual technique within the experience based trade-off category described above, but applicable for the category in general.
The experience based trade-off techniques have the possibility to handle a large number of attributes that are not clearly and explicitly expressed, either qualitatively or quantitatively. The experience possessed by the person performing the trade-off makes it possible to make the trade-off on scarce information and little data, mainly depending on the amount of information accessed and consolidated through experience, though this process is not always explicit and possible to describe. The ability to handle incomplete information and data gives this method an advantage over other trade-off techniques.
When using experience for determining the trade-off, the required time to analyze the input material and consulting the experience is rather low. There is typically no need for extensive measurements and calculations or other data processing activities in order to generate the result from the trade-off. Experience based trade-off is from time to time called “gut feeling”. However, experience based trade-off is very time consuming if the time required for gathering the experience is included, but that is though not typically done. The point is that a good experience based trade-off is dependent on the gathered experience by the personnel performing the trade-off, implying that it is not possible for every one to apply this method and still reach high accuracy, as it might be for other types of methods.
In adjacent areas such as time, cost and effort estimation, experience based techniques have shown to be as accurate as other methods [5]. This leads us to believe that the performance i.e. accuracy of experience based trade-off techniques can be at least adequate.
Though the experience based trade-off techniques are competent, fast, easy, and under the right circumstances providing adequate results, these methods are also accompanied with some weaknesses. The replication of the trade-off is limited, since there is no specified method to be complied to, it is not possible at all times to have the same trade-off repeated; this is based on the subjectivity and “bias” of the expert performing the trade-off. In retrospect, when examining the result of the trade-off, it is not possible for an external person to understand or review the rationale behind the trade-off made.
Further, the information concerning the trade-off and the knowledge that the trade-off represent is not easily communicated. In comparison to the other categories of trade-off techniques, model based and mathematical, that is easily communicated.
Though the experience based methods are to some extent reliable, experience based methods does not provide any quantified output from the trade-off. Basically the trade-off results in a decision and not in a value.
6.2.2. Model Based Trade-off Methods Model based trade-off techniques are expressed by that some illustrative form of modeling is used, though
excluding mathematical modeling. By applying a model based trade-off approach, in comparison to an experience based approach, it is possible to repeat the trade-off. Further, the illustration of relations and thus trade-offs is possible within the model based trade-offs. The illustration of trade-offs makes it possible to document and communicate the trade-offs, providing rationale and motivation for the result form the trade-off.
From the point of view expressed by the authors in this chapter, models have two main responsibilities: • Gather and structure the information. • Distribute and communicate the knowledge gathered in the model
The information and knowledge structured and stored in the models originates to a large extent form experience but can reside from experiments and investigations.
The communicatory possibilities for using a model is far greater than for trade-off techniques based on experience, and on the average simpler than in comparison to mathematically based trade-off techniques discussed in Section 6.2.3.

6.2.2.1 Examples There are a number of model based trade-off techniques, this section provide a few examples.
NFR Framework The NFR Framework (Non Functional Requirement Framework) elaborates on the application of a visual model
for the structuring soft goals and operationalizations (solutions) for achieving those goals. The NFR Framework is complete with a process describing the sequence and decisions required within the process of recognizing and handling the trade-off. Below the NFR Framework is described shortly in this section, for more information see [6].
The structure of the model consists of a number of visualizations tailored to handle soft goals, typically non-functional requirements or quality attributes. Each soft goal is connected with one or more solutions, in the NFR Framework terminology “operationalizations”. The operationalizations can support or hurt the goals depending on the characteristics of the solution and the requirements posed through the soft goals, an example is discussed in relation to Figure 2.
The NFR Framework identifies, illustrates, and handles the trade-off between soft goals and their operationalizations through the illustration and knowledge existing in the model and inserted in the model from the applicants. Figure 2 illustrates an example produced by using the NFR Framework. The example shows three appointed and prioritized soft goals: Good Performance for accounts, Secure Accounts, and User-friendly Access to accounts. Further, the model decomposes the first level goals into more detailed goals, typically on the second level, e.g. Space for accounts, response time for accounts. When sufficient decomposition is reached, operationalizations are inserted aiming at fulfilling the goals, e.g. use uncompressed format, and use indexing. The impact of the operationalizations is illustrated in the model by arrows drawn from the operationalizations to those goals impacted. If the impact is supporting the line is marked with a plus (”+”) sign, and if it hurting, the line is marked with a minus (“-”) sign.
- ++
Soft Goal
Operitionaliz-ations
Good AccountPerformance
AccountSpace
UseUncompressed
format
AccountResponse
Time
Use Indexing
Figure 2: Example of NFR Framework output, illustrating decisions taken and positive and negative impact on goals from the chosen operationalizations. [6]
In Figure 2, the impacts of a specific solution are presented. The operationalization “Use uncompressed format”
is a damaging operationalization to the “space for accounts”, but helps the “Response time for accounts”. For further and more detailed information about this model, address the work by Chung et al. [6].

QFD – Quality function deployment This model is at structured way to handle information typically related to production, but in the software
engineering case it is often used related to requirements management and trade-offs of requirements, i.e. what requirements to adhere to and in what order they should be implemented [7].
The benefit of using QFD is to structure and assign values to functional requests form stakeholder, e.g. customers. QFD is frequently mentioned as prioritizing the requirements and by the prioritization handling the trade-off of what requirements to include in the current delivery of the product.
The QFD technique contains classifications for how to label requirements aiding the prioritization of requirements. An example is from [8] is presented in Table 1.
Requirement Spoken Unspoken (Functional)
Unspoken (Delights)
If present Customer is pleased
Customer expects it to be there – takes it for granted
Customer is pleasantly surprised
If absent Customer is dissatisfied
Customer is dissatisfied
Customer is unaffected
Table 1. Spoken and unspoken customer requirements and the impact on customer satisfaction [8] Related to the usage of QFD and the result form the classification in Table 1 the House of Quality (HoQ) is
connected [7]. The HoQ applies to two dimensions pertaining to the trade-off concerning what requirements to implement. One dimension represents the customers whishes and demands, and receives a priority of 1 to 3, 3 highest priority. For the other perspective - the technical requirements - the correlation between the technical requirement and a customer requirement is graded between 1 and 3, where 3 represents the highest correlation. This results in a matrix where the prioritized customer requirements are identified along with the appropriate and correlating technical requirements, the cells in the matrix contains the multiplication of prioritization and correlation. An example of this can be seen in Figure 3 ([7]).
Inte
grat
ion
in R
/3
sta
rting
of p
roce
sses
on
dete
rmin
ed d
ates
R/3
-inte
rface
inte
grat
ion
of a
com
pany
dia
ry
Ope
rato
in
cut
, cop
y an
d pa
se
Act
ivat
ion
of o
bjec
ts b
y m
ouse
-clic
ks
Net
wor
k fe
atur
es
Sim
ulta
neou
sly
usab
le b
y a
high
num
er o
f per
sons
wor
ldw
ide
acce
ss
appo
intm
ents
app
oint
emen
ts c
an b
e co
nnec
ted
with
ling
text
s
mai
ntai
ning
per
iodi
cally
recu
rrin
g ap
poin
tmen
ts
Wor
king
on
appo
intm
ents
get
ting
rem
inde
d of
fixe
x ap
poin
tmen
ts
Gro
up a
ppoi
ntm
ents
dis
play
ing
a lis
t of p
artic
ipan
ts fo
r gro
up a
ppoi
ntm
ents
Use
r int
erfa
ce
vis
ualiz
ing
over
lapp
ing
appo
intm
ents
Operation Avoidance of input mistakes 9 3 9 3 3 9 easy switching between different viws 9 9Team-work other persons can look up or work with saved data 9 9 9 it can be worked on several persons appointments 1 9 9 9Managing appointments working on appointments 1 3 9 3 9 9 3 easy shifting of appointments 1 3 9 3 9 special input for periodically recurring appointments 1 3 9 3 9 1 documenting appointments 1 9 3Group features detection of overlapping appointments 1 3 3 3 9 easily acessible system for information other persons 3 3 3 9 9automatism getting reminded of appointments 9 3 3
Figure 3: Example of a HoQ matrix created with aid of QFD model reasoning.

The trade-offs with this model address what requirements and correlating technical requirements should be implemented first, if implemented at all. If the resources are strained there is a possibility that some of the lower ranked (prioritized) requirements are not implemented at all.
6.2.2.2 Domain Usages, Typical Usages Model based trade-off techniques are used in a wide range of domains, since the models are capable to handle
both qualitative information and quantitative information, the model based trade-offs can be used for multiple purposes.
There are frequent examples of model based trade-offs within software architecture assessment, i.e. focusing on identifying the most suitable solution given the demands from a set of stakeholders.
As shown in Section 6.2.2.1 the evaluation of appropriate solution given the demand, is not purely focused on an architectural level. Models on a more detailed level are also applicable. An example is the NFR Framework, described in Section 6.2.2.1, where not only pure architecture solutions are discussed but also rather detailed solutions governing the implementation.
Model based trade-offs are also applied when it comes to project planning and project tracking. One example is PERT applied for project planning and tracking [2] [8]. PERT in this scenario determines the appropriate direction and where to invest resources as well as what activity to continue with to reach, for example, the project lead-time goal.
Models such as QFD along with HoQ, described above, support the requirements selection and elicitation. Typically supporting the trade-off what to include respectively exclude from a software development project, or other types of project.
6.2.2.3 Strengths and Weaknesses In this section a number of strengths and weaknesses are presented for the category of model based trade-off
techniques. The emphasized issues are more or less true for each individual technique within the model based trade-off category, but appreciated as common and true for the category as a whole.
In comparison to experience based trade-off techniques the model based techniques have the advantage of being communicable. It is possible to distribute the models representing knowledge from person to person and within and between organizations. There is an advantage by being able to communicate the models, both by that a broader audience may use the knowledge the model represents, but also the fact that evaluation of the model takes place whenever the model is used or reviewed for other reasons. The evaluation strengthens the model validity and applicability.
Through the communication possibilities of the model based trade-offs the rationale behind the decision is illustrated and made explicit, supporting the reliability and trust for the model as well as establishing a common “language” as model notation is used to communicate. Model transparency (if) provided by the model based trade-off techniques supports understanding and trust in the model, especially in comparison to large scale mathematical models, that requires more knowledge and time to understand and trust.
There are naturally some drawbacks with model based trade-off techniques as well. One being that models, in the typical case, handle mostly qualitative information, i.e. models are not always suited to handle large amounts of data as the possibility to overview the model then suffers.
Further, it also so that the reviewed models does not provide quantitative results on a more detailed scale, typically interval, ratio, or absolute scale. This is a limitation, if the situation calls for a concrete value for performing the trade-off, the model based trade-off techniques may not reliably produce such as ”value” but rather structured decision support material.
6.2.3. Mathematically Based Trade-off Methods Mathematically based trade-off techniques (a.k.a. mathematical models) are widely used in e.g. management for
trade-off decision support. Estimations and calculations regarding break even, optimum production volume and so on all use mathematical models. Mathematical models are basically when symbols and expressions are used to represent a real situation, while e.g. diagrams and graphics can be used in a non-mathematical model like UML [9]. The variables used as input to mathematical models can be quantitative in nature, e.g. measurements like time, cost, and number of faults. They can also be quantifications of variables qualitative in nature like e.g. quality and usability.
6.2.3.1 Examples For the purpose of exemplifying mathematical models pertinent to software engineering two examples will be
elaborated upon, the Analytical Hierarchy Process (AHP) for multi criteria decision support and Reliability Growth Models used for (in this case) estimating remainder of defects in a piece of software.

Analytical Hierarchy Process (AHP) The analytic hierarchy process as developed by Thomas L. Saaty is designed to help in solving complex multi-
criteria decision problems [10]. Looking at software engineering AHP can be used when prioritizing multiple criteria/attributes, e.g. prioritizing features or quality attributes like usability and performance.
AHP uses scaled pair-wise comparisons between variables, as illustrated in Figure 4, where the variables are i and j and the scale between them denotes relative importance. The importance ratings can be seen in Table 2 below.
Figure 4: AHP Comparison Scale
. Table 2. AHP Comparison Scale [11]
Relative
intensity Definition Explanation
1 Of equal importance
The two variables (i and j) are of equal importance.
3 Slightly more important One variable is slightly more important than the other.
5 Highly more important One variable is highly more important than the other.
7 Very highly more important
One variable is very highly more important than the other.
9 Extremely more important
One variable is extremely more important than the other.
2, 4, 6, 8 Intermediate values Used when compromising between the other numbers.
Reciprocal
If variable i has one of the above numbers assigned to it when compared with variable j, then j has the value 1/number assigned to it when compared with i.
More formally if n i j = x then n j i = 1/x.
As the variables have been compared the comparisons are transferred into an n x n matrix with their reciprocal
values (n is the number of variables). Subsequently the eigenvector of the matrix is computed. The method used for this is called averaging over normalized column and the product is the priority vector, which is the main output of using AHP for pair-wise comparisons.
AHP uses more comparisons than necessary, i.e. n x (n – 1) / 2 comparisons, and this is used for calculating the consistency of the comparisons. By looking at the consistency ratio (CR) an indication of the amount of inconsistent and contradictory comparisons can be obtained. In general a CR of ≤ 0.10 is considered to be acceptable according to Saaty [12], but a CR of > 0.10 is often obtained. There has been some debate as to the applicability of results that have a CR of > 0.10, see [13] and [14], and this is an ongoing debate. A rule of thumb is that a CR of ≤ 0.10 is optimal, although higher results are often obtained in the real world. Further details about AHP can be found in [12] and [10]. Figure 5 gives a practical example of how AHP can be used when prioritizing e.g. software features.

Figure 5. AHP Example
Reliability Growth Models There are several models presented in literature that can be used for prediction, e.g. [15, 16]. Some are centered
on modeling defect patterns for the whole development process, while others are centered on modeling (and predicting) reliability (e.g. defects left) of software during the formal test phase of development. From the perspective of software engineering reliability growth models (RGM) can be relevant for several reasons. By using a RGM to predict the total number of defects left in a piece of software it is possible to deduct when it is time to stop testing, i.e. when the effort to test exceeds the benefit of finding the remainder of the defects. RGMs are dependent on historical data (metrics regarding previous development in the form of e.g. defects, time between defects are found, effort spent testing etc) being present that can be used as input to the model.
Looking at reliability growth models there are two main categories, time-between failure models and fault-count models. Which of them is appropriate depends on the data (metrics) available in an organization. If data regarding the amount of defects of a previous release is present, but not the time between the findings of the defects, a fault-count model is appropriate for estimation of defects in the current release. If however the time metric is also available any of the two can be chosen. Let us say that a failure-count reliability growth model is appropriate (i.e. only the amount of defects found in time intervals of a previous release is available). The next step is to choose which failure-count reliability growth model is the appropriate one to use for a special circumstance. As the models are dependent on historical data the assumption is that the projects/releases used as history are homogenous to the ones subject to the estimation effort.
As there are many models to choose from, e.g. Yamada’s S-shaped Reliability Growth Model, The Schneidwind Model, and The Non-homogenous Poisson Model for Interval Data. The three models exemplified here are all mentioned and exemplified in literature and seem to be accepted as established, see e.g. [15-17]. It is however not a foregone conclusion that all models will be appropriate to your situation, i.e. candidate models need to be tested on historical data (e.g. a previous release) to see if they are appropriate. Figure 6 illustrates a test of different RGMs. The black “x”-es in the graph are the actual data collected during testing, e.g. the number of defects found each week in a previous release. The graph illustrates the defect-finding-rate during time intervals (weeks). The smooth curves (black, blue and green) illustrate prediction models that try to approximate what happens (how many defects are found each week) based on the real data. In this case the green line (model c) seems to correspond best with the historical data of the previous release, and as such may be an appropriate model to choose for estimating the amount of defects remaining.

Figure 6. Graph example with fictive data.
The benefit with choosing a fairly accurate model is that when the real data is not available (i.e. the future) the
model curve offers a prediction of the remaining defects in the form of predicting how many defects will be found each week during testing (illustrated by the dashed lines in Figure 6) and the estimated optimal release can be calculated through comparing costs for testing over time, the cost of finding defects in testing with the cost of finding a defect after testing (i.e. when the system is used). Having all of this data a trade-off can be made (based on the decision support data from the model described above) between testing and releasing the product.
6.2.3.2 Domain Usages, Typical Usages Mathematical models are generally used to calculate issues such as max/min (e.g. production), estimation (e.g.
defects left), optimization (find optimal rate between e.g. resources available and production). A typical example from management is models of cost, revenue, and profit, where calculating the “breakeven point” of production (the amount of units requirement to nullify the effect of the fixed costs of production).
The usability of the mathematical models largely depends on the variables available for input to the model. In the example above historical data was used – availability and reliability of this data is crucial. On the other hand both quantitative and qualitative data can sometimes be used as input to a model, and the product can be a quantitative set of data, e.g. AHP uses subjective choices as input and produces a prioritized list.
6.2.3.3 Strengths and Weaknesses Mathematical models can handle large amounts of variables (data) and come up with results that are generally
more accurate than common sense (given that the data in and the model itself is appropriate for the situation). It also enables repeatable and structured analysis – as opposed to e.g. expert opinions which may be good or bad, but are dependent on the individual making the judgment. If a measurement program is in place collecting metrics, and if mathematical models are used as a way to estimate issues, e.g. defects left, the work can be replicated over several releases tweaking the data and the choice of model to correspond with needs. Using the same type of models over an extended period of time can give an organization consistency and overview.
However, one thing that should be taken into consideration is that mathematical models are generally “black-box” in nature, i.e. the technology (math in this case) behind the usage of them is not generally understandable by professionals that need to use the models. This is certainly true for software engineering as e.g. Yamada’s S-shaped Reliability Growth Model is not easily understood, not to mention hard to verify as appropriate mathematically for a certain situation (although you can do this through testing like in Figure ). The complexity of mathematical models is however not necessarily a hindrance as tools insulate the user from the underlying complexity of the model itself, and tools are becoming more commonplace, e.g. the SMERF tool [18] for RGMs.
A potential threat against mathematical models is the fact that they produce results that may seem exact. The results are however only as exact as the variables put in to the model. An example of this could be using historical data regarding defect finding intensity as input to choosing a model. The subsequent release the model is used by inserting defect intensity for a period for the new release in an attempt to estimate the total amount of defects. This

seems reasonable, however if the nature of the releases differ the historical data used to choose the model may be inapplicable, thus the model will produce estimations that are far from the real case.
Mathematical models are like any other tools, used correctly and under the right circumstances the benefits are potentially large. However, the illusion of precision can be dangerous to inexperienced users.
6.3. Trade-off Scenario
This section presents a trace-off scenario for illustrating trade-offs and the usage of some trade-off techniques described in this chapter.
6.3.1. Introducing the Trade-off Scenario Software quality is a subject that is often discussed within research and literature; there are almost as many
opinions on how to achieve good quality as there are authors. Though the opinions and solutions vary, the relations and conflicts between software quality attributes are acknowledged by numerous authors [3, 19-21]. A quote that sums up the relations and conflicts is stated by Boehm who said “Finding the right balance of quality-attribute requirements is an important step in achieving successful software requirements and products. To do this, you must identify the conflicts among the desired quality attributes and work out a balance of attribute satisfaction.” [22].
Problems according to maximizing a specific quality attributes without sacrificing others, inevitably disappointing customers and users of the system, is also acknowledged in literature. The Quality Attributes (QA), also known as, Quality Factors, and Non-Functional Requirements are discussed frequently. A collection of quality attributes is found in Encyclopaedia of Software Engineering [23], and presented in Table 3. McCall, 1977 Boehm, 1978 Bowen, 1985 Murine, 1983 Others* Correctness Correctness Correctness Correctness Reliability Reliability Reliability Reliability Reliability Efficiency Efficiency Efficiency Efficiency Efficiency Usability Human Engineering Usability Usability Usability Integrity Integrity Integrity Integrity Maintainability Understandability Maintainability Maintainability Maintainability Flexibility Modifiability Flexibility Flexibility Flexibility Testability Testability Verifiability Testability Testability Portability Portability Portability Portability Portability Reusability Reusability Reusability Reusability Interoperability Interoperability Interoperability Interoperability
Survivability Survivability Intraoperability Safety Expandability Manageability Functionality Supportability
Table 3: Quality attributes found in [23].
In addition to the quality attributes or quality factors presented in Encyclopedia of Software Engineering, others are presented as well, for instance in [6].
The quality attributes are defined characteristics indicating the customer or users apprehension of the systems overall quality. The quality attributes gives utterance to stakeholders’ interest in the system in a defined and measurable way. For a typical system, e.g. Automatic Teller Machine application, there are two categories of users identified (not excluding being the same person). The stakeholder identified as user is the one operating the application based on the desired service provided by the system, i.e. withdrawing money form an account. The second stakeholder is the operator of the system, performing maintenance and support on the system. These two parties does not have the same interest in the system, the user typically focus on usability, and the operator maintainability, quality attributes definition is found in [23]. It is also established that there are relations between quality attributes generally accepted, again examples are expressed in [23], but also in [3].
However, the relations between quality attributes are expressed through the constructs in the implemented solution, especially when speaking of software artifacts. The solution details in a high level is discussed and distributed through software architectures, and software architecture patterns. A short introduction of architectural patterns is generalized structure of a software architecture designed to effectively and efficiently solve a typical
* Others are: Grady and Carswell (1987); Deutsch and Willis (1988); Evans and Marciniak (1985); Arthur (1985).
issue, or problem domain. The patterns are often described with beneficial application, and examples. For further information review for example: [24] and [25].
Based on the inherent and plausible conflicts between quality attributes and the architectures different means to fulfill these quality attributes, based on the selected structure of the architectural pattern, the ground is set for a two-leveled trade-off. The first trade-off directs towards the prioritization of quality attributes, given potential conflicts and desires from various stakeholders. The second trade-off is the selection of software architecture. Addressing the question: Which architecture best supports the selected and requested quality attributes to a satisfying level?
In Sections 6.3.2 and 6.3.3, these two trade-offs are addressed and further described.
6.3.2. Quality Attribute Trade-off It is held for true, that any given software engineering project developed for a dedicated customer or developed
for the general public involves several stakeholders. These stakeholders represent different interest in the system under development. The stakeholders’ interests are possible to transform or find matching quality attributes corresponding to the demands from the stakeholder. By extracting corresponding quality attributes it is possible to facilitate existing knowledge and solutions for those quality attributes. Existing knowledge might contain suitable solutions or known conflicts with other quality attributes. The complexity and number of possible conflicts grows with the number of quality attributes identified and the number of, ideologically different stakeholders, i.e. stakeholders representing different interests Figure 7 illustrates this situation.
Figure 7: Illustrating the relationship between stakeholders’ interests, connected to quality attributes, and supporting or conflicting relations (e.g. realized through an architectural solution) between quality attributes.
Svahnberg describes this situation of prioritizing quality attributes based on differences in perspectives [26]. One way to handle the prioritization of quality attributes is to use the AHP method, described in Section 0. The
approach of determining quality attributes prioritization through AHP makes use of the partly subjective ranking possible by the AHP method, through repeated questions and calculations it is possible to determine if the prioritization is consistent, thus trustworthy, or not.
As a result, AHP provides a prioritized list of quality attributes based on the combined rankings of a number of persons, stakeholders. Given the knowledge of which quality attributes are the most important once, the next issue is to address what architectural solution is best suited for fulfilling the prioritized list of quality attributes to a sufficient and desired extent. This leads us on to the next section discussion the architectural trade-off.
6.3.3. Architectural Trade-off As mentioned there are common accepted relations between software quality attributes. However these relations
have more or less impact based on what architectural pattern is used for the final solution. It is highly possible to find a well suited architectural pattern or solution if the sole focus were set on the most
prioritized quality attribute; unfortunately this is rarely the case. The stakeholders and the trade-offs made are accepted with conditions, implying that a minimum value for the quality attributes needs to be fulfilled, if not the
solution is unacceptable. An example, if usability is the most prioritized quality for the system, it is probably so that efficiency is hurt. However, this situation is acceptable, as long as efficiency is still fulfilled to an acceptable level. This situation generates difficulties, nevertheless the situation is not made simpler if more quality attributes requires a certain level of fulfillment.
To handle the architectural trade-off it is possible to use the NFR Framework method described previously in this chapter. The determining of what solutions that are helping and hurting other requested quality attributes is a vital part of the decision of selecting the final architecture to implement.
There are also other models or scenario based architecture evaluation techniques determining the fulfillment and level of fulfillment of the prioritized quality attributes. Two of these models are SAAM (Software Architecture Analysis Method) and ATAM (Architecture Tradeoff Analysis Method) are described in [27] by Clements et al.
The architectural trade-off will result in the solution most completely fulfilling the prioritized quality attributes to a satisfying level; possible without performing at best for any of the quality attributes, but the best solution is the one that is least bad for all quality attributes.
6.4. Discussion and Conclusions
Most situations involving decisions or even choices (regardless of domain) involve trade-offs. Every one makes multiple decisions per day, and perform trade-offs mostly subconsciously. All things used as support for making trade-offs can be called “trade-off techniques”. In this chapter we have chosen to explicitly describe a small selection of trade-off techniques that can be and are used explicitly by professionals in the area of software engineering. The categorization of the trade-off techniques was an attempt at offering structure and analysis of three fundamentally different ways to perform trade-offs.
Experience based trade-off techniques are the most common. They utilize implicit, often intangible and hidden information and decision support to perform trade-offs. It is very fast and ad-hoc, and the accuracy is totally dependent on the individual performing the trade-off.
Model-based trade-off techniques offer some common notation and explicit definition of the constituents of a trade-off (e.g. variables, requirements etc). The model can then be used as the focal point for discussions, validations and so on until a trade-off is made. It should however be noted that the time and cost can be rather steep as the production of large and complex models can be resource intensive, not to mention prone to errors. In addition usability of a model as a tool for trade-offs is proportional to the size of the model (the amount of data). A large model housing a large amount of variables can be hard to get an overview of, thus usability is threatened.
Mathematical models can accommodate large amounts of data, and utilize both quantitative and qualitative (if coded) data to produce information that can be used to reach a trade-off. The main concern with mathematical models is that they are black-box – thus it is very hard for a practitioner to see when (and more importantly when not) a model is appropriate for the particular circumstance. Another potential drawback is related to the data input to the model, as the output is totally dependent on this. Compared to e.g. experience based techniques there is not compensation as the complexity of the black box can hide a potential error. On the other hand, using a mathematical model, for e.g. prediction can be very beneficial. The model can utilize large amounts of data that is unreadable by a person, and give fairly accurate results under the right circumstances.
The combination of trade-off techniques is of course preferable. The purpose of this chapter is not to isolate techniques, but rather structure and provide some analysis of each type along with examples of usage. Combinatory usage of trade-off techniques is always preferable over relying on a single method for accurate results. Herbert A. Simon, a Nobel prize winner in economics and expert in decision making, said that ‘a mathematical model does not have to be exact; it just has to be close enough to provide better results than can be obtained by common sense’. Models used in combination with common sense utilizing experience in assessing the results produced by the trade-off technique will probably yield the best results, as well as results trusted by the professionals affected by the trade-off.
6.5. References
[1] J. Karlsson, Marknadsdriven Produktledning - Från kundbehov och Krav till Lönsamma Produkter: Focal Point AB, 2003.
[2] S. L. Pfleeger, Software Engineering: Theory and Practice. Upper Saddle River NJ: Prentice-Hall, 1998.
[3] K. Henningsson, "Understanding the Relations Between Software Quality Attributes - A Survey Approach," presented at 12:th International Conference on Software Quality, Ottawa, Canada, 2002.
[4] S. L. Pfleeger, Software Engineering: Theory and Practice, 2. ed. Upper Saddle River NJ: Prentice Hall, 2001.
[5] R. T. Hughes, "Expert judgement as an estimating method," Information and Software Technology, vol. 38, pp. 67-76, 1996.
[6] L. Chung, B. A. Nixon, E. Yu, and J. Mylopoulos, non-functional requirements in software engineering. Boston: Kluwer Academic, 2000.
[7] G. Herzwurm, S. Scockert, and W. Pietsch, "QFD for customer-focused requirements engineering," Requirements Engineering Conference, 2003. Proceedings. 11th IEEE International, pp. 330-338, 2003.
[8] R. T. Futrell, D. F. Shafer, and L. I. Shafer, Quality Software Project Management. Upper Saddle River: Prentice Hall, 2002.
[9] D. R. Anderson, D. J. Sweeney, and T. A. Williams, An introduction to management science : quantitative approaches to decision making, 9th ed. Cincinnati: South-Western College Pub., 2000.
[10] T. L. Saaty and L. G. Vargas, Models, Methods, Concepts & Applications of the Analytic Hierarchy Process. Boston MA: Kluwer Academic Publishers, 2001.
[11] T. Gorschek and C. Wohlin, "Packaging Software Process Improvement Issues - A Method and a Case Study," Software: Practice & Experience, vol. 34, pp. 1311-1344, 2004.
[12] T. L. Saaty, The Analytic Hierarchy Process: Planning, Priority Setting, Resource Allocation. London: McGraw-Hill, 1980.
[13] P. Chu and J. K.-H. Liu, "Note on Consistency Ratio," Mathematical and Computer Modeling, vol. 35, pp. 1077-1080, 2002.
[14] B. Apostolou and J. M. Hassell, "Note on Consistency Ratio: A Reply," Mathematical and Computer Modeling, vol. 35, pp. 1081-1083, 2002.
[15] S. H. Kan, Metrics and Models in software Quality Engineering. Reading: Addison-Wesley, 1995.
[16] S. R. Rakitin, Software Verification and Validation for Practitioners and Managers, 2. ed. Boston MA: Artech House, 2001.
[17] C. Wohlin, M. Höst, P. Runeson, and A. Wesslén, "Software Reliability," in Encyclopedia of Physical Sciences and Technology, vol. 15, R. A. Meyers, Ed., Third Edition ed: Academic Press, 2001, pp. 25-39.
[18] http://www.slingcode.com/smerfs/, 2004.
[19] D. Häggander, P. Bengtsson, J. Bosch, and L. Lundberg, "Maintainability Myth Causes Performance Problems in Parallel Applications," presented at rd Annual IASTED International Conference on Software Engineering and Applications (SEA'99), Scottsdale,, 1999.
[20] J. A. McCall, "Quality Factors," in Encyclopedia of Software Engineering: John Wiley & Sons, 1994.
[21] J. Bosch, Design and use of software architectures : adopting and evolving a product-line approach. Harlow: Addison-Wesley, 2000.
[22] B. Boehm and H. In, "Identifying quality-requirement conflicts," IEEE Software, vol. 13, pp. 25-35, 1996.
[23] J. J. Marciniak, "Encyclopedia of Software Engineering," vol. 2003: Wiley, 2003.
[24] F. Buschmann, Pattern-oriented software architecture. Chichester: Wiley, 1996.
[25] L. Bass, P. Clements, and R. Kazman, Software architecture in practice. Reading, Mass.: Addison-Wesley, 1998.
[26] M. Svahnberg, "A study on agreement between participants in an architecture assessment," Empirical Software Engineering, 2003. ISESE 2003. Proceedings. 2003 International Symposium on, pp. 61-70, 2003.
[27] P. Clements, M. Klein, and R. Kazman, Evaluating software architectures : methods and case studies. Boston, [Mass.]: Addison-Wesley, 2002.

___ Chapter Seven _______________________________________
7. Trade-off examples inside software engineering and
computer science
7.1. Introduction
During software development, tradeoffs are made on a daily basis by the people participating in the development project. Different roles in the project have to handle different tradeoffs. Some examples are that managers distribute work to developers and while doing so they have to balance the workload between the developers and deciding how many people that should be assigned to a particular task. If more people are assigned to a task then the task will be completed faster, but adding more people past a certain point only serves to increase the overhead of the group and in turn increases the time it takes to complete the task. Developers in turn make decisions regarding design and implementation details. An example is when software architects try to balance the quality attributes of the system. A balance of functional as well as quality requirements has to be acheived so that the intended users of the system will find it usefull.
Two extremes in the approaches to tradeoff can be identified, the first is based on the developers knowledge and experience. By consulting earlier experiences it can be possible to make a tradeoff in an informal or ad hoc way. On the other side of the scale we have a set of tradeoff methods. These methods describe how to perform a tradeoff, they describes which steps are involved and what to focus on when doing the tradeoff, and so on. Continuously throughout software development we have to perform tradeoffs. Depending on the importance and level of risk involved, the less important ones can be performed in an ad hoc way. But if the risk or impact is more important then they should be more thoroughly analyzed and documented before a decision is made.
The type of tradeoff that has to be considered changes depending on roles and the progress of the project through its lifecycle. It is not the same type of trade-off that is most common during the early stages of a project as during the later stages. For example, during the initial phases of analysis and planning, tradeoffs such as staffing versus leadtime or leadtime versus cost have to be performed. Later in the project during the design phase of the development, tradeoffs are made regarding for example, the choice of technology versus quality requirements and development time. When the implementation is complete then the test phase brings its own set of tradeoffs, for example when to stop testing versus the amount of defects expected to still be present in the system.
The critical part of a tradeoff methods is to quantify the factors that are involved, this task varies in degree of difficulty depending on the aspects involved. Some aspects of software development and software behaviour are rather easy to quantify, for example different aspects of performance such as time behaviour and throughput. Other easily quantified aspects are development time, different size measures etc. Most of these can be derived from functional rerquirements of a system. Aspects of a system that are derived from non-functional requirements are often harder to quantify. Attributes such as usability and testability are more difficult to estimate. This makes it more difficult to perform tradeoffs that involves one or more of the less quantifyable attributes.
Each of these trade-off examples has been researched in order to simplify and formalize the process of making the trade-off. The formalization of how a trade-off is performed in a certain context is called a trade-off method. Common for most trade-off methods is that they first try to quantify or structure the factors that are involved in the trade-off. Once the quantification has been done, the actual trade-off decision is easier to make. The quantification also makes it possible to compare different alternatives in an unbiased way (people have a tendency to root for their own alternative and might be hard to persuade unless alternatives have been compared and evaluated in what they perceive as a fair way). In this chapter we will take a look at some of the methods that are available for structuring and quantifying the information necessary to make tradeoffs in some situations. We will concentrate on software developing projects and look at four different examples where trade-off methods have been applied. Each example project is in a different phase of the project lifecycle.
7.2. Example
After spending some time searching through publications, we identified four interesting examples that could be used to illustrate tradeoffs at different phases and levels of a software project. The examples describe tradeoffs in the context of maintenance, software design, and system testing. These phases and examples were chosen out of cenvenience, tradeoffs does of course exist in other phases of development and in other domains.
For each project we will first give a short introduction, describing the context and the goal of the project. We continue by describing the problems that they ran into and what they wanted to achieve. We will then look at which trade-off approach that they applied and finally the outcome of the case study.
7.2.1. Example 1 This example is from the telecommunication domain, the system studied is a real-time telecommunications
system that was scheduled for maintenance [3].
Problem description The trade-off in question is concerning the selection of the most appropriate of three architecture alternatives
for maintenance work that is going to be performed on the system. The goal is to introduce new functionality into the system while not affecting the systems existing quality attributes negatively.
Trade-off method used
Based on the functional and quality requirements of the system, a number of scenarios are created that represent both the day-to-day use, and the intended use of the new functionality introduced in the system. Using these scenarios, metrics are then extracted from architecture descriptions prepared for each of the maintenance scenarios. Since the evaluation is conducted at the architecture level, the metrics can only cover measures such as the number of active data repositories, passive data repositories, persistent and non-persistent components, data links, control links, logical groupings, styles and patterns and violations of the intended architecture. These metrics are collected using a number of domain experts that estimate complexity, impact and effort for each of the scenarios for each of the architectures using an existing architecture as a point of reference (usually the existing version of the architecture is used as the reference). Based on the collected metrics it is then possible to compare the architecture alternatives and based on that select the most appropriate architecture for the maintenance of the system. The alternative architectures are assessed with mainly respect to robustness but they are also compared for reliability, maintainability, interoperability, portability, scalability and performance. The positive or negative impact of the changes to the architecture are collected for each of the quality attributes. The results are then collected and prioritized in a report where all of the alternatives are presented with their respective good and bad sides (see Figure 1).
This tradeoff method helps the people that perform the tradeoff to structure the process of evaluating the alternatives. But in the end it relies on the people performing the tradeoff to make the final decision.

Selection Criteria
Add services to existing Line
InterfaceDecouple Line
Interface
Decouple Line Interface plus add
user profileReliability 0 +1 +1Maintainability -1 +1 +1Interoperability -1 +1 +2Portability -1 +1 62Scalability -1 +1 61Performance 0 -1 -1Time to Market +1 0 -1Sum +'s 1 5 7Sum 0's 2 1 0Sum -'s 4 1 2Net Score -3 4 5Rank 3 2 1Continue? No Yes Yes
Figure 1. The result table produced by the evaluation process. Outcome
Using the developers knowledge about the application domain, scenarios were developed for three alternative solutions. Each solution was documented so that it was possible to compare it with the existing architecture. The solutions were then evaluated by the developers working on the project and compared. Of the initial three alternatives, one was eliminated and two were selected for further investigation.
7.2.2. Example 2 The second example [5] is from a case study conducted on an american bank’s information system for handling
credit card transactions. The focus of the study is on performance attributes, and how to determine if the system will be able to satisfy them.
Problem description
The system mainly has to fulfill two different performance requirements, one concerning execution time for critical transactions and one concerning how much storage space that is used for each customer that is stored in the system. Performance scenarios that are given as examples are: 1) The cancellation of lost and stolen credit cards require very fast execution time in order to minimize the risk of financial loss. And 2) Minimizing the storage requirements for the cardholder, due to the large amount of cards in circulation.
Several different solutions to solving each of the scenarios were proposed, each with different impact on the performance of the system. Some affect the response time positively but would have a negative impact on the storage space requirements. The problem that the developers are facing is to select the appropriate solutions which together fulfill both of the performance scenarios.
Trade-off method used
The method used is to describe the quality goals is an approach described in Default [4] which focuses on the quality goals of the system. A goal graph is created for the system in which the goals are broken down. The overall goals of time and space performance are refined into offspring goals. The offspring goals in turn are refined into either more offspring goals, or into “goal satisfying methods”. These methods are the suggested solutions for the different aspects of performance in the system. In order to satisfy a goal, all its offspring goals has to be satisfied, this continues up through the graph until the parent goals of the system are reached (see Figure 2). The goal satisfying methods in the graph can have a positive or negative relation to both other methods and to goals. For example, using compression to decrease the storage requirements of the system might result in that the time it takes to modify data increases, countering the goal of quick cancellation of credit cards.
This method also helps the people that are performing the evaluation by providing a formal structure to follow. But apart from only helping to structure the information it also tries to support the actual decision making. By following the tree it is possible to identify the best candidate for the architecture and it also hels to document all the alternatives that were considered during the evaluation.

S
SU
S
S
S
S
D
D
S
D
SS
SS
Layer 4
Layer 2
Layer 1
UncompressedFormat[Card.Status, 1]
CompressedFormat[Card.OtherAttrs, 1]
HorizontalSplitting[StorageAttributes, 2]
StorageAttributes(Card)
Storage in IsA hierarchyAttributes(Card)Stg [Attributes(Card), 4]
Individual attributesStg [Card.Status, attr, 4]
FormalClaim[Dominant[Stg [Card.Status, attr, 4]]]
Stg [Card.Status, 4]
InformalClaim[”Card.Status not specialised”]
Stg [Card.Status, 2]
FormalClaim[Critical[R[retrieve[Card.Status], 3]]]
EarlyFixing[Card.Status, 2]
Stg [Card.OtherAttrs, attr, 4]
FormalClaim[Dominant[Stg [Card.OtherAttrs, attr, 4]]]
Stg [Card.OtherAttrs, 4]
SeveralAttributesPerTuple[Card.OtherAttrs, 4]
Stg [Card.OtherAttrs, 2]
InformalClaim[”Card.OtherAttrs not accessed
during critical operations”]
LateFixing[Card.OtherAttrs, 2]
Figure 2. Example of a goal graph. Outcome
The case study describes the successful application of the goal graph method for selecting between a number of different techniques during the design of the credit card system. The impacts of the different suggested solutions on the system’s quality attributes are examined using the goal graph and the methods leading to the fulfillment of the requirements is chosen.
7.2.3. Example 3 The third example where a trade-off is present is deciding when to stop testing and release a software product to
the end users. This example is not from a case study but from an experiment documented in [2].
Problem description When is it safe for the developers to stop the testing and release the software to the end users? Once the testing
process has begun it can basically go on forever, as it is not practically possible to prove that a system is completely, 100%, correct. So, the developers have to settle for some level of stability that can be accepted by the end users.

Normally this is achieved by testing the systems expected use, in what is called usage based testing. Usage based testing focuses the testing efforts on the most commonly used functions in the system. Each function is graded with a likelyhood of it being used. Then the most likely functions are tested first and most. But for how long should this testing continue? Spending more time than necessary to achieve the required software stability and reliability is an added cost to the development organization. If the added cost from “unnecessary” testing can be a kept at a minimum then the development organization can save that much cost and effort.
Trade-off method used
By using reliability growth models it is possible to predict when it is time to end the test phase. The reliability growth model that is used in the experiment uses two main measures for input. The first is the testing-effort which has been expended, this can be measured in for example the number of testcases used, man hours spent testing, or CPU time. The amount of testing effort that is consumed can be seen as an indication of how effectively faults are detected in the software. The testing-effort is used together with the fault detection rate (FDR) which measures how often new defects are found in the system. These two measures are used together to create a software reliability growth model which can be used to predict the amount of remaining defects in the system.
The method helps to predict when it is possible to stop the testing effort, this prediction is based on metrics from two activities. Thus the method is able to evaluate the maturity of the software system without the involvment of the opinions software developers. This makes it a more independent tradeoff method than those that rely on input from experts.
Outcome
The examples in [2] show when the test process has achieved a predefined goal. Using the reliability growth models it is possible to continuously evaluate the testing process and follow the software system as the maturity level of develops. Once the maturity level has reached a stable plateau it can be considered stable enough and released to the users.
7.2.4. Example 4 Building systems using software components is an approach that has been presented as the future of software
systems development. Instead of creating all the parts of a new system, developers identify the functionality that has to be provided and then buy the needed software components and build the system using them. However selecting between different components can be a trade-off between the different quality attributes that they present.
The problem that presents itself is to identify how different components affect quality attributes of other components in the system. These problems can range from different components expecting to have the thread of control in the system to differences in time behavior or dynamic memory needs during runtime.
Problem description
This example focuses on the evaluation of three quality attributes of two communication components. Both the components fulfill the functional requirements of the system, i.e. transport messages from a sender to a receiver but have different portability, performance and maintainability characteristics. The method and evaluation is described in detail in [6].
Trade-off method used
In order to assess the two communication components it was decided to take two different evaluation approaches. The first was to create two prototypes that exercised the message passing parts of the two components and gathering as much “real” performance data as possible. The prototypes were created to simulate the actual workloads of the system as far as possible to give an accurate comparison of how the components will perform when they are stressed. The portability was also tested using the prototypes which were moved between Windows 2000 and Linux 2.4 based platforms. The second evaluation was to make a static analysis of the components source code, and through the analysis try to evaluate how maintainable the components were. The static analysis calculated a maintainability index for each of the components which made it possible to compare them with a common measure.
The final decision of which component to choose was made by the architect of the system, using experience and the figures from the quantifications of maintainability and performance. The method is therefore to some extent dependent on the experience of the people that perform the evaluation, since they decide which component to go for.
Outcome
Based on the results of the evaluations it was possible to see that both components showed similar levels of portability so this attribute became less important. It was also aparent that one component had lower performance than the other but that it on the other hand had a higher maintainability index. However, the choice of component for
use in the system fell on the other component that had higher performance as the communication performance was considered as more important for the overall performance of the system.
7.3 Discussion The four examples of trade-off situations and methods that have been presented give some indications of when
and where tradeoffs are performed during software development. The examples that we have looked at cover situations ranging from the beginning of development, through the testing phase and maintenance work.
Each phase in software development has its own set of problems. In the creation of the software architecture we have to create the architecture that is most appropriate for our functional and quality requirements. This forces us to make tradeoffs between architecture alternatives as well as technical solutions. During this phase we do not know to much about how the system will be implemented, since the design has not yet been completed. Therefore scenario based evaluation methods and simulations based on formal specifications of the software architecture are commonly used to gather data needed for the tradeoff.
Once a system has been implemented and is being tested, then we find another tradeoff in when to stop testing and release it. The tradeoff between software robustness and the effort that has to be spent on continued testing needs to be balanced. The analysis of when the software is mature enough can be done through the use of mathematical models that based on metrics collected on the testing process can predict the maturity of the software.
In the maintenance phase of the software lifecycle we have to take care not to affect the systems quality attributes in an unwanted way when changes are made. Therefore a number of alternatives for how the changes should be made have to be created and evaluated so that the one with the most desired attributes can be identified. This evaluation is again usually done using a scenario based approaches where a group of domain experts relies on their experience to select the best alternative. The reason for the popularity of the scenario based approach can be that it is easy to apply to situations where little information about the actual implementation of the system is available. Instead we try to use experienced people for performing the evaluation, using their experience to fill in the blanks in the available information.
Some approaches to tradeoffs are applied to several aspects of software development under different names. For example, there are several approaches that are using scenarios to elicit and quantify aspects of for example software architecture. The scenarios are used to make a quantification of the attributes of the architecture or architectures that are under evaluation. But scenarios can be used during the requirements elicitation as well.
Which type of trade-off method that is applied to a problem probably changes from situation to situation. The experience of the people facing the trade-off and the information available to them influences the choices they make. People are probably more likely to use a formalized trade- off method the first time that they run into a trade-off. But using the experience gained from the first trade-off they might be inclined to use a more ad-hoc method the next time they run into a similar problem. We will always have to deal with tradeoffs during software development, it doesn’t matter at which level in the organization that you look or where during the project lifecycle. Tradeoffs are ubiquitous.
7.4 References [1] J. S. Glider, C. F. Fuente, and W. J. Scales, "The software architecture of a SAN storage control system,"
IBM Systems Journal, vol. 42, pp. 232-249, 2003. [2] C. Y. Huang, S. Y. Kuo, M. R. Lyu, “Optimal Software Release Policy Based on Cost and Reliability with
Testing Effort,” Proc. of 23rd International Computer Softwareand Applications Conference (COMPSAC’99), PP. 468-473, 1999.
[3] C. Lung and K. Kalaichelvan, “An Approach to Quantitative Software Architecture Sensitivity Analysis,” International Journal of Software Engineering & Knowledge Engineering, vol 10, pp. 97- 115, 2000.
[4] J. Mylopoulos, L. Chung, and B. Nixon, “Representing and Using Non-Functional Requirements: A Process-Oriented Approach,” IEEE Transactions on Software Engineering, vol. SE-18, pp. 483-497, no. 6, June 1992.
[5] B. A. Nixon, “Dealing with Performance Requirements During the Development of Information Systems,” Proc. of IEEE International Symposium on Requirements Engineering, pp. 42-49, 1992.
[6] F. Mårtensson, “Evaluating Software Quality Attributes of Communication Components in an Automated Guided Vehicle System, ” proc. of IEEE International Conference on Constructing Complex Computer Systems, 2005.

___ Chapter Eight _______________________________________
8. Trade-off examples outside software engineering and
computer science
8.1. The trade-off Concept
In the Webster dictionary [1] the trade-off concept is explained as follows:
1 : a balancing of factors all of which are not attainable at the same time <the education versus experience trade-off which governs personnel practices -- H. S. White>
2 : a giving up of one thing in return for another
Similar understanding of trade-off concept can be found in the Cambridge dictionary [2]:
1. a balancing of two opposing situations or qualities, both of which are desired The tradeoff in a democracy is between individual liberty and an orderly society.
2. A tradeoff is also a situation in which the achieving of something you want involves the loss of something else which is also desirable, but less so: They both had successful careers, but the tradeoff was they seldom saw each other.
The definitions presented above clearly indicate two things. First, that trade-off requires some kind of
compromise, in which in order to gain something, something else must be sacrificed. The second thing is that trade-off is not a strictly technical term – all examples given are from other than technical areas.
The definition from the Cambridge dictionary points another important characteristic of the trade-off. When the trade-off is necessary it means that it is impossible to fully achieve the desired goal. In that sense the trade-off concept is similar to the concept of compromise. And similarly to compromises the trade-offs must be made all the time. One can argue that every decision involves some kind of trade-off. It is well recognized in economics, where the cost of any action is often expressed not only in the actual cost of doing something but also as the loss of income due to not doing something else. For example – the actual cost of holiday is not only the cost of the trip but also the lost of money due to not working at that time.
One of the reasons why trade-offs must be made all the time is the fact that, no matter what we do, we use resources. The resources are practically always limited. The only unlimited resources we know are the natural resources, like e.g. the solar energy. To make use of them we still, however, need some limited resources (e.g. solar panels or a nice piece of a beach). Given the limited resources we must find an optimal balance between their usage that is most satisfactory for us.
Another way of seeing the necessity of trade-offs is defining a problem as a set of contradictions [3]. If there are no contradictions in the problem specification, the problem is relatively easy to solve. For example there is no problem in building fast car that is red, since there is no contradiction between car color and its performance. However, building a fast car that does not consume much fuel is much more challenging - using current technology, the car performance and fuel consumption are dependent, and positively correlated.
The contradicting requirements can be of technical nature [3] – i.e. using current technology it is impossible to satisfy all of them. Some time ago it was impossible to provide satisfactory performance of the operating system when a graphical interface was required – the processing power of processors was not high enough. This problem was overcome because of new technologies of producing much faster processors.
The contradiction can also be of a physical nature [3]. In such a case the new technology can not help, since the contradiction is rooted in the physical characteristics of the required qualities. Example of such requirements can be long distance radio transmission and low power consumption of the transmitter. Satisfaction of both requirements is impossible since to provide certain range of radio waves appropriate energy is required.

A trade-off, by definition, can not bring the solution in which we are able to satisfy all requirements. Therefore, if we manage to do so, e.g. by introducing new technology, we do not talk about trade-off anymore. We call such solution a breakthrough solution [3] – Figure 1.
Figure 1. Trade-off and breakthrough solution To illustrate the difference between trade-off and breakthrough solution we present an example from car
production domain, similar to the one presented in [4]. One trade-off that must be made there is a trade-off between fuel consumption and horsepower. Within one type of engine it is usually so that higher horsepower is achieved on the expense of fuel consumption. Figure 2 presents the dependency between these two factors for one type of engine. On the same figure we present a desired solution, which is unavailable using current technology thus requiring trade-off or breakthrough solution.
Figure 2. Horsepower vs. fuel consumption for engine type A The designer of the engine has to choose between the configurations of these two parameters that are placed on
the grey area. The trade-off is made when one of these configurations is chosen. These configurations must not be of equal value for the designer. Some of them might not be even unacceptable, e.g. there is a minimal acceptable value of horsepower. The trade-off is made when the best configuration of the available configurations is chosen. If, using current technology, we are able to achieve desired configuration then no trade-off is necessary.
It is possible to obtain desired configuration of fuel consumption by changing engine type to type B. Such a change can potentially move the bordering curve so that desired configuration is within range of available solutions. It is presented in Figure 3.
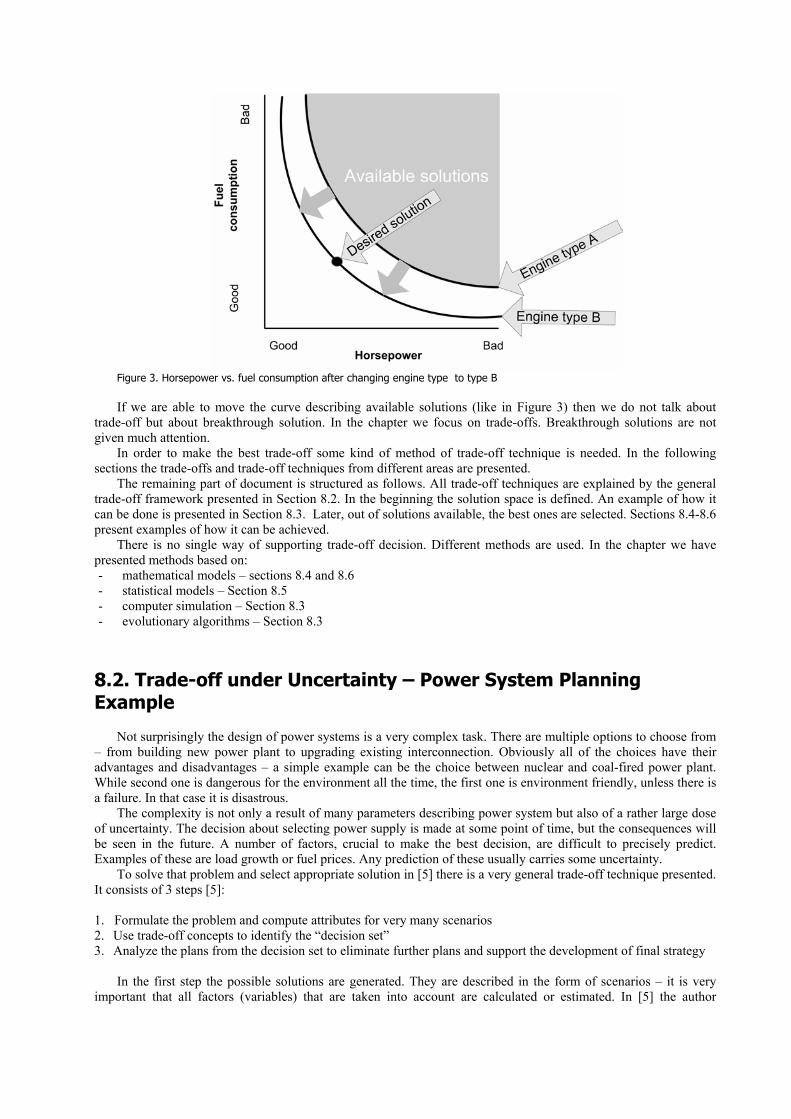
Figure 3. Horsepower vs. fuel consumption after changing engine type to type B If we are able to move the curve describing available solutions (like in Figure 3) then we do not talk about
trade-off but about breakthrough solution. In the chapter we focus on trade-offs. Breakthrough solutions are not given much attention.
In order to make the best trade-off some kind of method of trade-off technique is needed. In the following sections the trade-offs and trade-off techniques from different areas are presented.
The remaining part of document is structured as follows. All trade-off techniques are explained by the general trade-off framework presented in Section 8.2. In the beginning the solution space is defined. An example of how it can be done is presented in Section 8.3. Later, out of solutions available, the best ones are selected. Sections 8.4-8.6 present examples of how it can be achieved.
There is no single way of supporting trade-off decision. Different methods are used. In the chapter we have presented methods based on: - mathematical models – sections 8.4 and 8.6 - statistical models – Section 8.5 - computer simulation – Section 8.3 - evolutionary algorithms – Section 8.3
8.2. Trade-off under Uncertainty – Power System Planning Example
Not surprisingly the design of power systems is a very complex task. There are multiple options to choose from – from building new power plant to upgrading existing interconnection. Obviously all of the choices have their advantages and disadvantages – a simple example can be the choice between nuclear and coal-fired power plant. While second one is dangerous for the environment all the time, the first one is environment friendly, unless there is a failure. In that case it is disastrous.
The complexity is not only a result of many parameters describing power system but also of a rather large dose of uncertainty. The decision about selecting power supply is made at some point of time, but the consequences will be seen in the future. A number of factors, crucial to make the best decision, are difficult to precisely predict. Examples of these are load growth or fuel prices. Any prediction of these usually carries some uncertainty.
To solve that problem and select appropriate solution in [5] there is a very general trade-off technique presented. It consists of 3 steps [5]:
1. Formulate the problem and compute attributes for very many scenarios 2. Use trade-off concepts to identify the “decision set” 3. Analyze the plans from the decision set to eliminate further plans and support the development of final strategy
In the first step the possible solutions are generated. They are described in the form of scenarios – it is very
important that all factors (variables) that are taken into account are calculated or estimated. In [5] the author
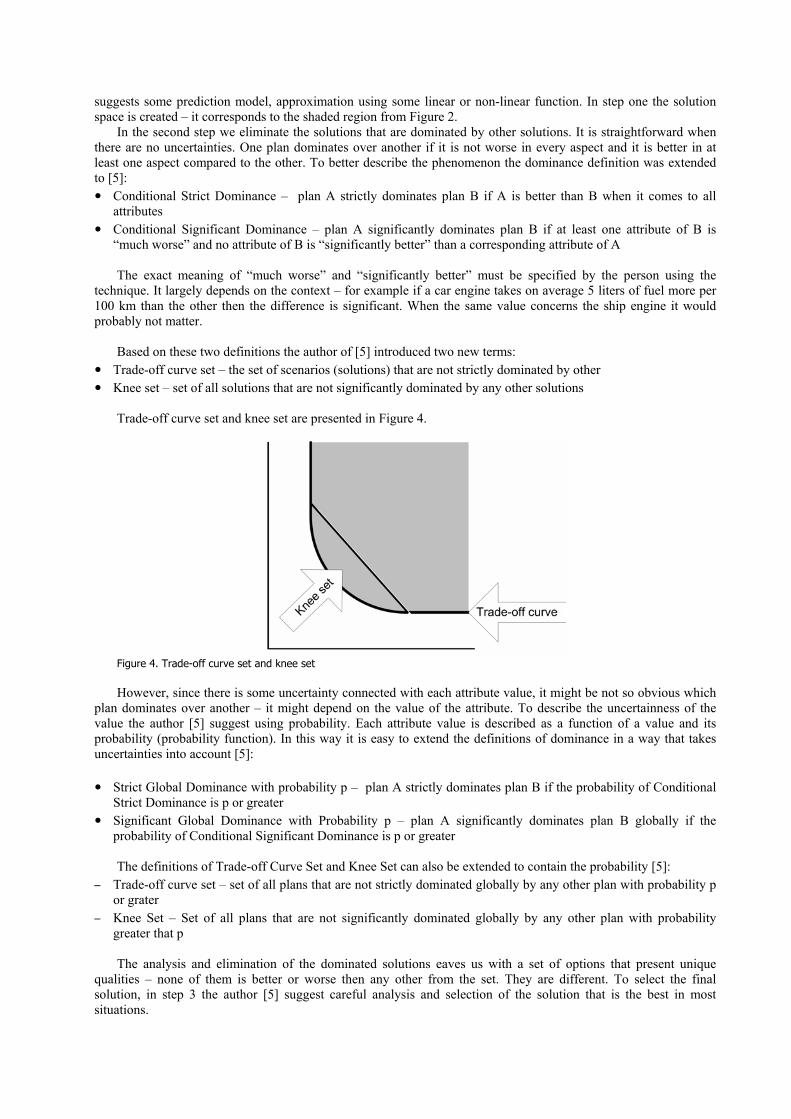
suggests some prediction model, approximation using some linear or non-linear function. In step one the solution space is created – it corresponds to the shaded region from Figure 2.
In the second step we eliminate the solutions that are dominated by other solutions. It is straightforward when there are no uncertainties. One plan dominates over another if it is not worse in every aspect and it is better in at least one aspect compared to the other. To better describe the phenomenon the dominance definition was extended to [5]: ● Conditional Strict Dominance – plan A strictly dominates plan B if A is better than B when it comes to all
attributes ● Conditional Significant Dominance – plan A significantly dominates plan B if at least one attribute of B is
“much worse” and no attribute of B is “significantly better” than a corresponding attribute of A The exact meaning of “much worse” and “significantly better” must be specified by the person using the
technique. It largely depends on the context – for example if a car engine takes on average 5 liters of fuel more per 100 km than the other then the difference is significant. When the same value concerns the ship engine it would probably not matter.
Based on these two definitions the author of [5] introduced two new terms:
● Trade-off curve set – the set of scenarios (solutions) that are not strictly dominated by other ● Knee set – set of all solutions that are not significantly dominated by any other solutions
Trade-off curve set and knee set are presented in Figure 4.
Figure 4. Trade-off curve set and knee set However, since there is some uncertainty connected with each attribute value, it might be not so obvious which
plan dominates over another – it might depend on the value of the attribute. To describe the uncertainness of the value the author [5] suggest using probability. Each attribute value is described as a function of a value and its probability (probability function). In this way it is easy to extend the definitions of dominance in a way that takes uncertainties into account [5]:
● Strict Global Dominance with probability p – plan A strictly dominates plan B if the probability of Conditional
Strict Dominance is p or greater ● Significant Global Dominance with Probability p – plan A significantly dominates plan B globally if the
probability of Conditional Significant Dominance is p or greater The definitions of Trade-off Curve Set and Knee Set can also be extended to contain the probability [5]:
– Trade-off curve set – set of all plans that are not strictly dominated globally by any other plan with probability p or grater
– Knee Set – Set of all plans that are not significantly dominated globally by any other plan with probability greater that p The analysis and elimination of the dominated solutions eaves us with a set of options that present unique
qualities – none of them is better or worse then any other from the set. They are different. To select the final solution, in step 3 the author [5] suggest careful analysis and selection of the solution that is the best in most situations.

8.3. Time-cost Trade-off – Finding an Optimal Balance using Simulation or Evolutionary Algorithms
In the previous chapter we described a general framework for trade-off decision making. In its first step number of possible scenarios is predicted. This scenarios form a solution space –a list of all available solutions. Sometimes solution space is easy to establish – e.g. the relationship between engine power and fuel consumption may be available in engine specification. Sometimes solution space establishment might be the hardest part of trade-off making process. In this section such a situation is presented.
The time-cost trade-off is a well-studied trade-off example within project management. The project is defined as a set of tasks. The tasks are often dependent on each other, e.g. one can start only when previous one is finished. The relations between the tasks in the project are usually presented in the form of graph (e.g. PERT, Figure 5). To find the completion time for the project each of the tasks must be assigned with individual completion time. The longest sequence of such interconnected tasks, so called Critical Path, is used to calculate the total time of the project.
Figure 5. PERT diagram. Circles denote milestones, arrows describe tasks It was observed that the completion time of each single task can be presented as a function of resources
involved in the task. All resources used form a cost of the project. By increasing amount of resources (and thus project’s total cost) it is possible to decrease completion time. It was also noticed that the impact of “resource injection” can have different result depending on where the resources are injected. It is caused by interdependencies between the individual tasks within the project – if the resources are added to tasks that do not belong to Critical Path the total time will not be shortened. If they are added to tasks lying on Critical Path then the project completion time may be shortened, but does not have to be – the critical path may just be changed.
A well documented construction business trade-off is the one between project time and cost. In order to make a decision a manager must know what kind of time-decrease can be expected from the additional investment. The Critical Path Method provides a tool for analyzing the decision in such situation, but it does not say how to find the best resource allocation method. In the literature there are numerous approaches to solve that problem. Two of them are by using: - Simulation [9] - Genetic algorithm [10]
In [9] to find the optimal trade-off the authors developed an application that randomly applies additional
resources to different tasks in the project. Even though the method reminds an exhaustive search combined with “lucky guessing” introduced by randomness, they report that rather promising results can be obtained in reasonable time.
A more sophisticated approach was suggested in [10]. By combining Genetic Algorithms and fuzzy logic they not only managed to incorporate the information about planned time for each task but also uncertainty connected with the estimation. In this way the authors are able not only to estimate the total cost and completion time but also to determine the uncertainty connected with the estimation.
The application of any of the methods mentioned above can produce a data that is suitable for cost-benefit analysis, which can help making best trade-off decision.
8.4. Advertising vs. Pay-per-view in Electronic Media
In the previous section we described a method for establishing a solution space – a set of available options. It often happens so that after eliminating the solutions that are dominated by the other we are still left with a set of possible decisions. Each of them presents unique qualities and is better, in some aspect, then the others. However, it is often not enough to leave a set of solutions. Usually some option must be selected.

In [6] such a situation is presented. The paper discusses two major strategies when it comes to collecting revenue in the media, which are advertising and subscription. Each media provider must decide how to balance the income from both of them. Currently, there are numerous models that exist in practice. Television broadcasting is traditionally fully based on income from advertisements. It used to be so because of technical difficulty in collecting subscription – the TV was broadcasted over the air an there was no way of restricting access to it. Cable based services, like cable-TV or Internet, are traditionally subscription based – the unauthorized access is somehow naturally restricted. However, there are numerous examples of successful business models that break this traditions, e.g. [6].: - Phone companies that offer free calls that are interrupted by advertisements - Free email accounts where the service provider adds an advertisement to the messages - Free-PC – where free computer and internet connection are given. In return the customer watches
advertisements broadcaster by internet provider. - Video-on-demand – there are companies that offer discounts if the advertisements are presented to the
subscriber From the provider’s perspective the optimal solution would be to have both – advertisements and subscription.
That should maximize the revenue. The problem is that the methods are conflicting. The advertisement based services are usually more popular among the low-income audience. The high income viewers rather prefer to avoid commercials by paying subscription. On the other hand the high-income audience is, for obvious reasons, most interesting for the advertisers.
Apart from selecting advertising or subscription based model, the media provider can select a mixed model. In such a model the revenue is collected from both subscription and advertisements. In such a situation it is important to select appropriate ratio of commercial time to the total program time. Too large amount of advertisements will decrease number of customers, not willing to pay for watching them. Too low number of advertisements may not make sense since the revenue from them is lower than the alternative revenue from the customers that would buy subscription if commercials were not shown at all.
In order to support the decision concerning the revenue collection model, the authors [6] build a mathematical model of decision process. They present subscriber model, in which the customers are divided into High Types – the customers for whom the utility of the service is connected with the low number of commercials, and Low Types, for whom the service price is of primary concern (figure 6), and therefore they agree to watch commercials.
Figure 6. Preferences of High and Low Type customers (source: [6]) Similar model was build for advertisers. Since the advertisers are more interested in high income customers the
amount of advertisers interested in paying for commercials depends more on the quantity of High Type viewers. To find the optimal trade-off the cost-benefit analysis was suggested. As the most optimal decision the authors
suggested the one which brings highest total profit to the media provider. From the perspective of the media provider each customer generates an income, which is equal to the sum of subscription plus amount of advertisers that are interested in paying for presenting their offer to the customer. Such a value, multiplied by the amount of customers, describes the total profit of the media provider.
Based on this assumption the authors suggest four possible strategies: - pooling – where there is one mixed offer (both subscription and advertisements) for all customers - separating – where the provider gives two separate options of media access for high and low income customers - limited access – where the low-income customers do not participate – the media provider sets high subscription
price, which is a main source of revenue - free access – where the service is provided for free and the revenue is based on advertisements

To support decision making a mathematical model was suggested. For each strategy the precise conditions under which the strategy is the best were presented. The comparison of the strategies leads to general conclusion, that, if separation strategy exists (if there are two segments of customers), then it is the best option.
8.5. A Car Seller Trade-off
In previous chapter we presented a trade-off which was handled by introducing market segmentation. Division of the market into smaller groups of people with homogenous preferences allows choosing appropriate marketing strategy that appeals to their common preferences. In the previous case segmentation was done based on the income of service buyers. The decision about segmentation was straightforward, because the reasons behind customer decisions about selecting subscription based services are well studied and understood. It is not always the case.
In [7] the car dealer trade-offs are examined. Traditionally the car market was a product market – a consumer used to buy a car only – the car quality was the only attribute taken into account. Recently much more attention is given to additional offerings like free-service, special discounts for frequent customers and so on. These offerings are used by car dealers as tools for attracting customers. The car dealer has following methods of attracting customers [7]: - service package – a good service package can become dealer’s competitive advantage. - relationship – establishing long term relationships with clients becomes increasingly popular. Special offers
and discounts for frequent customers bind them to one dealer and, in this way, provide the dealer with high profit opportunities in the future.
- price – the low prices are always valued by the customers The optimal situation would be to combine all of the methods and provide cheap car with good service package
and establish long term relationship. Unfortunately, the methods are contradictory - the resources for good service and maintaining long term relationship with the customer are included in the car price. What we have here is a typical “pick two out of three” situation – application of two customer attracting methods usually results in inability to apply the third one.
In order to find the best trade-off the authors [7] decided to ask the persons that know best which combination of these three methods is the best – the customers. They sent questionnaires to a large number of drivers in which they asked about the importance of each of them. The answers, appropriately codified, underwent statistical processing using Cluster Analysis. This method is used to group together the respondents that gave most similar answers. The analysis brought interesting results. The authors managed to distinguish 3 significantly different segments of car buyers. The first segment is called “Relation prone”. These are buyers that highly value the long-term relationship with the dealer. Second group, “service minded”, is predominately focused on service package quality. The last group, for called “Butterflies”, leans towards service quality; however they still try to maintain some reasonable share of remaining aspects. An interesting finding was that there was no group that was strongly price oriented. The results are presented in Figure 7.
RELATION
Relation prone
Butterflies
Service minded
PRICE SERVICE
Figure 7. Relative importance of different car buying process aspects (source: [7]) The attractiveness of each of 3 possible groups was established by counting its market share (proportional to
number of respondents that would fit one of the three groups). Each of the three solutions, even though neither

optimal for car dealer nor for car buyer, presents some kind of reasonable compromise. A compromise that at the same time maximizes the satisfaction of all parties involved in the transaction.
8.6. To Meet or to Change Customer’s Expectations
Traditional engineering approach to trade-off solving is finding a solution that is the closest to what a customer wants. In this section we would like to present different and a bit provocative attitude to that problem. In [8] the authors discuss the trade-off between meeting the customers expectations and … changing them.
In every product life there is a moment when it does not meet the customer’s requirements anymore. If the manufacturer of such a product wants to keep in on the market then there are two possible strategies: - product modification - advertising
Product modification is about improving it so it meets the requirements. When it comes to advertising there are
two options [8]: - Advertise the virtues of the product to change the market preferences - Advertise deceptively to change the perception of the product to less accurate but more in line with current
market demands
The change of market preferences is actually a quite common strategy. The idea is either to find a feature which differentiates the product in the market and run a campaign, purpose of which is not to advertise the product explicitly but to attract the attention to that particular feature and increase its value in the eyes of customers. The deceptive advertising is based on idea of creating a falsified view of the product - e.g. advertising some kind of fast-food as healthy because it is made of fresh products. At the first glance it may look reasonable, because food made of not fresh products is unhealthy. Another way of deceptive advertising is to, by advertising a particular feature of the product; create impression that this product is the best from that feature perspective. Example of such advertisement is, for example, to present some kind of estate-car as a car with especially spacious baggage space. It does not necessarily have to mean that other estate-cars have smaller trunk – it can equally well mean that the trunk is spacious because it is an estate-car. But such a commercial, implicitly, creates a view of a product that has especially high luggage space, better than the others.
Whenever the producer has to make the choice between product modification and advertising there is clear trade-off to be made: - Product modification is difficult, expensive and time consuming. To deliver a new product to the market is
usually a considerable effort of the whole company. However, if done and advertised well, it can help keeping current and provide future customers. The quality investment can be long term investment. The good reputation of the company can influence the sell rate of its other products.
- Changing market preferences is not only costly but also difficult. There is a risk that competitors will benefit on that on our expense (will fill the new market, which we created, with their products). If deceptive strategy is chosen then there is rather large risk of loosing good reputation. It might however be good option if the cost of re-engineering the product is extremely high. Also when the important part is to get the customer only – e.g. when the customer later is bind with some initial agreements, like upgrades or mandatory service check-ups. In such situation deceptive strategy can win us some time which can be used to improve the reputation of the company.
To help in making the trade-off decision in [8] the cost-benefit analysis is suggested. They suggest two
parameters that should be taken into account: - Repeg Ratio – which is the ratio of the cost of advertising the product to the cost of reengineering the product. - Repeat Sales Coeficient – which describes the number of sales of the product after the first sale. It described
the prospect of future sales of the product. Depending on the values of both parameters there are 4 strategies available to the seller:

High
Ambiguous Case
- Strategy driven largely by cost of product return to
buyer
- Where switching costs for the buyer are high,
seller will make attempts to amplify the product
attributes
- Low switching costs will lead to more accurate
product claims
Truth, Whole Truth, and Nothing but the Truth
- Do not falsify product claims
- Create a loyal customer base
- Advertising is aimed at persuading buyers to value
the product’s attributes, rather than at falsifying
product features.
Rep
eat S
ale
Coe
ffic
ient
Low
Lie Like Hell
- Generating purchase is all important
- Threat of returns may act as a fetter on the extent
of exaggeration
- If product has low marginal, falsification becomes
even more attractive
Generally Tell the Truth
- Exaggeration, if any, is restricted to claims about
quality
- Exception: when the product is catastrophically
misaligned & long lead time to reengineer and
bring to market
- Fear of network effects going against them may
result in sellers announcing vapourware.
Low High
Repeg ratio
Figure 8. Seller’s strategies (source: [8]) The authors [8] build a concrete mathematical model describing the benefit when a concrete strategy is selected.
The trade-off technique presented in [8] is based on the idea of finding a one most important attribute (here it is benefit), and relating it to the attributes that are traded-off. By doing that it is possible to find a combination of both attributes in which the most important attribute has the highest value.
8.7. Summary
The trade-offs are very common in any human activity. In the chapter we have presented examples of trade-offs from power systems engineering, project management, civil engineering, product management and marketing.
As we have concluded in section 1 whenever there is a contradiction between requirements it can be solved either by making trade-off decision or by introducing a breakthrough solution. The main difference between them is that trade-off does not lead to desired solution, while the breakthrough solution allows achieving it.
All examples presented in the chapter involve some kind trade-offs. The trade-offs are usually an effect of technical or physical contradictions in requirements. These contradictions must be overcome in order to achieve breakthrough. In is usually achieved by introduction of a new technology, but not only. In the chapter we present one, a bit provocative, example of breakthrough solution (Section 8.6). In the example instead of meeting the expectations concerning the product the authors suggest changing them.
In Section 8.2 we have presented a general method for trade-off decision making. It involves identification of available solutions and selection of the best out of available solutions. The example of how the available solutions can be identified can be found in Section 8.3. Sections 8.4-8.6 present examples of best solution selection methods.
There is no single way of supporting trade-off decision. Different methods are used. In the chapter we have presented methods based on mathematical models (sections 8.4 and 8.6), statistical models (Section 8.5), computer simulation (Section 8.3), evolutionary algorithms (Section 8.3).
Even though trade-offs are very common it is rather difficult to find a lot of literature describing how there are made in practice. Sometimes the trade-off technique is a company secret that gives this company a competitive advantage – e.g. the trade-off decision is based on the knowledge gained from expensive market research. Sometimes the trade-off concerns rather delicate issues, e.g. when trade-off involves human life or health. Such trade-offs are most interesting. Unfortunately the parties that know the way such trade-offs are made are, at the same time, the least interested in revealing that information. Therefore it is a rather serious obstacle for anyone that is interested in describing the practice of trade-off making.

8.8. References
1. Webster Dictionary, http://www.m-w.com/ 2. Cambridge Dictionary , http://dictionary.cambridge.org/ 3. Contradictions: Air Bag Applications, Ellen Domb,
http://www.triz-journal.com/archives/1997/07/a/ 4. Contradiction Chains, Darrell MANN,
http://www.triz-journal.com/archives/2000/01/a/ 5. Burke W.J. ; Merrill H.M. ; Schweppe F.C. ; Lovell B.E. ; McCoy M.F. ; Monohon S.A. IEEE Transactions on
Power Systems, 1988 vol: 3 issue: 3, 1284-1290 6. Advertising versus pay-per-view in electronic media, Prasad, A. ; Mahajan, V. ; Bronnenberg, B., International
Journal of Research in Marketing year: 2003 vol: 20 issue: 1 pages: 13-30 7. Consumers' trade-off between relationship, service package and price: An empirical study in the car industry,
Odekerken-Schroder Gaby ; Ouwersloot Hans ; Lemmink Jos ; Semeijn Janjaap European Journal of Marketing year: 2003 vol: 37 issue: 1-2 pages: 219-242
8. This paper is great! or achieving the optimal balance between investment in quality and investment in self-promotion, Clemons, E.K., Proceedings of the 34th Annual Hawaii International Conference on System Sciences year: 2001
9. A Simulation approach to the PERT/CPM tie-cost trade-off problem, Haga Wayne A ; Marold Kathryn A , Project Management Journal year: 2004 vol: 35 issue: 2 pages: 31-37
10. A GA-based fuzzy optimal model for construction time-cost trade-off, Leu Sou-Sen ; Chen An-Ting ; Yang Chung-Huei, International Journal of Project Management year: 2001 vol: 19 issue: 1 pages: 47-58