software manual - cge risk management solutions softwa… · the purpose of this software manual is...
TRANSCRIPT

Software Manual For IncidentXP 6.0
Revision 6 (13-Mar-2012)
Please note that this documentation is preliminary and subject to change without notice. The latest version of this document can be obtained via CGE (email [email protected]) or via a IncidentXP Value Added Reseller.

Page 2 of 49
Copyright Copyright © IP Bank B.V. 2004-2013. BowTieXP is a registered trademark of IP Bank B.V. BSCAT (Barrier based Systemic Cause Analysis Technique) is property of Det Norske Veritas Ltd. and copyright © 2011 Det Norske Veritas Ltd. The BSCAT method manual is copyright © 2011 Det Norske Veritas Ltd. All other trademarks and brands are the property of their respective owners. This document is subject to change without notice. All rights reserved.
Page 3 of 49
Table of Contents 1 Introduction ................................................................................................................................................................ 5
1.1. Thank you ........................................................................................................................................................... 5 1.2. Purpose of this document .................................................................................................................................. 5 1.3. Structure of this document ................................................................................................................................ 5
2 Quick installation guide............................................................................................................................................... 7 2.1. Introduction ........................................................................................................................................................ 7 2.2. Installing IncidentXP ........................................................................................................................................... 7 2.3. Activating IncidentXP .......................................................................................................................................... 7
3 Quick getting started guide ......................................................................................................................................... 9 3.1. The IncidentXP screen ........................................................................................................................................ 9 3.2. Creating an incident ......................................................................................................................................... 11 3.3. Creating a timeline ........................................................................................................................................... 12
4 The BSCAT method ................................................................................................................................................... 15 4.1. A brief description of BSCAT methodology ...................................................................................................... 15 4.2. Creating a BSCAT diagram – free form ............................................................................................................. 17 4.3. Creating a BSCAT diagram – bowtie templated ................................................................................................ 20 4.4. Editing your BSCAT diagram ............................................................................................................................. 22 4.5. Doing a BSCAT assessment on a barrier ........................................................................................................... 22
5 Tripod Beta ............................................................................................................................................................... 25 5.1. A brief description of Tripod Beta methodology .............................................................................................. 25 5.2. Creating a Tripod Beta diagram – Free form .................................................................................................... 27 5.3. Creating a Tripod Beta diagram – Bowtie templated ....................................................................................... 30 5.4. Editing your Tripod Beta diagram ..................................................................................................................... 32 5.5. Doing a Tripod Beta assessment on the barrier ............................................................................................... 32
6 Configuring the diagram ........................................................................................................................................... 35 6.1. Changing settings for a single type of item ...................................................................................................... 35 6.2. Configuring the diagram ................................................................................................................................... 36 6.3. Adjusting lookup colors .................................................................................................................................... 38 6.4. Adjusting lookup colors for unassigned values ................................................................................................. 39
7 Case file tools ............................................................................................................................................................ 40 7.1. Listview window ............................................................................................................................................... 40 7.2. Quality checks window ..................................................................................................................................... 40 7.3. Case overview ................................................................................................................................................... 41
8 Linking to documentation ......................................................................................................................................... 43 Introduction............................................................................................................................................................. 43 8.1. Document links window ................................................................................................................................... 43
9 Getting data out of the program ............................................................................................................................... 45 9.1. Introduction ...................................................................................................................................................... 45 9.2. Reporting .......................................................................................................................................................... 45 9.3. Using the treeview............................................................................................................................................ 45 9.4. Using the case file overview ............................................................................................................................. 46 9.5. Using the quality checks ................................................................................................................................... 46 9.6. Using the listview ............................................................................................................................................. 46
10 A brief description of a subset of bowtie methodology .......................................................................................... 47
11 Support ................................................................................................................................................................... 49 11.1. Helpdesk ......................................................................................................................................................... 49 11.2. Software training ............................................................................................................................................ 49 11.3. BSCAT method training ................................................................................................................................... 49 11.4. Tripod Beta method training .......................................................................................................................... 49

Page 5 of 49
1 Introduction
1.1. Thank you
Thank you for your interest in IncidentXP and the analysis methods it supports. Risk management professionals and incident investigators worldwide have discovered the value in implementing those methods by using the IncidentXP software; a powerful and easy-to-use tool.
1.2. Purpose of this document
The purpose of this software manual is to provide an explanation of the IncidentXP software tool, which supports both DNV’s BSCAT™ technique for incident investigation as well as the Tripod Beta technique for incident analysis. It assumes basic familiarity with accident and incident investigation methods. For BSCAT: This manual combined with the DNV BSCAT Method Manual should be sufficient for experienced investigators to use the method and software successfully. For Tripod: Familiarity, or preferably being an accredited Tripod professional, along with this manual, should be enough to get you going with the software. Training courses in BSCAT and Tripod Beta are available in the market. Customized training for the BSCAT method is available through DNV (www.dnv.com). Training for Tripod Beta is available through various parties such as e.g. AdviSafe (www.advisafe.nl).
1.3. Structure of this document
This document is divided into the following parts: 1. Step by step guides to get you started:
Chapter 2, Quick installation guide on page 7. This guide quickly describes how to install IncidentXP on your computer.
Chapter 3, Quick getting started guide on page 9. This guide briefly discusses the BSCAT methodology and then gives a step-by-step guide on how to create a BSCAT diagram using the software. Some important software concepts are explained.

Page 7 of 49
2 Quick installation guide
In this chapter we will walk you through the steps to install IncidentXP.
2.1. Introduction
Installing IncidentXP onto your computer is very simple. If however, you run into trouble and want to have more detailed information about the installation procedure, about the software prerequisites and compatibility, then this information is available in the full software manual (the BowTieXP software manual). Note: BowTieXP and IncidentXP are the same product, your license key will determine which you get to see :
IncidentXP,
BowTieXP
Or both. This is the reason why you will download the software from the BowTieXP downloads site.
2.2. Installing IncidentXP
Open an internet browser and navigate to:
http://www.governorsmansion.nl/downloads/bowtiexp/ You will need to download the following:
Only on Windows XP: The Microsoft .NET Framework 2.0 installer, if it is not already installed.
The BowTieXP installer. If you are running Windows XP: double click the first file you downloaded (the .NET Framework installer) and let the wizard guide you through the steps in order to install it. Note that Windows Vista and Windows 7 come with the framework already installed. Double click the second file you downloaded (the BowTieXP installer) and let the wizard guide you through the steps in order to install it.
2.3. Activating IncidentXP
When you start the software for the first time, you are asked for either a trial code or an activation code:
Page 8 of 49
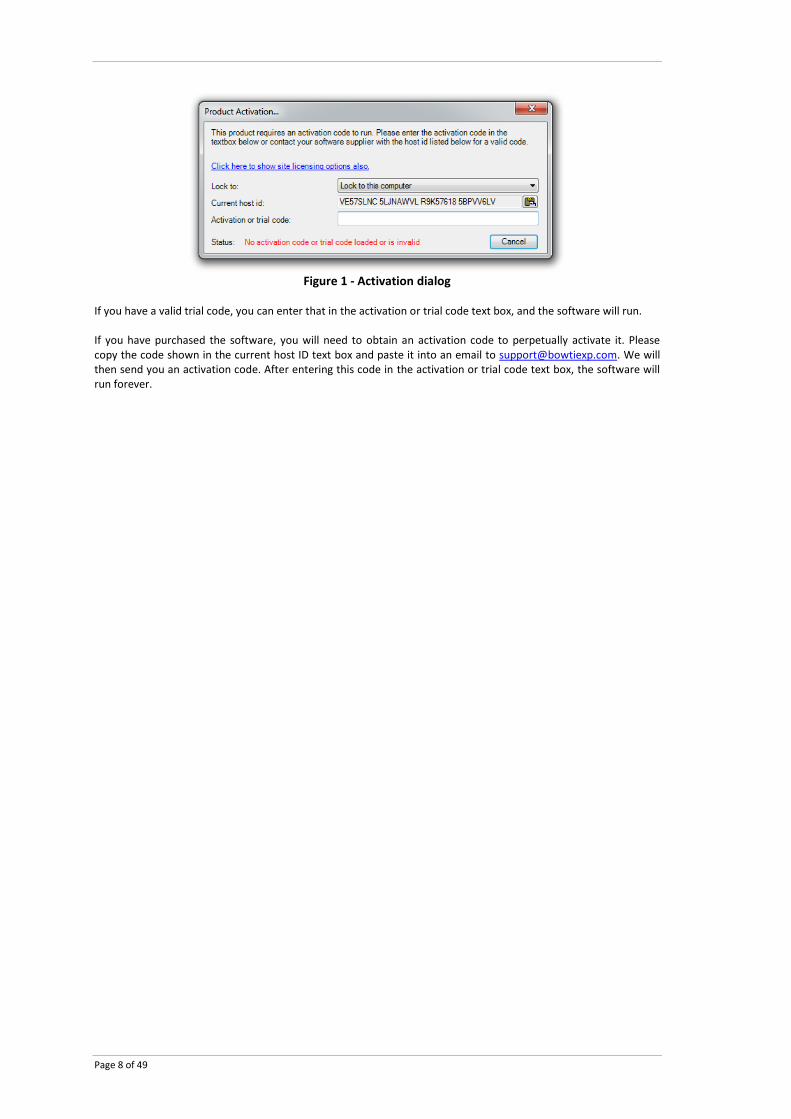
Figure 1 - Activation dialog
If you have a valid trial code, you can enter that in the activation or trial code text box, and the software will run. If you have purchased the software, you will need to obtain an activation code to perpetually activate it. Please copy the code shown in the current host ID text box and paste it into an email to [email protected]. We will then send you an activation code. After entering this code in the activation or trial code text box, the software will run forever.
Page 9 of 49
3 Quick getting started guide
3.1. The IncidentXP screen
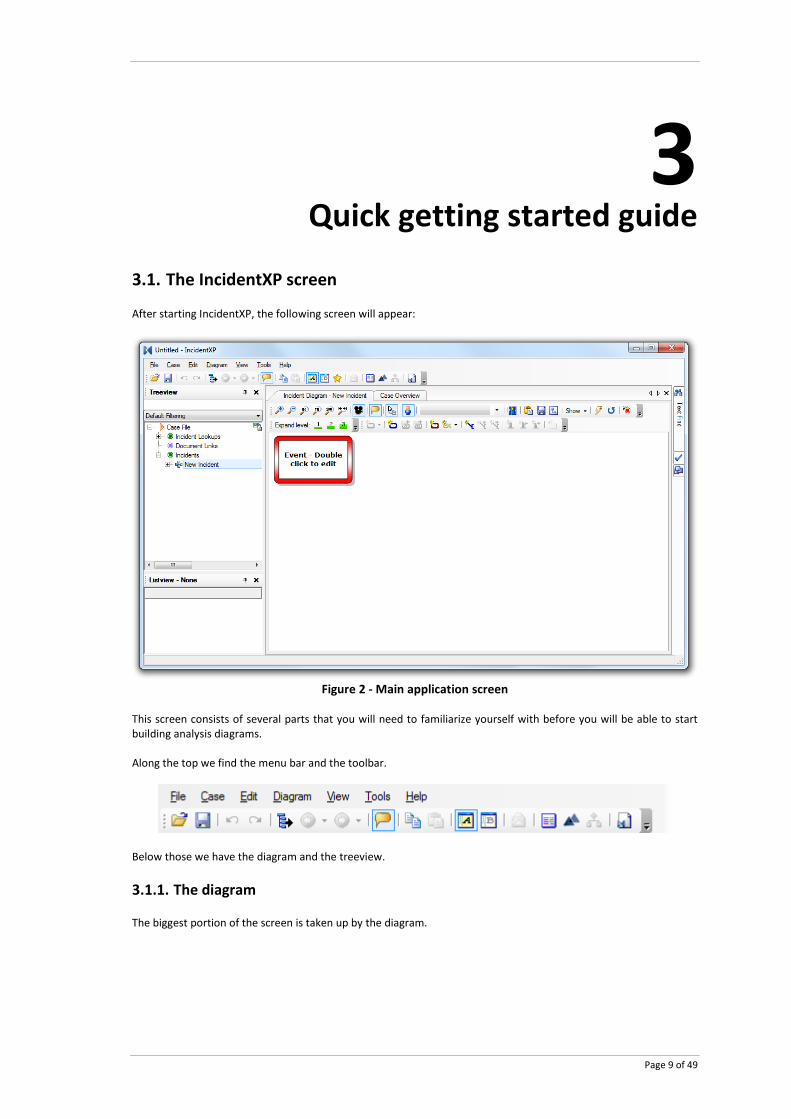
After starting IncidentXP, the following screen will appear:
Figure 2 - Main application screen
This screen consists of several parts that you will need to familiarize yourself with before you will be able to start building analysis diagrams. Along the top we find the menu bar and the toolbar.
Below those we have the diagram and the treeview.
3.1.1. The diagram
The biggest portion of the screen is taken up by the diagram.
Page 10 of 49
The diagram window is where the visual portion of your diagram will take shape, think of the diagram window as your drawing board. The diagram can show the timeline of an incident, the analysis diagram of an incident, or both. The analysis diagram can be either a BSCAT or a Tripod diagram.
3.1.2. The treeview
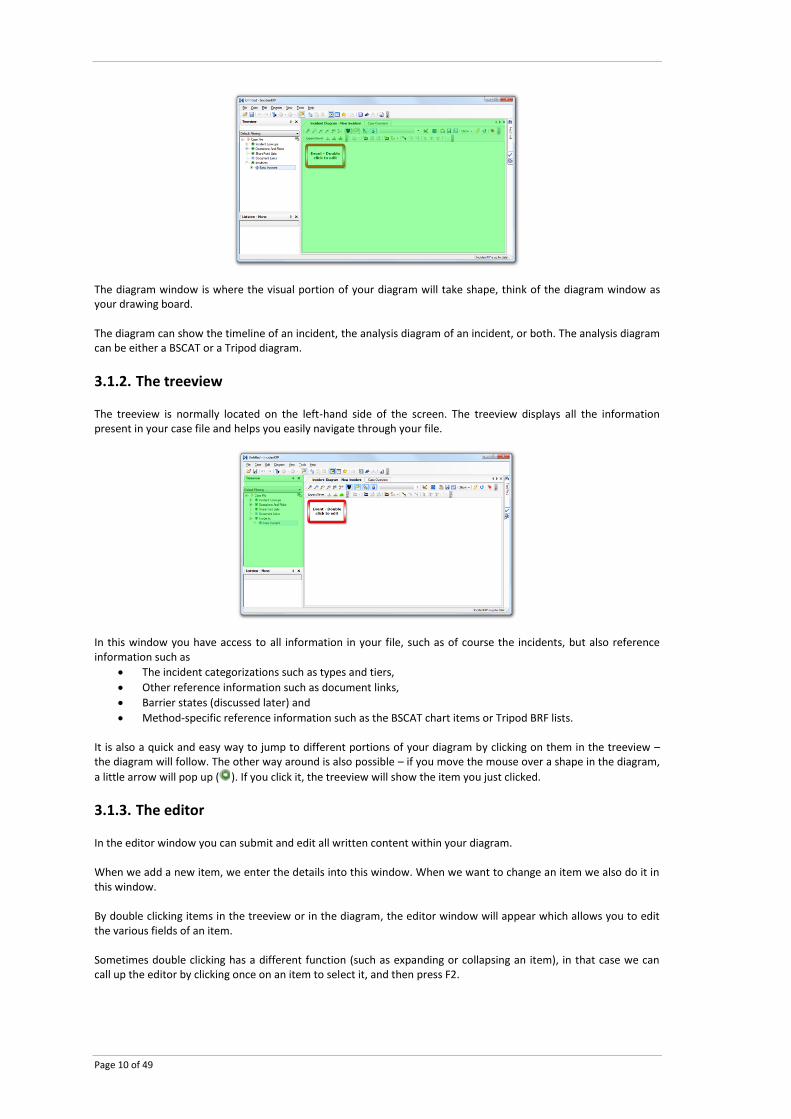
The treeview is normally located on the left-hand side of the screen. The treeview displays all the information present in your case file and helps you easily navigate through your file.
In this window you have access to all information in your file, such as of course the incidents, but also reference information such as
The incident categorizations such as types and tiers,
Other reference information such as document links,
Barrier states (discussed later) and
Method-specific reference information such as the BSCAT chart items or Tripod BRF lists. It is also a quick and easy way to jump to different portions of your diagram by clicking on them in the treeview – the diagram will follow. The other way around is also possible – if you move the mouse over a shape in the diagram,
a little arrow will pop up ( ). If you click it, the treeview will show the item you just clicked.
3.1.3. The editor
In the editor window you can submit and edit all written content within your diagram. When we add a new item, we enter the details into this window. When we want to change an item we also do it in this window. By double clicking items in the treeview or in the diagram, the editor window will appear which allows you to edit the various fields of an item. Sometimes double clicking has a different function (such as expanding or collapsing an item), in that case we can call up the editor by clicking once on an item to select it, and then press F2.
Page 11 of 49
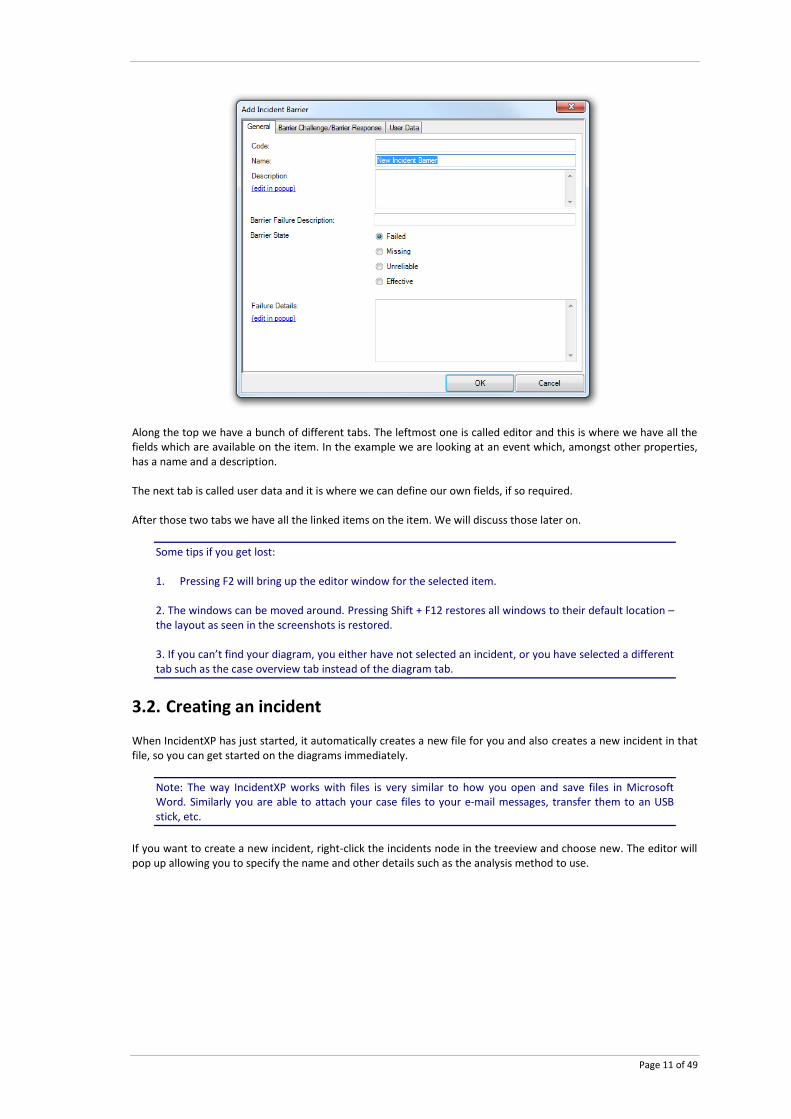
Along the top we have a bunch of different tabs. The leftmost one is called editor and this is where we have all the fields which are available on the item. In the example we are looking at an event which, amongst other properties, has a name and a description. The next tab is called user data and it is where we can define our own fields, if so required. After those two tabs we have all the linked items on the item. We will discuss those later on.
Some tips if you get lost: 1. Pressing F2 will bring up the editor window for the selected item. 2. The windows can be moved around. Pressing Shift + F12 restores all windows to their default location – the layout as seen in the screenshots is restored. 3. If you can’t find your diagram, you either have not selected an incident, or you have selected a different tab such as the case overview tab instead of the diagram tab.
3.2. Creating an incident
When IncidentXP has just started, it automatically creates a new file for you and also creates a new incident in that file, so you can get started on the diagrams immediately.
Note: The way IncidentXP works with files is very similar to how you open and save files in Microsoft Word. Similarly you are able to attach your case files to your e-mail messages, transfer them to an USB stick, etc.
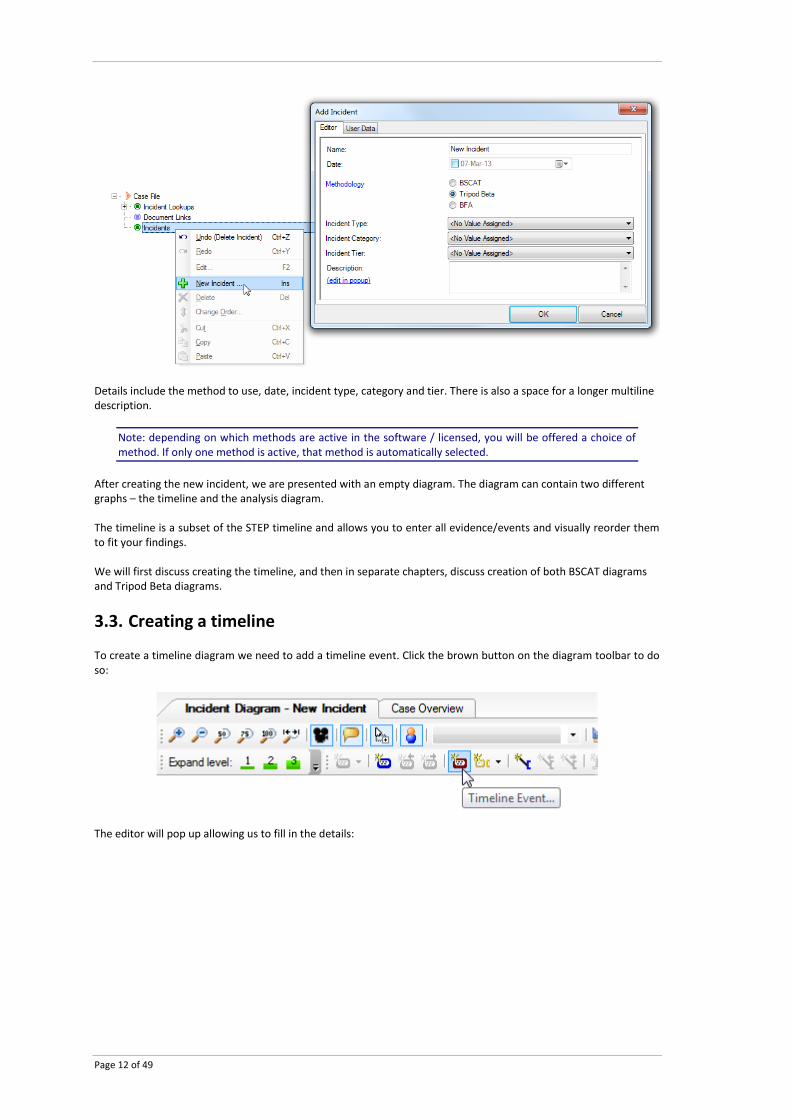
If you want to create a new incident, right-click the incidents node in the treeview and choose new. The editor will pop up allowing you to specify the name and other details such as the analysis method to use.
Page 12 of 49
Details include the method to use, date, incident type, category and tier. There is also a space for a longer multiline description.
Note: depending on which methods are active in the software / licensed, you will be offered a choice of method. If only one method is active, that method is automatically selected.
After creating the new incident, we are presented with an empty diagram. The diagram can contain two different graphs – the timeline and the analysis diagram. The timeline is a subset of the STEP timeline and allows you to enter all evidence/events and visually reorder them to fit your findings. We will first discuss creating the timeline, and then in separate chapters, discuss creation of both BSCAT diagrams and Tripod Beta diagrams.
3.3. Creating a timeline
To create a timeline diagram we need to add a timeline event. Click the brown button on the diagram toolbar to do so:
The editor will pop up allowing us to fill in the details:
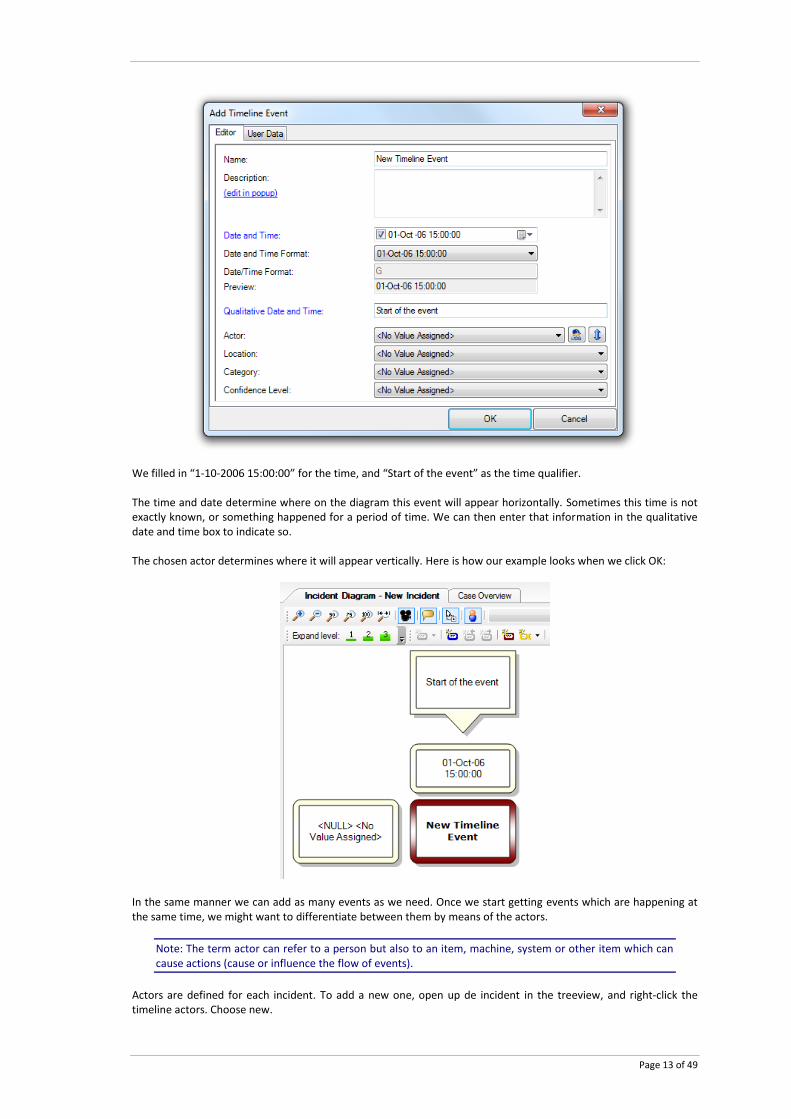
Page 13 of 49
We filled in “1-10-2006 15:00:00” for the time, and “Start of the event” as the time qualifier. The time and date determine where on the diagram this event will appear horizontally. Sometimes this time is not exactly known, or something happened for a period of time. We can then enter that information in the qualitative date and time box to indicate so. The chosen actor determines where it will appear vertically. Here is how our example looks when we click OK:
In the same manner we can add as many events as we need. Once we start getting events which are happening at the same time, we might want to differentiate between them by means of the actors.
Note: The term actor can refer to a person but also to an item, machine, system or other item which can cause actions (cause or influence the flow of events).
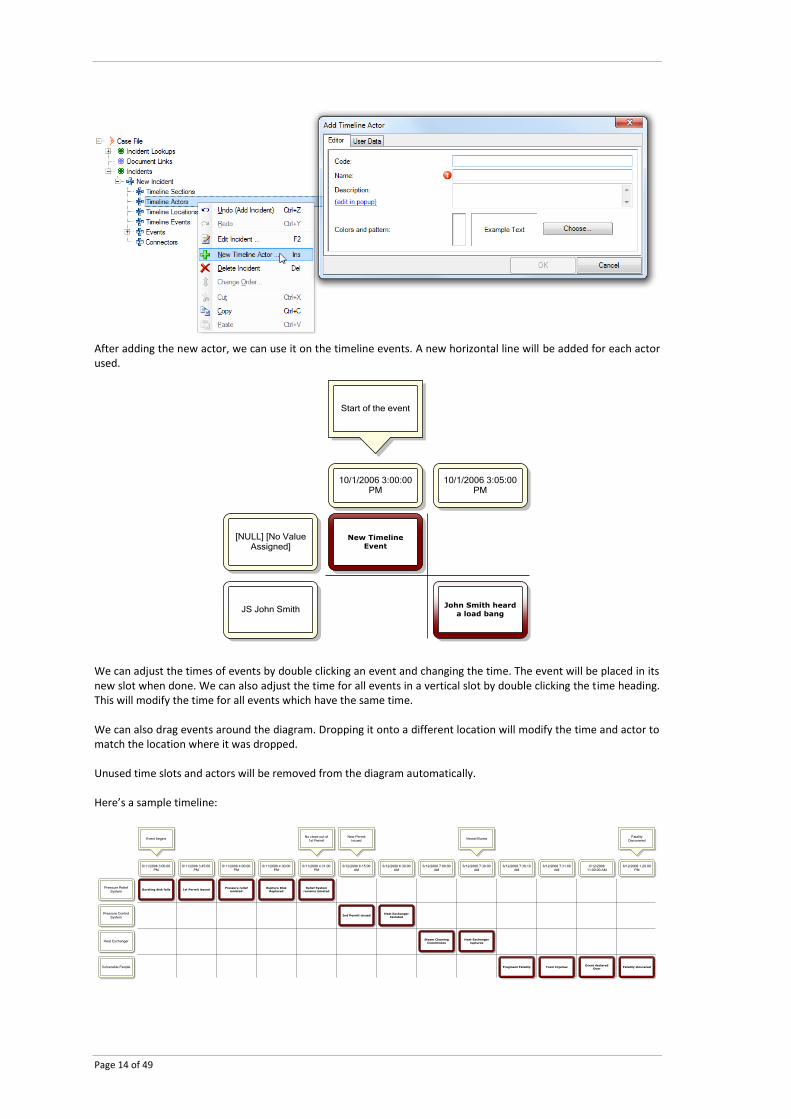
Actors are defined for each incident. To add a new one, open up de incident in the treeview, and right-click the timeline actors. Choose new.
Page 14 of 49
After adding the new actor, we can use it on the timeline events. A new horizontal line will be added for each actor used.
We can adjust the times of events by double clicking an event and changing the time. The event will be placed in its new slot when done. We can also adjust the time for all events in a vertical slot by double clicking the time heading. This will modify the time for all events which have the same time. We can also drag events around the diagram. Dropping it onto a different location will modify the time and actor to match the location where it was dropped. Unused time slots and actors will be removed from the diagram automatically. Here’s a sample timeline:
Page 15 of 49
4 The BSCAT method
4.1. A brief description of BSCAT methodology
Note: Refer to DNV’s BSCAT method manual for a more thorough elaboration.
4.1.1. Introduction
The BSCAT™ method refers to a method that links modern risk–based safety management approaches to systematic root cause incident investigation. The “B” refers to barrier–based as each barrier identified in bowtie risk assessments is tested for why it failed. SCAT™ is Systematic Cause Analysis Technique, a well-established root cause analysis approach which incorporates the DNV loss causation model. The model is a sequence of dominos establishing the hierarchy of accident progression from the immediate cause back to fundamental root causes and system failures. In short - BSCAT is the barrier based extension to DNV’s SCAT method. The SCAT model (Systematic Cause Analysis Technique) was developed to help incident investigators apply the DNV loss causation model to actual events. This is done by means of the SCAT chart. The chart was created to build–out an event using standardized event descriptions that can fit the whole range of incidents and near misses. Due to using a standardized list, incident analyses are suitable to aggregation, leading to more insight into the weak areas of your safety management system. A barrier-based accident investigation still applies the SCAT model but now it is applied to each barrier separately, not to the incident as a whole. The BSCAT chart is the latest update of the SCAT approach. It includes all the historical occupational safety topics and underlying causes, but has added process risks to the list (e.g. fires and explosions) and in general more suitable to barrier analysis. The BSCAT software allows you to reuse and link existing risk assessment information (bowties) and do full integration of incident analysis and risk analysis. If applicable bowtie diagrams are available for use during your investigation, you can bring events and barriers from the bowtie directly into your BSCAT analysis. This results in a better fit between incident and risk assessment analysis, which in turn allows you to improve the risk assessment. The mismatch between risk analysis and incident analysis referred to above, is usually in the perspective/abstraction level of the defined barriers – barriers in incident analyses tend to be described too specifically, and there less ‘mappable’ onto the barriers in your risk assessments. By reusing the bowtie risk analysis and/or describing the barriers in your incident analyses at the same abstraction level, this gap is bridged and more value is extracted from your incident analyses. This entire process allows you to gauge barrier effectiveness and availability based on real-world information extracted from the incident analyses.
Page 16 of 49
4.1.2. BSCAT work process
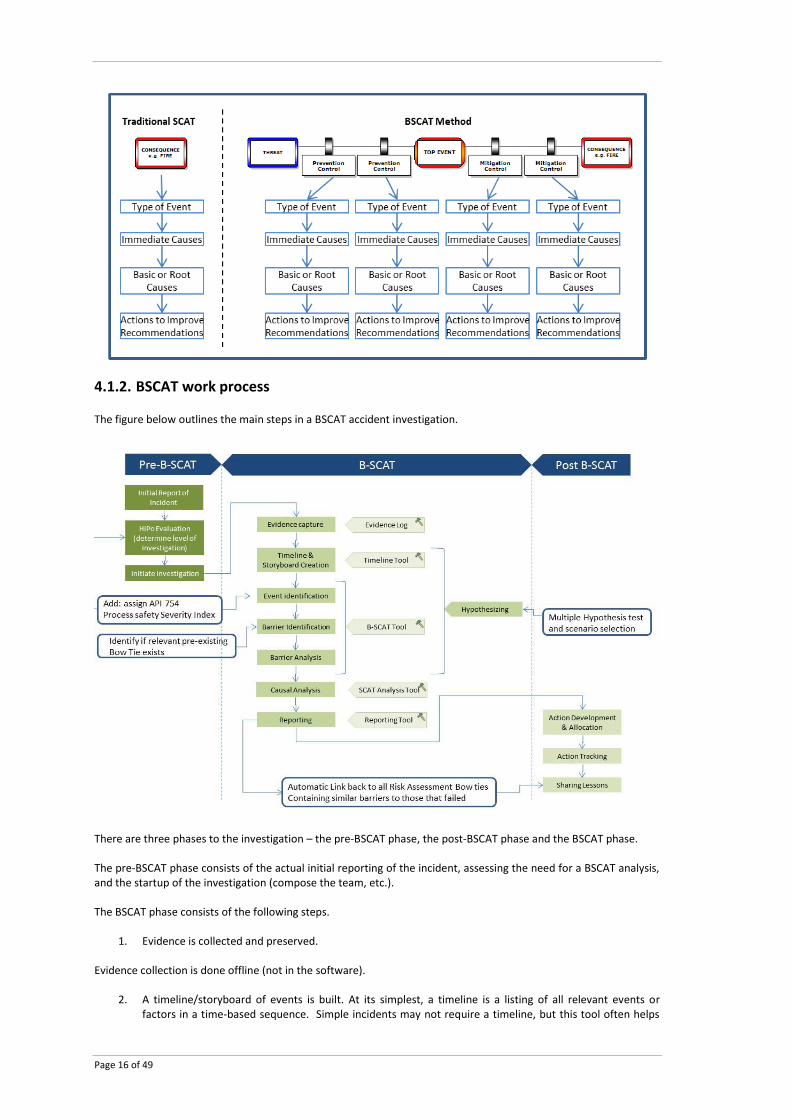
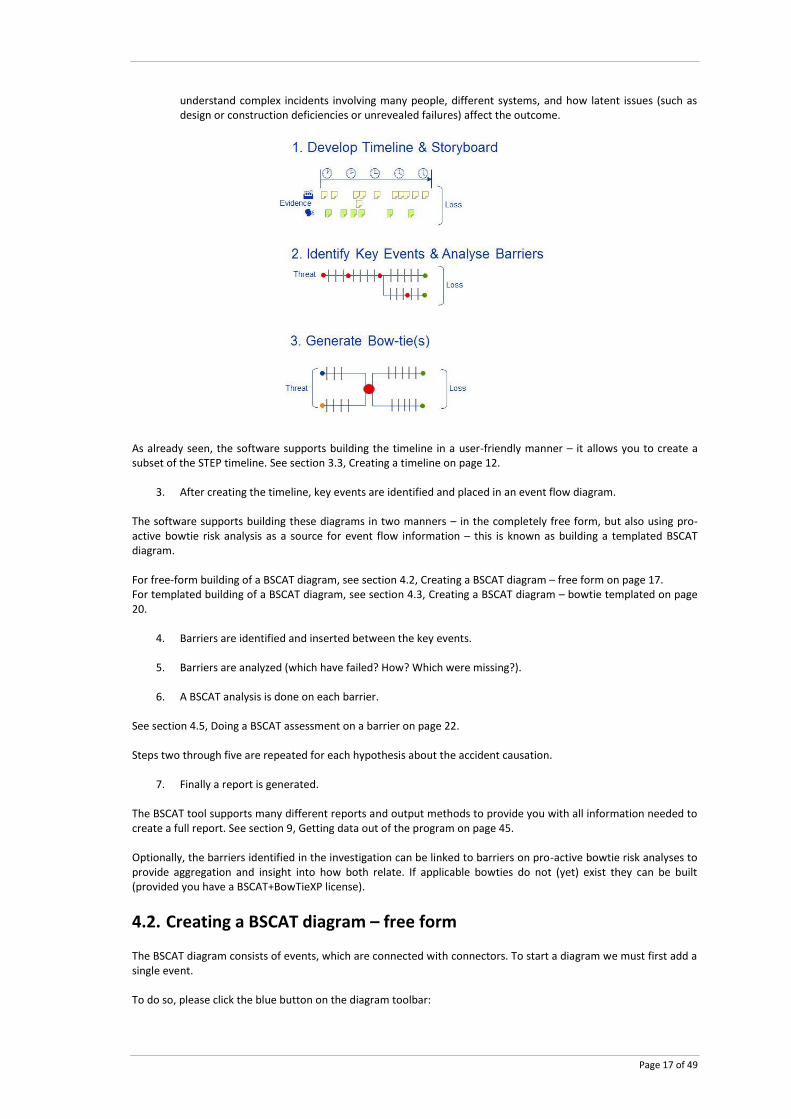
The figure below outlines the main steps in a BSCAT accident investigation.
There are three phases to the investigation – the pre-BSCAT phase, the post-BSCAT phase and the BSCAT phase. The pre-BSCAT phase consists of the actual initial reporting of the incident, assessing the need for a BSCAT analysis, and the startup of the investigation (compose the team, etc.). The BSCAT phase consists of the following steps.
1. Evidence is collected and preserved. Evidence collection is done offline (not in the software).
2. A timeline/storyboard of events is built. At its simplest, a timeline is a listing of all relevant events or factors in a time-based sequence. Simple incidents may not require a timeline, but this tool often helps
Page 17 of 49
understand complex incidents involving many people, different systems, and how latent issues (such as design or construction deficiencies or unrevealed failures) affect the outcome.
As already seen, the software supports building the timeline in a user-friendly manner – it allows you to create a subset of the STEP timeline. See section 3.3, Creating a timeline on page 12.
3. After creating the timeline, key events are identified and placed in an event flow diagram.
The software supports building these diagrams in two manners – in the completely free form, but also using pro-active bowtie risk analysis as a source for event flow information – this is known as building a templated BSCAT diagram. For free-form building of a BSCAT diagram, see section 4.2, Creating a BSCAT diagram – free form on page 17. For templated building of a BSCAT diagram, see section 4.3, Creating a BSCAT diagram – bowtie templated on page 20.
4. Barriers are identified and inserted between the key events.
5. Barriers are analyzed (which have failed? How? Which were missing?).
6. A BSCAT analysis is done on each barrier. See section 4.5, Doing a BSCAT assessment on a barrier on page 22. Steps two through five are repeated for each hypothesis about the accident causation.
7. Finally a report is generated. The BSCAT tool supports many different reports and output methods to provide you with all information needed to create a full report. See section 9, Getting data out of the program on page 45. Optionally, the barriers identified in the investigation can be linked to barriers on pro-active bowtie risk analyses to provide aggregation and insight into how both relate. If applicable bowties do not (yet) exist they can be built (provided you have a BSCAT+BowTieXP license).
4.2. Creating a BSCAT diagram – free form
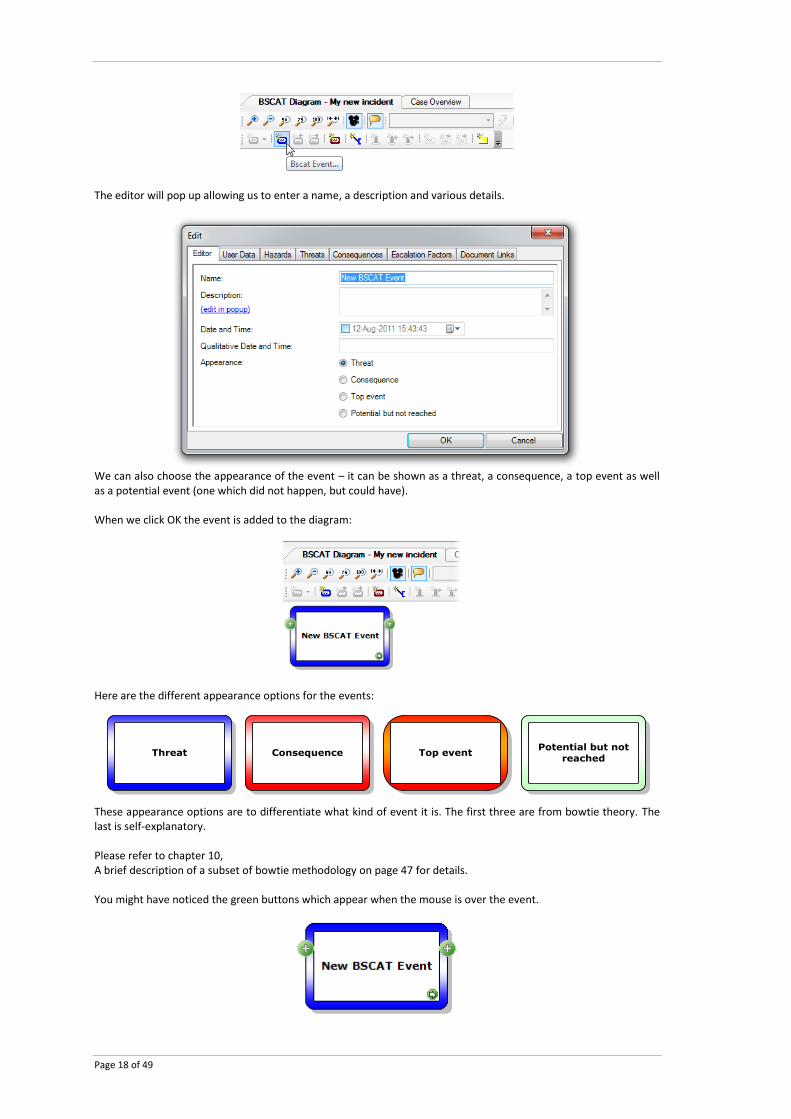
The BSCAT diagram consists of events, which are connected with connectors. To start a diagram we must first add a single event. To do so, please click the blue button on the diagram toolbar:
Page 18 of 49
The editor will pop up allowing us to enter a name, a description and various details.
We can also choose the appearance of the event – it can be shown as a threat, a consequence, a top event as well as a potential event (one which did not happen, but could have). When we click OK the event is added to the diagram:
Here are the different appearance options for the events:
These appearance options are to differentiate what kind of event it is. The first three are from bowtie theory. The last is self-explanatory. Please refer to chapter 10, A brief description of a subset of bowtie methodology on page 47 for details. You might have noticed the green buttons which appear when the mouse is over the event.
Page 19 of 49
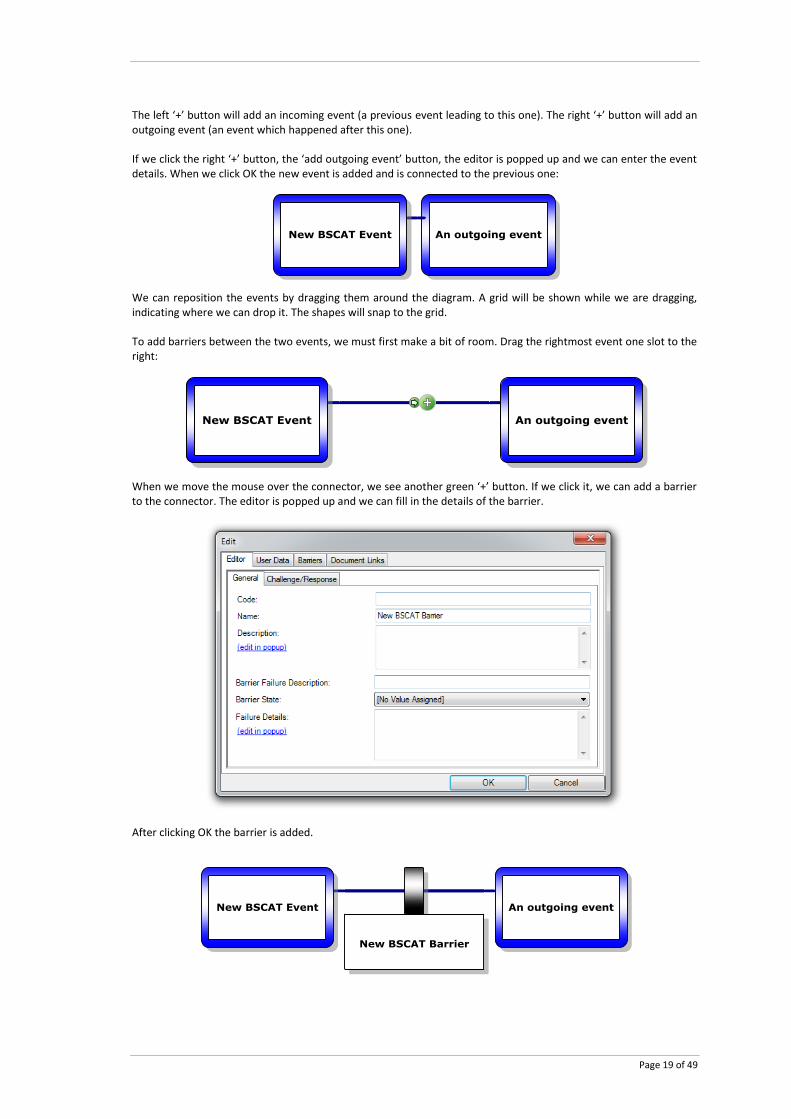
The left ‘+’ button will add an incoming event (a previous event leading to this one). The right ‘+’ button will add an outgoing event (an event which happened after this one). If we click the right ‘+’ button, the ‘add outgoing event’ button, the editor is popped up and we can enter the event details. When we click OK the new event is added and is connected to the previous one:
We can reposition the events by dragging them around the diagram. A grid will be shown while we are dragging, indicating where we can drop it. The shapes will snap to the grid. To add barriers between the two events, we must first make a bit of room. Drag the rightmost event one slot to the right:
When we move the mouse over the connector, we see another green ‘+’ button. If we click it, we can add a barrier to the connector. The editor is popped up and we can fill in the details of the barrier.
After clicking OK the barrier is added.
Page 20 of 49
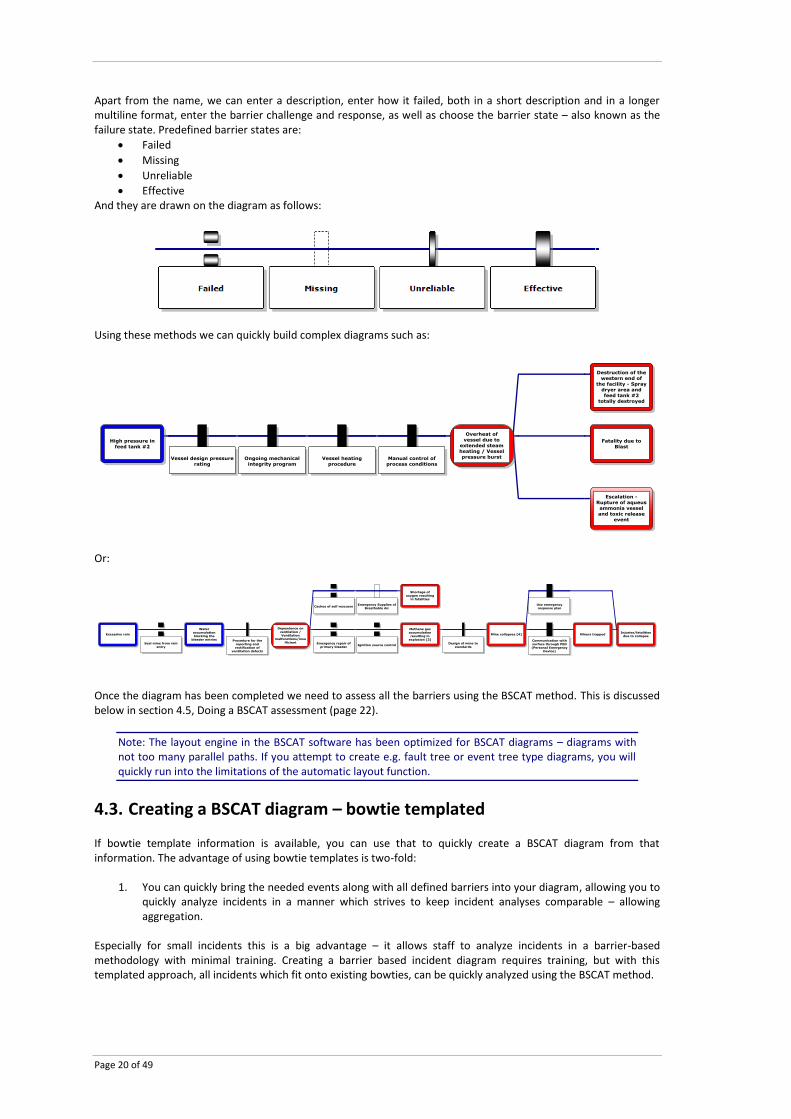
Apart from the name, we can enter a description, enter how it failed, both in a short description and in a longer multiline format, enter the barrier challenge and response, as well as choose the barrier state – also known as the failure state. Predefined barrier states are:
Failed
Missing
Unreliable
Effective And they are drawn on the diagram as follows:
Using these methods we can quickly build complex diagrams such as:
Or:
Once the diagram has been completed we need to assess all the barriers using the BSCAT method. This is discussed below in section 4.5, Doing a BSCAT assessment (page 22).
Note: The layout engine in the BSCAT software has been optimized for BSCAT diagrams – diagrams with not too many parallel paths. If you attempt to create e.g. fault tree or event tree type diagrams, you will quickly run into the limitations of the automatic layout function.
4.3. Creating a BSCAT diagram – bowtie templated
If bowtie template information is available, you can use that to quickly create a BSCAT diagram from that information. The advantage of using bowtie templates is two-fold:
1. You can quickly bring the needed events along with all defined barriers into your diagram, allowing you to quickly analyze incidents in a manner which strives to keep incident analyses comparable – allowing aggregation.
Especially for small incidents this is a big advantage – it allows staff to analyze incidents in a barrier-based methodology with minimal training. Creating a barrier based incident diagram requires training, but with this templated approach, all incidents which fit onto existing bowties, can be quickly analyzed using the BSCAT method.
Page 21 of 49
2. The link to your proactive risk assessment is automatically made, allowing you to analyze and improve the risk assessments, detect weak areas and improve your risk assessments.
Bringing all your incidents into a single BowTieXP case file allows you to visually see the weaker areas in your management system.
Note: To create templates with bowtie information in them, and to bring the incidents onto the bowties, you will need a BSCAT + BowTieXP license. For a quick reference on bowtie theory please refer to section 10, A brief description of a subset of bowtie methodology on page 47.
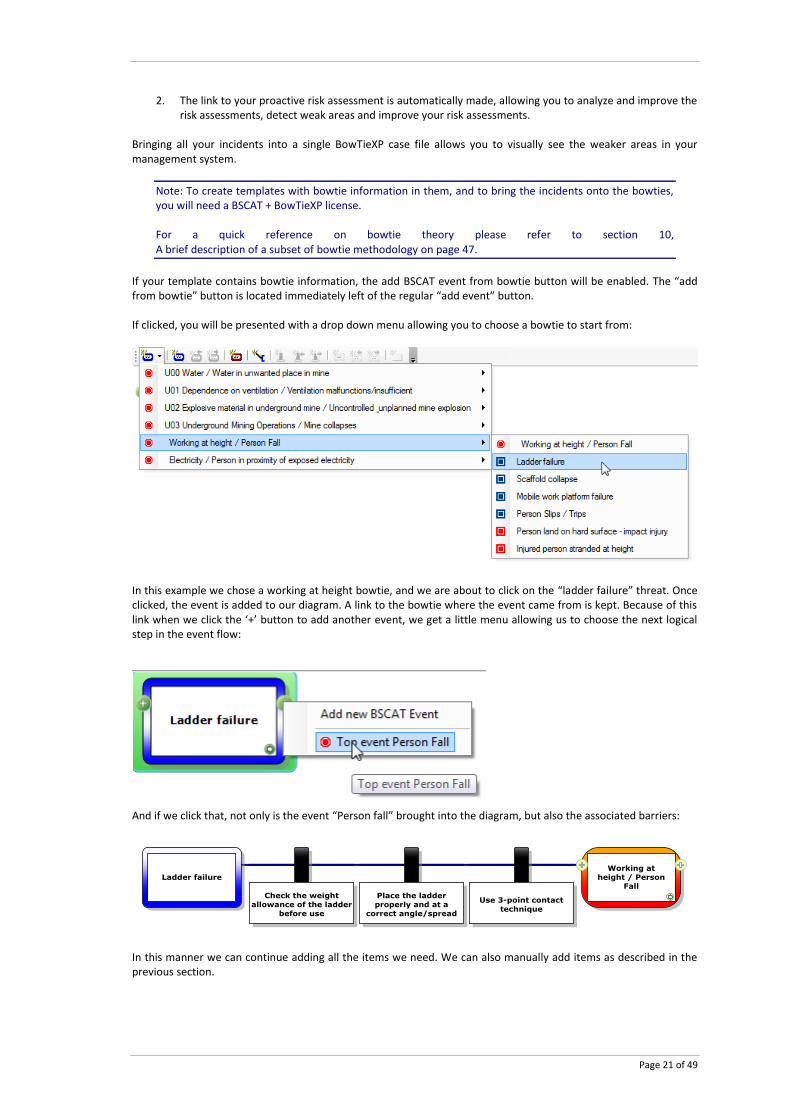
If your template contains bowtie information, the add BSCAT event from bowtie button will be enabled. The “add from bowtie” button is located immediately left of the regular “add event” button. If clicked, you will be presented with a drop down menu allowing you to choose a bowtie to start from:
In this example we chose a working at height bowtie, and we are about to click on the “ladder failure” threat. Once clicked, the event is added to our diagram. A link to the bowtie where the event came from is kept. Because of this link when we click the ‘+’ button to add another event, we get a little menu allowing us to choose the next logical step in the event flow:
And if we click that, not only is the event “Person fall” brought into the diagram, but also the associated barriers:
In this manner we can continue adding all the items we need. We can also manually add items as described in the previous section.
Page 22 of 49
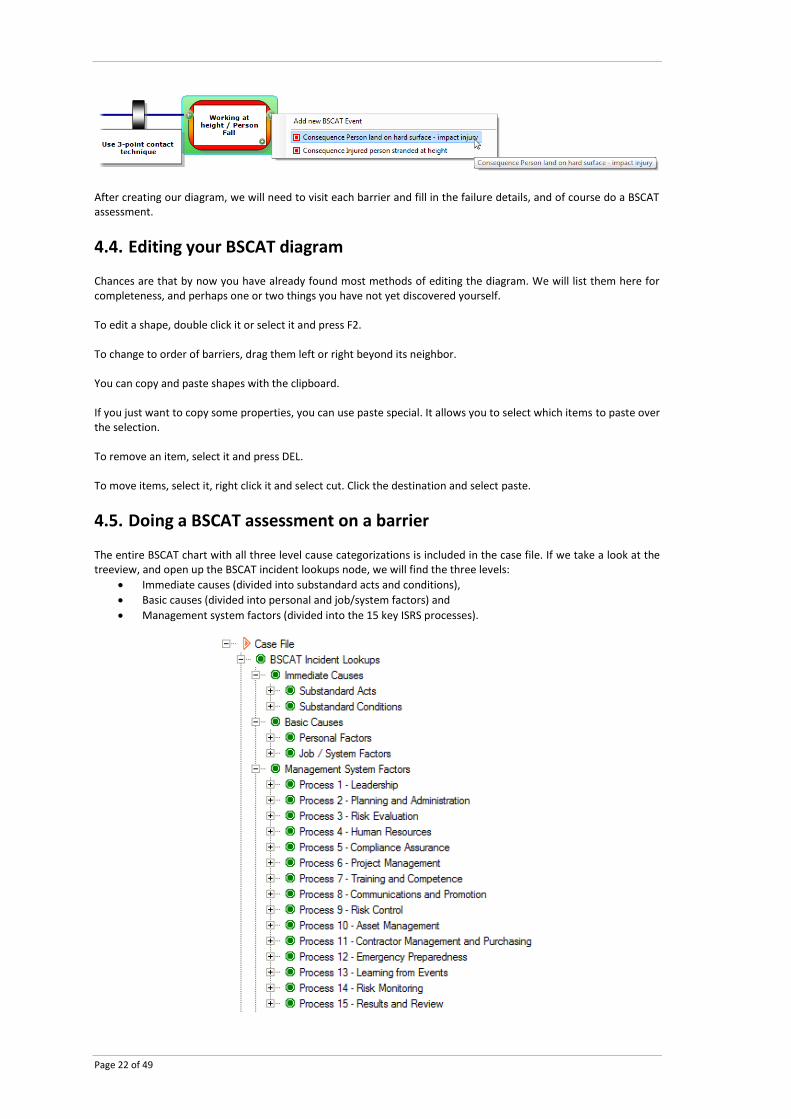
After creating our diagram, we will need to visit each barrier and fill in the failure details, and of course do a BSCAT assessment.
4.4. Editing your BSCAT diagram
Chances are that by now you have already found most methods of editing the diagram. We will list them here for completeness, and perhaps one or two things you have not yet discovered yourself. To edit a shape, double click it or select it and press F2. To change to order of barriers, drag them left or right beyond its neighbor. You can copy and paste shapes with the clipboard. If you just want to copy some properties, you can use paste special. It allows you to select which items to paste over the selection. To remove an item, select it and press DEL. To move items, select it, right click it and select cut. Click the destination and select paste.
4.5. Doing a BSCAT assessment on a barrier
The entire BSCAT chart with all three level cause categorizations is included in the case file. If we take a look at the treeview, and open up the BSCAT incident lookups node, we will find the three levels:
Immediate causes (divided into substandard acts and conditions),
Basic causes (divided into personal and job/system factors) and
Management system factors (divided into the 15 key ISRS processes).
Page 23 of 49
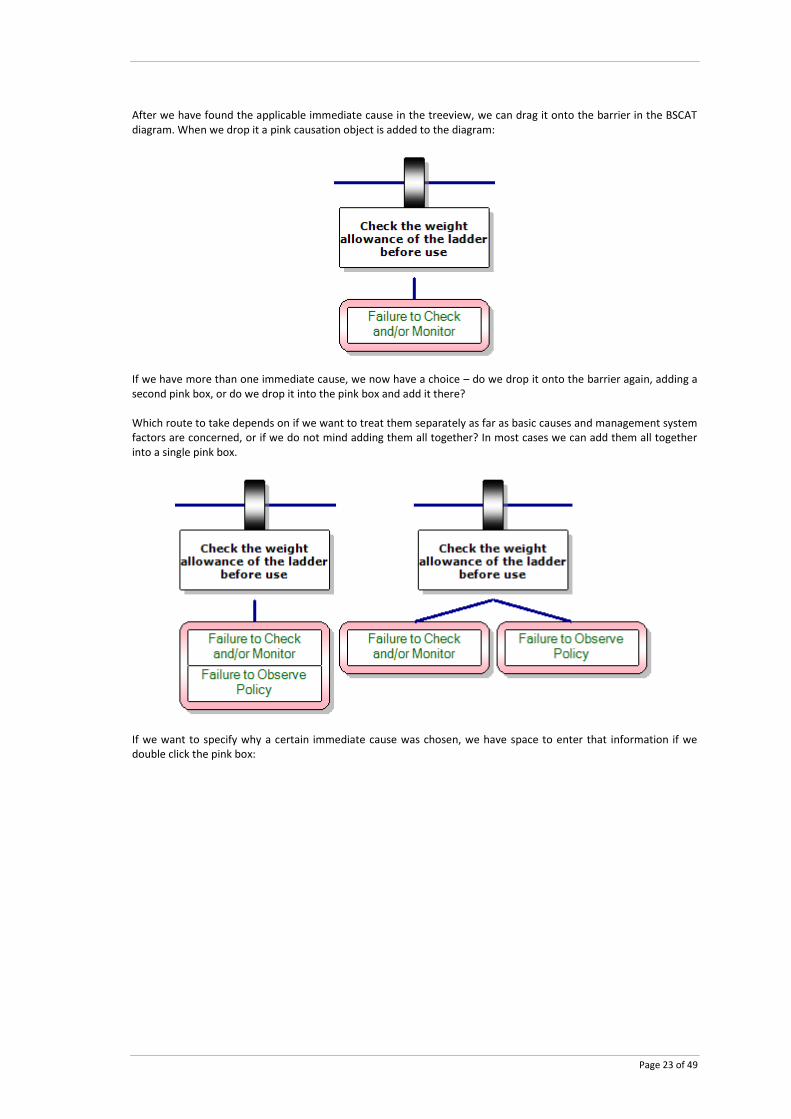
After we have found the applicable immediate cause in the treeview, we can drag it onto the barrier in the BSCAT diagram. When we drop it a pink causation object is added to the diagram:
If we have more than one immediate cause, we now have a choice – do we drop it onto the barrier again, adding a second pink box, or do we drop it into the pink box and add it there? Which route to take depends on if we want to treat them separately as far as basic causes and management system factors are concerned, or if we do not mind adding them all together? In most cases we can add them all together into a single pink box.
If we want to specify why a certain immediate cause was chosen, we have space to enter that information if we double click the pink box:
Page 24 of 49
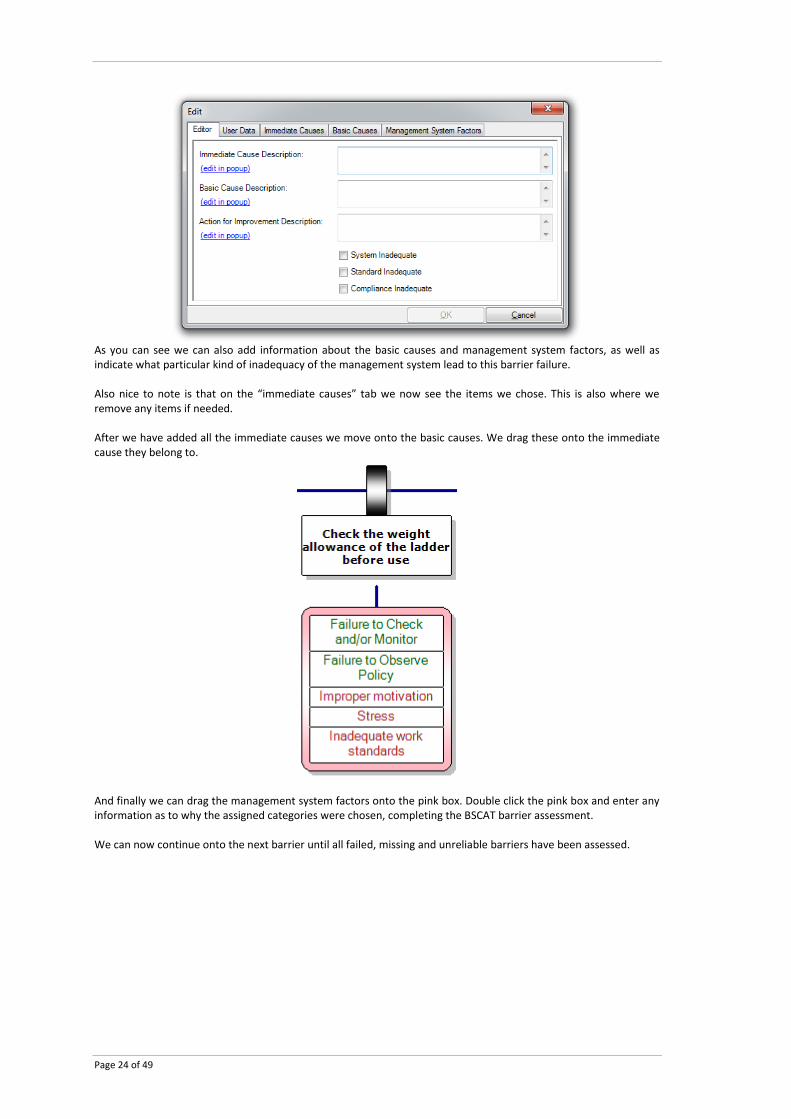
As you can see we can also add information about the basic causes and management system factors, as well as indicate what particular kind of inadequacy of the management system lead to this barrier failure. Also nice to note is that on the “immediate causes” tab we now see the items we chose. This is also where we remove any items if needed. After we have added all the immediate causes we move onto the basic causes. We drag these onto the immediate cause they belong to.
And finally we can drag the management system factors onto the pink box. Double click the pink box and enter any information as to why the assigned categories were chosen, completing the BSCAT barrier assessment. We can now continue onto the next barrier until all failed, missing and unreliable barriers have been assessed.
Page 25 of 49
5 Tripod Beta
5.1. A brief description of Tripod Beta methodology
Note: Refer to Stichting Tripod Foundation’s Tripod Beta User Guide for more thorough elaboration.
5.1.1. Introduction
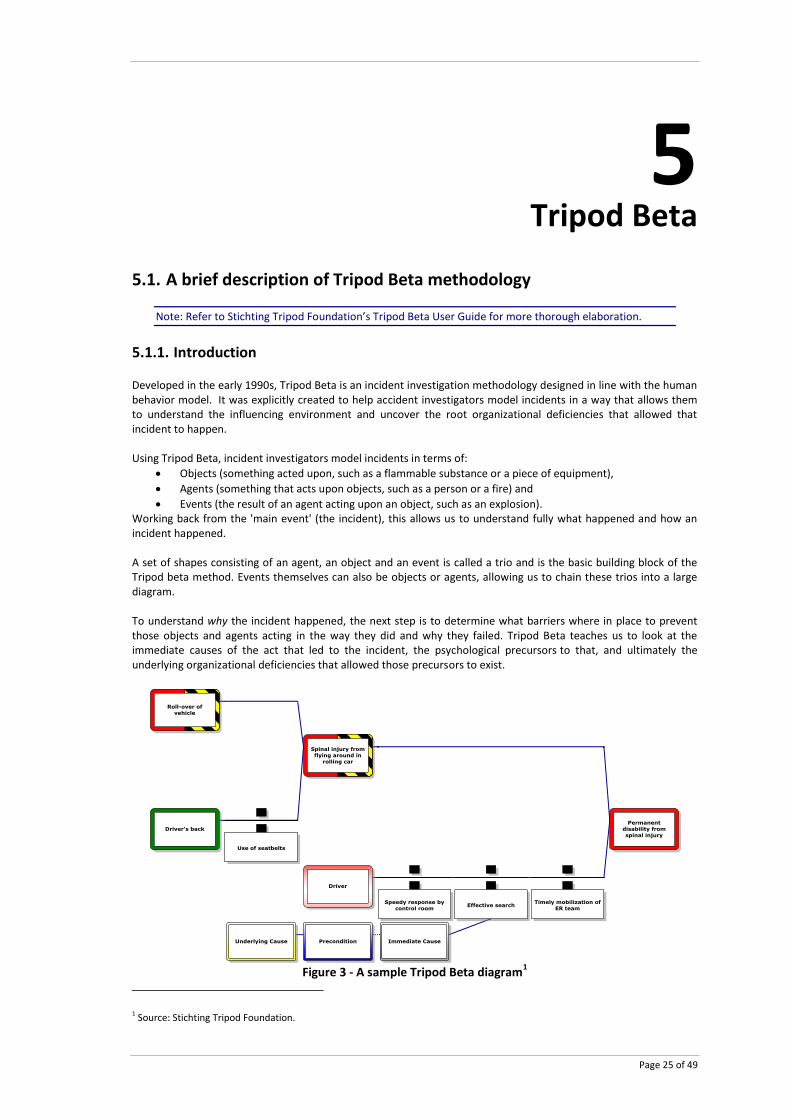
Developed in the early 1990s, Tripod Beta is an incident investigation methodology designed in line with the human behavior model. It was explicitly created to help accident investigators model incidents in a way that allows them to understand the influencing environment and uncover the root organizational deficiencies that allowed that incident to happen. Using Tripod Beta, incident investigators model incidents in terms of:
Objects (something acted upon, such as a flammable substance or a piece of equipment),
Agents (something that acts upon objects, such as a person or a fire) and
Events (the result of an agent acting upon an object, such as an explosion). Working back from the 'main event' (the incident), this allows us to understand fully what happened and how an incident happened. A set of shapes consisting of an agent, an object and an event is called a trio and is the basic building block of the Tripod beta method. Events themselves can also be objects or agents, allowing us to chain these trios into a large diagram. To understand why the incident happened, the next step is to determine what barriers where in place to prevent those objects and agents acting in the way they did and why they failed. Tripod Beta teaches us to look at the immediate causes of the act that led to the incident, the psychological precursors to that, and ultimately the underlying organizational deficiencies that allowed those precursors to exist.
Figure 3 - A sample Tripod Beta diagram
1
1 Source: Stichting Tripod Foundation.
Page 26 of 49
The IncidentXP software allows you to reuse and link existing risk assessment information (bowties) and do full integration of incident analysis and risk analysis. If applicable bowtie diagrams are available for use during your investigation, you can bring events and barriers from the bowtie directly into your Tripod Beta analysis. This results in a better fit between incident and risk assessment analysis, which in turn allows you to improve the risk assessment. There exists a mismatch between risk analysis and incident analysis in the perspective / abstraction level of the defined barriers. Barriers in incident analyses tend to be described more specific than those in risk analysis – those tend to be defined more abstract, high-level. Because of this abstraction level difference, sometimes mapping the barriers from a Tripod Beta incident onto a bowtie can be challenging. By reusing the bowtie risk analysis and/or describing the barriers in your incident analyses at the same abstraction level, this gap is bridged and more value is extracted from your incident analyses. This might however make your incident analysis less useful; this depends on the exact goals of the analysis. But having the risk assessment on hand in similar metaphors can only be beneficial. This entire process allows you to gauge barrier effectiveness and availability based on real-world information extracted from the incident analyses.
5.1.2. Tripod Beta analysis
Doing Tripod Beta analysis consists of the following steps.
1. Evidence is collected and preserved. Evidence collection is done offline (not in the software).
2. A timeline/storyboard of events is built. At its simplest, a timeline is a listing of all relevant events or factors in a time-based sequence. Simple incidents may not require a timeline, but this tool often helps understand complex incidents involving many people, different systems, and how latent issues (such as design or construction deficiencies or unrevealed failures) affect the outcome.
As already seen, the software supports building the timeline in a user-friendly manner – it allows you to create a subset of the STEP timeline. See section 3.3, Creating a timeline on page 12.
3. After creating the timeline, the trio’s (agent, object, and event) are identified and linked to each other creating an event flow diagram. Linking an event to an agent results in a combined node called ‘event-agent’. Linking an event to an object results in a combined node called ‘event-object’.
The software supports building these diagrams in two manners – in the completely free form, but also using pro-active bowtie risk analysis as a source for event flow information – this is known as building a templated Tripod Beta diagram. For free-form building of a Tripod Beta diagram, see section 5.2, Creating a Tripod Beta diagram – Free form on page 27. For templated building of a Tripod Beta diagram, see section 5.3, Creating a Tripod Beta diagram – Bowtie templated on page 30.
4. Barriers are identified and inserted between the key events.
5. Barriers are analyzed (which have failed? How? Which were missing?).
6. A Tripod Beta assessment is done on each barrier. See section 5.5, Doing a Tripod Beta assessment on the barrier on page 32.
7. Finally a report is generated. The Tripod Beta tool supports many different reports and output methods to provide you with all information needed to create a full report. See section 9, Getting data out of the program on page 45.
Page 27 of 49
Optionally, the barriers identified in the investigation can be linked to barriers on pro-active bowtie risk analyses to provide aggregation and insight into how both relate. If applicable bowties do not (yet) exist they can be built (provided you have a Tripod IncidentXP + BowTieXP license).
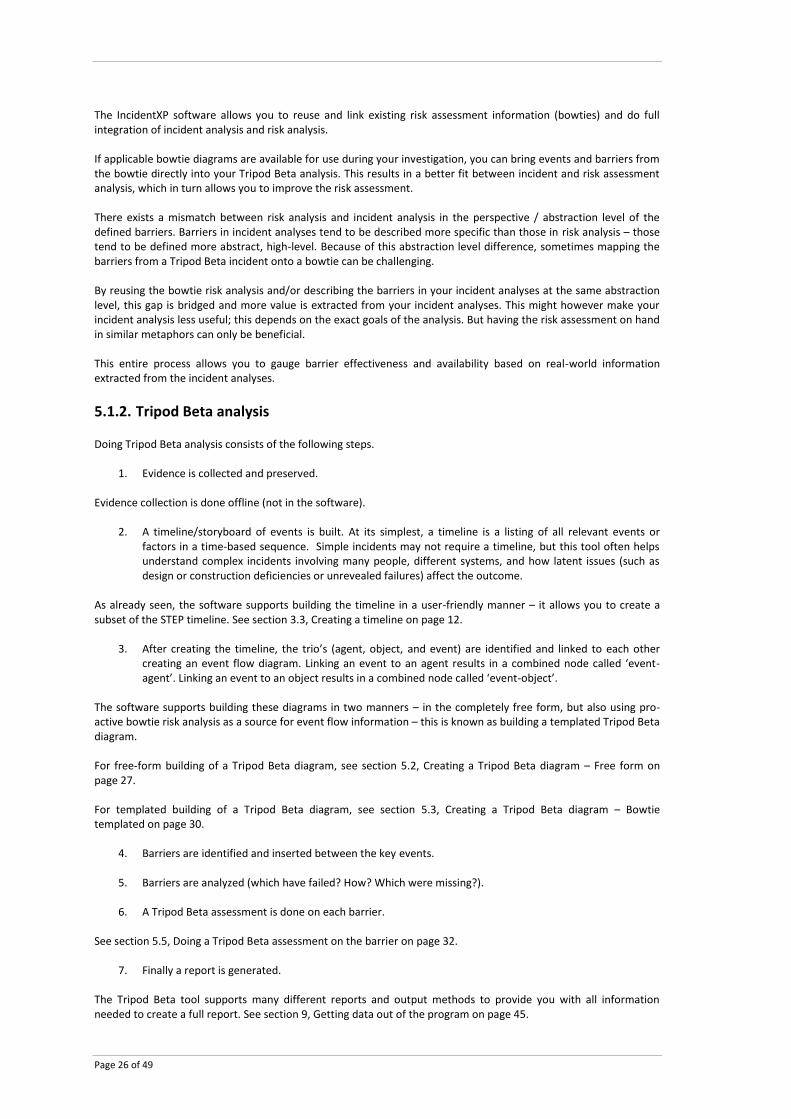
5.2. Creating a Tripod Beta diagram – Free form
The Tripod Beta diagram consists of events (boxes) which are connected with connectors. To start a diagram we must first add a single event. To do so, please click the blue button on the diagram toolbar:
The editor will pop up allowing us to enter a name, a description and various details.
We can also choose the appearance of the event – it can be shown as a Tripod Beta shape:
Agent,
Object,
Event,
Event - agent, and
Event - object Or as a bowtie shape:
Threat,
Consequence,
Top event, and
Potential event - one which did not happen, but could have. When we click OK the event is added to the diagram:
Page 28 of 49
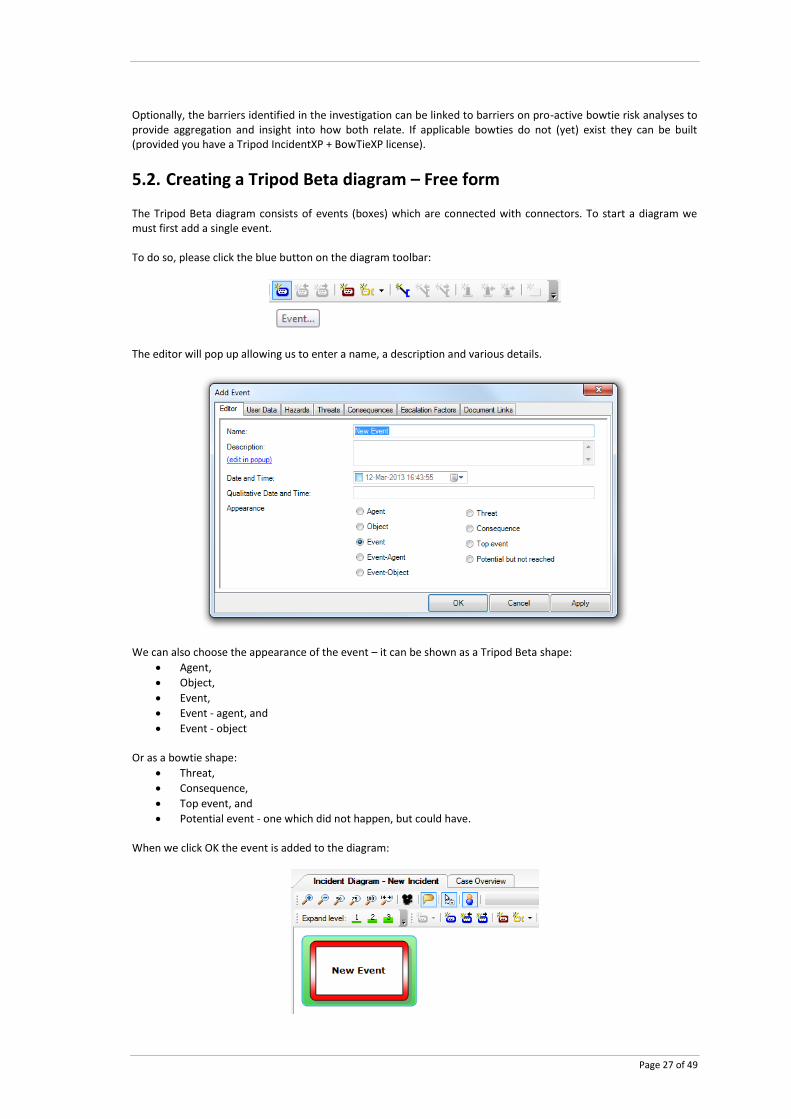
Here are the different Tripod Beta appearance options for the event:
Here are the different bowtie appearance options for the events:
These appearance options are to differentiate what kind of event it is. Please refer to chapter 10, A brief description of a subset of bowtie methodology on page 47 for details. You might have noticed the green buttons which appear when the mouse is over the event.
The left ‘+’ button will add an incoming event (a previous event leading to this one). The right ‘+’ button will add an outgoing event (an event which happened after this one). If we click the right ‘+’ button, the ‘add outgoing event’ button, the editor is popped up and we can enter the event details. When we click OK the new event is added and is connected to the previous one:
We can reposition the events by dragging them around the diagram. A grid will be shown while we are dragging, indicating where we can drop it. The shapes will snap to the grid. To add barriers between the two events, we must first make a bit of room. Drag the rightmost event (at least one slot) to the right:
When we move the mouse over the connector, we see another green ‘+’ button. If we click it, we can add a barrier to the connector. The editor is popped up and we can fill in the details of the barrier.
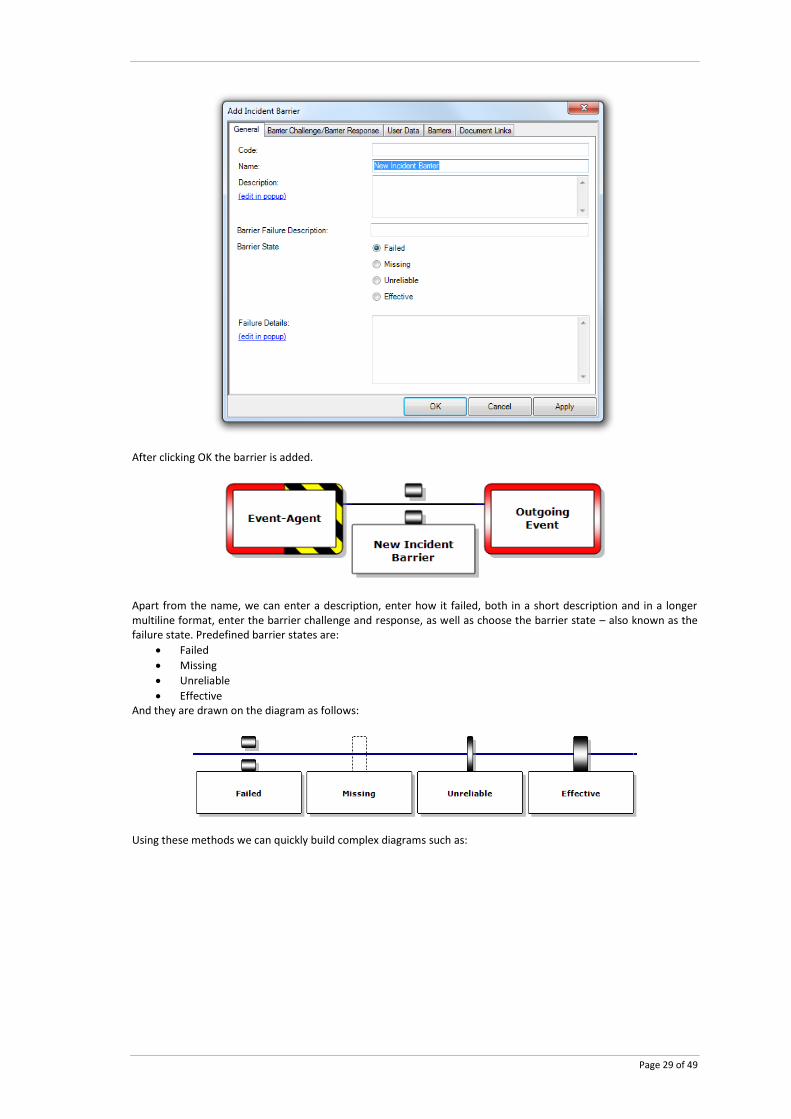
Page 29 of 49
After clicking OK the barrier is added.
Apart from the name, we can enter a description, enter how it failed, both in a short description and in a longer multiline format, enter the barrier challenge and response, as well as choose the barrier state – also known as the failure state. Predefined barrier states are:
Failed
Missing
Unreliable
Effective And they are drawn on the diagram as follows:
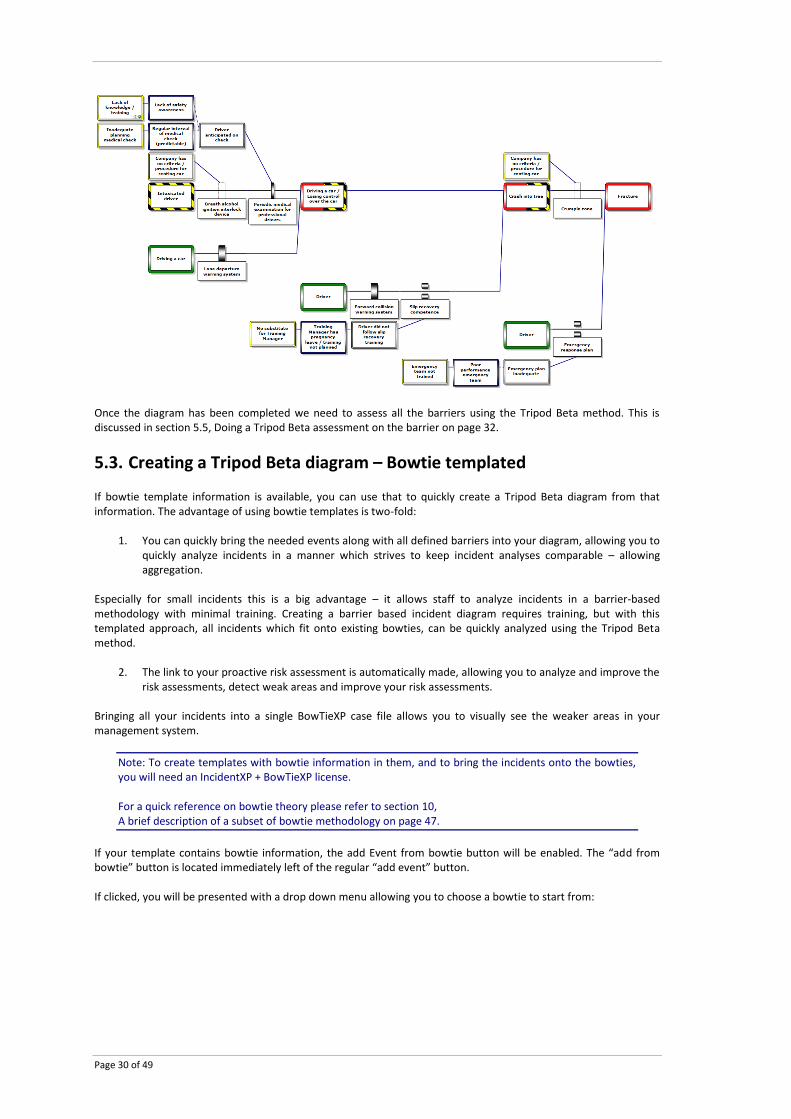
Using these methods we can quickly build complex diagrams such as:
Page 30 of 49
Once the diagram has been completed we need to assess all the barriers using the Tripod Beta method. This is discussed in section 5.5, Doing a Tripod Beta assessment on the barrier on page 32.
5.3. Creating a Tripod Beta diagram – Bowtie templated
If bowtie template information is available, you can use that to quickly create a Tripod Beta diagram from that information. The advantage of using bowtie templates is two-fold:
1. You can quickly bring the needed events along with all defined barriers into your diagram, allowing you to quickly analyze incidents in a manner which strives to keep incident analyses comparable – allowing aggregation.
Especially for small incidents this is a big advantage – it allows staff to analyze incidents in a barrier-based methodology with minimal training. Creating a barrier based incident diagram requires training, but with this templated approach, all incidents which fit onto existing bowties, can be quickly analyzed using the Tripod Beta method.
2. The link to your proactive risk assessment is automatically made, allowing you to analyze and improve the risk assessments, detect weak areas and improve your risk assessments.
Bringing all your incidents into a single BowTieXP case file allows you to visually see the weaker areas in your management system.
Note: To create templates with bowtie information in them, and to bring the incidents onto the bowties, you will need an IncidentXP + BowTieXP license. For a quick reference on bowtie theory please refer to section 10, A brief description of a subset of bowtie methodology on page 47.
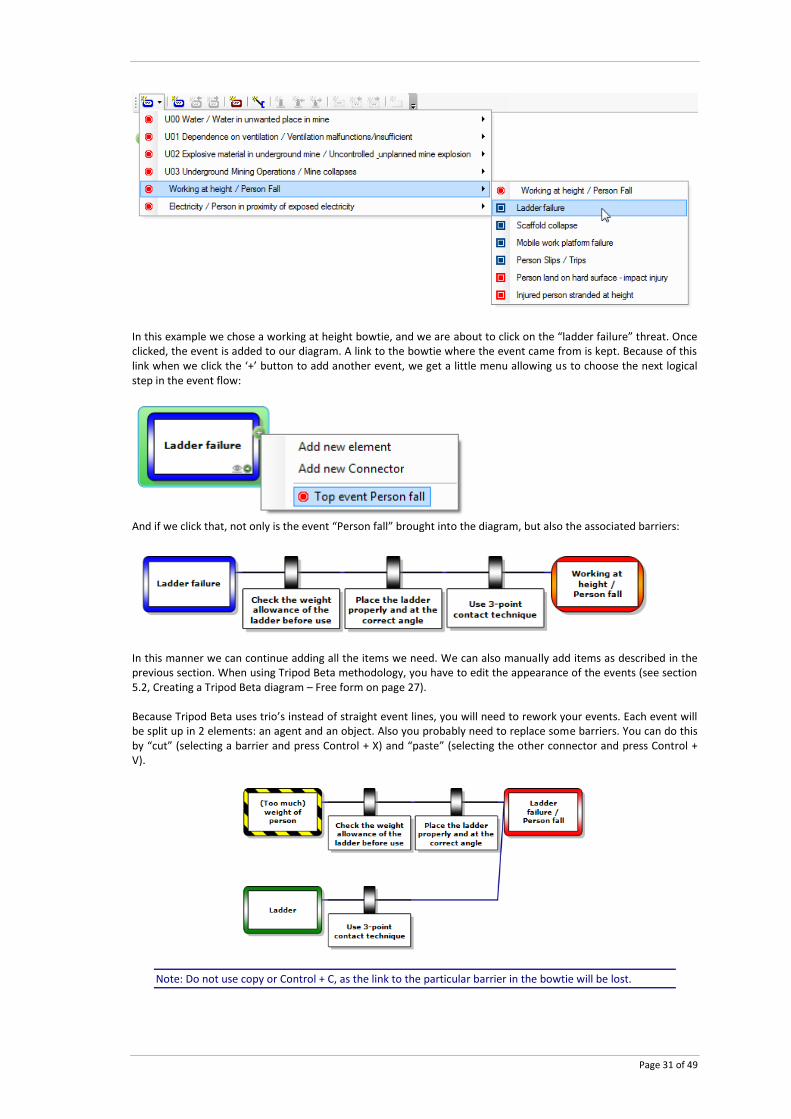
If your template contains bowtie information, the add Event from bowtie button will be enabled. The “add from bowtie” button is located immediately left of the regular “add event” button. If clicked, you will be presented with a drop down menu allowing you to choose a bowtie to start from:
Page 31 of 49
In this example we chose a working at height bowtie, and we are about to click on the “ladder failure” threat. Once clicked, the event is added to our diagram. A link to the bowtie where the event came from is kept. Because of this link when we click the ‘+’ button to add another event, we get a little menu allowing us to choose the next logical step in the event flow:
And if we click that, not only is the event “Person fall” brought into the diagram, but also the associated barriers:
In this manner we can continue adding all the items we need. We can also manually add items as described in the previous section. When using Tripod Beta methodology, you have to edit the appearance of the events (see section 5.2, Creating a Tripod Beta diagram – Free form on page 27). Because Tripod Beta uses trio’s instead of straight event lines, you will need to rework your events. Each event will be split up in 2 elements: an agent and an object. Also you probably need to replace some barriers. You can do this by “cut” (selecting a barrier and press Control + X) and “paste” (selecting the other connector and press Control + V).
Note: Do not use copy or Control + C, as the link to the particular barrier in the bowtie will be lost.
Page 32 of 49
After creating our diagram, we will need to visit each barrier and fill in the failure details, and of course do a BSCAT assessment.
5.4. Editing your Tripod Beta diagram
Chances are that by now you have already found most ways in which you can edit the diagram. We will list them here for completeness, and perhaps one or two things you have not yet discovered yourself. To edit a shape, double click it or select it and press F2. To change to order of barriers, drag them left or right beyond its neighbor. You can use cut, copy and paste shapes with the clipboard. If you just want to copy some properties, you can use paste special. It allows you to select which items to paste over the selection. To remove an item, select it and press DEL. To move items, select it, right click it and select cut. Click the destination and select paste.
5.5. Doing a Tripod Beta assessment on the barrier
As mentioned earlier, Tripod Beta uses three levels of causation:
Immediate causes,
Preconditions, and
Underlying causes.
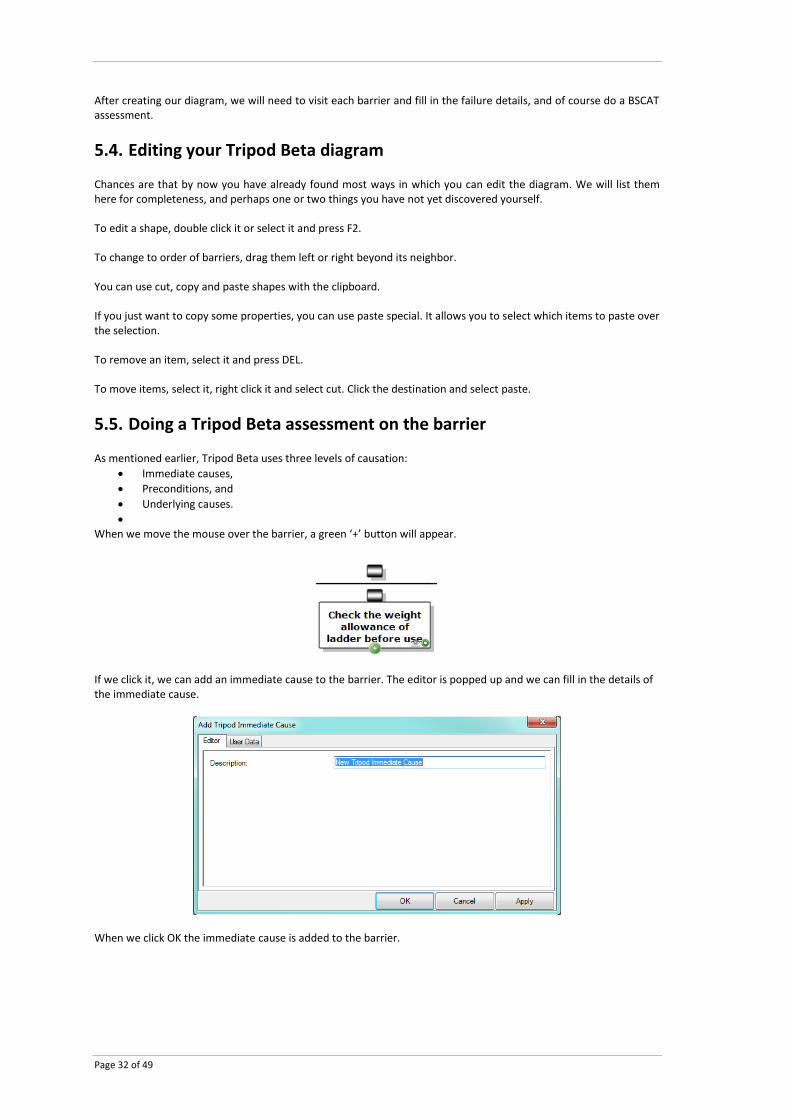
When we move the mouse over the barrier, a green ‘+’ button will appear.
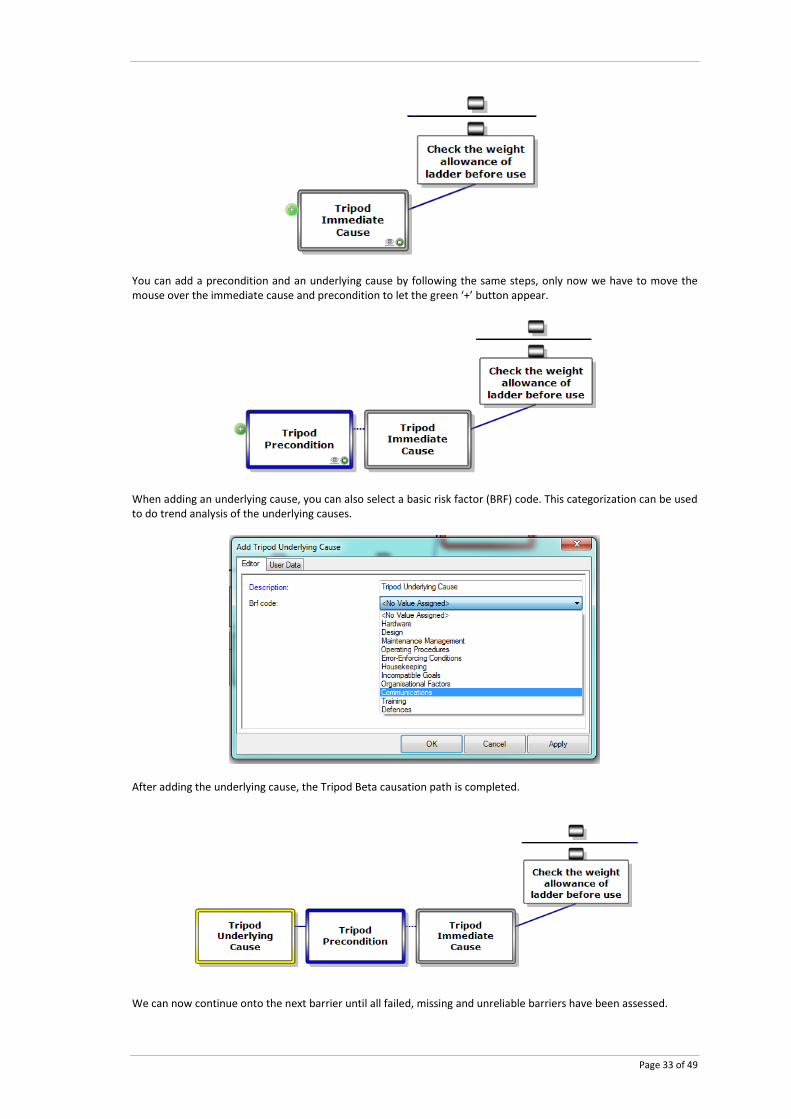
If we click it, we can add an immediate cause to the barrier. The editor is popped up and we can fill in the details of the immediate cause.
When we click OK the immediate cause is added to the barrier.
Page 33 of 49
You can add a precondition and an underlying cause by following the same steps, only now we have to move the mouse over the immediate cause and precondition to let the green ‘+’ button appear.
When adding an underlying cause, you can also select a basic risk factor (BRF) code. This categorization can be used to do trend analysis of the underlying causes.
After adding the underlying cause, the Tripod Beta causation path is completed.
We can now continue onto the next barrier until all failed, missing and unreliable barriers have been assessed.

Page 34 of 49
Note: Missing barriers only have underlying causes, no preconditions and no immediate causes.
Missing barriers have no immediate cause or precondition as per Tripod Beta theory. Missing barriers are barriers which were never implemented. Therefore there is no direct action which led to the barrier failing – it never existed. Also because of this, there is also no precondition (psychological precursor). What is present on missing barriers is the underlying cause – at organizational level we can still identify why the barrier was never implemented.
Note: IncidentXP supports categorizing your immediate causes, preconditions and underlying causes. The list of categories is defined centrally in the case file in the lookup tables node.
Page 35 of 49
6 Configuring the diagram
In this chapter we explore how to configure the diagram appearance.
IncidentXP has a diagram which is configurable in many ways – there are loads of options to tailor the display to your needs. You can apply various colors and show all kinds of extra information. This chapter will explain all the various settings. Due to the large amount of settings, you can also configure those into profiles, allowing you to quickly switch between predefined settings (advanced only).
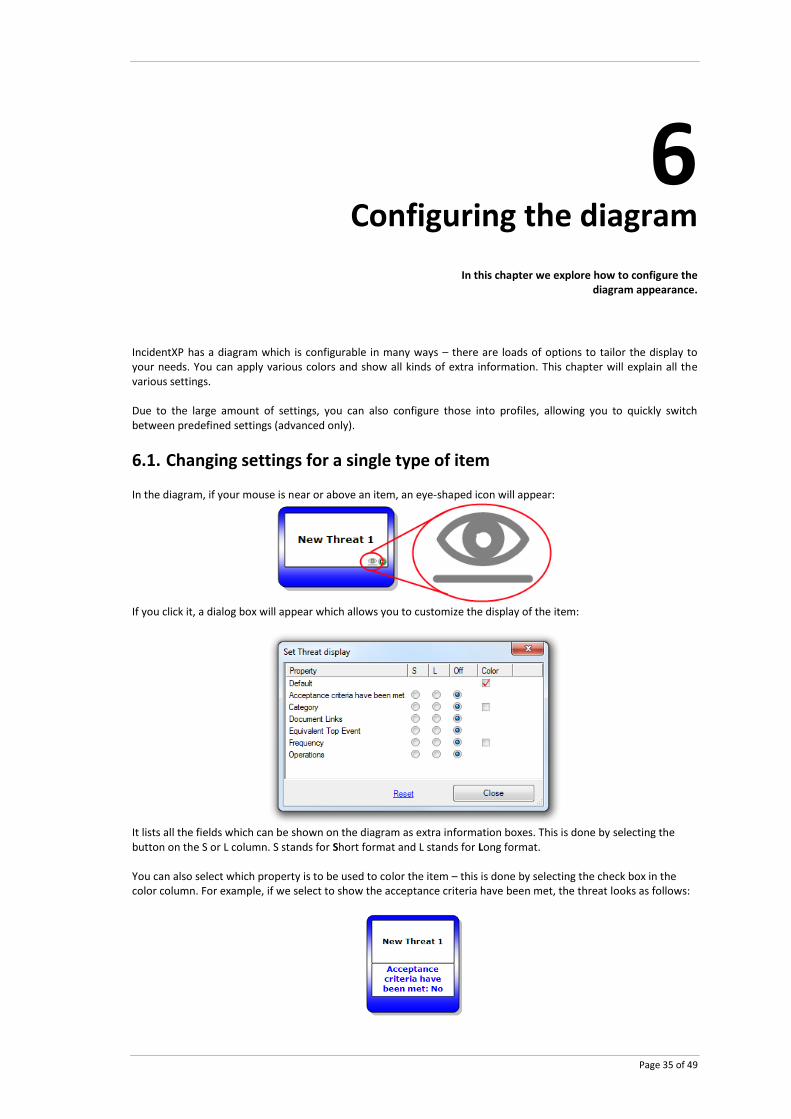
6.1. Changing settings for a single type of item
In the diagram, if your mouse is near or above an item, an eye-shaped icon will appear:
If you click it, a dialog box will appear which allows you to customize the display of the item:
It lists all the fields which can be shown on the diagram as extra information boxes. This is done by selecting the button on the S or L column. S stands for Short format and L stands for Long format. You can also select which property is to be used to color the item – this is done by selecting the check box in the color column. For example, if we select to show the acceptance criteria have been met, the threat looks as follows:
Page 36 of 49
You can adjust the display for all items on the diagram. If you need to configure more than one item, you can also use the large diagram display options dialog, discussed in the next section.
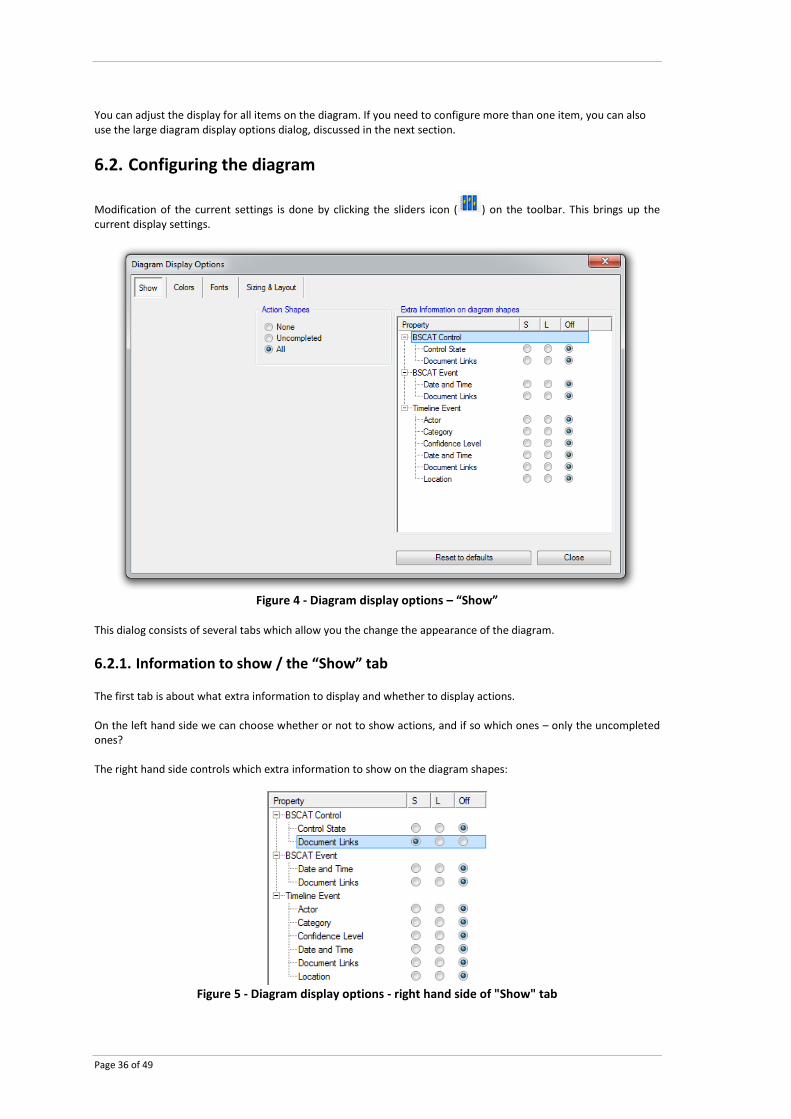
6.2. Configuring the diagram
Modification of the current settings is done by clicking the sliders icon ( ) on the toolbar. This brings up the current display settings.
Figure 4 - Diagram display options – “Show”
This dialog consists of several tabs which allow you the change the appearance of the diagram.
6.2.1. Information to show / the “Show” tab
The first tab is about what extra information to display and whether to display actions. On the left hand side we can choose whether or not to show actions, and if so which ones – only the uncompleted ones? The right hand side controls which extra information to show on the diagram shapes:
Figure 5 - Diagram display options - right hand side of "Show" tab
Page 37 of 49
For each bit of information present on an item there are three options:
S for Short format
L for Long format
Off to not display the information
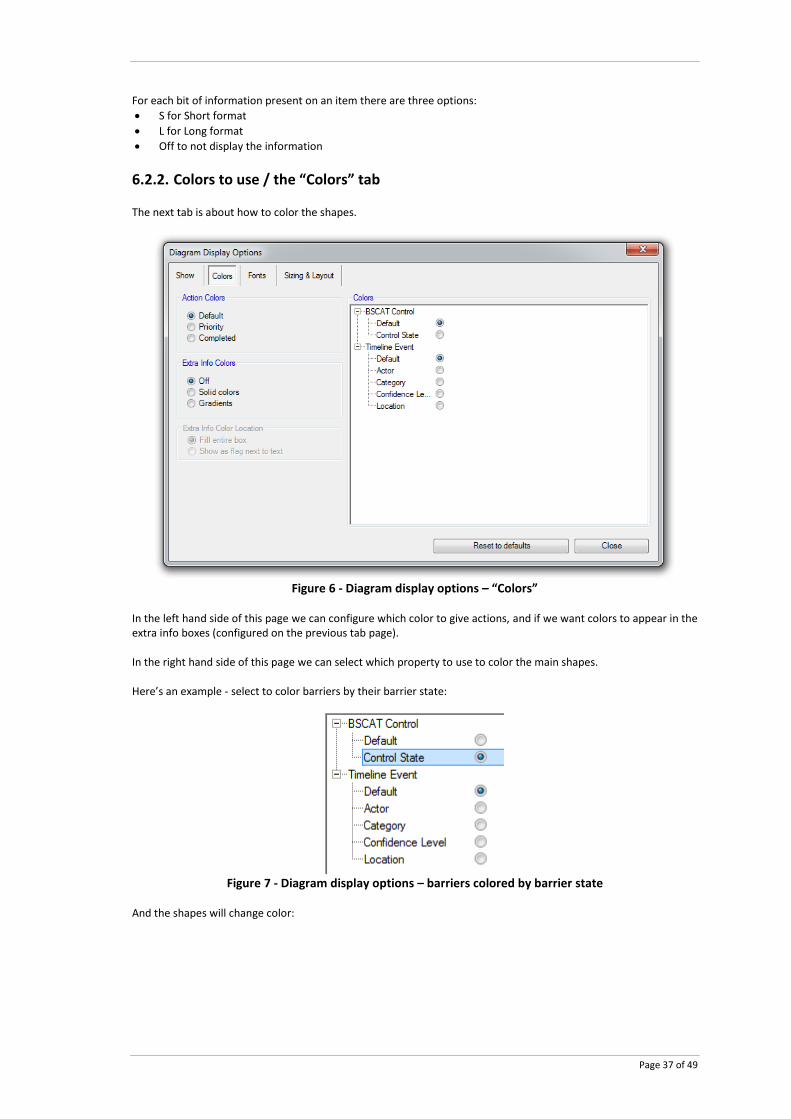
6.2.2. Colors to use / the “Colors” tab
The next tab is about how to color the shapes.
Figure 6 - Diagram display options – “Colors”
In the left hand side of this page we can configure which color to give actions, and if we want colors to appear in the extra info boxes (configured on the previous tab page). In the right hand side of this page we can select which property to use to color the main shapes. Here’s an example - select to color barriers by their barrier state:
Figure 7 - Diagram display options – barriers colored by barrier state
And the shapes will change color:
Page 38 of 49
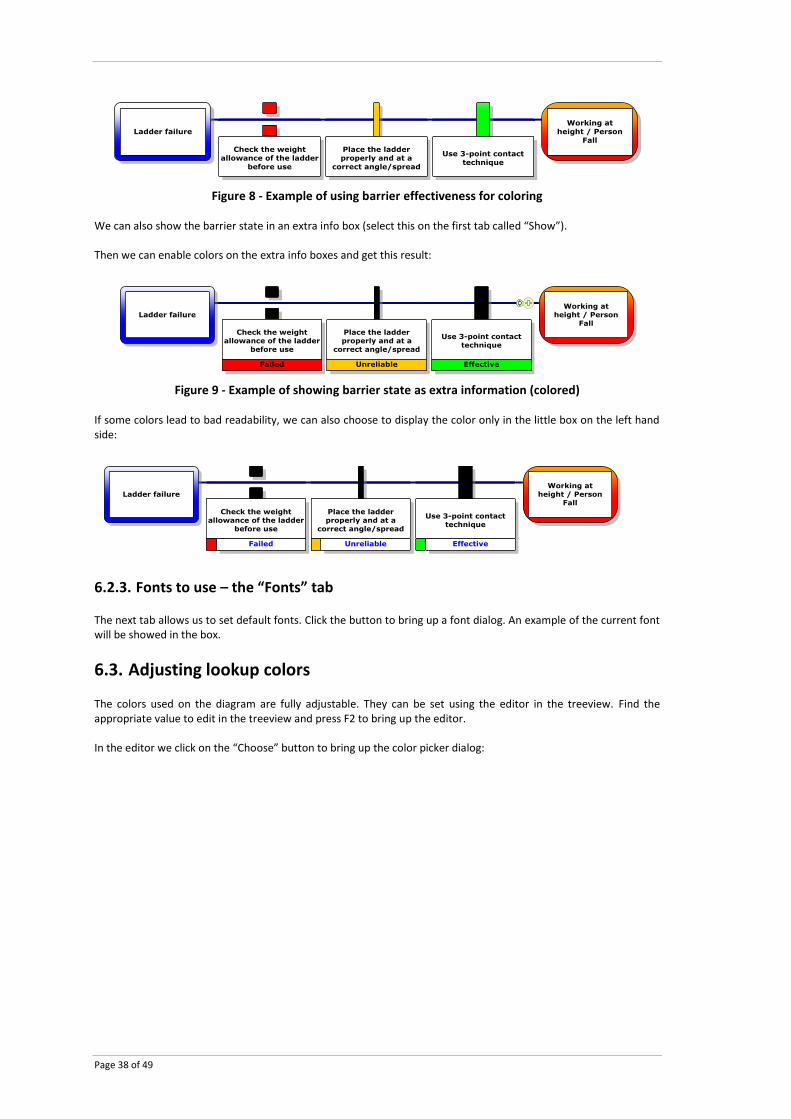
Figure 8 - Example of using barrier effectiveness for coloring
We can also show the barrier state in an extra info box (select this on the first tab called “Show”). Then we can enable colors on the extra info boxes and get this result:
Figure 9 - Example of showing barrier state as extra information (colored)
If some colors lead to bad readability, we can also choose to display the color only in the little box on the left hand side:
6.2.3. Fonts to use – the “Fonts” tab
The next tab allows us to set default fonts. Click the button to bring up a font dialog. An example of the current font will be showed in the box.
6.3. Adjusting lookup colors
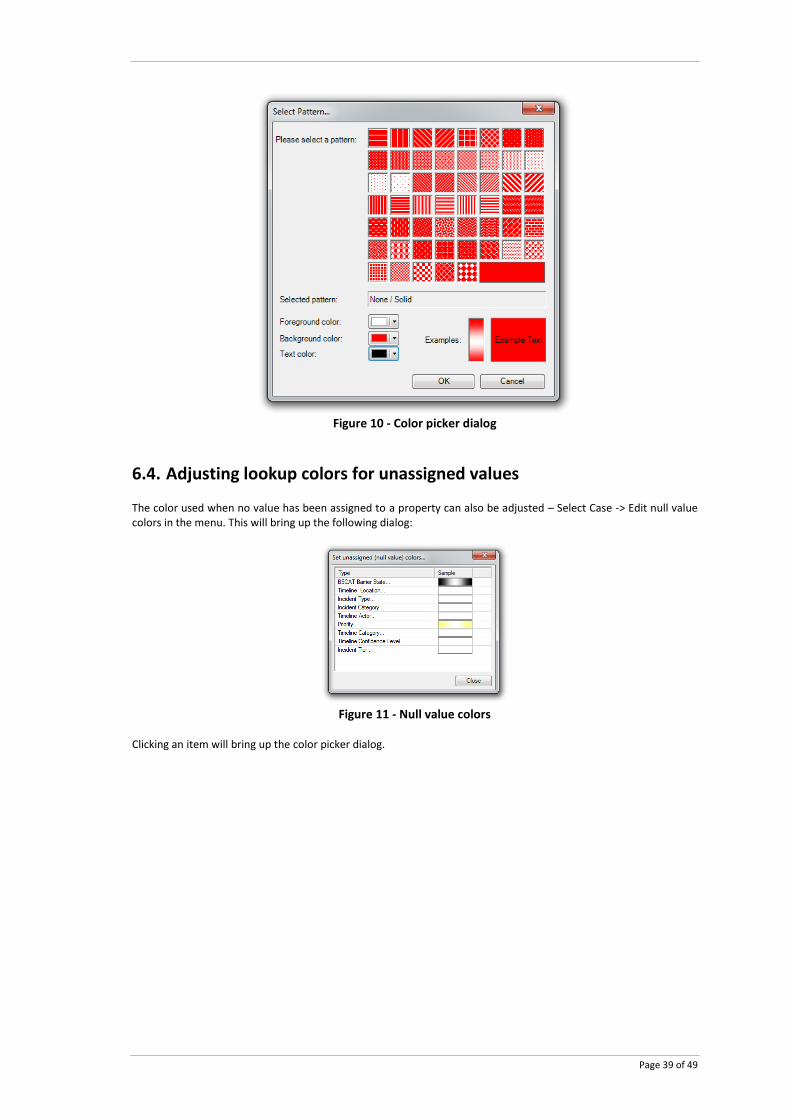
The colors used on the diagram are fully adjustable. They can be set using the editor in the treeview. Find the appropriate value to edit in the treeview and press F2 to bring up the editor. In the editor we click on the “Choose” button to bring up the color picker dialog:
Page 39 of 49
Figure 10 - Color picker dialog
6.4. Adjusting lookup colors for unassigned values
The color used when no value has been assigned to a property can also be adjusted – Select Case -> Edit null value colors in the menu. This will bring up the following dialog:
Figure 11 - Null value colors
Clicking an item will bring up the color picker dialog.
Page 40 of 49
7 Case file tools
7.1. Listview window
The listview window sums up underlying nodes of the selection you made in the treeview window. For example, when you click on document links, the listview will display a list of all document links. The listview is useful for working with multiple items at the same time. For example, you could select multiple document links all at once and drag and drop them onto a barrier in your diagram. There are multiple ways to select multiple items:
Click the first item you want to select. Then hold down the ctrl key and click other items you also want to select. This allows you to select items one by one.
Click the first item you want to select. Then hold the shift key and click the last item in the group that you want to select. This will select all items from the first to the last.
7.1.1. Exporting to Excel
In the upper right hand corner of the listview you may have noticed a small Excel icon. Click this and the contents of the listview will be exported to Microsoft Excel.
7.1.2. Usage references / backlinks
The listview is also used for another important function: the display of backlinks. When a document link is referenced on say, a barrier, there’s a virtual arrow pointing from the barrier to the location in the treeview where the document link is defined. This arrow is called the link. We can also follow this arrow in the reverse direction, from the document links to all the barriers where it is used. These are called the backlinks. The backlinks are all the places where the item is used. A similar concept applies to lookup table values, the items used in drop down lists such as the incident type. For each item we can find out where they are used by showing us their backlinks. This is done by right clicking the item of which you want to see where it is referenced, and selecting the option in the context menu called “Show usage references”. The listview will show the usage references and indicate that it is doing so.
7.2. Quality checks window
You can find the quality checks hidden on the right side of the diagram in the default layout. The quality checks can display a number of different reports pertaining to the quality and completeness of the bowtie case you are building. To create a report: From the drop-down box at the top of the window, select the report you want from the list. Once you have selected a report, the window is populated with the results. To refresh the list of items, click the button with the blue circular arrow.
Page 41 of 49
The quality checks are extremely helpful in identifying holes in your analysis. The following checks are offered:
All actions
All uncompleted actions
Actions without action party
Timeline events where date and time has not been set
Timeline events where actor has not been set
Timeline events where document links is empty
Barriers where barrier state has not been set
Barriers where document links is empty
Barriers where no causations are present
7.3. Case overview
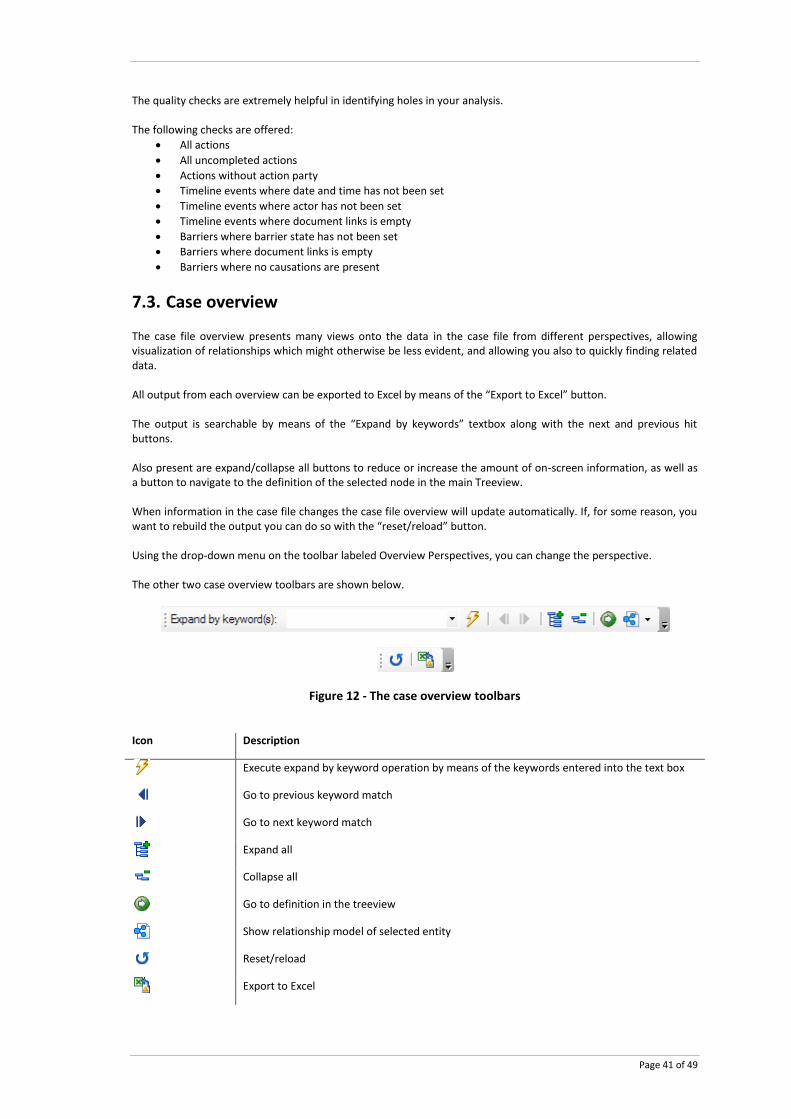
The case file overview presents many views onto the data in the case file from different perspectives, allowing visualization of relationships which might otherwise be less evident, and allowing you also to quickly finding related data. All output from each overview can be exported to Excel by means of the “Export to Excel” button. The output is searchable by means of the “Expand by keywords” textbox along with the next and previous hit buttons. Also present are expand/collapse all buttons to reduce or increase the amount of on-screen information, as well as a button to navigate to the definition of the selected node in the main Treeview. When information in the case file changes the case file overview will update automatically. If, for some reason, you want to rebuild the output you can do so with the “reset/reload” button. Using the drop-down menu on the toolbar labeled Overview Perspectives, you can change the perspective. The other two case overview toolbars are shown below.
Figure 12 - The case overview toolbars Icon Description
Execute expand by keyword operation by means of the keywords entered into the text box
Go to previous keyword match
Go to next keyword match
Expand all
Collapse all
Go to definition in the treeview
Show relationship model of selected entity
Reset/reload
Export to Excel

Page 42 of 49
7.3.1. Document links perspective
This perspective lists all document links defined in your case file and where they are used.
7.3.2. Actions perspective
This perspective finds all actions present in the case file and displays them in two groups: completed actions and uncompleted actions.
Page 43 of 49
8 Linking to documentation
A lot of the information in a case file has close relationship with documents already in existence. This
chapter shows how to refer them.
Introduction
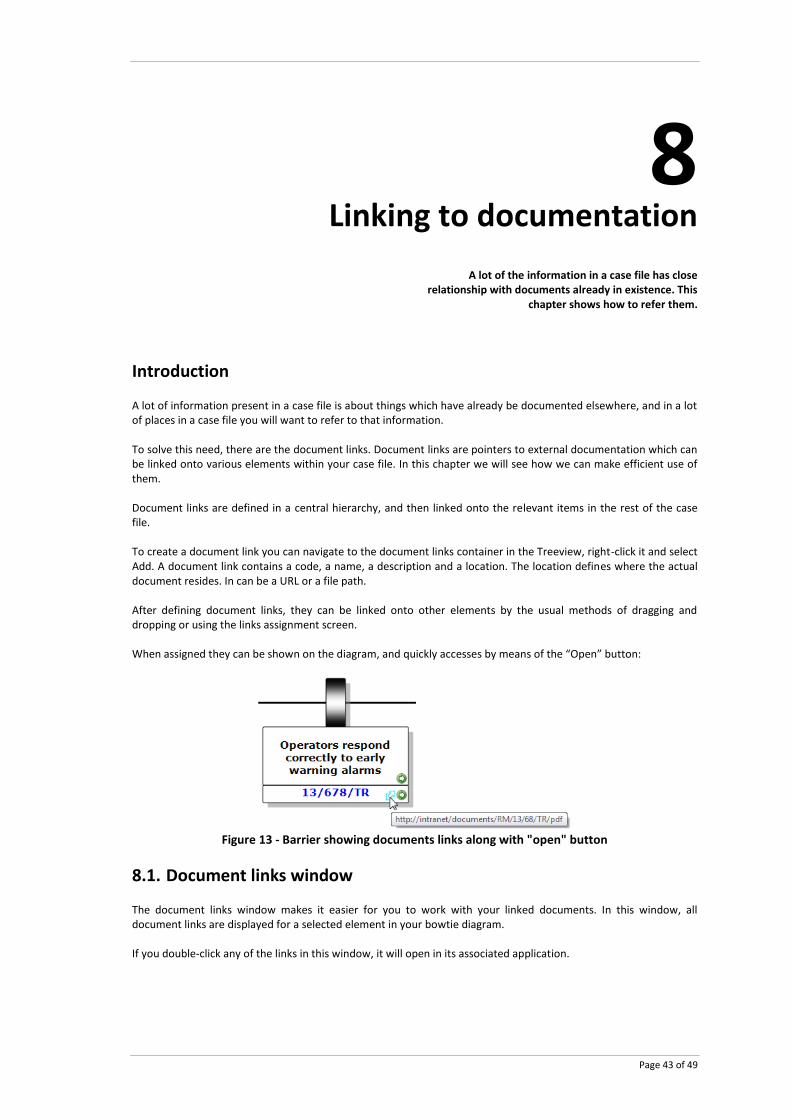
A lot of information present in a case file is about things which have already be documented elsewhere, and in a lot of places in a case file you will want to refer to that information. To solve this need, there are the document links. Document links are pointers to external documentation which can be linked onto various elements within your case file. In this chapter we will see how we can make efficient use of them. Document links are defined in a central hierarchy, and then linked onto the relevant items in the rest of the case file. To create a document link you can navigate to the document links container in the Treeview, right-click it and select Add. A document link contains a code, a name, a description and a location. The location defines where the actual document resides. In can be a URL or a file path. After defining document links, they can be linked onto other elements by the usual methods of dragging and dropping or using the links assignment screen. When assigned they can be shown on the diagram, and quickly accesses by means of the “Open” button:
Figure 13 - Barrier showing documents links along with "open" button
8.1. Document links window
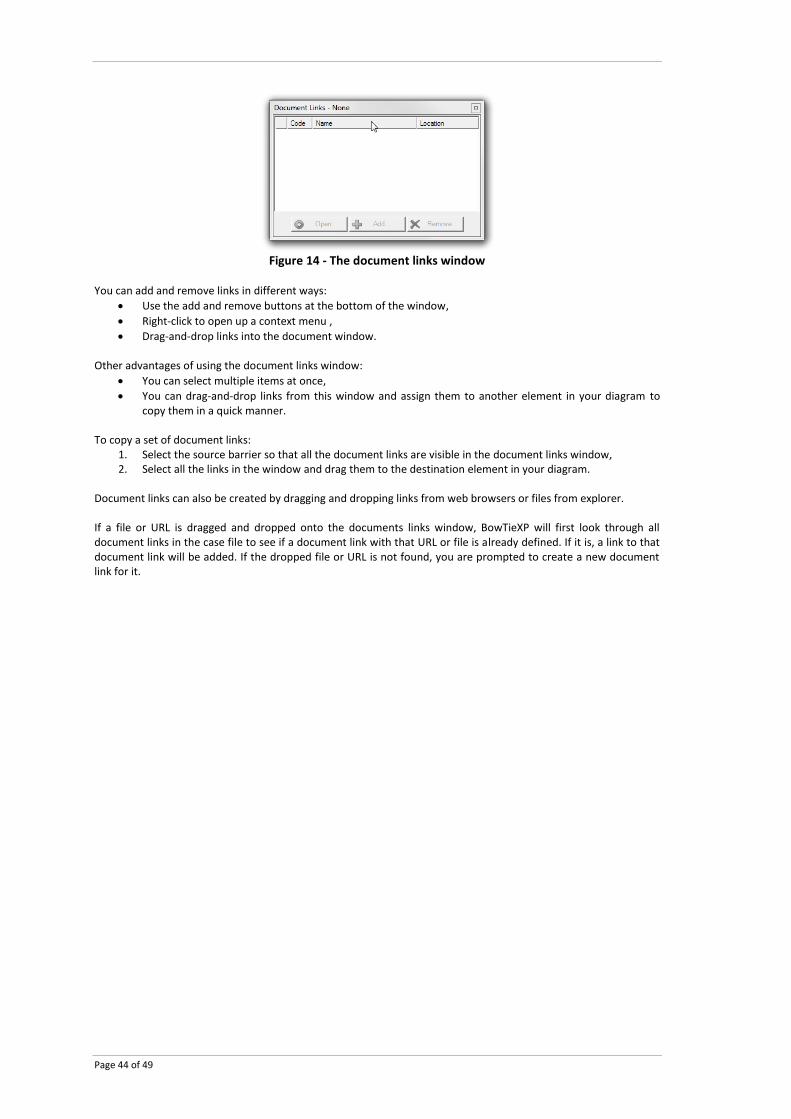
The document links window makes it easier for you to work with your linked documents. In this window, all document links are displayed for a selected element in your bowtie diagram. If you double-click any of the links in this window, it will open in its associated application.
Page 44 of 49
Figure 14 - The document links window
You can add and remove links in different ways:
Use the add and remove buttons at the bottom of the window,
Right-click to open up a context menu ,
Drag-and-drop links into the document window. Other advantages of using the document links window:
You can select multiple items at once,
You can drag-and-drop links from this window and assign them to another element in your diagram to copy them in a quick manner.
To copy a set of document links:
1. Select the source barrier so that all the document links are visible in the document links window, 2. Select all the links in the window and drag them to the destination element in your diagram.
Document links can also be created by dragging and dropping links from web browsers or files from explorer. If a file or URL is dragged and dropped onto the documents links window, BowTieXP will first look through all document links in the case file to see if a document link with that URL or file is already defined. If it is, a link to that document link will be added. If the dropped file or URL is not found, you are prompted to create a new document link for it.
Page 45 of 49
9 Getting data out of the program
In this chapter we take a look at the myriad of methods to generate information for creating reports.
9.1. Introduction
Putting information into case files is nice, but it is even better to get all the information out of the case files in various perspectives and formats. In this chapter we take a look at the different methods for outputting information. We will look at:
The output of the various reports,
How to use the case file overview to generate output,
How to use the quality checks for reporting,
How to use the listview for this,
And how to use the diagram and the color legend.
9.2. Reporting
You can report information in a case file in various ways using the built-in reporting engine. Depending on the chosen report, the format will either be Microsoft Word (rtf) or Microsoft Excel.
9.2.1. Generating a report
Follow these steps to generate a report:
1. Select Tools Reports from the drop-down menu. 2. Click on the desired report. 3. When you select a report, it’s automatically opened in Word, WordPad, or Excel.
You can then save the report under a name of your choosing.
9.2.2. Overview of reports
In this section we present an overview of all the reports available to you. Depending on the report you choose, you may be asked to provide additional information before the report can be generated.
9.3. Using the treeview
The treeview can be used to export lists of objects to Excel - by clicking the little Excel icon in the top right corner of the treeview, all contents are exported to Excel. Note that the current expand/collapse state is taken into account.
Page 46 of 49
9.4. Using the case file overview
The case file overview, offers many views on the different relations in your data. These views can serve as excellent material to create reports on, by exporting the contents to Excel.
9.5. Using the quality checks
Similar to the case file overview, the quality checks also offers various lists which can be exported to Excel and serve as a basis for reports.
9.6. Using the listview
The listview can be used to export lists of objects to Excel as well – for example, to create a list of all job titles, you can select the job titles container in the treeview: the listview will show all the job titles contained in it. This list can be exported to Excel by clicking the Excel button. Using the diagrams and the color legend The main diagram can also be exported to various applications by means of the clipboard. If you are using colors on the diagram shapes, you can also copy the diagram color legend to the clipboard. Make sure you can see the legend. If it isn’t showing, you can display it by means of View Windows Color Legend. When the legend is visible, right click it and select “Copy to clipboard”.
Page 47 of 49
10 A brief description of a subset of
bowtie methodology
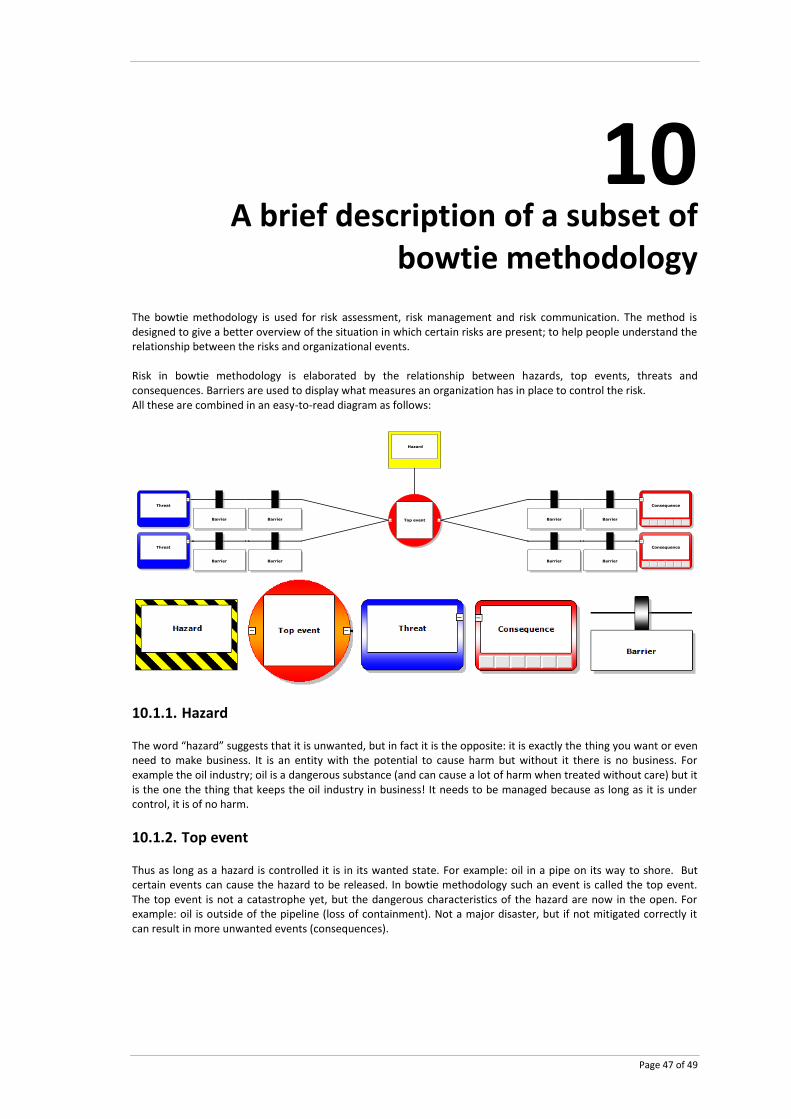
The bowtie methodology is used for risk assessment, risk management and risk communication. The method is designed to give a better overview of the situation in which certain risks are present; to help people understand the relationship between the risks and organizational events. Risk in bowtie methodology is elaborated by the relationship between hazards, top events, threats and consequences. Barriers are used to display what measures an organization has in place to control the risk. All these are combined in an easy-to-read diagram as follows:
10.1.1. Hazard
The word “hazard” suggests that it is unwanted, but in fact it is the opposite: it is exactly the thing you want or even need to make business. It is an entity with the potential to cause harm but without it there is no business. For example the oil industry; oil is a dangerous substance (and can cause a lot of harm when treated without care) but it is the one the thing that keeps the oil industry in business! It needs to be managed because as long as it is under control, it is of no harm.
10.1.2. Top event
Thus as long as a hazard is controlled it is in its wanted state. For example: oil in a pipe on its way to shore. But certain events can cause the hazard to be released. In bowtie methodology such an event is called the top event. The top event is not a catastrophe yet, but the dangerous characteristics of the hazard are now in the open. For example: oil is outside of the pipeline (loss of containment). Not a major disaster, but if not mitigated correctly it can result in more unwanted events (consequences).
Page 48 of 49
10.1.3. Threats
Often there are several factors that could cause the top event. In bowtie methodology these are called threats. These threats need to be sufficient or necessary: every threat itself should have the ability to cause the top event. For example: corrosion of the pipeline can lead to the loss of containment.
10.1.4. Consequences
When a top event has occurred it can lead to certain consequences. A consequence is a potential event resulting from the release of the hazard which results directly in loss or damage. Consequences in bowtie methodology are unwanted events that an organization ‘by all means’ wants to avoid. For example: oil leaking into the environment.
10.1.5. Barriers (also known as controls)
Risk management is about controlling risks. This is done by placing barriers to prevent certain events form happing. A barrier (or control) can be any measure taken that acts against some undesirable force or intention, in order to maintain a desired state. In bowtie methodology there are proactive barriers (on the left side of the top event) that prevent the top event from happening. For example: regularly corrosion-inspections of the pipelines. There are also reactive barriers (on the right side of the top event) that prevent the top event resulting into unwanted consequences. For example: leak detection equipment or concrete floor around oil tank platform. Note the terms barrier and control are the same construct and depending on industry and company, one or the other is used. In this manual we will use the term barrier.
Page 49 of 49
11 Support
11.1. Helpdesk
For users that have bought IncidentXP with support and maintenance a helpdesk is available. This helpdesk assists people that have technical and user-related questions regarding IncidentXP, how to install it and how to use it to its fullest extent. You can reach the IncidentXP helpdesk by e-mail at [email protected] or by telephone on +31 (0) 88 1001 350. Please refer to www.bowtiexp.com for our Support & Maintenance Brochure. It explains what customers receive when purchasing support & maintenance.
11.2. Software training
Please contact us [email protected] or by telephone on 31 (0) 88 100 1350 for software training.
11.3. BSCAT method training
DNV offers training courses in accident investigation using the BSCAT method. If you are interested in such training, please contact: Dr. R.M. Pitblado Director SHE Risk Management Service Area, DNV 1400 Ravello Drive, Katy, TX 77449, USA [email protected]
11.4. Tripod Beta method training
Tripod Beta training is available from various parties, such as for example: AdviSafe B.V. Koperslagersweg 23 1786 RA Den Helder Nederland +31 (0) 223 540000 [email protected]