socio-economic empowerment of tribal … empowerment of tribal women in india: a devepopment...
TRANSCRIPT
@IJRTER-2016, All Rights Reserved 272
SOCIO-ECONOMIC EMPOWERMENT OF TRIBAL WOMEN IN
INDIA: A DEVEPOPMENT PERSPECTIVE
Kusum Chandrakar1 and D.K. Chandrakar2 1Assistant Professor (Economics), Govt. B.P. Arts, Science and Commerce College, Arang, District-Raipur
(Chhattisgarh) 2 Scientist, Indira Gandhi Krishi Vishwa Vidyalaya, Raipur (Chhattisgarh)
Abstract - “Women perform 66 percent of the world’s work, and produce 50 percent of the food, yet
earn only 10 percent of the income and own 1 percent of the property. Whether the issue is improving
education in the developing world, or fighting global climate change, or addressing nearly any other
challenge we face, empowering women is a critical part of the equation”.
Former President Bill Clinton addressing the annual meeting of the Clinton Global Initiative
(September 2009)
This paper has been written on the basis of qualitative and quantitative data collected from
secondary source and discussed socio-economic empowerment of tribal women in india in a descriptive
manner. The tribal population is an integral part of India’s social fabric and has the second largest
concentration after that of the African continent. It is more than the total population of France and
Britain and four times that of Australia. The tribal women have been equal partners with tribal men in
the contribution to household economy. Quite often their women do more physical labour in their
agricultural fields and forest than that of the tribal men. Tribal women have usually enjoyed a higher
social status in their own communities than Indian women in general. Some of the tribes like Khasi in
Mizoram and Meghalaya are matriarchal. However, the literacy rate among the tribal’s and more so in
case of tribal women is quite low and this is also associated with poor nutritional and health status
among the tribal’s. The estimate of poverty made by Planning Commission for the year 1993-94 shows
that 51.92 percent rural and 41.4 percent urban Scheduled Tribes were still living below the poverty line.
They are engaged in various occupations like hunting shifting cultivation to settled agriculture and rural
crafts. A very negligible percent are engaged in non-agricultural activities. The Scheduled Tribes
constitute 8.2% of India’s total population. In all there are 700 Scheduled Tribes in India. States of
Chhattisgarh, Jharkhand, Madhya Pradesh and Orissa all together have about 40% of the total tribal
population of the country.
Keywords: Women empowerment, tribal women census, women literacy.
I. INTRODUCTION
Role of women is not only of importance in economic activities, but her role in non-economic
activities is equally important. The tribal women work very hard, in some cases even more than the men.
The tribal women have a freedom, and a self-expression. With the onset of development programmes
economic changes are taking place, which affect men and women differently. This inequality arising
from the development process calls for a detailed scrutiny because it has resulted in not only inequality
between tribals and nontribals but also among tribals on gender basis. Majority of the tribal societies are
patriarchal. Women are not equal to men as such, but had higher status vis-a-vis non-tribal women. Both
their relatively high status and children’s upbringing depended on abundant resources and partial control
that they exercised over them. Women in Agriculture play a crucial role in wide range of activities and
contributing to sustainable Agriculture development, to achieve inclusive Agricultural growth
International Journal of Recent Trends in Engineering & Research (IJRTER) Volume 02, Issue 11; November - 2016 [ISSN: 2455-1457]
@IJRTER-2016, All Rights Reserved 273
empowering women by having Comprehensive understanding about work participation, gender issues,
drudgery and health and nutritional status is necessary. The concept of work participation of tribal
women in Agriculture sector growth is broad and multidimensional. Women’s empowerment in
agriculture is an important component of that inclusive growth. India’s poor performance on women’s
empowerment and gender equality is reflected in many indicators. In many parts of the country, sex ratio
has 940 females per 1000 males. India is ranked 135 out of 187 countries on Gender Inequality Index as
per the 2014 Global Human Development Report. The man represented the family in the society and
woman as the main decision maker in the family economy, production, and social relations. Tribal
women enjoy a greater social status with regard to control over resources. This ensures their active
participation and decision-making with regard to land utilization, agriculture and powers over cash flow
in a tribal economy. The fact that the woman controlled the family economy was the main reason why
her status depended on abundant resources.
Status of tribal population in India:
As per the 2011 Census out of 24, 94, 54,252 households of which 2, 14, 67,179 households
belongs to Scheduled tribes population. Out of total population of the country i.e. 1,21,05,69,573, a total
of 10, 42, 81,034 are classified as ST with 5, 24, 09,823 males and 5, 18, 71,211 females. The decadal
growth rate of the tribal population during 2001-2011 is 23.7% which is higher than India’s total decadal
growth (17.6%). The tribal population of India constitute 8.6% of total population of the country and
majority of them reside in the rural areas (90%) State wise percent distribution of tribal population that
the highest proportion of tribal population resides in north eastern states namely; Mizoram (94.4%),
Nagaland (86.5%), Meghalaya (86.1%), Arunachal Pradesh (68.8%), Manipur (35.1%), Sikkim (33.8%),
and Tripura (31.8%) Apart from north eastern states tribal population in Lakshadweep islands comprises
of 94.8%. Numerically, the highest tribal concentration is in Madhya Pradesh, which is 14.7% of the
total tribal population of India. Maharashtra (10.1%) and Odessa (9.2%) together add an additional
19.3% tribal population to the country. In contrast, lowest tribal concentration is in UT of Daman and
Diu (0.01%). No ST population is recoded in Punjab, Haryana, Chandigarh, Delhi & Pondicherry
states/UTs.
Objectives of the present study: – economic status of tribal women in India
examine the role of work participation of women in India
analyze the nature and characteristics of socio-cultural conflicts faced by the tribal women
II. METHODOLOGY
Descriptive research design has been adopted for this study. The purpose of this research design
is to describe the problems and other units under investigation like socio-economic background and
elicit new information about the elderly tribal women through the present study based on secondary
source of data, the nature of research is exploratory and collected from the data Census of India 2011,
Annual Report 2012- 13 Ministry of Labour & Employment New Delhi, Annual Returns received under
the Factories Act, 1948 by the Labour Bureau.
Transforming occupational structures amongst tribals
The long term impact of the forms and patterns of dispossession are reflected in the Census of
India, 2011. The following picture emerges when compared with the Census of India, 2001
International Journal of Recent Trends in Engineering & Research (IJRTER) Volume 02, Issue 11; November - 2016 [ISSN: 2455-1457]
@IJRTER-2016, All Rights Reserved 274
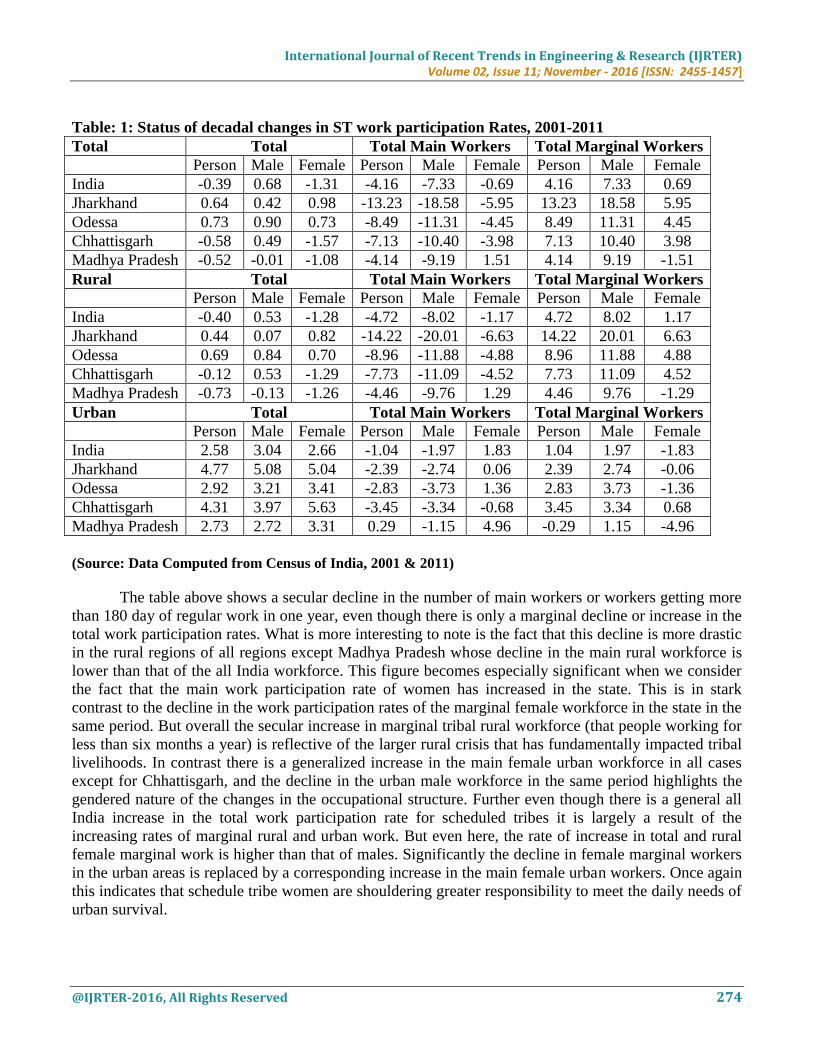
Table: 1: Status of decadal changes in ST work participation Rates, 2001-2011
Total Total Total Main Workers Total Marginal Workers
Person Male Female Person Male Female Person Male Female
India -0.39 0.68 -1.31 -4.16 -7.33 -0.69 4.16 7.33 0.69
Jharkhand 0.64 0.42 0.98 -13.23 -18.58 -5.95 13.23 18.58 5.95
Odessa 0.73 0.90 0.73 -8.49 -11.31 -4.45 8.49 11.31 4.45
Chhattisgarh -0.58 0.49 -1.57 -7.13 -10.40 -3.98 7.13 10.40 3.98
Madhya Pradesh -0.52 -0.01 -1.08 -4.14 -9.19 1.51 4.14 9.19 -1.51
Rural Total Total Main Workers Total Marginal Workers
Person Male Female Person Male Female Person Male Female
India -0.40 0.53 -1.28 -4.72 -8.02 -1.17 4.72 8.02 1.17
Jharkhand 0.44 0.07 0.82 -14.22 -20.01 -6.63 14.22 20.01 6.63
Odessa 0.69 0.84 0.70 -8.96 -11.88 -4.88 8.96 11.88 4.88
Chhattisgarh -0.12 0.53 -1.29 -7.73 -11.09 -4.52 7.73 11.09 4.52
Madhya Pradesh -0.73 -0.13 -1.26 -4.46 -9.76 1.29 4.46 9.76 -1.29
Urban Total Total Main Workers Total Marginal Workers
Person Male Female Person Male Female Person Male Female
India 2.58 3.04 2.66 -1.04 -1.97 1.83 1.04 1.97 -1.83
Jharkhand 4.77 5.08 5.04 -2.39 -2.74 0.06 2.39 2.74 -0.06
Odessa 2.92 3.21 3.41 -2.83 -3.73 1.36 2.83 3.73 -1.36
Chhattisgarh 4.31 3.97 5.63 -3.45 -3.34 -0.68 3.45 3.34 0.68
Madhya Pradesh 2.73 2.72 3.31 0.29 -1.15 4.96 -0.29 1.15 -4.96
(Source: Data Computed from Census of India, 2001 & 2011)
The table above shows a secular decline in the number of main workers or workers getting more
than 180 day of regular work in one year, even though there is only a marginal decline or increase in the
total work participation rates. What is more interesting to note is the fact that this decline is more drastic
in the rural regions of all regions except Madhya Pradesh whose decline in the main rural workforce is
lower than that of the all India workforce. This figure becomes especially significant when we consider
the fact that the main work participation rate of women has increased in the state. This is in stark
contrast to the decline in the work participation rates of the marginal female workforce in the state in the
same period. But overall the secular increase in marginal tribal rural workforce (that people working for
less than six months a year) is reflective of the larger rural crisis that has fundamentally impacted tribal
livelihoods. In contrast there is a generalized increase in the main female urban workforce in all cases
except for Chhattisgarh, and the decline in the urban male workforce in the same period highlights the
gendered nature of the changes in the occupational structure. Further even though there is a general all
India increase in the total work participation rate for scheduled tribes it is largely a result of the
increasing rates of marginal rural and urban work. But even here, the rate of increase in total and rural
female marginal work is higher than that of males. Significantly the decline in female marginal workers
in the urban areas is replaced by a corresponding increase in the main female urban workers. Once again
this indicates that schedule tribe women are shouldering greater responsibility to meet the daily needs of
urban survival.
International Journal of Recent Trends in Engineering & Research (IJRTER) Volume 02, Issue 11; November - 2016 [ISSN: 2455-1457]
@IJRTER-2016, All Rights Reserved 275
Gender work participation scenario:
As per men and women work participation rate from the census 2001 data, Mizoram with value
0.093 had the most equitable gender work participation scenario, followed by Manipur (0.094),
Nagaland (0.10) and Himachal Pradesh (0.11). Some high gender work participation disparity states
include Uttar Pradesh, Bihar, Punjab, Kerala, West Bengal and Odisha. In Madhya Pradesh,
participation of women in rice based cropping system was 40.51% and that of men was 59.49%.
Maximum participation of women was in rice crop (78.18%), followed by wheat (12.76%), field pea
(3.22%) and black gram (2.41%). Tribal women earned on an average 158 woman-days/years and `
150/woman-day of employment in forest produce. For better marketing system, 62% tribal women
suggested market in nearby places, 37% direct sale to consumers to avoid traders, 31% better transport
facility, 25% creation of storage facility and 7% minimum support prize by government agencies and
2% creation of shelter place. Traders suggested for enhancing knowledge of tribal women in marketing
system.
Table 2: Women work participation in India
S. No. Census year Work Participation rate for women in (%)
1 1981 19.67
2 1991 22.27
3 2001 25.63
(Source: Annual Report 2012- 13 Ministry of Labour & Employment New Delhi)
Women form an integral part of the Indian workforce. According to the information provided by the
Registrar General of India, the work participation rate for women was 25.63 per cent in 2001. This is an
improvement from 22.27 per cent in 1991and 19.67 per cent in 1981.
Table 3: Mean daily employment generation of women in industries
Year Total Employment
(in thousands)
Women Participation
(in thousands)
% share of women to total employment
2000 2194.5 210.5 9.6
2001 3272.1 480.1 14.7
2002 3330.4 547.4 16.4
2003 2139.5 236.0 11.0
2004 3554.0 641.7 18.06
2005 3848.0 640.4 16.64
2006 4373.0 730.7 16.71
2007 3054.0 313.9 10.28
2008 2628.4 220.9 8.41
(Source: Annual Returns received under the Factories Act, 1948 by the Labour Bureau) Note: Date for
the years 2005, 2006, 2007 and 2008 are based on the returns received from 17, 17, 18 and 16
States/U.Ts., Respectively.
Tribal Women and Forests
Tribals have been residing in forest areas for generations, cultivating land and collecting non-
timber forest produce. As per the Forest Survey of India Report, 2003, 60.04% of the 63% forest cover
of the country and 63% of dense forests lie in 187 tribal districts, though the geographical area of these

International Journal of Recent Trends in Engineering & Research (IJRTER) Volume 02, Issue 11; November - 2016 [ISSN: 2455-1457]
@IJRTER-2016, All Rights Reserved 276
districts is just 33.6% of the country’s geographical area. Out of 58 districts, which have more than 67%
of their area under forest cover, 51 are tribal districts. A comparison of the 2001 and 2003 assessments
of forest cover in tribal districts shows a net increase of 321,100 hectares underscoring a very strong
symbiotic relationship between tribals and forests and of tribals being at the forefront of conservation
regimes. Minor forest produce forms a major source of income in many tribal communities, especially
those having less than five acres of land. Women and children are almost exclusively involved in
collection of minor forest produce, its storage, processing and marketing (Singh, B., 1993; Roy Burman,
1988).
Tribal Women in Agriculture
Over 80% of tribals work in the primary sector against 53% of the general population. About
45% are cultivators against 32.5% of the general population. According to available data, the number of
tribal who were cultivators, declined from over 68% to 45% in 2001, whereas agricultural laborers
increased from about 20% to 37%, an indication that tribals are steadily losing their lands. Unlike other
communities, among tribals there are no restrictions on women’s participation in the cultivation process.
A tribal woman can participate actively in all agricultural operations including, ploughing, digging,
sowing, manuring, transplanting, weeding, harvesting, preparing the granary, threshing, winnowing and
storing food grains. In agriculturally back ward areas, tribal women are forbidden to touch a plough and
cannot dig the ground but in all other agricultural operations, women participate actively and
traditionally these are a female’s job. Processing of food grain is exclusively a woman’s job. Every
morning tribal women dehusk millet and paddy in husking levers and then clean the grains and cooks
them. They not only save money, but also earn it, unlike females of other communities. Tribal women
work as men’s partners in agriculture, yet their status remains the same. Tribal women work very hard
for the livelihood of the family but live a poor life, in spite of their many contributions in the house and
on the farm. Tribal women are important for the improvement and progress of tribals. They are the pivot
of tribal agriculture, performing many household and agricultural jobs. Without them, tribal welfare in
agriculture is meaningless.
Tribal Women in Education
Tribal women play a significant role in the economic development of tribals as they contribute in
various economic activities and education is one of the them. Education is a crucial requirement for the
sustained growth of a developing society and lack of it is largely responsible for the exploitation and
pitiable plight of the tribals. The literacy rate of tribals was 8.53 in 1961 and steadily increased to 47.10
in 2001, yet it is far below the national rate of 64.84 (2001 census).
Table 4: Literacy in STs
Census Year Total population STs
Male Female Total Male Female Total
1961 40.40 15.35 28.30 13.86 3.16 8.53
1971 45.96 21.97 35.45 17.63 4.85 11.30
1981 56.38 29.76 43.57 24.52 8.04 16.35
1991 64.13 39.29 52.21 40.65 18.19 29.60
2001 75.26 53.67 64.84 59.17 34.76 47.10
Source : Selected Educational Statistics 2002-2003, Ministry of HRD.
International Journal of Recent Trends in Engineering & Research (IJRTER) Volume 02, Issue 11; November - 2016 [ISSN: 2455-1457]
@IJRTER-2016, All Rights Reserved 277
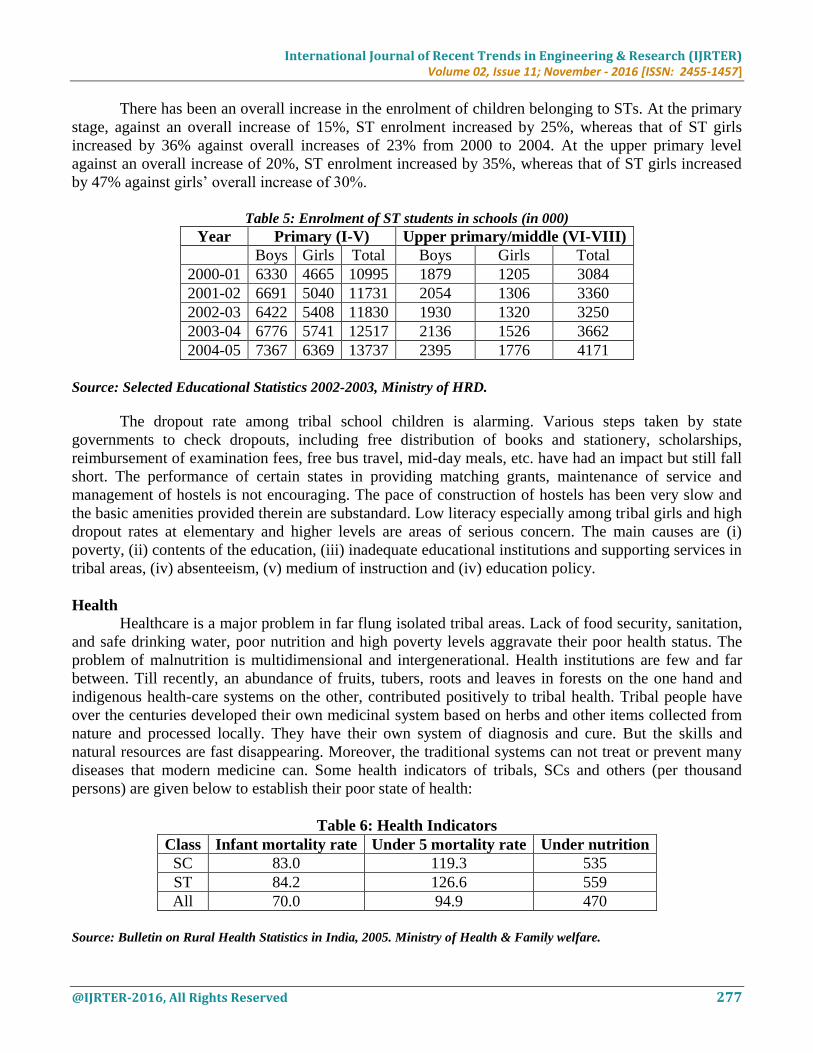
There has been an overall increase in the enrolment of children belonging to STs. At the primary
stage, against an overall increase of 15%, ST enrolment increased by 25%, whereas that of ST girls
increased by 36% against overall increases of 23% from 2000 to 2004. At the upper primary level
against an overall increase of 20%, ST enrolment increased by 35%, whereas that of ST girls increased
by 47% against girls’ overall increase of 30%.
Table 5: Enrolment of ST students in schools (in 000)
Year Primary (I-V) Upper primary/middle (VI-VIII)
Boys Girls Total Boys Girls Total
2000-01 6330 4665 10995 1879 1205 3084
2001-02 6691 5040 11731 2054 1306 3360
2002-03 6422 5408 11830 1930 1320 3250
2003-04 6776 5741 12517 2136 1526 3662
2004-05 7367 6369 13737 2395 1776 4171
Source: Selected Educational Statistics 2002-2003, Ministry of HRD.
The dropout rate among tribal school children is alarming. Various steps taken by state
governments to check dropouts, including free distribution of books and stationery, scholarships,
reimbursement of examination fees, free bus travel, mid-day meals, etc. have had an impact but still fall
short. The performance of certain states in providing matching grants, maintenance of service and
management of hostels is not encouraging. The pace of construction of hostels has been very slow and
the basic amenities provided therein are substandard. Low literacy especially among tribal girls and high
dropout rates at elementary and higher levels are areas of serious concern. The main causes are (i)
poverty, (ii) contents of the education, (iii) inadequate educational institutions and supporting services in
tribal areas, (iv) absenteeism, (v) medium of instruction and (iv) education policy.
Health
Healthcare is a major problem in far flung isolated tribal areas. Lack of food security, sanitation,
and safe drinking water, poor nutrition and high poverty levels aggravate their poor health status. The
problem of malnutrition is multidimensional and intergenerational. Health institutions are few and far
between. Till recently, an abundance of fruits, tubers, roots and leaves in forests on the one hand and
indigenous health-care systems on the other, contributed positively to tribal health. Tribal people have
over the centuries developed their own medicinal system based on herbs and other items collected from
nature and processed locally. They have their own system of diagnosis and cure. But the skills and
natural resources are fast disappearing. Moreover, the traditional systems can not treat or prevent many
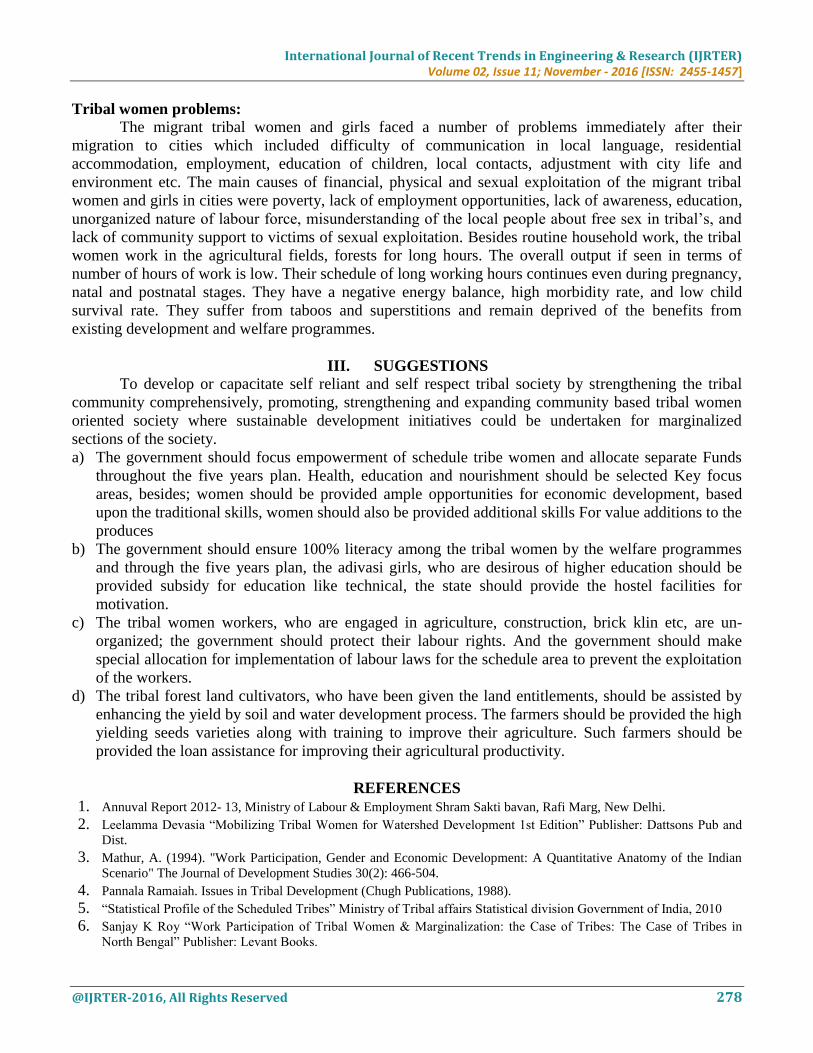
diseases that modern medicine can. Some health indicators of tribals, SCs and others (per thousand
persons) are given below to establish their poor state of health:
Table 6: Health Indicators
Class Infant mortality rate Under 5 mortality rate Under nutrition
SC 83.0 119.3 535
ST 84.2 126.6 559
All 70.0 94.9 470
Source: Bulletin on Rural Health Statistics in India, 2005. Ministry of Health & Family welfare.
International Journal of Recent Trends in Engineering & Research (IJRTER) Volume 02, Issue 11; November - 2016 [ISSN: 2455-1457]
@IJRTER-2016, All Rights Reserved 278
Tribal women problems:
The migrant tribal women and girls faced a number of problems immediately after their
migration to cities which included difficulty of communication in local language, residential
accommodation, employment, education of children, local contacts, adjustment with city life and
environment etc. The main causes of financial, physical and sexual exploitation of the migrant tribal
women and girls in cities were poverty, lack of employment opportunities, lack of awareness, education,
unorganized nature of labour force, misunderstanding of the local people about free sex in tribal’s, and
lack of community support to victims of sexual exploitation. Besides routine household work, the tribal
women work in the agricultural fields, forests for long hours. The overall output if seen in terms of
number of hours of work is low. Their schedule of long working hours continues even during pregnancy,
natal and postnatal stages. They have a negative energy balance, high morbidity rate, and low child
survival rate. They suffer from taboos and superstitions and remain deprived of the benefits from
existing development and welfare programmes.
III. SUGGESTIONS
To develop or capacitate self reliant and self respect tribal society by strengthening the tribal
community comprehensively, promoting, strengthening and expanding community based tribal women
oriented society where sustainable development initiatives could be undertaken for marginalized
sections of the society.
a) The government should focus empowerment of schedule tribe women and allocate separate Funds
throughout the five years plan. Health, education and nourishment should be selected Key focus
areas, besides; women should be provided ample opportunities for economic development, based
upon the traditional skills, women should also be provided additional skills For value additions to the
produces
b) The government should ensure 100% literacy among the tribal women by the welfare programmes
and through the five years plan, the adivasi girls, who are desirous of higher education should be
provided subsidy for education like technical, the state should provide the hostel facilities for
motivation.
c) The tribal women workers, who are engaged in agriculture, construction, brick klin etc, are un-
organized; the government should protect their labour rights. And the government should make
special allocation for implementation of labour laws for the schedule area to prevent the exploitation
of the workers.
d) The tribal forest land cultivators, who have been given the land entitlements, should be assisted by
enhancing the yield by soil and water development process. The farmers should be provided the high
yielding seeds varieties along with training to improve their agriculture. Such farmers should be
provided the loan assistance for improving their agricultural productivity.
REFERENCES 1. Annuval Report 2012- 13, Ministry of Labour & Employment Shram Sakti bavan, Rafi Marg, New Delhi.
2. Leelamma Devasia “Mobilizing Tribal Women for Watershed Development 1st Edition” Publisher: Dattsons Pub and
Dist.
3. Mathur, A. (1994). "Work Participation, Gender and Economic Development: A Quantitative Anatomy of the Indian
Scenario" The Journal of Development Studies 30(2): 466-504.
4. Pannala Ramaiah. Issues in Tribal Development (Chugh Publications, 1988).
5. “Statistical Profile of the Scheduled Tribes” Ministry of Tribal affairs Statistical division Government of India, 2010
6. Sanjay K Roy “Work Participation of Tribal Women & Marginalization: the Case of Tribes: The Case of Tribes in
North Bengal” Publisher: Levant Books.