socio-economic determinants of drugged driving – a register-based study
TRANSCRIPT

Socio-economic determinants of drugged driving – aregister-based studyadd_3422 1448..1459
Karoliina Karjalainen1, Tomi Lintonen2,3, Antti Impinen1, Pirjo Lillsunde1, Pia Mäkelä1,Ossi Rahkonen4, Jari Haukka1,4 & Aini Ostamo1,3
National Institute for Health and Welfare, Helsinki, Finland,1 The Finnish Foundation for Alcohol Studies, Helsinki, Finland,2 School of Health Sciences, Universityof Tampere, Finland3 and University of Helsinki, Department of Public Health, Helsinki, Finland4
ABSTRACT
Aims To examine the associations between socio-economic characteristics and driving under the influence of drugs(DUID), and to elaborate determinants of drugged driving. Design A register-based case–control study. Setting Fin-land. Participants Cases (n = 5859) apprehended by the police and suspected of DUID during 1993–2006 andcontrols (n = 74 809) drawn from the general Finnish population. Measurements The effects of parents’ and owneducation, urbanization of municipality, socio-economic position (SEP), main activity, income, marital status andliving arrangements on DUID were estimated using logistic regression analysis. The analyses were conducted sepa-rately for men and women, age groups of under 45 years and aged 45 or over, and for substance groups of benzodi-azepines only, benzodiazepines with alcohol, amphetamines and cannabinoids. Findings Low education,unemployment, disability pension, being divorced and living alone were the strongest individual predictors of DUID inall substance groups. Illicit drug users were more disadvantaged compared to those in the benzodiazepines groups.Contrary to other substance and age groups, higher educational level and higher SEP were associated with DUIDamong benzodiazepine users aged 45 or over. Conclusions A disadvantaged social background is a significant pre-dictor of driving while under the influence of drugs for all substance use groups in Finland. The gradient is greater foramphetamines and cannabinoids than benzodiazepines.
Keywords Amphetamines, benzodiazepines, cannabinoids, driving under the influence of drugs, register-basedstudy, socio-economic determinants.
Correspondence to: Karoliina Karjalainen, National Institute for Health and Welfare, PO Box 30, FI-00271 Helsinki, Finland.E-mail: [email protected] 31 May 2010; initial review completed 5 August 2010; final version accepted 25 February 2011
INTRODUCTION
Driving under the influence of drugs (DUID) poses a con-siderable threat to traffic safety [1–3]. In addition torisking other people’s health, drugged drivers can alsoharm themselves: their risk of premature death has beenshown to be high [4–6].
Socio-economic inequalities in health are widely rec-ognized [7]. There are socio-economic differences, forexample, in mortality and morbidity [8], and differenceshave been found similarly with regard to drug use. Theassociation between social background and illicit druguse has been studied among samples from general popu-lations [9–11], drug treatment programmes [12–14] andthose outside treatment [15]. These studies have shown
that a disadvantaged social background (e.g. lowereducation, lower income, unemployment) and socialmarginalization (e.g. homelessness or incarceration) areassociated with illicit drug use.
Similarly, disadvantaged social background is associ-ated with the use of legal prescription drugs, for examplebenzodiazepines. Population-based studies have shownthat, for example, lower education, lower income,unemployment, being divorced or widowed or being on adisability pension predict current or long-term benzodi-azepine use [16–20]. Some of these associations,however, attenuate or disappear after controlling forhealth status [16,17].
Social factors exposing to DUID have barelybeen studied, but some evidence exists. For example, a
RESEARCH REPORT doi:10.1111/j.1360-0443.2011.03422.x
© 2011 The Authors, Addiction © 2011 Society for the Study of Addiction Addiction, 106, 1448–1459

Canadian population-based study found that lower edu-cation and never being married predicted driving underthe influence of cannabis [21]. A Swedish register-basedstudy followed-up a national cohort of young drivers, andfound that impaired drivers with lower education orlower class of origin had an excess risk for severe trafficaccidents [22].
Because of the illegality and commonly hidden natureof drug abuse, drug users are not easily reached forresearch purposes. Surveys conducted among generalpopulations are unlikely to reach all problem drug users,and they may be biased due to under-reporting [23]. Con-versely, studies conducted among problem drug users, forexample clinical samples, are highly selected. Thus, noneof these results can be generalized to the entire popula-tion of drug users. Although drugged drivers do notcomprise a representative sample of all drug users, theyprovide a complementary picture of the characteristics ofdrug users in addition to studies on other drug-usingpopulations.
Difficulties in locating and following-up drug users isone reason for the scarcity of data. These common diffi-culties can partly be overcome in Finland, where differenthealth and social welfare registers have been maintainedsince the 1950s, and several of them have been shown tohave good coverage and validity [24]. All registers arebased on unique identity numbers for each individual,which enables the linking of different registers, and thusprovide an exceptional opportunity to use these registersfor research purposes.
This case–control study was based on extensiveregister-based material constructed by linking the regis-ter of drugged drivers with other registers in Finland. Theaim of this study was, first, to examine the associationsbetween socio-economic characteristics and druggeddriving, and secondly to elaborate the determinants ofdrugged driving. We examined how parents’ and owneducation, level of urbanization, socio-economic position(SEP), main activity, income, marital status and livingarrangements were associated with driving under theinfluence of drugs.
MATERIALS AND METHODS
The main reasons for detecting drunken/drugged driversin Finland include impaired or dangerous driving, trafficaccidents, information from a bystander and randomstop-checks. Finnish police are authorized by law tosubmit drivers to a preliminary breath alcohol screeningtest or oral fluid on-site drug test (launched in 2003). InFinnish society equity is highly valued so that, forexample, older and cheaper cars would not generally betargeted more than newer and more expensive cars.
The punishable thresholds of blood alcohol concen-tration (BAC) by Finnish drunken driving legislation [25;p. 58] are 0.5‰ (g/kg) for drunken driving and 1.2‰for aggravated drunken driving (1.5‰ until September1994). A zero tolerance law for illicit drugs and drivingwas introduced in Finland in February 2003 [25; p. 58].
Data
The groups of cases and controls formed the study popu-lation (n = 80 668). Cases were drawn from the registerof DUI suspects. The cases (n = 5859) comprised 50% ofall people driving a motored vehicle in road traffic inFinland during 1993–2006 who were suspected of DUIby the police, and whose blood sample had one or morepositive findings for illicit and/or medicinal drugs poten-tially impairing driving skills. All drug/alcohol analyseswere carried out centrally at the National Institute forHealth and Welfare (THL) in Finland, and registered in adatabase. DUID suspects were aged 14–84 years. Sus-pected drivers driving under the influence of alcohol onlywere excluded from the present study.
A control group (n = 74 809) was drawn from thegeneral Finnish population not suspected of DUI. Theycomprised age- (�1 year) and gender-matched controlsfor people suspected of driving under the influence ofalcohol and/or drugs.
Socio-economic factors were obtained from theemployment register (an annual, individual-level registerof economic activity and employment status of perma-nent residents in Finland [26]) by Statistics Finland. Theregister was linked individually to the study population,and the data were available to anonymized researchers.To ensure privacy, some information was coarsened.
The outcome measure was the apprehension for sus-pected DUID. Cases were categorized by substances foundduring the first apprehension as ‘benzodiazepines only’(no other substances, n = 774), ‘benzodiazepines withalcohol’ (no other substances, n = 1234), ‘amphetaminesplus other impairing drugs’ (a finding for at least amphet-amines, possibly also other substances, n = 2110) and‘cannabinoids plus other impairing drugs’ (a finding forat least cannabinoids, possibly also other substances, butnot amphetamines, n = 485). These substance groupswere included because they were the largest and also themost interesting groups based on earlier studies [27–29].Also, the groups of ‘amphetamines only’ (n = 697) and‘cannabinoids only’ (n = 133) were analysed separately,but the emphasis of reporting is on the first four groups.
In the benzodiazepines with alcohol group, mean BACwas 1.3‰ (median 1.2‰). BAC exceeded 0.5‰ in 84%of cases and 1.2‰ in 49%. In the amphetamines group,33% of cases had a finding for amphetamines only, andthe rest also had a finding for benzodiazepines (83%),
Socio-economic determinants of DUID 1449
© 2011 The Authors, Addiction © 2011 Society for the Study of Addiction Addiction, 106, 1448–1459

opioids (17%), cannabinoids (12%) or other drugsimpairing driving skills (10%). In the cannabinoidsgroup, 27% had a finding for cannabinoids only, and therest also had a finding for benzodiazepines (65%), opioids(14%) or other drugs impairing driving skills (10%).
Socio-economic characteristics
Cases and controls were classified according to gender andage (aged under 45 years or 45 years or over). The datawere divided into two age groups because we assumed,and the data confirmed, that there were significant differ-ences between socio-economic characteristics of the morecommon younger cases and less common older cases. Forthe analysis, age was classified further into 10-year agegroups. The level of education (both parents’ and own)was classified into three categories: high, intermediate andbasic or unknown. The level of urbanization of themunicipality of residence was urban, semi-urban or rural.SEP was based on the subject’s occupation and wasclassified as upper white-collar, lower white-collar, blue-collar, entrepreneur (including farmers) and ‘other’ orunknown. The employment register provided annual dataof SEP for years 2004–2006 only—before this, the SEPinformation was available every 5 years during 1970–2000. Because occupational data were not available foreconomically inactive people (unemployed, pensioner,unknown or missing), their SEP was defined retrospec-tively. Main activity included categories of employedlabour force, long-term unemployed (unemployed formore than 10 months in a given year), short-term unem-ployed, student, disability pensioner, unemployment pen-sioner, retirement pensioner, conscript and ‘other’ orunknown. Any income subject to state taxation wasdivided into quartiles, separately for men and women, dueto their different income distributions. Marital status wasclassified as married, single, divorced or widowed, andliving arrangement described as whether a person wasliving alone or with family (e.g. had a spouse and/or chil-dren or lived with his/her parents).
Information about age and found substances weretaken at the time of first apprehension. In order to ensurethat the socio-economic variables represented statusbefore the first apprehension, data from the precedingyear was used. For controls, information about socio-economic background was taken from the preceding yearof the corresponding DUI suspect’s apprehension. Whenthe preceding year’s data were not available (n = 3456,0.2% of the cases and 4.6% of the controls), all data weretaken from the year of apprehension.
Statistical analysis
A logistic regression model was used, with results pre-sented as odds ratios (OR) with 95% confidence intervals
(CI). Models were constructed with DUID as a dependentvariable. All the models, except univariate, included ageand geographical region (western, southern, eastern andnorthern Finland and Åland), and socio-economic vari-ables were added to the model in a rough temporal order.The modelling reveals to what extent an original associa-tion, e.g. that between SEP and DUID, is explained byconfounders (variables preceding SEP), and to whatextent it is mediated by variables located in between thefactor in question (e.g. SEP) and DUID. The extent of‘explanation’ and ‘mediation’ can be seen in the changeof ORs when variables are introduced into the model.
The modelling was conducted separately for men andwomen, for age groups under 45 years and aged 45 orover, and for substance groups of benzodiazepines only,benzodiazepines with alcohol, amphetamines and can-nabinoids. Parents’ education was excluded from theanalysis of the older age groups because of the largeamount of unknown information. Otherwise, the samplesize did not change markedly due to missing datathroughout modelling. PASW Statistics 18 (SPSS) wasused to analyse the data.
Research ethics
The study protocol was approved by the InstitutionalReview Board of the National Institute for Health andWelfare. Informed consent was not required because thedata were anonymous and coarsened register data, andindividuals were not contacted.
RESULTS
Socio-economic characteristics of cases and controls areshown in each table (Tables 1–5; see also Supportinginformation, Tables S1–S8). As most of the cases wereunder 45-year-old men, the emphasis is upon this groupin reporting the results.
Benzodiazepines only
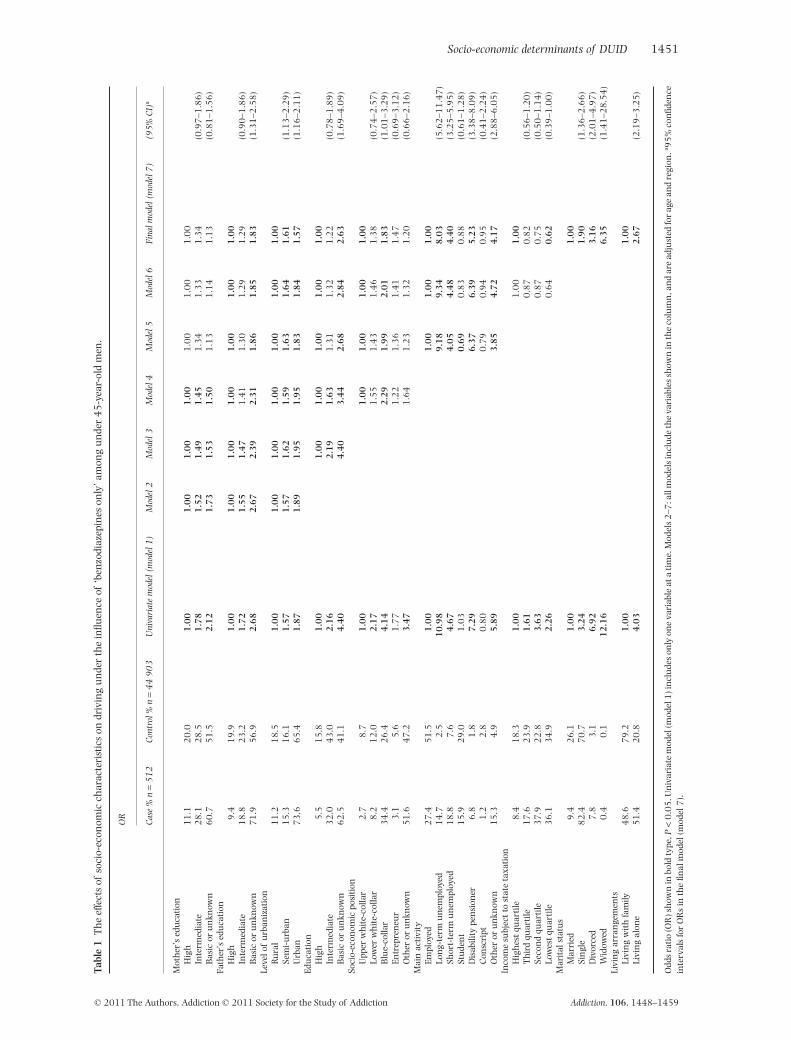
Among under 45-year-old men, DUI of ‘benzodiazepinesonly’ was predicted by the lower level of mother’s, father’sand own education, urban environment, lower white-collar, blue-collar and ‘other’/unknown SEP, long- orshort-term unemployment, disability pension, ‘other’/unknown main activity, lower income, being single,divorced or widowed and living alone (Table 1, univariatemodel).
Most of these associations attenuated, but remainedafter adjusting for other socio-economic variables(Table 1, final model). Thus, father’s basic education,urban environment, own basic education, low SEP,long- and short-term unemployment, disability pension,‘other’/unknown main activity, marital status other than
1450 Karoliina Karjalainen et al.
© 2011 The Authors, Addiction © 2011 Society for the Study of Addiction Addiction, 106, 1448–1459
Tabl
e1
Th
eef
fect
sof
soci
o-ec
onom
icch
arac
teri
stic
son
driv
ing
un
der
the
influ
ence
of‘b
enzo
diaz
epin
eson
ly’a
mon
gu
nde
r4
5-y
ear-
old
men
.
OR
Cas
e%
n=
51
2C
ontr
ol%
n=
44
90
3U
niva
riat
em
odel
(mod
el1
)M
odel
2M
odel
3M
odel
4M
odel
5M
odel
6Fi
nalm
odel
(mod
el7
)(9
5%
CI)
a
Mot
her
’sed
uca
tion
Hig
h1
1.1
20
.01
.00
1.0
01
.00
1.0
01
.00
1.0
01
.00
Inte
rmed
iate
28
.12
8.5
1.7
81
.52
1.4
91
.45
1.3
41
.33
1.3
4(0
.97
–1.8
6)
Bas
icor
un
know
n6
0.7
51
.52
.12
1.7
31
.53
1.5
01
.13
1.1
41
.13
(0.8
1–1
.56
)Fa
ther
’sed
uca
tion
Hig
h9
.41
9.9
1.0
01
.00
1.0
01
.00
1.0
01
.00
1.0
0In
term
edia
te1
8.8
23
.21
.72
1.5
51
.47
1.4
11
.30
1.2
91
.29
(0.9
0–1
.86
)B
asic
oru
nkn
own
71
.95
6.9
2.6
82
.67
2.3
92
.31
1.8
61
.85
1.8
3(1
.31
–2.5
8)
Leve
lof
urb
aniz
atio
nR
ura
l1
1.2
18
.51
.00
1.0
01
.00
1.0
01
.00
1.0
01
.00
Sem
i-u
rban
15
.31
6.1
1.5
71
.57
1.6
21
.59
1.6
31
.64
1.6
1(1
.13
–2.2
9)
Urb
an7
3.6
65
.41
.87
1.8
91
.95
1.9
51
.83
1.8
41
.57
(1.1
6–2
.11
)Ed
uca
tion
Hig
h5
.51
5.8
1.0
01
.00
1.0
01
.00
1.0
01
.00
Inte
rmed
iate
32
.04
3.0
2.1
62
.19
1.6
31
.31
1.3
21
.22
(0.7
8–1
.89
)B
asic
oru
nkn
own
62
.54
1.1
4.4
04
.40
3.4
42
.68
2.8
42
.63
(1.6
9–4
.09
)So
cio-
econ
omic
posi
tion
Upp
erw
hit
e-co
llar
2.7
8.7
1.0
01
.00
1.0
01
.00
1.0
0Lo
wer
wh
ite-
colla
r8
.21
2.0
2.1
71
.55
1.4
31
.46
1.3
8(0
.74
–2.5
7)
Blu
e-co
llar
34
.42
6.4
4.1
42
.29
1.9
92
.01
1.8
3(1
.01
–3.2
9)
Entr
epre
neu
r3
.15
.61
.77
1.2
21
.36
1.4
11
.47
(0.6
9–3
.12
)O
ther
oru
nkn
own
51
.64
7.2
3.4
71
.64
1.2
31
.32
1.2
0(0
.66
–2.1
6)
Mai
nac
tivit
yEm
ploy
ed2
7.4
51
.51
.00
1.0
01
.00
1.0
0Lo
ng-
term
un
empl
oyed
14
.72
.51
0.9
89
.18
9.3
48
.03
(5.6
2–1
1.4
7)
Shor
t-te
rmu
nem
ploy
ed1
8.8
7.6
4.6
74
.05
4.4
84
.40
(3.2
5–5
.95
)St
ude
nt
15
.92
9.0
1.0
30
.69
0.8
30
.88
(0.6
1–1
.28
)D
isab
ility
pen
sion
er6
.81
.87
.29
6.3
76
.39
5.2
3(3
.38
–8.0
9)
Con
scri
pt1
.22
.80
.80
0.7
90
.94
0.9
5(0
.41
–2.2
4)
Oth
eror
un
know
n1
5.3
4.9
5.8
93
.85
4.7
24
.17
(2.8
8–6
.05
)In
com
esu
bjec
tto
stat
eta
xati
onH
igh
est
quar
tile
8.4
18
.31
.00
1.0
01
.00
Th
ird
quar
tile
17
.62
3.9
1.6
10
.87
0.8
2(0
.56
–1.2
0)
Seco
nd
quar
tile
37
.92
2.8
3.6
30
.87
0.7
5(0
.50
–1.1
4)
Low
est
quar
tile
36
.13
4.9
2.2
60
.64
0.6
2(0
.39
–1.0
0)
Mar
ital
stat
us
Mar
ried
9.4
26
.11
.00
1.0
0Si
ngl
e8
2.4
70
.73
.24
1.9
0(1
.36
–2.6
6)
Div
orce
d7
.83
.16
.92
3.1
6(2
.01
–4.9
7)
Wid
owed
0.4
0.1
12
.16
6.3
5(1
.41
–28
.54
)Li
vin
gar
ran
gem
ents
Livi
ng
wit
hfa
mily
48
.67
9.2
1.0
01
.00
Livi
ng
alon
e5
1.4
20
.84
.03
2.6
7(2
.19
–3.2
5)
Odd
sra
tio
(OR
)sh
own
inbo
ldty
pe,P
<0
.05
.Un
ivar
iate
mod
el(m
odel
1)i
ncl
ude
son
lyon
eva
riab
leat
ati
me.
Mod
els
2–7
:all
mod
els
incl
ude
the
vari
able
ssh
own
inth
eco
lum
n,a
nd
are
adju
sted
for
age
and
regi
on.a 9
5%
con
fiden
cein
terv
als
for
OR
sin
the
final
mod
el(m
odel
7).
Socio-economic determinants of DUID 1451
© 2011 The Authors, Addiction © 2011 Society for the Study of Addiction Addiction, 106, 1448–1459

Tabl
e2
Th
eef
fect
sof
soci
o-ec
onom
icch
arac
teri
stic
son
driv
ing
un
der
the
influ
ence
of‘b
enzo
diaz
epin
eson
ly’a
mon
gm
enag
ed4
5or
over
.
OR
Cas
e%
n=
14
3C
ontr
ol%
n=
20
27
0U
niva
riat
em
odel
(mod
el1
)M
odel
2M
odel
3M
odel
4M
odel
5M
odel
6Fi
nalm
odel
(mod
el7
)(9
5%
CI)
a
Leve
lof
urb
aniz
atio
nR
ura
l1
6.1
22
.91
.00
1.0
01
.00
1.0
01
.00
1.0
01
.00
Sem
i-u
rban
23
.11
7.9
1.8
41
.87
1.8
61
.87
1.9
31
.95
1.8
9(1
.09
–3.2
8)
Urb
an6
0.8
59
.31
.46
1.4
91
.47
1.5
21
.58
1.6
01
.44
(0.8
8–2
.35
)Ed
uca
tion
Hig
h2
6.6
25
.51
.00
1.0
01
.00
1.0
01
.00
1.0
0In
term
edia
te3
5.0
32
.51
.03
1.0
70
.78
0.6
60
.63
0.6
3(0
.37
–1.0
8)
Bas
icor
un
know
n3
8.5
41
.90
.88
0.8
90
.64
0.4
70
.44
0.4
5(0
.26
–0.7
8)
Soci
o-ec
onom
icpo
siti
onU
pper
wh
ite-
colla
r1
5.4
17
.01
.00
1.0
01
.00
1.0
01
.00
Low
erw
hit
e-co
llar
14
.01
7.6
0.8
80
.99
0.9
20
.86
0.8
8(0
.46
–1.6
8)
Blu
e-co
llar
50
.34
1.9
1.3
31
.78
1.5
01
.34
1.2
8(0
.68
–2.4
3)
Entr
epre
neu
r1
8.2
18
.41
.09
1.4
61
.46
1.3
31
.36
(0.6
9–2
.67
)O
ther
oru
nkn
own
2.1
5.0
0.5
60
.74
0.3
90
.40
0.3
9(0
.11
–1.4
2)
Mai
nac
tivit
yEm
ploy
ed3
1.5
62
.91
.00
1.0
01
.00
1.0
0Lo
ng-
term
un
empl
oyed
7.0
4.9
2.8
23
.53
2.9
62
.35
(1.0
8–5
.09
)Sh
ort-
term
un
empl
oyed
4.9
4.8
2.0
52
.51
2.2
82
.17
(0.9
5–5
.00
)St
ude
nt
b1
.1b
bb
b
Dis
abili
type
nsi
oner
40
.61
2.5
6.5
19
.58
8.2
76
.88
(4.2
4–1
1.1
7)
Un
empl
oym
ent
pen
sion
er0
.71
.60
.86
1.4
31
.22
1.1
1(0
.14
–8.5
9)
Ret
irem
ent
pen
sion
er1
1.2
8.8
2.5
53
.73
3.2
62
.93
(0.9
4–9
.16
)O
ther
oru
nkn
own
4.2
3.5
2.8
34
.07
5.7
94
.80
(1.7
3–1
3.3
3)
Inco
me
subj
ect
tost
ate
taxa
tion
Hig
hes
tqu
arti
le2
3.1
39
.11
.00
1.0
01
.00
Th
ird
quar
tile
39
.23
4.2
1.9
41
.38
1.3
6(0
.10
–1.6
9)
Seco
nd
quar
tile
35
.72
1.6
2.7
91
.45
1.2
5(0
.68
–2.2
7)
Low
est
quar
tile
2.1
5.1
0.7
00
.46
0.4
1(0
.82
–2.2
6)
Mar
ital
stat
us
Mar
ried
44
.16
8.6
1.0
01
.00
Sin
gle
18
.21
6.0
1.7
70
.57
(0.3
0–1
.06
)D
ivor
ced
34
.31
3.6
3.9
31
.42
(0.8
2–2
.46
)W
idow
ed3
.51
.83
.00
1.0
9(0
.39
–3.0
5)
Livi
ng
arra
nge
men
tsLi
vin
gw
ith
fam
ily4
8.3
79
.01
.00
1.0
0Li
vin
gal
one
51
.72
1.0
4.0
33
.41
(2.0
5–5
.74
)
Odd
sra
tio
(OR
)sh
own
inbo
ldty
pe,P
<0
.05
.Un
ivar
iate
mod
el(m
odel
1)i
ncl
ude
son
lyon
eva
riab
leat
ati
me.
Mod
els
2–7
:all
mod
els
incl
ude
the
vari
able
ssh
own
inth
eco
lum
n,a
nd
are
adju
sted
for
age
and
regi
on.a 9
5%
con
fiden
cein
terv
als
for
OR
sin
the
final
mod
el(m
odel
7).
b No
case
s.
1452 Karoliina Karjalainen et al.
© 2011 The Authors, Addiction © 2011 Society for the Study of Addiction Addiction, 106, 1448–1459

Tabl
e3
Th
eef
fect
sof
soci
o-ec
onom
icch
arac
teri
stic
son
driv
ing
un
der
the
influ
ence
ofbe
nzo
diaz
epin
esan
dal
coh
olam
ong
un
der
45
-yea
r-ol
dm
en.
OR
Cas
e%
n=
88
8C
ontr
ol%
n=
44
90
3U
niva
riat
em
odel
(mod
el1
)M
odel
2M
odel
3M
odel
4M
odel
5M
odel
6Fi
nalm
odel
(mod
el7
)(9
5%
CI)
a
Mot
her
’sed
uca
tion
Hig
h8
.82
0.0
1.0
01
.00
1.0
01
.00
1.0
01
.00
1.0
0In
term
edia
te2
6.0
28
.52
.08
1.6
91
.63
1.5
91
.44
1.4
71
.45
(1.1
0–1
.92
)B
asic
oru
nkn
own
65
.25
1.5
2.8
82
.11
1.7
51
.70
1.1
71
.21
1.1
8(0
.89
–1.5
6)
Fath
er’s
edu
cati
onH
igh
8.0
19
.91
.00
1.0
01
.00
1.0
01
.00
1.0
01
.00
Inte
rmed
iate
19
.82
3.2
2.1
31
.79
1.6
31
.58
1.4
11
.42
1.4
1(1
.05
–1.8
9)
Bas
icor
un
know
n7
2.2
56
.93
.16
2.4
82
.03
1.9
61
.47
1.4
71
.44
(1.0
9–1
.92
)Le
velo
fu
rban
izat
ion
Ru
ral
14
.21
8.5
1.0
01
.00
1.0
01
.00
1.0
01
.00
1.0
0Se
mi-
urb
an1
4.9
16
.11
.21
1.2
61
.31
1.2
81
.34
1.3
71
.32
(1.0
1–1
.71
)U
rban
70
.96
5.4
1.4
11
.52
1.5
71
.54
1.4
01
.43
1.1
6(0
.94
–1.4
4)
Edu
cati
onH
igh
4.6
15
.81
.00
1.0
01
.00
1.0
01
.00
1.0
0In
term
edia
te2
6.6
43
.02
.12
2.4
21
.71
1.3
41
.26
1.1
2(0
.78
–1.6
1)
Bas
icor
un
know
n6
8.8
41
.15
.74
7.5
45
.35
3.8
33
.61
3.2
8(2
.30
–4.6
8)
Soci
o-ec
onom
icpo
siti
onU
pper
wh
ite-
colla
r2
.68
.71
.00
1.0
01
.00
1.0
01
.00
Low
erw
hit
e-co
llar
6.3
12
.01
.76
1.2
81
.16
1.1
01
.05
(0.6
2–1
.76
)B
lue-
colla
r3
6.4
26
.44
.62
2.3
91
.98
1.9
11
.75
(1.0
9–2
.81
)En
trep
ren
eur
2.8
5.6
1.6
80
.91
1.0
50
.93
1.0
2(0
.55
–1.8
8)
Oth
eror
un
know
n5
1.9
47
.23
.69
2.0
41
.27
1.1
81
.10
(0.6
9–1
.77
)M
ain
activ
ity
Empl
oyed
19
.75
1.5
1.0
01
.00
1.0
01
.00
Lon
g-te
rmu
nem
ploy
ed1
8.2
2.5
18
.95
13
.97
8.0
26
.71
(5.0
9–8
.83
)Sh
ort-
term
un
empl
oyed
24
.17
.68
.34
7.3
65
.86
5.7
3(4
.51
–7.2
7)
Stu
den
t1
2.6
29
.01
.14
0.8
50
.76
0.8
4(0
.62
–1.1
4)
Dis
abili
type
nsi
oner
4.9
1.8
7.2
55
.08
3.0
82
.48
(1.6
9–3
.63
)C
onsc
ript
0.5
2.8
0.4
30
.59
0.5
00
.52
(0.1
9–1
.43
)O
ther
oru
nkn
own
20
.04
.91
0.7
67
.43
6.2
95
.48
(4.1
4–7
.25
)In
com
esu
bjec
tto
stat
eta
xati
onH
igh
est
quar
tile
5.1
18
.31
.00
1.0
01
.00
Th
ird
quar
tile
10
.22
3.9
3.8
30
.86
0.8
1(0
.56
–1.1
8)
Seco
nd
quar
tile
47
.72
2.8
7.5
72
.30
1.9
2(1
.33
–2.7
6)
Low
est
quar
tile
36
.93
4.9
3.8
31
.36
1.2
5(0
.83
–1.8
8)
Mar
ital
stat
us
Mar
ried
10
.82
6.1
1.0
01
.00
Sin
gle
75
.97
0.7
2.5
91
.55
(1.2
1–1
.99
)D
ivor
ced
13
.03
.19
.97
4.2
0(3
.08
–5.7
4)
Wid
owed
0.3
0.1
9.2
14
.57
(1.2
5–1
6.6
9)
Livi
ng
arra
nge
men
tsLi
vin
gw
ith
fam
ily4
2.0
79
.21
.00
1.0
0Li
vin
gal
one
58
.02
0.8
5.2
73
.17
(2.7
1–3
.71
)
Odd
sra
tio
(OR
)sh
own
inbo
ldty
pe,P
<0
.05
.Un
ivar
iate
mod
el(m
odel
1)i
ncl
ude
son
lyon
eva
riab
leat
ati
me.
Mod
els
2–7
:all
mod
els
incl
ude
the
vari
able
ssh
own
inth
eco
lum
n,a
nd
are
adju
sted
for
age
and
regi
on.a 9
5%
con
fiden
cein
terv
als
for
OR
sin
the
final
mod
el(m
odel
7).
Socio-economic determinants of DUID 1453
© 2011 The Authors, Addiction © 2011 Society for the Study of Addiction Addiction, 106, 1448–1459

Tabl
e4
Th
eef
fect
sof
soci
o-ec
onom
icch
arac
teri
stic
son
driv
ing
un
der
the
influ
ence
ofam
phet
amin
espl
us
oth
erim
pair
ing
dru
gsam
ong
un
der
45
-yea
r-ol
dm
en.
OR
Cas
e%
n=
17
43
Con
trol
%n
=4
49
03
Uni
vari
ate
mod
el(m
odel
1)
Mod
el2
Mod
el3
Mod
el4
Mod
el5
Mod
el6
Fina
lmod
el(m
odel
7)
(95
%C
I)a
Mot
her
’sed
uca
tion
Hig
h1
1.5
20
.01
.00
1.0
01
.00
1.0
01
.00
1.0
01
.00
Inte
rmed
iate
31
.82
8.5
1.9
41
.80
1.6
91
.62
1.4
61
.50
1.4
9(1
.24
–1.8
0)
Bas
icor
un
know
n5
6.7
51
.51
.91
1.6
01
.26
1.2
30
.83
0.8
50
.86
(0.7
1–1
.05
)Fa
ther
’sed
uca
tion
Hig
h1
0.6
19
.91
.00
1.0
01
.00
1.0
01
.00
1.0
01
.00
Inte
rmed
iate
24
.42
3.2
1.9
81
.97
1.7
51
.66
1.4
61
.48
1.4
5(1
.19
–1.7
7)
Bas
icor
un
know
n6
5.0
56
.92
.14
2.1
61
.69
1.6
31
.15
1.1
61
.17
(0.9
7–1
.42
)Le
velo
fu
rban
izat
ion
Ru
ral
4.7
18
.51
.00
1.0
01
.00
1.0
01
.00
1.0
01
.00
Sem
i-u
rban
9.0
16
.12
.19
1.9
82
.08
2.0
82
.19
2.2
42
.14
(1.6
1–2
.84
)U
rban
86
.26
5.4
5.1
54
.18
4.3
24
.53
4.0
44
.11
3.2
2(2
.53
–4.0
9)
Edu
cati
onH
igh
1.4
15
.81
.00
1.0
01
.00
1.0
01
.00
1.0
0In
term
edia
te2
9.3
43
.07
.84
9.7
97
.06
5.1
54
.69
4.3
4(2
.83
–6.6
4)
Bas
icor
un
know
n6
9.3
41
.11
9.3
92
7.1
02
0.6
31
3.8
11
2.4
01
1.6
9(7
.64
–17
.87
)So
cio-
econ
omic
posi
tion
Upp
erw
hit
e-co
llar
1.9
8.7
1.0
01
.00
1.0
01
.00
1.0
0Lo
wer
wh
ite-
colla
r7
.91
2.0
3.0
21
.64
1.6
41
.52
1.4
7(0
.96
–2.2
4)
Blu
e-co
llar
36
.62
6.4
6.3
52
.53
2.5
22
.39
2.1
3(1
.44
–3.1
6)
Entr
epre
neu
r4
.55
.63
.66
2.3
23
.06
2.7
72
.83
(1.7
9–4
.49
)O
ther
oru
nkn
own
49
.14
7.2
4.7
71
.71
1.3
21
.21
1.1
3(0
.76
–1.6
6)
Mai
nac
tivit
yEm
ploy
ed1
9.4
51
.51
.00
1.0
01
.00
1.0
0Lo
ng-
term
un
empl
oyed
20
.12
.52
1.2
81
8.1
61
1.6
49
.59
(7.7
9–1
1.8
0)
Shor
t-te
rmu
nem
ploy
ed2
4.2
7.6
8.5
18
.48
6.8
46
.67
(5.5
8–7
.97
)St
ude
nt
9.9
29
.00
.91
0.6
80
.59
0.6
6(0
.52
–0.8
3)
Dis
abili
type
nsi
oner
2.5
1.8
3.7
43
.37
2.2
81
.67
(1.1
7–2
.38
)C
onsc
ript
0.9
2.8
0.8
31
.08
0.9
10
.92
(0.5
4–1
.59
)O
ther
oru
nkn
own
23
.04
.91
2.5
48
.68
7.2
66
.20
(5.0
4–7
.63
)In
com
esu
bjec
tto
stat
eta
xati
onH
igh
est
quar
tile
3.1
18
.31
.00
1.0
01
.00
Th
ird
quar
tile
12
.32
3.9
3.0
41
.56
1.4
4(1
.05
–1.9
7)
Seco
nd
quar
tile
44
.52
2.8
11
.55
2.9
02
.47
(1.8
1–3
.38
)Lo
wes
tqu
arti
le4
0.1
34
.96
.80
2.0
61
.99
(1.4
2–2
.79
)M
arit
alst
atu
sM
arri
ed7
.22
6.1
1.0
01
.00
Sin
gle
84
.17
0.7
4.3
32
.39
(1.9
4–2
.96
)D
ivor
ced
8.7
3.1
10
.11
3.7
6(2
.83
–5.0
1)
Wid
owed
b0
.1b
b
Livi
ng
arra
nge
men
tsLi
vin
gw
ith
fam
ily3
6.4
79
.21
.00
1.0
0Li
vin
gal
one
63
.62
0.8
6.6
63
.53
(3.1
4–3
.98
)
Odd
sra
tio
(OR
)sh
own
inbo
ldty
pe,P
<0
.05
.Un
ivar
iate
mod
el(m
odel
1)i
ncl
ude
son
lyon
eva
riab
leat
ati
me.
Mod
els
2–7
:all
mod
els
incl
ude
the
vari
able
ssh
own
inth
eco
lum
n,a
nd
are
adju
sted
for
age
and
regi
on.a 9
5%
con
fiden
cein
terv
als
for
OR
sin
the
final
mod
el(m
odel
7).
b No
case
s.
1454 Karoliina Karjalainen et al.
© 2011 The Authors, Addiction © 2011 Society for the Study of Addiction Addiction, 106, 1448–1459

Tabl
e5
Th
eef
fect
sof
soci
o-ec
onom
icch
arac
teri
stic
son
driv
ing
un
der
the
influ
ence
ofca
nn
abin
oids
plu
sot
her
impa
irin
gdr
ugs
(not
amph
etam
ines
)am
ong
un
der
45
-yea
r-ol
dm
en.
OR
Cas
e%
n=
45
2C
ontr
ol%
n=
44
90
3U
niva
riat
em
odel
(mod
el1
)M
odel
2M
odel
3M
odel
4M
odel
5M
odel
6Fi
nalm
odel
(mod
el7
)(9
5%
CI)
a
Mot
her
’sed
uca
tion
Hig
h1
9.7
20
.01
.00
1.0
01
.00
1.0
01
.00
1.0
01
.00
Inte
rmed
iate
31
.22
8.5
1.1
11
.04
1.0
10
.99
0.9
20
.92
0.9
3(0
.70
–.1
24
)B
asic
oru
nkn
own
49
.15
1.5
0.9
71
.07
0.9
20
.90
0.6
40
.66
0.6
7(0
.49
–0.9
0)
Fath
er’s
edu
cati
onH
igh
13
.91
9.9
1.0
01
.00
1.0
01
.00
1.0
01
.00
1.0
0In
term
edia
te2
9.6
23
.21
.83
1.9
81
.85
1.8
11
.64
1.6
41
.61
(1.1
7–2
.23
)B
asic
oru
nkn
own
56
.45
6.9
1.4
21
.99
1.7
31
.69
1.2
91
.28
1.2
8(0
.93
–1.7
6)
Leve
lof
urb
aniz
atio
nR
ura
l6
.91
8.5
1.0
01
.00
1.0
01
.00
1.0
01
.00
1.0
0Se
mi-
urb
an1
4.1
16
.12
.34
2.3
02
.36
2.3
42
.41
2.4
52
.41
(1.5
5–3
.74
)U
rban
79
.06
5.4
3.2
23
.07
3.1
73
.17
2.9
02
.93
2.5
0(1
.70
–3.6
8)
Edu
cati
onH
igh
1.5
15
.81
.00
1.0
01
.00
1.0
01
.00
1.0
0In
term
edia
te2
8.5
43
.06
.78
6.2
85
.12
3.8
53
.67
3.3
5(1
.52
–7.3
5)
Bas
icor
un
know
n6
9.9
41
.11
7.3
91
5.0
11
2.6
39
.90
10
.03
9.4
4(4
.30
–20
.71
)So
cio-
econ
omic
posi
tion
Upp
erw
hit
e-co
llar
2.4
8.7
1.0
01
.00
1.0
01
.00
1.0
0Lo
wer
wh
ite-
colla
r6
.21
2.0
1.8
41
.01
1.0
40
.98
0.9
3(0
.45
–1.9
1)
Blu
e-co
llar
28
.62
6.4
3.8
61
.60
1.6
31
.57
1.4
1(0
.74
–2.7
0)
Entr
epre
neu
r2
.25
.61
.41
0.9
51
.15
1.1
21
.20
(0.4
9–2
.90
)O
ther
oru
nkn
own
60
.54
7.2
4.5
71
.20
1.0
61
.05
0.9
7(0
.52
–1.8
4)
Mai
nac
tivit
yEm
ploy
ed2
2.1
51
.51
.00
1.0
01
.00
1.0
0Lo
ng-
term
un
empl
oyed
11
.02
.51
0.1
48
.81
6.8
45
.74
(3.8
0–8
.65
)Sh
ort-
term
un
empl
oyed
21
.07
.66
.46
5.5
95
.53
5.4
9(3
.98
–7.5
7)
Stu
den
t2
1.0
29
.01
.69
0.7
60
.85
0.8
9(0
.62
–1.2
9)
Dis
abili
type
nsi
oner
4.0
1.8
5.3
04
.44
3.4
92
.70
(1.5
5–4
.72
)C
onsc
ript
1.8
2.8
1.5
01
.17
1.2
91
.30
(0.6
1–2
.78
)O
ther
oru
nkn
own
19
.04
.99
.08
5.1
95
.82
5.1
4(3
.53
–7.4
8)
Inco
me
subj
ect
tost
ate
taxa
tion
Hig
hes
tqu
arti
le4
.41
8.3
1.0
01
.00
1.0
0T
hir
dqu
arti
le1
1.9
23
.92
.07
0.9
70
.90
(0.5
3–1
.52
)Se
con
dqu
arti
le3
9.4
22
.87
.15
1.4
81
.31
(0.7
8–2
.22
)Lo
wes
tqu
arti
le4
4.2
34
.95
.25
0.8
70
.89
(0.5
0–1
.58
)M
arit
alst
atu
sM
arri
ed4
.02
6.1
1.0
01
.00
Sin
gle
92
.27
0.7
8.4
53
.74
(2.2
6–6
.19
)D
ivor
ced
3.8
3.1
7.8
44
.18
(2.0
9–8
.37
)W
idow
edb
0.1
bb
Livi
ng
arra
nge
men
tsLi
vin
gw
ith
fam
ily4
9.6
79
.21
.00
1.0
0Li
vin
gal
one
50
.42
0.8
3.8
92
.70
(2.1
8–3
.34
)
Odd
sra
tio
(OR
)sh
own
inbo
ldty
pe,P
<0
.05
.Un
ivar
iate
mod
el(m
odel
1)i
ncl
ude
son
lyon
eva
riab
leat
ati
me.
Mod
els
2–7
:all
mod
els
incl
ude
the
vari
able
ssh
own
inth
eco
lum
n,a
nd
are
adju
sted
for
age
and
regi
on.a 9
5%
con
fiden
cein
terv
als
for
OR
sin
the
final
mod
el(m
odel
7).
b No
case
s.
Socio-economic determinants of DUID 1455
© 2011 The Authors, Addiction © 2011 Society for the Study of Addiction Addiction, 106, 1448–1459

married and living alone were associated independentlywith DUI of benzodiazepines only.
Own education, SEP, main activity and income werethe main mediating factors between different socio-economic variables and DUI of benzodiazepines, as wellas in other substance groups. This means that adding oneof these variables reduced the independent effect of othervariables. For example, the effect of mother’s educationon DUID was mediated fully by the subject’s own educa-tion, SEP and main activity (Table 1, model 5). Similarly,in a univariate model the OR for basic own education wasmore than four times as high when compared to a higheducation level, but the effect attenuated especially afteradjusting for SEP (model 4) and for main activity (model5). Conversely, urban environment was not mediated byother variables, as it maintained its effect on DUID, i.e. theORs remained at the same level throughout modelling.
Among under 45-year-old women as well as amongmen and women aged 45 or over, disability pension wasan important independent predictor (see final models inTable 2 and in Supporting information; Tables S2–S3).Furthermore, among younger women unemployment,divorce and living alone predicted DUID, among oldermen long-term unemployment, ‘other’/unknown mainactivity and living alone predicted DUID, and amongolder women being an entrepreneur, divorced or widowedhad the same effect. Surprisingly, high education wasassociated with DUI of ‘benzodiazepines only’ amongolder men (Table 2, final model) and women.
Benzodiazepines with alcohol
Among under 45-year-old men suspected of DUI of ben-zodiazepines with alcohol the effects of socio-economiccharacteristic and mediating mechanisms were verysimilar to those among under 45-year-old men with ben-zodiazepines only, with a couple of exceptions: parents’educational level had a stronger effect, and lower incomewas an independent predictor (Table 3, final model) ofDUI of benzodiazepines with alcohol.
Unemployment and disability pension were indepen-dent risk factors of DUI of benzodiazepines with alcoholamong under 45-year-old women and among men andwomen aged 45 or over (see Supporting information;Tables S4–S6). In addition, among younger women DUIDwas also associated independently with urban environ-ment, lower education, ‘other’/unknown main activity,not being married and living alone. Among oldermen, unemployment and retirement pension, ‘other’/unknown main activity, being divorced and living alonepredicted DUID. High education was a risk factor for DUIDamong older men and women, as in the ‘benzodiazepinesonly’ group. In addition, among older men an upperwhite-collar SEP predicted DUID.
Amphetamines plus other impairing drugs
Among under 45-year-old men the effect of urban envi-ronment on DUI of amphetamines was strong, as wasthe effect of lower education (Table 4). Compared to othersubstance groups, this was the only group where beingan entrepreneur predicted DUID. The independent effectof a disability pension was not strong and the risk of DUIDwas lower among students than in the reference group.
The results among under 45-year-old women andmen aged 45 or over were very similar compared toyounger men in this amphetamines group (see Support-ing information; Tables S7–S8). Similarly, the results inthe group of ‘amphetamines only’ were highly similarwhen compared to the group of ‘amphetamines plusother impairing drugs’ (data not shown). There were notenough cases to perform an analysis among older womenwith amphetamines findings.
Cannabinoids plus other impairing drugs(not amphetamines)
Among under 45-year-old men suspected of DUI ofcannabinoids (Table 5), the effects of socio-economicvariables were similar compared to amphetaminesusers: urban environment and especially low educationwere associated highly with DUID, and disability pensionwas not a strong predictor of DUID compared to thebenzodiazepines group. However, among the group of‘cannabinoids only’, fewer socio-economic factors wereassociated with DUID compared to the group of ‘cannab-inoids plus other impairing drugs’ (data not shown).
Analyses concerning cannabinoids could not be per-formed in other age and gender groups due to the smallnumber of cases (n = 0–17).
DISCUSSION
Main findings
The main findings of this study were as follows: regard-less of substance group, the strongest predictors of DUIDwere low education, unemployment, disability pensionand living alone (especially when being divorced); theseeffects prevailed even when the effects of other socio-economic factors were taken into account. Most differ-ences between substance, gender and age groups wereseen in the strength of the associations between differentsocio-economic factors and DUID. Amphetamines andcannabinoids, i.e. illicit drug users, seemed to be the mostdisadvantaged group. Surprisingly, among men aged 45or over, high education in both benzodiazepines groupsand a high SEP in benzodiazepines with alcohol groupwas associated with DUID when other factors were heldconstant. This was an opposite result compared to otherage and substance groups.
1456 Karoliina Karjalainen et al.
© 2011 The Authors, Addiction © 2011 Society for the Study of Addiction Addiction, 106, 1448–1459

Our finding that the factors indicating lower socio-economic position were significant predictors of DUID isin accordance with results from other studies concerninglicit or illicit drug use. Finnish problem drug users(mainly opiate or stimulant users) are usually sociallymarginalized: drug treatment clients in 2008 weremainly single (62%), unemployed (64%) and had loweducation (70%) [30]. Numerous other studies haveshown that lower social status predicts benzodiazepineuse [16–20], as well as amphetamines [9,10] and otherillicit drug use [31].
The effect of many socio-economic characteristicspredicting DUID remained even when confounding vari-ables were held constant, but these associations were alsomediated by other socio-economic factors. The mostimportant mediating factors in all substance groupsexamined were education, SEP, main activity and income,the effects of which overlapped. For example, in univari-ate models the higher risk of DUID among lower-incomegroups was not caused by the amount of income per se,but lower income reflected lower socio-economic positionand lower employment status, which predicted DUID.Similarly, parents’ educational level had only a minorindependent effect on DUID; it was mediated almost fullyby characteristics indicating DUID suspects’ own socio-economic position. Thus, the effect of parents’ educationwas significant, but indirect; parents’ education influ-enced DUID suspects’ own education and socio-economicposition which, in turn, was a risk factor for DUID. Livingarrangements and marital status also overlapped. Maritalstatus was not as important a predictor of DUID if theperson had some kind of family (e.g. a spouse, children orparents) in the same household.
Although the socio-economic characteristics predict-ing DUID and the mediating mechanisms were verysimilar among all substance groups examined, some dif-ferences could be observed, especially between the benzo-diazepines (prescription drugs, in that sense licit) andamphetamines/cannabinoids (illicit drugs) groups. First,living in an urban or semi-urban municipality had astronger effect on DUI of illicit drugs than benzodiaz-epines. This was expected, as illicit drugs are more readilyavailable in urban than rural areas.
Secondly, although SEP, main activity and incomemediated the effect of education, as in the benzodiaz-epines groups, the association between lower educationand DUI of illicit drugs remained extremely high. Oneexplanation may be that drug experiments are initiated ata relatively young age [32], and experiments leading tosubstance abuse probably have an effect on school atten-dance and level of education. Indeed, experimenting withor use of any drugs (including amphetamines andcannabinoids) have been found to be more common invocational schools than in upper secondary schools [33].
In addition, we found that students had a lower risk forDUI of amphetamines. Most of the students in the datawere aged more than 18 years, which means that theyare primarily college/university students.
Thirdly, the effect of disability pension was muchstronger in the benzodiazepines groups. This finding is inaccordance with Norwegian longitudinal studies, whichhave shown that benzodiazepines are used extensivelyamong disability pensioners [34,35].
All in all, the users of illicit drugs were the most dis-advantaged, whereas the social status of ‘benzodiaz-epines only’ cases seemed to be better. This was expected,as benzodiazepines are a legal prescription drug, and thusa finding for ‘benzodiazepines only’ does not necessarilyindicate drug abuse.
Although lower socio-economic status was shown topredict benzodiazepine use among general populations,we found that a higher SEP and a higher educational levelwere risk factors for DUID among benzodiazepines usersaged 45 or over. This was an unexpected result. One expla-nation might be that a person who is more educated witha higher SEP and who ends up driving under the influencemay be more capable of seeking medical help for theirproblems. Inequalities in the usage of medical servicesexist in Finland—medical services are more likely to beused by groups with a higher socio-economic status [36].
We did not know whether benzodiazepines used byDUID suspects were used legally (according to a prescrip-tion) or illegally. However, having a prescription for ben-zodiazepines does not necessarily mean that they are notabused. Subjects driving under the influence of benzodi-azepines attracted police attention, which indicatesimpaired driving caused possibly by the abuse of benzo-diazepines. Finland has the highest use of benzodiaz-epines compared to other Nordic countries [37], and inFinland benzodiazepines are used widely both among thegeneral population [38] and among substance abusers[29,39]. Extensive use of benzodiazepines could also beseen in our results. These findings raise the questions ofwhether the prescription policy of benzodiazepines inFinland is too loose, and whether it should be controlledmore strictly, particularly when considering the problemscaused by benzodiazepine use, such as development oftolerance and dependence, and the symptoms of with-drawal caused by abrupt cessation [40].
In addition to drugged drivers, our results provideinformation about drug users in general. We found DUIDsuspects to be socially disadvantaged, even though somesubgroups of drug users are likely to be even more disad-vantaged with, for example, no access to cars. Hence, theresults of our study are in accordance with other studiesof drug users. Initiatives designed to reduce or eliminateinequalities in general among different socio-economicgroups would also benefit drug users and drugged drivers.
Socio-economic determinants of DUID 1457
© 2011 The Authors, Addiction © 2011 Society for the Study of Addiction Addiction, 106, 1448–1459

Because most drug use is initiated in adolescence andmost of the drugged drivers are young, preventive workand early interventions against intoxicant use amongyouth are crucial.
Limitations and strengths
The DUID cases studied became a part of this study’sdatabase because they were suspected and apprehended ofDUID by the police. Not all people driving under the influ-ence are caught; only fewer than 10% of the cases werefound in random control by the police, while the rest wereapprehended because of impaired driving or a trafficaccident. Hence, the most impaired drivers were over-represented. Therefore, the results need to be generalizedwith caution, and they do not represent overall druggeddriving in traffic flow. It should also be noted that the firstapprehension does not necessarily mean or prove that theDUID suspect was driving under the influence for the firsttime. Thus, although socio-economic characteristics wereexamined in the preceding year of the first apprehension,the direction of causality remains unclear in this study.
The data studied were based on two registers that werelinked by personal ID numbers. With register data a largesample size is relatively easy to gather, and thus sufficientpower can be reached. This type of linked register data isinternationally unique, and the good coverage and valid-ity of several Finnish registers [24] increases reliability.
CONCLUSION
In conclusion, a disadvantaged social background was asignificant predictor of DUID in all substance groups,although there was a gradient, so that amphetaminesand cannabinoids users were the most disadvantagedcompared to users of benzodiazepines.
Declarations of interest
Connection with tobacco, alcohol, pharmaceutical orgaming industry: Jari Haukka has been in research col-laborations with Janssen-Cilag and Eli Lilly, and has beena member of the expert advisory group for Astellas.
Acknowledgements
The authors wish to thank the Academy of Finland(grant no. 118563), Emil Aaltonen’s Foundation andDoctoral Programs in Public Health (DPPH) for theirfinancial support.
References
1. Ogden E. J., Moskowitz H. Effects of alcohol and other drugson driver performance. Traffic Inj Prev 2004; 5: 185–98.
2. Walsh J. M., Flegel R., Atkins R., Cangianelli L. A., Cooper C.,Welsh C. et al. Drug and alcohol use among drivers admitted
to a Level-1 trauma center. Accid Anal Prev 2005; 37: 894–901.
3. Movig K. L., Mathijssen M. P., Nagel P. H., van Egmond T., deGier J. J., Leufkens H. G. et al. Psychoactive substance useand the risk of motor vehicle accidents. Accid Anal Prev2004; 36: 631–6.
4. Skurtveit S., Christophersen A. S., Grung M., Morland J.Increased mortality among previously apprehendeddrunken and drugged drivers. Drug Alcohol Depend 2002;68: 143–50.
5. Hausken A. M., Skurtveit S., Christophersen A. S. Mortalityamong subjects previously apprehended for driving underthe influence of traffic-hazardous medicinal drugs. DrugAlcohol Depend 2005; 79: 423–9.
6. Karjalainen K., Lintonen T., Impinen A., Mäkelä P., Rah-konen O., Lillsunde P. et al. Mortality and causes of deathamong drugged drivers. J Epidemiol Commun Health 2010;64: 506–12.
7. World Health Organization. Closing the Gap in a Generation:Health Equity through Action on the Social Determinants ofHealth. Final Report of the Comission on Social Determinants ofHealth. Geneva: World Health Organization; 2008.
8. Mackenbach J. P., Stirbu I., Roskam A. J., Schaap M. M.,Menvielle G., Leinsalu M. et al. Socioeconomic inequalitiesin health in 22 European countries. N Engl J Med 2008;358: 2468–81.
9. Degenhardt L., Coffey C., Carlin J. B., Moran P., Patton G. C.Who are the new amphetamine users? A 10-year prospec-tive study of young Australians. Addiction 2007; 102:1269–79.
10. Degenhardt L., Coffey C., Moran P., Carlin J. B., Patton G. C.The predictors and consequences of adolescent amphet-amine use: findings from the Victoria Adolescent HealthCohort Study. Addiction 2007; 102: 1076–84.
11. Fergusson D. M., Boden J. M. Cannabis use and later lifeoutcomes. Addiction 2008; 103: 969–76.
12. Guichard A., Lert F., Calderon C., Gaigi H., Maguet O.,Soletti J. et al. Illicit drug use and injection practicesamong drug users on methadone and buprenorphine main-tenance treatment in France. Addiction 2003; 98: 1585–97.
13. Du W. J., Xiang Y. T., Wang Z. M., Chi Y., Zheng Y., Luo X. N.et al. Socio-demographic and clinical characteristics of3129 heroin users in the first methadone maintenancetreatment clinic in China. Drug Alcohol Depend 2008; 94:158–64.
14. Wu E., El-Bassel N., Gilbert L., Piff J., Sanders G. Sociodemo-graphic disparities in supplemental service utilizationamong male methadone patients. J Subst Abuse Treat 2004;26: 197–202.
15. Fischer B., Rehm J., Brissette S., Brochu S., Bruneau J.,El-Guebaly N. et al. Illicit opioid use in Canada: comparingsocial, health, and drug use characteristics of untreatedusers in five cities (OPICAN study). J Urban Health 2005; 82:250–66.
16. Laurier C., Dumas J., Gregoire J.-P. Factors related to benzo-diazepine use in Quebec—a secondary analysis of surveydata. J Pharmacoepidemiol 1992; 2: 73–86.
17. Swartz M., Landerman R., George L. K., Melville M. L.,Blazer D., Smith K. Benzodiazepine anti-anxiety agents:prevalence and correlates of use in a southern community.Am J Public Health 1991; 81: 592–6.
18. Blennow G., Romelsjo A., Leifman H., Leifman A., KarlssonG. Sedatives and hypnotics in Stockholm: social factors andkinds of use. Am J Public Health 1994; 84: 242–6.
1458 Karoliina Karjalainen et al.
© 2011 The Authors, Addiction © 2011 Society for the Study of Addiction Addiction, 106, 1448–1459

19. Magrini N., Vaccheri A., Parma E., D’Alessandro R., BottoniA., Occhionero M. et al. Use of benzodiazepines in theItalian general population: prevalence, pattern of use andrisk factors for use. Eur J Clin Pharmacol 1996; 50: 19–25.
20. Fang S. Y., Chen C. Y., Chang I. S., Wu E. C., Chang C. M., LinK. M. Predictors of the incidence and discontinuation oflong-term use of benzodiazepines: a population-basedstudy. Drug Alcohol Depend 2009; 104: 140–6.
21. Walsh G. W., Mann R. E. On the high road: driving under theinfluence of cannabis in Ontario. Can J Public Health 1999;90: 260–3.
22. Vaez M., Laflamme L. Impaired driving and motor vehiclecrashes among Swedish youth: an investigation into drivers’sociodemographic characteristics. Accid Anal Prev 2005;37: 605–11.
23. Harrison L. The validity of self-reported drug use in surveyresearch: an overview and critique of research methods.NIDA Res Monogr 1997; 167: 17–36.
24. Gissler M., Haukka J. Finnish health and social welfare reg-isters in epidemiological research. Norsk Epidemiol 2004;14: 113–20.
25. Ministry of Justice, Finland. Drunken driving and aggra-vated drunken driving. 23:3-4§.Took effect 1.2.2003. Avail-able from http://www.finlex.fi/pdf/saadkaan/E8890039.PDF (accessed 3 May 2011; archived by Webcite at http://www.webcitation.org/5yPKMXg3h).
26. Statistics Finland. Työssäkäynti [Employment] [Cited 20May 2010]. 2010. Available at: http://www.tilastokeskus.fi/meta/til/tyokay.html (Archived by WebCite® at: http://www.webcitation.org/5pracQZco).
27. Karjalainen K., Lintonen T., Impinen A., Mäkelä P., Rah-konen O., Lillsunde P. et al. Mortality and causes of deathamong drugged drivers. J Epidemiol Commun Health 2009;64: 506–12.
28. Impinen A., Rahkonen O., Karjalainen K., Lintonen T.,Lillsunde P., Ostamo A. Substance use as a predictor ofdriving under the influence (DUI) rearrests. A 15-year ret-rospective study. Traffic Inj Prev 2009; 10: 220–6.
29. Karjalainen K., Lintonen T., Impinen A., Lillsunde P.,Ostamo A. Poly-drug findings in drugged driving casesduring 1977–2007. J Subst Use 2010; 15: 143–56.
30. Ruuth P., Väänänen T. Päihdehuollon Huumeasiakkaat 2008[Drug-User Clients in Services for Substance Abusers in 2008].14/2009. Tilastoraportti: National Institute for Health andWelfare; 2009.
31. Stenbacka M., Allebeck P., Brandt L., Romelsjo A. Intrave-nous drug abuse in young men: risk factors assessed in alongitudinal perspective. Scand J Soc Med 1992; 20: 94–101.
32. Hibell B., Guttormsson U., Ahlström S., Balakireva O., Bjar-nason T., Kokkevi A. et al. The 2007 ESPAD Report—Substance Use Among Students in 35 European Countries.Stockholm, Sweden: The Swedish Council for Informationon Alcohol and Other Drugs (CAN); 2009.
33. National Institute for Health and Welfare. Kouluterveysky-sely 2008–2009 [School Health Promotion Study 2008–2009]. National Institute for Health and Welfare [Cited20 May 2010]. 2010. Available at: http://info.stakes.fi/kouluterveyskysely/FI/tulokset/valtak.htm (Archived byWebCite® at: http://www.webcitation.org/5prbWOtwE).
34. Hartz I., Tverdal A., Skille E., Skurtveit S. Disability pensionas predictor of later use of benzodiazepines among benzo-diazepine users. Soc Sci Med 2010; 70: 921–5.
35. Hartz I., Lundesgaard E., Tverdal A., Skurtveit S. Disabilitypension is associated with the use of benzodiazepines 20
years later: a prospective study. Scand J Public Health 2009;37: 320–6.
36. van Doorslaer E., Masseria C., Koolman X. Inequalities inaccess to medical care by income in developed countries.Can Med Assoc J 2006; 174: 177–83.
37. Nordic Medico Statistical Committee. Medicines Consumptionin the Nordic Countries 1999–2003. Copenhagen:NOMESCO; 2004.
38. National Agency for Medicines. Lääkekulutus vuosina 2005–2008 [Drug consumption in years 2005–2008] [Cited 20May 2010]. 2009. Available at: http://raportit.nam.fi/raportit/kulutus/laakekulutus.htm (Archived by WebCite®at: http://www.webcitation.org/5prd1toky).
39. Nuorvala Y., Metso L., Kaukonen O., Haavisto K. Muuttuvapäihdeasiakkuus. Päihdetapauslaskennat 1987–2003[Changes in intoxicant-related cases. Survey of intoxicant-related cases in health and social services in Finland 1987–2003]. Yhteiskuntapolitiikka 2004; 69: 608–18.
40. Bateson A. N. Basic pharmacologic mechanisms involved inbenzodiazepine tolerance and withdrawal. Curr Pharm Des2002; 8: 5–21.
Supporting Information
Additional Supporting Information may be found in theonline version of this article:
Table S1. Socio-economic characteristics among casesand controls by age group and gender.
Table S2. The effects of socio-economic characteristics ondriving under the influence of ‘benzodiazepines only’among under 45-year-old women.
Table S3. The effects of socio-economic characteristics ondriving under the influence of ‘benzodiazepines only’among women aged 45 or over.
Table S4. The effects of socio-economic characteristics ondriving under the influence of benzodiazepines andalcohol among under 45-year-old women.
Table S5. The effects of socio-economic characteristics ondriving under the influence of benzodiazepines andalcohol among men aged 45 or over.
Table S6. The effects of socio-economic characteristics ondriving under the influence of benzodiazepines andalcohol among women aged 45 or over.
Table S7. The effects of socio-economic characteristics ondriving under the influence of amphetamines plus otherimpairing drugs among under 45-year-old women.
Table S8. The effects of socio-economic characteristics ondriving under the influence of amphetamines plus otherimpairing drugs among men aged 45 or over.
Please note: Wiley-Blackwell are not responsible for thecontent or functionality of any supporting materials sup-plied by the authors. Any queries (other than missingmaterial) should be directed to the corresponding authorfor the article.
Socio-economic determinants of DUID 1459
© 2011 The Authors, Addiction © 2011 Society for the Study of Addiction Addiction, 106, 1448–1459