social resilience to climate- related disasters in ancient ... · social resilience to...
TRANSCRIPT
Social Resilience to Climate-Related Disasters in AncientSocieties: A Test of TwoHypothesesPeter N. Peregrine
SFI WORKING PAPER: 2017-17-024
SFIWorkingPaperscontainaccountsofscienti5icworkoftheauthor(s)anddonotnecessarilyrepresenttheviewsoftheSantaFeInstitute.Weacceptpapersintendedforpublicationinpeer-reviewedjournalsorproceedingsvolumes,butnotpapersthathavealreadyappearedinprint.Exceptforpapersbyourexternalfaculty,papersmustbebasedonworkdoneatSFI,inspiredbyaninvitedvisittoorcollaborationatSFI,orfundedbyanSFIgrant.
©NOTICE:Thisworkingpaperisincludedbypermissionofthecontributingauthor(s)asameanstoensuretimelydistributionofthescholarlyandtechnicalworkonanon-commercialbasis.Copyrightandallrightsthereinaremaintainedbytheauthor(s).Itisunderstoodthatallpersonscopyingthisinformationwilladheretothetermsandconstraintsinvokedbyeachauthor'scopyright.Theseworksmayberepostedonlywiththeexplicitpermissionofthecopyrightholder.
www.santafe.edu
SANTA FE INSTITUTE
SOCIAL RESILIENCE TO CLIMATE-RELATED DISASTERS
IN ANCIENT SOCIETIES: A TEST OF TWO HYPOTHESES
Peter N. Peregrine
Lawrence University, Appleton, WI 54911 and the Santa Fe Institute, Santa Fe, NM 87501
Abstract
Current literature on disaster response argues that societies providing greater local participation
in decision-making and which have more community coordination and governance organizations
are more resilient to climate-related disasters. In contrast, recent research in psychology has
argued that societies with tighter social norms and greater enforcement of those norms are more
resilient. This paper tests whether one or both of these seemingly competing perspectives can be
empirically supported through an examination of the diachronic impact of climate-related
disasters on ancient societies. A cross-cultural research design and a sample of 33
archaeologically-known societies bracketing 22 catastrophic climate-related disasters are used to
test two hypotheses about resilience to climate-related disasters. The paper finds that societies
allowing greater political participation appear to provide greater resilience to catastrophic
climate-related disasters, generally supporting the predominant perspective in contemporary
disaster response.
1
1. Introduction 1
This paper tests two hypotheses about social resilience to climate-related disasters using 2
data from ancient societies. The paper is in no way unique in using archaeological data to 3
examine the societal impact of natural disasters or mechanisms of social resilience (e.g. Cooper 4
and Sheets 2012; Fisher, Hill, and Feinman 2009; Hegmon et al. 2008; Redman 2005), but it is 5
unique in doing so using cross-cultural comparison of ancient societies throughout the world. A 6
strength of cross-cultural comparison using archaeological data is that it allows one to test 7
whether or not an assumed predictive condition actually precedes its assumed effects; that is, 8
whether a society with the predictive condition empirically changes in the predicted manner over 9
time (Peregrine 2001, 2004; Smith and Peregrine 2012). If a predictor of social resilience to 10
climate-related disasters can be identified and applies to societies of varying scales and 11
complexities throughout human history, then there is good reason to believe that it can be used to 12
create interventions applicable today (see also Cooper and Sheets 2012; Hegmon et al. 2008; 13
Redman 2012; Redman and Kinzig 2003; Van de Noort 2011). 14
Social resilience here refers to the ability of a social system to absorb disturbances while 15
retaining the same basic structures and abilities to respond to further disturbances (see Parry et 16
al. 2007: 37, also Holling 1973: 17). There are numerous ways to more specifically define types 17
or processes of resilience (Davidson et al. 2016). In this paper the definition used is commonly 18
called “resistance” or “adaptability” which refers to the capacity of a social system “to 19
successfully avoid crossing into an undesirable system regime, or to succeed in crossing back to 20
into a desirable one” following a disaster (Walker, Holling, Carpenter and Kinzig 2004). This is 21
opposed to “transformative resilience”, which refers to the capacity of a social system “to create 22
a fundamentally new system” following a disaster (Walker, Holling, Carpenter and Kinzig 23
2
2004). It must be noted that scalar issues are important to these definitions of resilience, as 24
change is always occurring in social systems. These two forms of resilience focus on what occurs 25
at the system level—does the system change in order to maintain fundamental social structures, 26
or are those structures fundamentally transformed in order to allow the system to continue 27
(Redman and Kinzig 2003)? 28
In addition, this paper focuses on catastrophic climate-related disasters—those that are 29
caused by climatic events and disrupt an entire society. Disasters caused by geological processes, 30
human-derived environmental degradation, asteroid strikes, or the like (e.g. Jusseret, Langohr, 31
and Sintubin 2013; Gunn 2000; Sheets 2012; van der Leeuw et al. 2005) are not considered here 32
as they are not examined in the literature on societal tightness, discussed below. In addition, only 33
“catastrophic” events, defined by Lorenz and Dittmer (2016:37) as “devastating events which 34
encompass entire societies” are focused on, as opposed to less far-reaching “disasters” or 35
localized “emergencies” (Lorenz and Dittmer 2016). This focus is due to the limitations of the 36
archaeological and paleoenvironmental records. These are important points to keep in mind 37
when considering the paper’s results. 38
a. Social Resilience 39
There is a vast and growing literature on social resilience to disaster. The concept of 40
resilience has its roots in ecology and the basic idea that the ability to withstand shocks should be 41
seen through the lens of organisms operating within a complex adaptive system (e.g. Redman 42
and Kinzig 2003; Meerow, Newell, and Stults 2016). The basic concepts of resilience were first 43
developed in a seminal paper by C.S. Holling (1973) and in the ensuing forty years Holling’s 44
ideas have grown into an active but extremely diverse set of specific theories about resilience 45
(Folke 2006). Two major themes have become the subject of increasing discussion in the 46
3
literature on social resilience to climate-related disasters. The first is the importance of 47
“vulnerability”—that the impact of a climate-related disaster is in part socially created because 48
societies frequently build structures (both social and physical) that exacerbate the impact of 49
disaster (e.g. Comfort, Boin, and Demchack 2010; Tierney 2014). The second is that more 50
“flexible” social structures (again, both social and physical) are more resilient to climate-related 51
disasters than more “rigid” social structures (e.g. Aldrich 2012; Holling et al. 2002; Kahn 2005; 52
Paton 2006)—a perspective referred to as “flexibility theory” in this paper. Both of these themes 53
suggest that flexibility or freedom to adapt are a key to social resilience to climate-related 54
disasters (Hegmon et al. 2008; Redman 2005; Redman and Kinzig 2003). 55
In contrast, Gelfand and colleagues (Gelfand et al. 2011; Harrington and Gelfand 2014; 56
Roos et al. 2015) have recently put forward the theory that societies facing frequent natural 57
disasters and hazards (climate-related disasters as well as conflict and epidemic disease) will 58
tend to develop strong social norms and high levels of intolerance to deviance. They argue that 59
strong social norms provide societies with opportunities for greater coordination to deal 60
effectively with disasters (Gelfand et al. 2011:1101). As Roos et al. (2015:14) put it, “we expect 61
societies evolve to have stronger norms for coordinating social interaction because they are 62
necessary for survival” in the face of either natural disasters or manmade threats (such as 63
invasion). Gelfand and colleagues find strong support for what is referred to in this paper as 64
“tightness theory” of social resilience in a study of 33 nations (Gelfand et al. 2011), of the 50 65
United States (Harrington and Gelfand 2014), and in evolutionary game theory (Roos et al. 66
2015). However, “tightness theory” has not been tested in small-scale societies or non-67
Westphalian states, nor has it been examined in the context of catastrophic climate-related 68
disasters. 69
4
While both “flexibility theory” and “tightness theory” focus on social adaptations to 70
dynamic conditions, they put forward contrasting ideas about the social roots of resilience to 71
climate-related disasters. “Flexibility theory” envisions broad political participation, open lines 72
of communication, and fluid mechanisms of coordination as the key to resilience. “Tightness 73
theory” envisions strong norms of behavior fostering well-coordinated responses as key. 74
b. Hypotheses 75
Measuring societal tightness-looseness is relatively straightforward, as the concept is 76
well-defined and already has clear and robust measures (see the Supplemental Material in 77
Gelfand et al. 2011). But measuring flexibility in social structures is more difficult (Lebel et al 78
2006). For this paper the widely-employed continuum from more corporate- to more network-79
oriented polities (Blanton et al. 1996) is to measure societal flexibility (in the remainder of this 80
paper I use the term “exclusionary” in place of network following Feinman 2010). More 81
corporate-oriented societies have more inclusive and participatory political structures while in 82
more exclusionary-oriented societies elites control access to political authority and allow only 83
limited political participation. 84
Measuring social flexibility through the corporate-exclusionary continuum may not have 85
obvious face validity, but the link between participation in political decision-making and social 86
flexibility is well-established in the disaster resilience literature through the concept of 87
“participative capacity”. Participative capacity refers to the ability of local actors to influence 88
decision-making (Lorenz and Dittmer 2016: 47-48). As Redman (2005:72; also Redman and 89
Kinzig 2003) put it “management has to be flexible, working at scales that are compatible with 90
the scales of critical ecosystem and social functions.” Because those scales range from local to 91
societal, participation has to be equal at all those levels. A key element in participative capacity 92
5
is control and flow of information. In more resilient social systems horizontal (that is, between 93
individuals operating on similar scales) information flow appears more important than vertical 94
flow so that control of information at high levels in a hierarchical system may lead to less 95
resilience (Redman and Kinzig 2003). Because key definitional elements of the corporate-96
exclusionary continuum focus on both these features—participation in decision making and 97
control over information and material flows—it would seem that the corporate-exclusionary 98
continuum should be a good proxy measure for societal flexibility, at least as it is thought of 99
within “flexibility theory”. 100
Using the corporate-exclusionary and tightness-looseness continuums as the independent 101
variables, and accepting the definition of social resilience put forward above, the two hypotheses 102
to be tested in this paper are: 103
Hypothesis 1: Societies with more corporate political strategies are more resilient to 104
catastrophic climate-related disasters. 105
Hypothesis 2: Societies with tighter adherence to social norms are more resilient to 106
catastrophic climate-related disasters. 107
It should be noted that these hypothesis are rather specific. They focus only on catastrophic and 108
climate-related disasters. They do not take into account potential differences in “vulnerability” 109
among the societies that are tested, nor disasters that are small-scale or involve non-climatic 110
events. These are limitations, but they are necessary to match the manner in which the second 111
hypothesis was tested in the literature on modern nations (Gelfand et. al. 2011; Harrington and 112
Gelfand 2014) and the available archaeological and paleoenvironmental records. On the other 113
hand, the hypotheses themselves require evaluating whether pre-existing social conditions 114
impact resilience, which itself can be taken as a measure of vulnerability. 115
6
2. Methods 116
a. Sample 117
The sample used here is a bit unusual and requires some preliminary explanation. 118
Because this study is focused on resilience to climate-related disasters, the sample is one based 119
on climate-related disasters rather than disasters involving geological processes, human-induced 120
environmental degradation, or the like. It is important to note before continuing that what is 121
being termed a “disaster” in this study is what would be termed a “catastrophe” in the disaster 122
resilience literature; that is, an event or series of events that lead to societal-wide disruption 123
rather than a smaller-scale “disaster” or “emergency” (Lorenz and Dittmer 2016). Within the 124
archaeological context this may reflect a period of repeated climate-related disasters (e.g. 125
sequential years of drought or flooding) and not just a single event. Not all societies have 126
experienced a catastrophic climate-related disasters, and not all of them have been the focus of 127
archaeological research that could provide adequate data for examining resilience, so the sample 128
had to be selected based on specific criteria rather than on random sampling. Those criteria were 129
(1) a specific region or site that has been the focus of extensive archaeological research; and that 130
(2) has been subjected to at least one catastrophic climate-related disaster that can be clearly 131
identified in both the geological and archaeological record (and, again, what is visible in the 132
archaeological and geological record is often a time period of repeated climate-related disasters 133
rather than a single catastrophic event); and that (3) is spatially and culturally distinct from other 134
cases in the sample in order to minimize the likelihood of autocorrelation (a formal analysis of 135
autocorrelation effects could not be conducted here because the linguistic data normally used as a 136
control is lacking for most archaeological cases). 137
7
To address the first sampling criterion preference was given to cases included in eHRAF 138
Archaeology (ehrafarchaeology.yale.edu), a repository of primary and secondary source 139
documents that have been indexed for content to the paragraph level and thus provides rapid 140
access to specific information in the repository documents. To address the second sampling 141
criterion only cases that have been discussed in the archaeological literature as having been 142
subject to one or more catastrophic climate-related disasters were considered (except for the 143
Ontario Peninsula and Northern Europe, which were chosen as a control cases for the analyses). 144
And to address the third sampling criterion cases were sought from different culture areas of the 145
world. Because the cases are from different culture areas and are spatially segregated, 146
autocorrelation should be minimized (again, a formal test could not be conducted using a 147
linguistic control, and a test employing location as a control is unnecessary as the cases are so 148
distant from one another). In the end 22 distinct catastrophic climate-related disasters impacting 149
societies in 9 regions were selected for coding (Figure 1). Individual cases coded consisted of 150
those archaeologically-known societies inhabiting a specific region impacted by the disaster; 151
with one case representing the time period within 100 years before the disaster, and another the 152
time period within 100 years after the disaster (only the period preceding the disaster is analyzed 153
in this paper, as predictive conditions are the focus of this paper). The sample cases are listed in 154
Table 1, which also lists the focal communities and time periods as typically defined in local 155
chronologies (the time periods coded are within these local chronological periods), and the 156
catastrophic climate-related disasters that impacted the cases. 157
[Table 1 about here] 158
[Figure 1 about here] 159
b. Coding Process 160
8
Coding followed the general protocol used in most cross-cultural research (Ember and 161
Ember 2009). Developing the codebook was done in an iterative fashion. All measures were pre-162
tested against sample cases, tested for reliability, and revised until reliable codes and a clear 163
coding protocol were achieved. A total of 163 variables were coded, though only a small number 164
of them are used in the analyses presented here. The final edition of the codebook along with the 165
coded data are archived at the HRAF Advanced Research Center (hrafarc.org). 166
The coding process itself was done on electronic forms (also archived at the HRAF 167
Advanced Research Center) by students who had been trained for the task but were unaware of 168
the hypotheses to be tested (naïve coders in the terminology of cross-cultural research). Two 169
coders first read through documents in eHRAF Archaeology on a focal site or region and time 170
period as specified for a given case, then copied passages relating to each variable in the 171
codebook, and arrived at a preliminary code. They then met to identify disagreements in coding, 172
and when disagreements were found, they read through each other’s collected passages to 173
determine if they missed some information. Usually the coders came to an agreed code based on 174
their combined reading and recording of the source materials. When they did not, the variable 175
was coded as having missing or conflicting data (in rare instances the coders agreed on a 176
“resolved” code to which one or both disagreed, but that both agreed should not be coded as 177
missing or conflicting). 178
It is important to note that coders were only to use data for the focal region during the 179
focal time period, which was the 100-year period before or the 100-year period following a given 180
climate-related disaster. There were rare occasions where data were not available within that 181
narrow range, and in those cases the focal time period was expanded to include the time periods 182
typically used within a local archaeological chronology. Similarly, focal regions did not always 183
9
have sufficient data to code all the variables, and the rare cases when additional data were 184
required coders were allowed to look at nearby sites with better data on the variable being coded. 185
The assumption is that these expansions of focal dates and regions added random error to the 186
coded data rather than any systematic bias, as each coder decided individually when to look 187
beyond the focal region and time period, so they were not systematically altering a case’s 188
parameters. 189
c. Variables 190
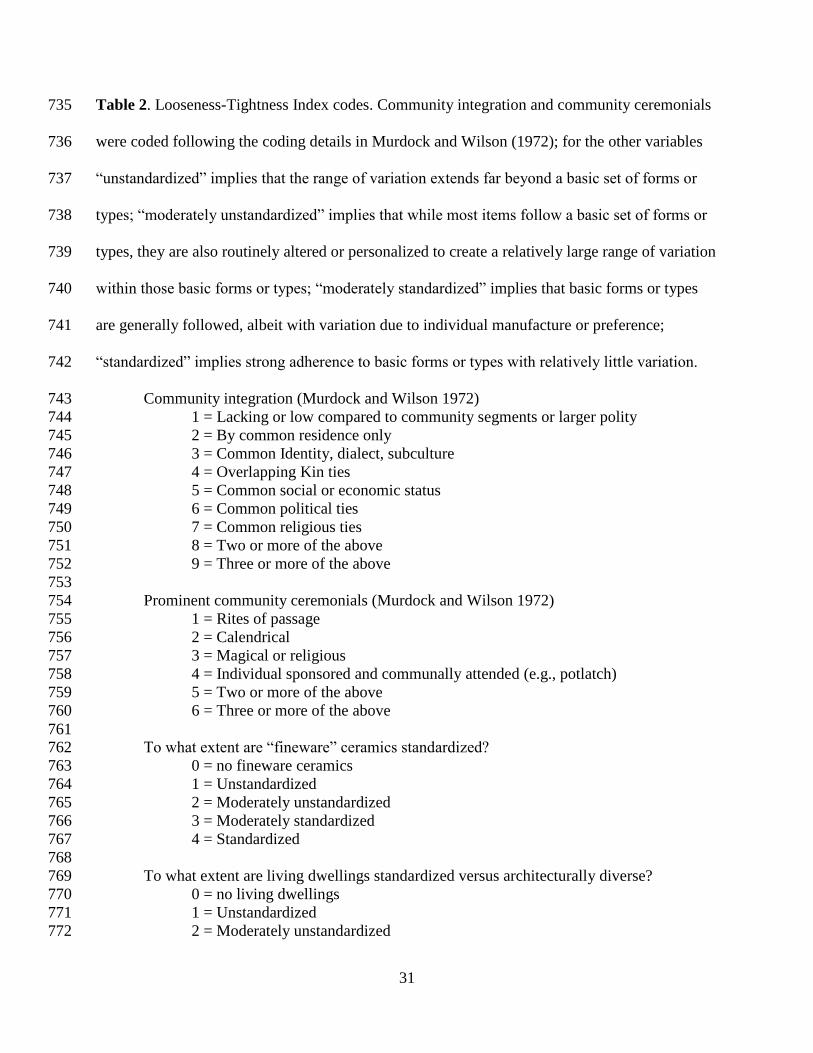
Two independent variables were derived from the raw coded data. The first is the 191
“Looseness-Tightness Index” which measures the degree to which a society has strongly 192
enforced social norms (Gelfand et al. 2011; Gelfand and Harrington 2014). The index was 193
constructed in consultation with Gelfand and is calculated as the average standardized scores on 194
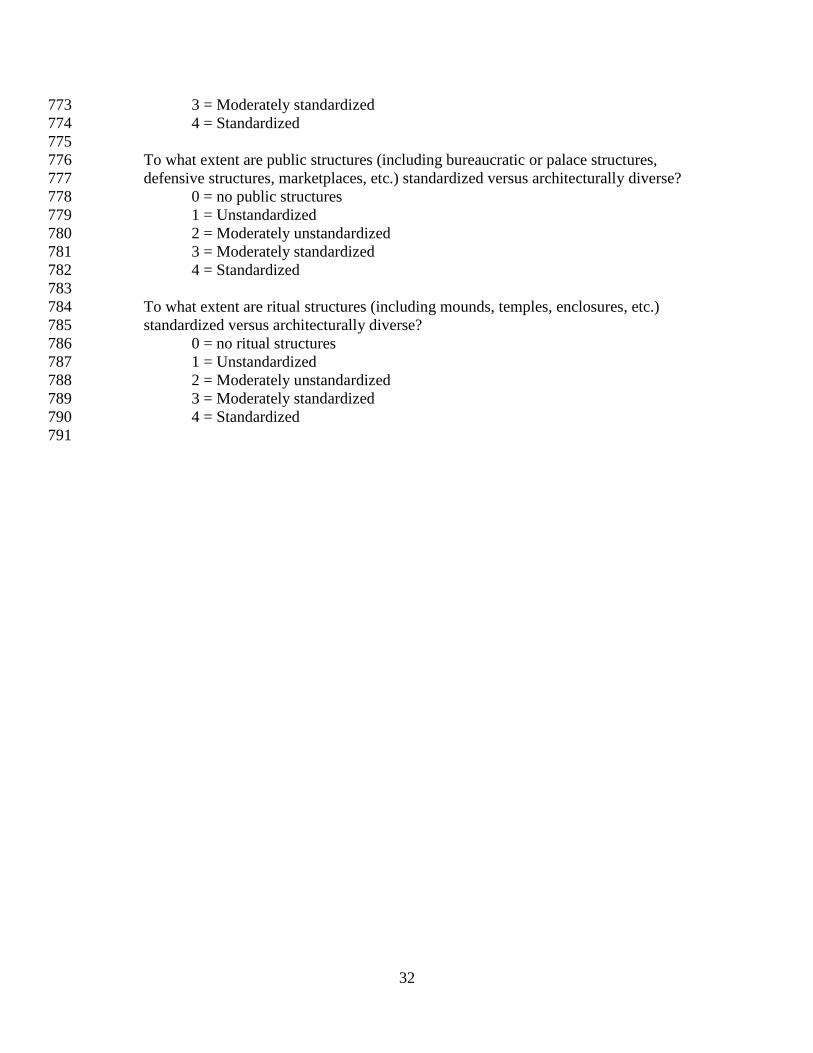
the six variables listed in Table 2. The first two variables are intended to be proxy measures for 195
the potential number of social norms present in a given society. The remaining four variables are 196
intended as direct material indicators of the degree to which there appears to be adherence to 197
social norms. It is expected that societies with lower scores on this index tend to have fewer 198
strongly enforced norms and greater tolerance for violations of them. Societies with higher 199
scores are expected to have more strongly enforced norms and less tolerance for violations of 200
them. 201
[Table 2 about here] 202
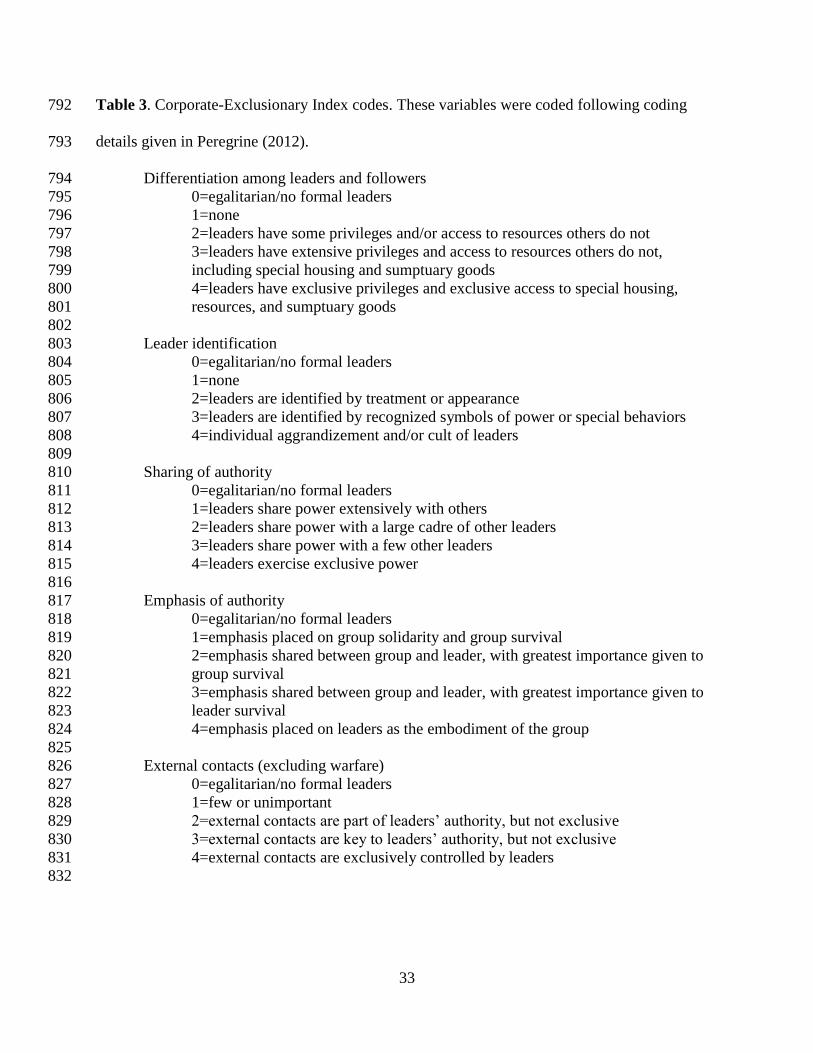
The second independent variable is the “Corporate-Exclusionary Index” which measures 203
the degree to which the political agents control access to political authority (Blanton et al. 1996). 204
The index was constructed as the average standardized scores on the five variables listed in 205
Table 3, and is described in more detail by Peregrine (2008, 2012) and Peregrine and Ember 206
10
(2016). In brief, the index measures the degree to which political agents encourage or discourage 207
political participation and interaction with external polities. In more corporate societies, which 208
score lower on the scale, agents encourage members of the society to participate in political 209
activities, share authority broadly, and allow greater interaction with outsiders. The opposite is 210
true in more exclusionary societies, where agents control access to political authority, share it 211
only among a small group of peers, and prevent most members of society to interact with 212
outsiders. The index measure for the corporate-exclusionary continuum employed here has been 213
used to code archaeological data in several previous research projects that have produced 214
statistically robust results (Peregrine 2008, 2012; Peregrine and Ember 2016). 215
[Table 3 about here] 216
The indexes comprising the two independent variables are statistically robust. The 217
Looseness-Tightness Index has an alpha of .863 (6 items) and all the variables that comprise it 218
correlate to a single factor explaining 61% of the variance. The Corporate-Exclusionary Index 219
has an alpha of .978 (5 items) and all the variables that comprise it correlate to a single factor 220
explaining 92% of the variance. It is interesting to note that the two indexes correlate (r = .844, p 221
< .000), although not entirely surprising. One of the features of more exclusionary political 222
strategies is control over prestige objects and symbols of power. This control would translate, in 223
the material record at least, into the appearance of greater adherence to social norms. However, 224
the indexes separate into two factors with little overlap following varimax rotation, suggesting 225
that they do tap into somewhat different societal properties. 226
The dependent variables reflect the social impact of a specific catastrophic climate-227
related disaster on seven areas: population, health and nutrition, conflict, household organization, 228
village organization, regional organization, and communal ritual, all coded on a 3-point none, 229
11
some, much scale. These were coded based on the change observed in related variables coded for 230
the time period before the climate-related disaster versus those for the time period following. 231
Greater stability in the dependent variables is assumed to indicate resilience, following the 232
definition presented earlier. It should be noted that these variables were originally coded on a 233
five-point scale from significant decrease to significant increase, thus identifying the direction of 234
change rather than simply whether or not change occurred. The variables were recoded into the 235
three point scale used here because (1) a number of the relationships turned out to be curvilinear, 236
and recoding solved this issue; and (2) since the hypotheses are related to stability and not the 237
direction of change, the recoding did not impact the hypothesis tests, and indeed may be more 238
appropriate than the original coding. 239
As discussed above, climate-related disasters were coded as reflecting either individual 240
events or periods of repeated disasters resulting in catastrophic impact. Despite considerable 241
work in reconstructing paleoclimate and paleoenvironment (e.g. Coats et al. 2015; Cook et al. 242
2016; Rein et al. 2005; Stahle et al. 2016), there remains much work to be done to link specific 243
events with the archaeological record (but see, e.g., Douglas et al. 2015; Hegmon et al. 2008; 244
Macklin et al. 2013; Medina-Elizalde and Rohling 2012; Munoz et al. 2015; Sandweiss et al. 245
2009; Weiss 2000). For this reason it was from the archaeological literature that many of the 246
climate-related disasters were identified. These disasters are commonly discussed in the 247
framework of settlement interruption or destruction, or of large-scale community and regional 248
reorganization. Thus the variables chosen to describe the impact of climate-related disasters map 249
onto what are often the archaeologically-identifiable features of such disasters. 250
One might be appropriately concerned that identifying climate-related disasters in this 251
way would create a self-fulfilling prophecy—that climate-related disasters cause changes in 252
12
social organization that are, in themselves, the things that lead archaeologists to identify climate-253
related disasters—but that concern is not wholly warranted. Each case where a climate-related 254
disaster was suggested in the archaeological literature was independently verified through 255
geological markers in order to be included in the sample, so these are “true” disasters, pointed at 256
through the archaeological record, but geologically confirmed. That these disasters impacted the 257
coded archaeological cases in an obvious way is not a serious problem for this study, as the focus 258
here is on social resilience as indicated by variation in change and the degree to which that 259
variation can be predicted by the independent variables. 260
3. Results 261
Two hypotheses were tested using the data produced through the methodology described 262
above. Hypothesis 1 was that societies with more inclusive and participatory political structures 263
are more resilient to climate-related disasters than are societies in which leaders tightly control 264
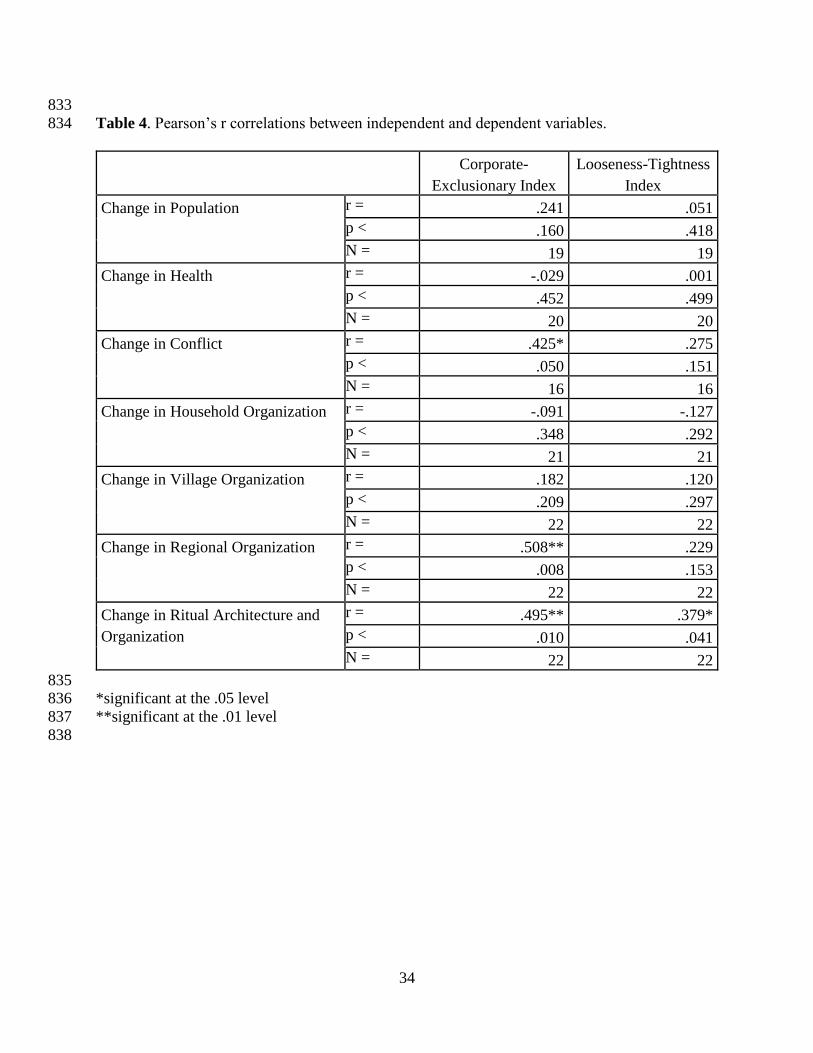
access to political authority. Table 4 presents the results of Pearson’s one-tailed correlations 265
between the Corporate-Exclusionary Index and the seven dependent variables. One-tailed 266
correlations are employed because the hypothesized relationships are directional. There appears 267
to be modest support for Hypothesis 1. All but one of the correlations are in the expected 268
direction and Conflict, Regional Organization, and Communal Ritual appear to be significantly 269
more stable if a society has a more corporate political system preceding a climate-related 270
disaster. This would suggest that having a more corporately-oriented political organization tends 271
to minimize conflict following a disaster and to preserve core structures of both regional 272
organization and the public rituals that bond groups into social units. 273
[Table 4 about here] 274
13
Hypothesis 2 was that societies with tighter adherence social norms are more resilient to 275
climate-related disasters than are societies with looser adherence to social norms. Table 4 also 276
presents the results of Pearson’s one-tailed correlations between the Looseness-Tightness Index 277
and the seven dependent variables. The results of Pearson’s correlations in Table 4 indicate 278
minimal support for Hypothesis 2. Only one correlations statistically significant, and it is in the 279
direction opposite to that hypothesized. Indeed, all but one of the correlations are in the direction 280
opposite to that hypothesized. One thus must reject Hypothesis 2 and conclude that adherence to 281
social norms does not appear to provide meaningful resilience to climate-related disasters. 282
These results suggest that societies with more inclusive political structures tend to be 283
more resilient to catastrophic climate-related disasters in terms of internal conflict, regional 284
organization, and community ritual. These results support the basic tenants of “flexibility theory” 285
(e.g. Lebel et al. 2006; Norris et al. 2008). On the other hand, the results do not offer much 286
support for “tightness theory”, at least as applied to catastrophic climate-related disasters. This is 287
somewhat surprising, as “tightness theory” has been empirically supported through studies of 33 288
nations and of all 50 of the United States (Gelfand et al. 2011; Harrington and Gelfand 2014). 289
There are, however, a number of reasonable explanations for these differing results. First, this 290
study and the two conducted by Gelfand and colleagues are on different scales: this study 291
examines a much longer time scale and a much wider range of societal forms. As pointed out by 292
Davidson and colleagues (2016), strategies of resilience may differ between domains of impact 293
(i.e. urban or community versus socio-ecological), and Lorenz and Dittmer (2016) argue that 294
different scales of impact (i.e. societal wide versus community) may also require different 295
strategies of resilience. It may also be that tightness provides more social resiliency in 296
Westphalian nation-states but does not do so in smaller-scale societies and archaic states. 297
14
A second explanation for why this study and those by Gelfand and colleagues come to 298
different conclusions is because this study focuses on catastrophic climate-related disasters rather 299
than the more episodic ones used in the tightness studies. Gelfand and colleagues focus on 300
climate-related disasters of much smaller scales than the ones considered here. The disasters they 301
consider are such things as floods, tornadoes, droughts, and the like, which might impact 302
individual communities or regions within a society, but do not have societal-wide impact (see 303
Harrington and Gelfand 2014:7992; also Lorenz and Dittmer 2016:37). So, what may be 304
reflected in these results is that flexibility provides greater social resiliency to catastrophic 305
climate-related disasters while tightness provides greater resiliency to smaller-scale disasters. 306
This itself is an interesting finding and warrants further investigation. While the archaeological 307
and paleoenvironmental record may preclude systematic testing of the relationship between the 308
Corporate-Exclusionary Index and smaller episodic disasters and emergencies, the Tightness-309
Looseness Index can be examined in relation to recent catastrophic climate-related disasters to 310
determine if the results of this study are replicated in modern nation-states. 311
In any case, the conclusion that societies with more inclusive political structures are more 312
socially resilient to catastrophic climate-related disasters must be received cautiously for at least 313
two reasons. First, the sample size is small, and given the limitations created by the sampling 314
criteria, it is entirely possible that the sample represents an atypical segment of the range of 315
variation in societies that have experienced catastrophic climate-related disasters. Second, 316
despite our best efforts to create a strict protocol, the concepts coded do not always have 317
unambiguous archaeological indicators, and thus variables coded were of necessity coarse-318
grained. With these problems one would assume the resulting data would contain considerable 319
random error. Being random, however, this error is unlikely to have created a false relationship 320
15
between two variables (Type II error), but rather to make it more difficult to find true 321
relationships (Type I error). Thus one would expect that finding support for Hypothesis 1 would 322
be difficult given the coarseness of the data. But support was found for some of the variables, 323
and for that reason the coarseness of the data may not have been as serious a problem as 324
anticipated (although it may have prevented the identification of relationships in the other 325
variables), or the relationships are so strong that the random error inherent in these coarse data 326
did not mask them (cf. Loken and Gelman 2017). 327
4. Conclusions 328
While there are obvious problems in the methods and data employed here, the potential 329
of cross-cultural research using the archaeological record far outweighs those problems, for in 330
cross-cultural research we have a powerful method through which archaeology can be made 331
obviously relevant for understanding, and perhaps addressing, contemporary social problems 332
(Hegmon et al. 2008; Sheets 2012). Because diachronic comparative archaeology allows one to 333
test causality across a range of cases, one can reasonably assume that the results are 334
generalizable to many historical and cultural contexts. Not only does this provide a powerful test 335
for the various theories about social resilience, but it also provides an excellent foundation for 336
policy decisions, as results are likely not restricted to a particular time or place, but reflect more 337
general patterns of human behavior, patterns that can be employed as the basis for both 338
evaluating general hypotheses and for developing practical interventions. The archaeological 339
record has not ordinarily been examined in such a way that it will produce such generalizable 340
conclusions to support both basic research and policy development (but see Cooper and Sheets 341
2012; Fisher, Hill, and Feinman 2009; Hegmon et al. 2008; Van de Noort 2011). Beyond adding 342
16
to our understanding of social resilience, my hope is that this project may lead others to explore 343
historical questions with policy implications in a manner that produces generalizable results. 344
Humans have faced catastrophic climate-related disasters many times, and because of 345
climate change it is likely that we will face such disasters within the time scale of this study (100 346
years). The results of this study suggest that to become more socially resilient to the catastrophic 347
climate-related disasters we can anticipate developing through climate change societies should 348
promote policies that encourage citizens to actively participate in governance and decision-349
making (Lebel et al. 2006). Such policies would appear to provide greater flexibility in decision 350
making, the ability to communicate information and responses at appropriate scales, and perhaps 351
to provide the entire response system with a broader range of knowledge to guide decisions (also 352
see Fitzhugh 2012; Norris et al. 2008:142-144). This flexibility appears to have fostered social 353
resilience in ancient societies at a variety of scales and in a variety of socio-ecological contexts, 354
and thus there appears to be no a priori reason to assume that this would not be true for 355
contemporary societies. Policies that increase political participation and communication across 356
all social scales should be promoted by those seeking to foster a world more resilient to the 357
catastrophic climate-related disasters expected in the next century. 358
This conclusion tends to support current directions in disaster response policy and 359
practice, which is re-thinking the established “command and control” approach to disaster 360
response (e.g. Handmer and Dovers 2007; see also Baker 2016) in favor of one that gives more 361
weight to local actors, initiatives, and organizations, particularly those that encourage local 362
engagement in decision making (Cretney 2016; Norris et al. 2008; Singh-Peterson et al. 2015). 363
As Cretney (2016:37) puts it, this approach encourages “relationships between community 364
organizations and higher-level governance institutions that allow for communities to take some 365

17
level of ownership and control” over disaster response. An emphasis on local participation in 366
decision making and implementation is expected in more corporately-oriented polities, and thus 367
the findings presented here support this approach to disaster response. Similarly, current 368
literature on the socio-cultural aspects of disaster resilience suggests that “social capital” in the 369
form of such things as community empowerment, collaboration, and appreciation of diversity are 370
important facets of social resilience (Gil-Rivas and Kilmer 2016; Kasdan 2016; Yoon, Kang, and 371
Brody 2016). While not directly tied to corporate political strategies, these concepts are related. 372
As Gil-Rivas and Kilmer (2016:1323) explain, in order to build resilience “Participation in 373
decision-making and planning processes is critical...community members (both leaders and 374
residents) need to have meaningful involvement.” Such involvement is at the core of societies 375
with more corporately-oriented political strategies. Thus this study serves as an empirical 376
confirmation of the potential efficacy of current approaches to disaster response policy and 377
practice in minimizing the impact of the catastrophic climate-related disasters we can anticipate 378
climate change will produce in the next century. 379
Acknowledgements 380
Research presented here was conducted as part of the Natural Hazards and Cultural 381
Transformations project funded by the National Science Foundation (Award # SMA-1416651) 382
and supported through the HRAF Advanced Research Center (hrafARC) at Yale University. The 383
author wishes to thank the hard-working students who coded the data used here: Joseph Bazydlo, 384
Megan Davidson, and Kristina Verhasselt. The author also wishes to thank Carol R. Ember, 385
Michele Gelfand, Eric Jones and Ann Kinzig for their insightful comments and criticisms on 386
earlier drafts of this paper. 387
18
References 388
Aldrich, D. 2012: Building Resilience: Social Capital in Post-Disaster Recovery, University of 389
Chicago Press. 390
Baker, N., 2016: “Making it worse than what really happened”: Social chaos and preparedness as 391
problematic mythologies in disaster communication. Front. Commun. 1, Article 2, doi: 392
10.3389/fcomm.2016.00002. 393
Coats, S., B. Cook, J. Smerdon, and R. Seager, 2015: North American pancontinental droughts in 394
model simulations of the last millennium, J. Climate 28, 2025-2043. 395
Comfort, L., A. Boin, and C. Demchack, 2010: Designing Resilience: Preparing for Extreme 396
Events. University of Pittsburgh Press. 397
Cook, B., E. Cook, J. Smerdon, R. Seager, and A. P. Williams, 2016: North American 398
megadroughts in the common era: Reconstructions and simulations, Wiley Interdiscip. 399
Rev.: Climate Change 7, 411-432. 400
Cooper, J. and P. Sheets, 2012: Surviving Sudden Environmental Change: Answers from 401
Archaeology. University of Colorado Press. 402
Cretney, R. M., 2016: Local responses to disaster: The value of community led post disaster 403
response action in a resilience framework, Disaster Prevent. Manage. 25, 27-40. 404
Davidson, J.L., C. Jackson, A. Lyth, A. Dedekorkut-Howes, C. Baldwin, et al. 2016: 405
Interrogating resilience: Toward a typology to improve its operationalization, Ecol. Soc. 406
21(2), Article 12, http://dx.doi.org/10.5751/ES-08450-210227. 407
deMenocal, P. 2001: Cultural responses to climate change during the Late Holocene, Science 408
292, 667-673. 409
19
Dillehay, T. and A. Kolata. 2004: Long-term human response to uncertain environmental 410
conditions in the Andes. PNAS 101, 4325-4330. 411
Douglas, P., M. Pagani, M. Canuto, M. Brenner, D. Hodell, T. Eglington, and J. Curtis, 2015: 412
Drought, agricultural adaptation, and sociopolitical collapse in the Maya Lowlands. 413
PNAS 112, 5607-5612. 414
Ember, C.R. and M. Ember. 2009: Cross-Cultural Research Methods, Second Edition, AltaMira. 415
Etayo-Cadavid, M., C.F. Andrus, K. Jones, G. Hodgins, D. Sandweiss, S. Uceda-Castillo, and J. 416
Quilter. 2013: Marine radiocarbon reservoir age variation in Donax obesulus shells from 417
northern Peru: Late Holocene evidence for extended El Niño, Geology 41, 599-602. 418
Feinman, G. 2010: Comparative frames for the diachronic analysis of complex societies: Next 419
steps, in The Comparative Archaeology of Complex Societies, M.E. Smith, Ed., 420
Cambridge University Press, 21-43. . 421
Fisher, C. T., Hill, J. B. and Feinman, G. M. 2009: The Archaeology of Environmental Change: 422
Socionatural Legacies of Degradation and Resilience. University of Arizona Press. 423
Fitzhugh, B. 2012: Hazards, impacts, and resilience among hunter-gatherers of the Kuril Islands, 424
in Surviving Sudden Environmental Change, J. Cooper and P. Sheets, Eds., University 425
Press of Colorado, 19-42. 426
Folke, C. 2006: Resilience: The emergence of a perspective for socio-ecological systems 427
analysis, Global Environ. Change, 16, 253-267. 428
French, C. 2010: The paleo-environments of Bronze Age Europe, in Organizing Bronze Age 429
Societies, T. Earle and K. Kristiansen, Eds., Cambridge University Press, 34-56. 430
Gelfand, M., J.L. Raver, L. Nishii, L. Leslie, J. Lun, et al. 2011: Differences between tight and 431
loose cultures: A 33-nation study, Science 332(6033), 1100-1104. 432
20
Gil-Rivas, V. and R.P. Kilmer. 2016: Building community capacity and fostering disaster 433
resilience, J. Clin. Psych. 72, 1318-1332. 434
Gunn, J.D. 2000: The Years Without Summer; Tracing AD 536 and its Aftermath, BAR 435
International Series 872. 436
Handmer, J.W. and S. Dovers. 2007: The Handbook of Disaster and Emergency Policies and 437
Institutions, Earthscan. 438
Harrington, J. and M. Gelfand. 2014: Tightness-looseness across the 50 United States, PNAS 439
111(22), 7990-7995. 440
Hassan, F. 1997: Nile floods and political disorder in early Egypt, in Third Millennium BC 441
Climate Change and Old World Collapse, (NATO ASI Series 149), H. Nüzhet Dalfes, G. 442
Kukla, and H. Weiss, Eds., Springer, 1-23. 443
Hegmon, M., M. Peeples, A. Kinzig, S. Kulow, C. Meegan, and M. Nelson. 2008: Social 444
transformations and its human costs in the Prehispanic U.S. Southwest, Amer. Anthro. 445
110, 313-324. 446
Holling, C.S. 1973: Resilience and stability of ecological systems, Annu. Rev. Ecol. Syst. 4, 1-23 447
Holling, C.S., L. Gunderson, and G. Peterson. 2002: Sustainability and Panarchy, in Panarchy: 448
Understanding Transformations in Human and Natural Systems L. Gunderson and C.S. 449
Holling, Island Press, 63-102. 450
Huckleberry, G. and B. Billman. 2003: Geoarchaeological insights gained from surficial 451
geological mapping, Middle Moche Valley, Peru, Geoarchaeology 18, 505-521. 452
Jusseret, S., C. Langohr, and M. Sintubin. 2013: Tracking earthquake archaeological evidence in 453
Late Minoan IIIB (~1300-1200 BC) Crete (Greece): A proof of concept, Bull. Seismol. 454
Soc. Am. 103, 3026-2043. 455
21
Parry, M.L., O.F. Canziani, J.P. Palutikof, P.J. van der Linden and C.E. Hanson. 2007: 456
Contribution of Working Group II to the Fourth Assessment Report of the 457
Intergovernmental Panel on Climate Change. Cambridge University Press 458
Kahn, M. 2005: The death toll from natural disasters: The role of income, geography, and 459
institutions, Rev. Econ. Stat. 87, 271-284. 460
Kasdan, D.O. 2016: Considering socio-cultural factors of disaster risk management, Disaster 461
Prevent. Manage. 25, 464-477. 462
Lebel, L., J. Anderies, B. Campbell, C. Folke, S. Harfield-Dodds, T. Hughes, and J. Wilson. 463
2006: Governance and the capacity to manage resilience in regional social-ecological 464
systems, Ecol. Soc. 11(1), Article 19, http//www.ecologyandsociety.org/vol11/iss1/art19. 465
Loken, E. and A. Gelman. 2017: Measurement error and the replication crisis. Science 355, 584-466
585. 467
Lorenz, D. and C. Dittmer. 2016: Resilience in catasrophes, disasters, and emergencies, in New 468
Perspectives on Resilience in Socio-Economic Spheres, A. Maurer, Ed., Springer VS, 25-469
59. 470
Norris, F., S. Stevens, B. Pfefferbaum, K. Wyche and R. Pfefferbaum. 2008: Community 471
resilience as a metaphor, theory, set of capacities, and strategy for disaster readiness, 472
Amer. J. Community Psych. 41, 127-150. 473
Macklin, M.G., J.C. Woodward, D.A. Welsby, G.A.T. Duller, F.M. Williams, and M.A.J. 474
Williams. 2013: Reach-scale river dynamics moderate the impact of rapid Holocene 475
climate change on floodwater farming in the desert Nile, Geology 41, 695-698. 476
Medina-Elizalde, M., S. Burns, D. Lea, Y. Asmerom, L. von Gunten, V. Polyak, M. Vuille, and 477
A. Karmalkar. 2010: High resolution stalagmite climate record from the Yucatán 478
22
peninsula spanning the Maya Terminal Classic period, Earth Planet. Sci. Lett. 298, 255-479
262. 480
Medina-Elizalde, M. and E.J. Rohling. 2012: Collapse of Classic Maya civilization related to 481
modest reduction in precipitation, Science 335, 956-959. 482
Munoz, S., K. Gajewski, and M. Peros. 2010: Synchronous environmental and cultural change in 483
the prehistory of the northeastern United States, PNAS 107, 22008-22013. 484
Munoz, S., K. Gruley, A. Massie, D. Fike, S. Schroeder, and J. Williams. 2015: Cahokia’s 485
emergence and decline coincided with shifts of flood frequency on the Mississippi River, 486
PNAS 112, 6319-6324. 487
Munoz, S., S. Schroeder, D. Fike, and J. Williams. 2014: A record of sustained prehistoric and 488
historic land use from the Cahokia region, Illinois, USA, Geology 46, 499-502. 489
Murdock, G.P. and S.F. Wilson. 1972: Settlement patterns and community organization, 490
Ethnology 11, 254-295. 491
Paton, D. 2006: Disaster resilience: Building capacity to co-exist with natural hazards and their 492
consequences, in Disaster Resilience: An Integrated Approach, D. Paton and D. 493
Johnston, Eds. Charles Thomas, 3-10. 494
Peregrine, P.N. 2001: Cross-cultural comparative approaches in archaeology, Ann. Rev. Anthro. 495
30:1-18. 496
Peregrine, P.N. 2004: Cross-cultural approaches in archaeology: Comparative ethnology, 497
comparative archaeology, and archaeoethnology, J. Arch. Res. 12, 281-309. 498
Peregrine, P.N. 2008: Political strategy and cross-cultural variation in games, Cross-Cult. Res. 499
42, 386-392. 500
23
Peregrine, P.N. 2012: Power and legitimation: Political strategies, typology, and cultural 501
evolution, in Comparative Archaeology of Complex Societies, M.E. Smith, Cambridge 502
University Press, 165-191. 503
Peregrine, P.N. and C.R. Ember, 2016: Network strategy and war, in Alternative Pathways to 504
Complexity, L. Farger and V. Heredia Espinoza, Eds. University of Colorado Press, 259-505
269. 506
Peregrine, P.N., C.R. Ember, and M. Ember. 2009: Cross-cultural research in the study of 507
migration: Cultural features and language, in Ancient Human Migrations: A 508
Multidisciplinary Approach, P.N. Peregrine, I. Peiros, and M. Feldman. University of 509
Utah Press, 31-41. 510
Phadtare, N. 2000: Sharp decrease in summer monsoon strength 4000-3500 cal yr. B.P. in the 511
Central Higher Himalaya of India based on pollen evidence from Alpine peat, Quat. Res. 512
53, 122-129. 513
Prasad, S. and Y. Enzel. 2006: Holocene paleoclimates of India, Quat. Res. 66, 442-453. 514
Redman, C.L. 2005: Resilience theory in archaeology, Amer. Anthro. 107, 70-77. 515
Redman, C.L. 2012: Global environmental change, resilience, and sustainable outcomes, in 516
Surviving Sudden Environmental Changes: Answers from Archaeology, J. Cooper and P. 517
Sheets, Eds., University Press of Colorado, 237-244. 518
Redman, C.L. and A.P. Kinzig. 2003: Resilience of past landscapes: Resilience theory, society, 519
and the Longue Durée, Cons. Ecol. 7, Article 14, 520
http://www.consecol.org/vol7/iss1/art14/. 521
24
Rein, B., A. Lückge, L. Reinhardt, F. Sirocko, A. Wolf, and W-C. Dullo. 2005: El Niño 522
variability off Peru during the last 20,000 years, Paleoceanography 20, PA4003, 523
doi:10,1029/2004PA001099. 524
Roos, P., M. Gelfand, D. Nau, and J. Lun. 2015: Societal threat and cultural variation in the 525
strength of social norms: An evolutionary basis, Org. Behav. Hum. Decis. Process 127, 526
14-23 527
Rosenmeier, M., D. Hodell, M. Brenner, and J. Curtis. 2002: A 4000-year lacustrine record of 528
environmental change in the southern Maya lowlands, Petén, Guatemala, Quat. Res. 57, 529
183-190. 530
Sandweiss, D., R. Shady Solis, M. Moseley, D. Keefer, and C. Ortloff. 2009: Environmental 531
change and economic development in coastal Peru between 5800 and 3600 years ago, 532
PNAS 106, 1359-1363. 533
Sheets, P. 2012: Responses to explosive volcanic eruptions by small to complex societies in 534
ancient Mexico and Central America, in Surviving Sudden Environmental Change, J. 535
Cooper and P. Sheets, Eds., University Press of Colorado, 43-65. 536
Singh-Peterson, L., P. Salmon, C. Baldwin, and N. Goode. 2015: Deconstructing the concept of 537
shared responsibility for disaster resilience: A Sunshine Coast case study, Australia, Nat. 538
Hazards 79, 755-774. 539
Smith, M.E. and P.N. Peregrine. 2012: Approaches to comparative analysis in archaeology, in 540
The Comparative Archaeology of Complex Societies, M.E. Smith, Ed., Cambridge 541
University Press 4-20. 542
25
Stahle, D., E. Cook, D. Burnette, J. Villanueva, J. Cerano, J. Burns, et al., 2016: The Mexican 543
drought atlas: Tree-ring reconstructions of the soil moisture balance during the Late Pre-544
Hispanic, Colonial, and Modern eras, Quat. Sci. Rev. 149, 34-60. 545
Stanley, J.-D., M.D. Krom, R. Cliff, and J.C. Woodward. 2003: Short contribution: Nile flow 546
failure at the end of the Old Kingdom, Egypt: Strontium isotopic and petrologic evidence, 547
Geoarchaeology 18, 395-402. 548
Staubwasser, M. and H. Weiss. 2006: Holocene climate and cultural evolution in Late 549
Prehistoric-Early Historic West Asia, Quat. Res. 66, 372-387. 550
Staubwasser, M., F. Sirocko, P.M. Grootes, and M. Segl. 2003: Climate change at the 4.2 kya BP 551
termination of the Indus Valley civilization and Holocene South Asian monsoon 552
variability, Geophys. Res. Lett. 30, 1425-1428. 553
Tierney, K. 2014: The Social Roots of Risk: Producing Disasters, Promoting Resilience, 554
Stanford University Press. 555
van der Leeuw, S. and the ARCHAEOMEDES Research Team. 2005: Climate, hydrology, land 556
use, and environmental degradation in the lower Rhone Valley during the Roman period, 557
Comptes Rendus Geoscience 337, 9-27. 558
Van de Noort, R. 2011: Conceptualizing climate change archaeology, Antiquity 85, 1039-1048. 559
Walker, B., C.S. Holling, S. Carpenter, and A. Kinzig, 2004: Resilience, adaptability and 560
transformability in socio-ecological systems, Ecol. Soc. 9(2), Article 5, 561
http://www.ecologyandsociety.org/vol9/iss2/art5. 562
Waters, M. 2008: Alluvial chronologies and archaeology of the Gila River drainage basin, 563
Arizona, Geomorphology 101, 332-341. 564
26
Waters, M. and J. Ravesloot. 2000: Late Quaternary geology of the Middle Gila River, Gila 565
Indian Reservation, Arizona, Quat. Res. 54, 49-57. 566
Waters, M. and J. Ravesloot. 2001: Landscape change and the cultural evolution of the Hohokam 567
along the Middle Gila River and other river valleys in South-Central Arizona, Amer. 568
Antiquity 66, 285-299. 569
Webster, J., G. Brook, L.B. Railsback, H. Cheng, R.L. Edwards, C. Alexander, and P. Reeder, 570
2007: Stalagmite evidence from Belize indicating significant droughts at the time of 571
Preclassic abandonment, the Maya hiatus, and the Classic Maya collapse, 572
Paleogeography, Paleoclimatology, Paleoecology 250, 1-17. 573
Weiss, H. 2000: Beyond the Younger Dryas: Collapse and adaptation to abrupt climate change in 574
ancient West Asia and the eastern Mediterranean, in Environmental Disaster and the 575
Archaeology of Human Response, G. Bawden and R.M. Reycraft, Eds., Maxwell 576
Museum of Anthropology, 75-98. 577
Weiss, H., M.A. Courtney, W. Wetterstrom, F. Guichard, L. Senior, R. Meadow, and A Curnow. 578
1993: The genesis and collapse of third millennium North Mesopotamian civilization, 579
Science 261, 995-1004. 580
Yoon, D.K., J.E. Kang and S. Brody. 2016: A measurement of community disaster resilience in 581
Korea, J. Environ. Plan. Manage. 59, 436-460. 582
583
27
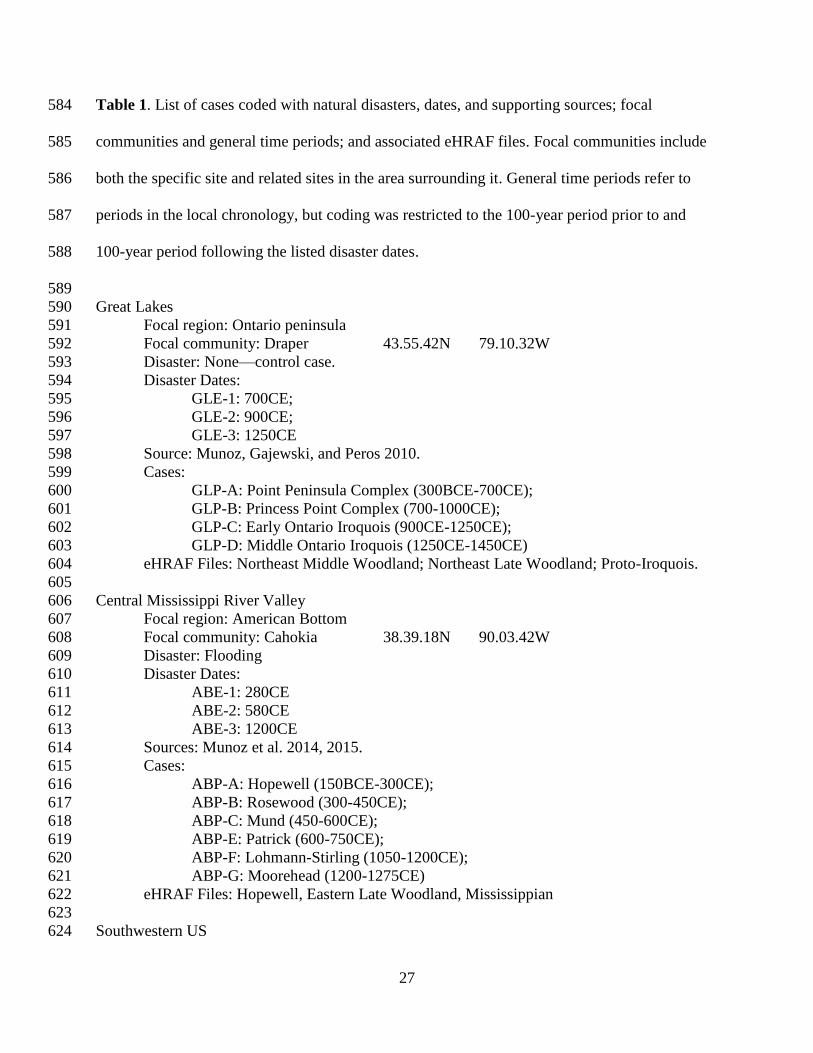
Table 1. List of cases coded with natural disasters, dates, and supporting sources; focal 584
communities and general time periods; and associated eHRAF files. Focal communities include 585
both the specific site and related sites in the area surrounding it. General time periods refer to 586
periods in the local chronology, but coding was restricted to the 100-year period prior to and 587
100-year period following the listed disaster dates. 588
589
Great Lakes 590
Focal region: Ontario peninsula 591
Focal community: Draper 43.55.42N 79.10.32W 592
Disaster: None—control case. 593
Disaster Dates: 594
GLE-1: 700CE; 595
GLE-2: 900CE; 596
GLE-3: 1250CE 597
Source: Munoz, Gajewski, and Peros 2010. 598
Cases: 599
GLP-A: Point Peninsula Complex (300BCE-700CE); 600
GLP-B: Princess Point Complex (700-1000CE); 601
GLP-C: Early Ontario Iroquois (900CE-1250CE); 602
GLP-D: Middle Ontario Iroquois (1250CE-1450CE) 603
eHRAF Files: Northeast Middle Woodland; Northeast Late Woodland; Proto-Iroquois. 604
605
Central Mississippi River Valley 606
Focal region: American Bottom 607
Focal community: Cahokia 38.39.18N 90.03.42W 608
Disaster: Flooding 609
Disaster Dates: 610
ABE-1: 280CE 611
ABE-2: 580CE 612
ABE-3: 1200CE 613
Sources: Munoz et al. 2014, 2015. 614
Cases: 615
ABP-A: Hopewell (150BCE-300CE); 616
ABP-B: Rosewood (300-450CE); 617
ABP-C: Mund (450-600CE); 618
ABP-E: Patrick (600-750CE); 619
ABP-F: Lohmann-Stirling (1050-1200CE); 620
ABP-G: Moorehead (1200-1275CE) 621
eHRAF Files: Hopewell, Eastern Late Woodland, Mississippian 622
623
Southwestern US 624
28
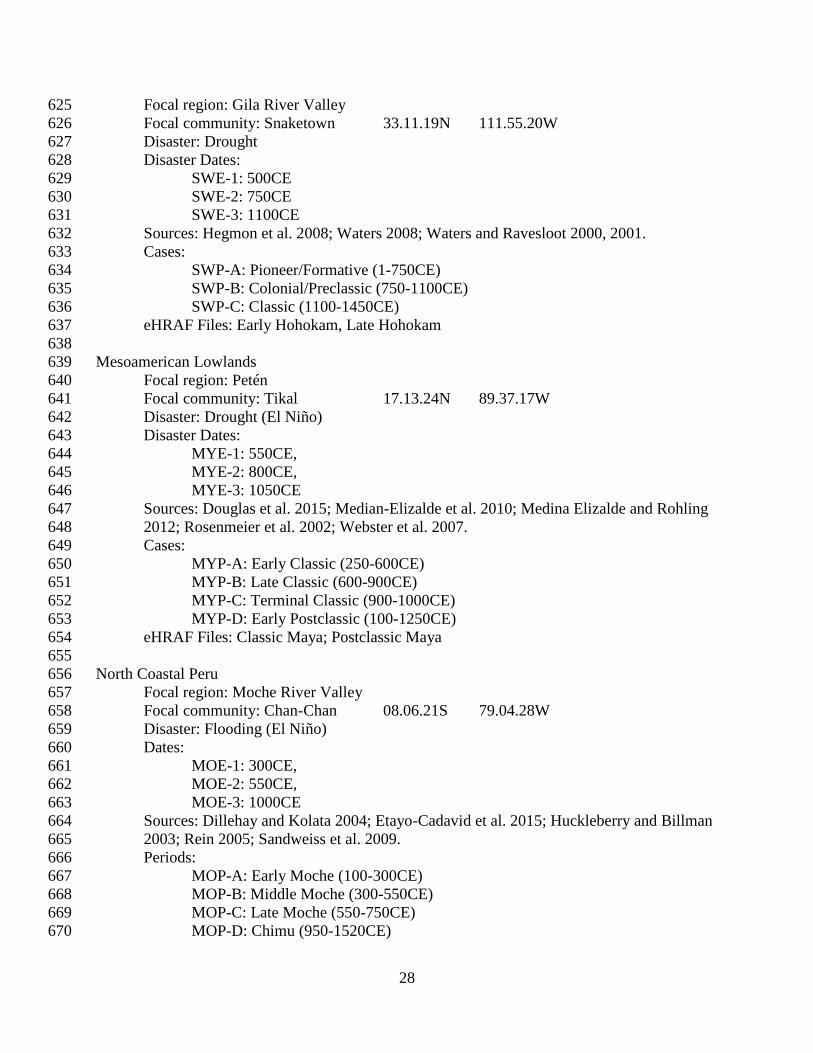
Focal region: Gila River Valley 625
Focal community: Snaketown 33.11.19N 111.55.20W 626
Disaster: Drought 627
Disaster Dates: 628
SWE-1: 500CE 629
SWE-2: 750CE 630
SWE-3: 1100CE 631
Sources: Hegmon et al. 2008; Waters 2008; Waters and Ravesloot 2000, 2001. 632
Cases: 633
SWP-A: Pioneer/Formative (1-750CE) 634
SWP-B: Colonial/Preclassic (750-1100CE) 635
SWP-C: Classic (1100-1450CE) 636
eHRAF Files: Early Hohokam, Late Hohokam 637
638
Mesoamerican Lowlands 639
Focal region: Petén 640
Focal community: Tikal 17.13.24N 89.37.17W 641
Disaster: Drought (El Niño) 642
Disaster Dates: 643
MYE-1: 550CE, 644
MYE-2: 800CE, 645
MYE-3: 1050CE 646
Sources: Douglas et al. 2015; Median-Elizalde et al. 2010; Medina Elizalde and Rohling 647
2012; Rosenmeier et al. 2002; Webster et al. 2007. 648
Cases: 649
MYP-A: Early Classic (250-600CE) 650
MYP-B: Late Classic (600-900CE) 651
MYP-C: Terminal Classic (900-1000CE) 652
MYP-D: Early Postclassic (100-1250CE) 653
eHRAF Files: Classic Maya; Postclassic Maya 654
655
North Coastal Peru 656
Focal region: Moche River Valley 657
Focal community: Chan-Chan 08.06.21S 79.04.28W 658
Disaster: Flooding (El Niño) 659
Dates: 660
MOE-1: 300CE, 661
MOE-2: 550CE, 662
MOE-3: 1000CE 663
Sources: Dillehay and Kolata 2004; Etayo-Cadavid et al. 2015; Huckleberry and Billman 664
2003; Rein 2005; Sandweiss et al. 2009. 665
Periods: 666
MOP-A: Early Moche (100-300CE) 667
MOP-B: Middle Moche (300-550CE) 668
MOP-C: Late Moche (550-750CE) 669
MOP-D: Chimu (950-1520CE) 670
29
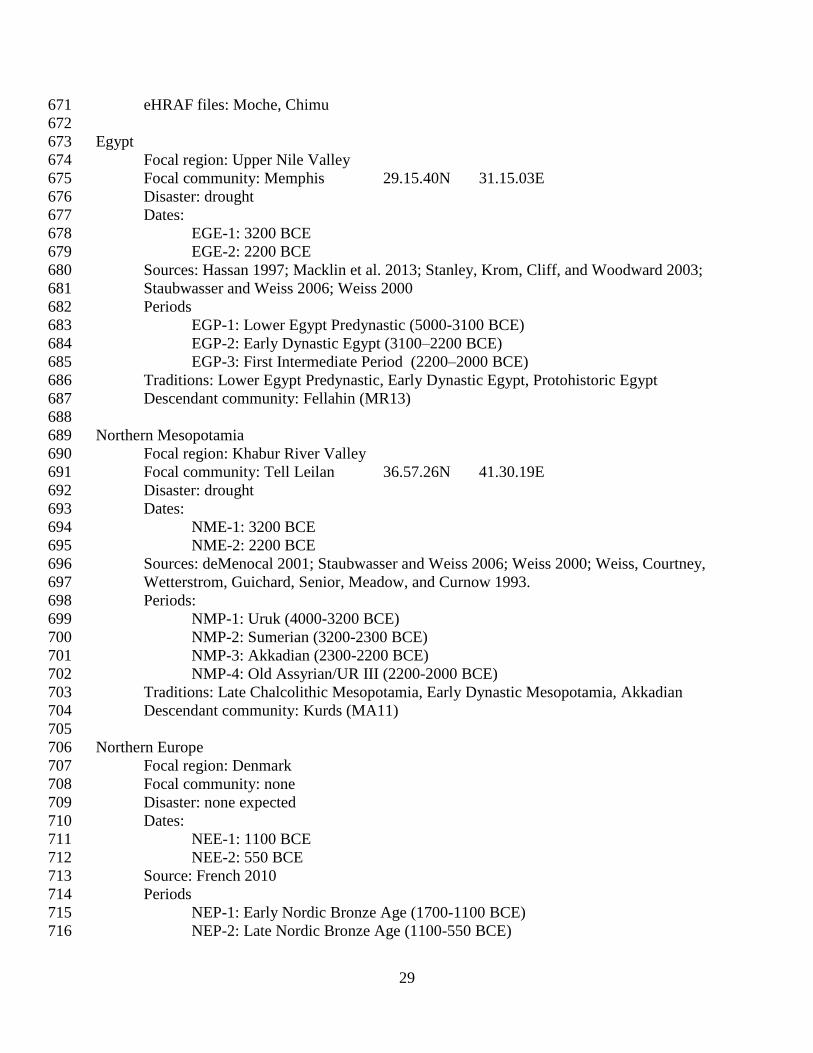
eHRAF files: Moche, Chimu 671
672
Egypt 673
Focal region: Upper Nile Valley 674
Focal community: Memphis 29.15.40N 31.15.03E 675
Disaster: drought 676
Dates: 677
EGE-1: 3200 BCE 678
EGE-2: 2200 BCE 679
Sources: Hassan 1997; Macklin et al. 2013; Stanley, Krom, Cliff, and Woodward 2003; 680
Staubwasser and Weiss 2006; Weiss 2000 681
Periods 682
EGP-1: Lower Egypt Predynastic (5000-3100 BCE) 683
EGP-2: Early Dynastic Egypt (3100–2200 BCE) 684
EGP-3: First Intermediate Period (2200–2000 BCE) 685
Traditions: Lower Egypt Predynastic, Early Dynastic Egypt, Protohistoric Egypt 686
Descendant community: Fellahin (MR13) 687
688
Northern Mesopotamia 689
Focal region: Khabur River Valley 690
Focal community: Tell Leilan 36.57.26N 41.30.19E 691
Disaster: drought 692
Dates: 693
NME-1: 3200 BCE 694
NME-2: 2200 BCE 695
Sources: deMenocal 2001; Staubwasser and Weiss 2006; Weiss 2000; Weiss, Courtney, 696
Wetterstrom, Guichard, Senior, Meadow, and Curnow 1993. 697
Periods: 698
NMP-1: Uruk (4000-3200 BCE) 699
NMP-2: Sumerian (3200-2300 BCE) 700
NMP-3: Akkadian (2300-2200 BCE) 701
NMP-4: Old Assyrian/UR III (2200-2000 BCE) 702
Traditions: Late Chalcolithic Mesopotamia, Early Dynastic Mesopotamia, Akkadian 703
Descendant community: Kurds (MA11) 704
705
Northern Europe 706
Focal region: Denmark 707
Focal community: none 708
Disaster: none expected 709
Dates: 710
NEE-1: 1100 BCE 711
NEE-2: 550 BCE 712
Source: French 2010 713
Periods 714
NEP-1: Early Nordic Bronze Age (1700-1100 BCE) 715
NEP-2: Late Nordic Bronze Age (1100-550 BCE) 716
30
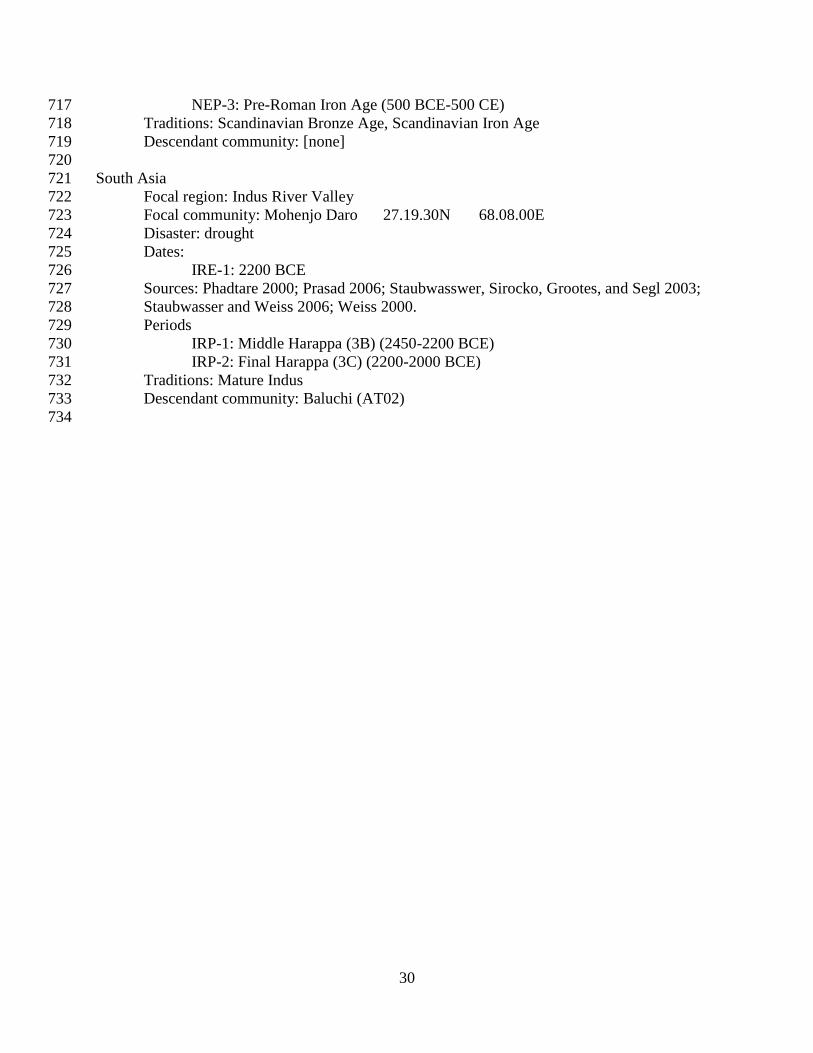
NEP-3: Pre-Roman Iron Age (500 BCE-500 CE) 717
Traditions: Scandinavian Bronze Age, Scandinavian Iron Age 718
Descendant community: [none] 719
720
South Asia 721
Focal region: Indus River Valley 722
Focal community: Mohenjo Daro 27.19.30N 68.08.00E 723
Disaster: drought 724
Dates: 725
IRE-1: 2200 BCE 726
Sources: Phadtare 2000; Prasad 2006; Staubwasswer, Sirocko, Grootes, and Segl 2003; 727
Staubwasser and Weiss 2006; Weiss 2000. 728
Periods 729
IRP-1: Middle Harappa (3B) (2450-2200 BCE) 730
IRP-2: Final Harappa (3C) (2200-2000 BCE) 731
Traditions: Mature Indus 732
Descendant community: Baluchi (AT02) 733
734
31
Table 2. Looseness-Tightness Index codes. Community integration and community ceremonials 735
were coded following the coding details in Murdock and Wilson (1972); for the other variables 736
“unstandardized” implies that the range of variation extends far beyond a basic set of forms or 737
types; “moderately unstandardized” implies that while most items follow a basic set of forms or 738
types, they are also routinely altered or personalized to create a relatively large range of variation 739
within those basic forms or types; “moderately standardized” implies that basic forms or types 740
are generally followed, albeit with variation due to individual manufacture or preference; 741
“standardized” implies strong adherence to basic forms or types with relatively little variation. 742
Community integration (Murdock and Wilson 1972) 743
1 = Lacking or low compared to community segments or larger polity 744
2 = By common residence only 745
3 = Common Identity, dialect, subculture 746
4 = Overlapping Kin ties 747
5 = Common social or economic status 748
6 = Common political ties 749
7 = Common religious ties 750
8 = Two or more of the above 751
9 = Three or more of the above 752
753
Prominent community ceremonials (Murdock and Wilson 1972) 754
1 = Rites of passage 755
2 = Calendrical 756
3 = Magical or religious 757
4 = Individual sponsored and communally attended (e.g., potlatch) 758
5 = Two or more of the above 759
6 = Three or more of the above 760
761 To what extent are “fineware” ceramics standardized? 762
0 = no fineware ceramics 763
1 = Unstandardized 764
2 = Moderately unstandardized 765
3 = Moderately standardized 766
4 = Standardized 767
768
To what extent are living dwellings standardized versus architecturally diverse? 769
0 = no living dwellings 770
1 = Unstandardized 771
2 = Moderately unstandardized 772
32
3 = Moderately standardized 773
4 = Standardized 774
775
To what extent are public structures (including bureaucratic or palace structures, 776
defensive structures, marketplaces, etc.) standardized versus architecturally diverse? 777
0 = no public structures 778
1 = Unstandardized 779
2 = Moderately unstandardized 780
3 = Moderately standardized 781
4 = Standardized 782
783
To what extent are ritual structures (including mounds, temples, enclosures, etc.) 784
standardized versus architecturally diverse? 785
0 = no ritual structures 786
1 = Unstandardized 787
2 = Moderately unstandardized 788
3 = Moderately standardized 789
4 = Standardized 790
791
33
Table 3. Corporate-Exclusionary Index codes. These variables were coded following coding 792
details given in Peregrine (2012). 793
Differentiation among leaders and followers 794
0=egalitarian/no formal leaders 795
1=none 796
2=leaders have some privileges and/or access to resources others do not 797
3=leaders have extensive privileges and access to resources others do not, 798
including special housing and sumptuary goods 799
4=leaders have exclusive privileges and exclusive access to special housing, 800
resources, and sumptuary goods 801
802
Leader identification 803
0=egalitarian/no formal leaders 804
1=none 805
2=leaders are identified by treatment or appearance 806
3=leaders are identified by recognized symbols of power or special behaviors 807
4=individual aggrandizement and/or cult of leaders 808
809
Sharing of authority 810
0=egalitarian/no formal leaders 811
1=leaders share power extensively with others 812
2=leaders share power with a large cadre of other leaders 813
3=leaders share power with a few other leaders 814
4=leaders exercise exclusive power 815
816
Emphasis of authority 817
0=egalitarian/no formal leaders 818
1=emphasis placed on group solidarity and group survival 819
2=emphasis shared between group and leader, with greatest importance given to 820
group survival 821
3=emphasis shared between group and leader, with greatest importance given to 822
leader survival 823
4=emphasis placed on leaders as the embodiment of the group 824
825
External contacts (excluding warfare) 826
0=egalitarian/no formal leaders 827
1=few or unimportant 828
2=external contacts are part of leaders’ authority, but not exclusive 829
3=external contacts are key to leaders’ authority, but not exclusive 830
4=external contacts are exclusively controlled by leaders 831
832
34
833
Table 4. Pearson’s r correlations between independent and dependent variables. 834
Corporate-
Exclusionary Index
Looseness-Tightness
Index
Change in Population r = .241 .051
p < .160 .418
N = 19 19
Change in Health r = -.029 .001
p < .452 .499
N = 20 20
Change in Conflict r = .425* .275
p < .050 .151
N = 16 16
Change in Household Organization r = -.091 -.127
p < .348 .292
N = 21 21
Change in Village Organization r = .182 .120
p < .209 .297
N = 22 22
Change in Regional Organization r = .508** .229
p < .008 .153
N = 22 22
Change in Ritual Architecture and
Organization
r = .495** .379*
p < .010 .041
N = 22 22 835 *significant at the .05 level 836
**significant at the .01 level 837
838
35
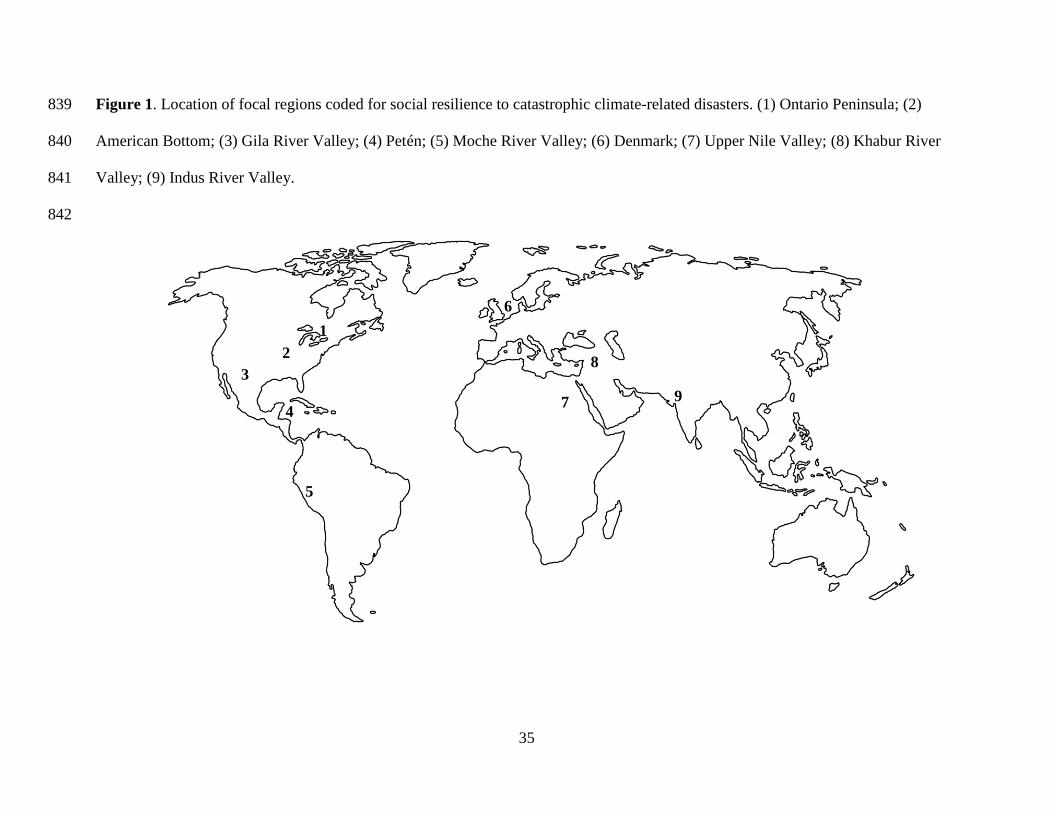
Figure 1. Location of focal regions coded for social resilience to catastrophic climate-related disasters. (1) Ontario Peninsula; (2) 839
American Bottom; (3) Gila River Valley; (4) Petén; (5) Moche River Valley; (6) Denmark; (7) Upper Nile Valley; (8) Khabur River 840
Valley; (9) Indus River Valley. 841
842
1
2
3
5
6
7
8
9 4