social media data insights
DESCRIPTION
Social Media Data InsightsTRANSCRIPT
S P O N S O R E D B Y :
D ATA I N S I G H T S
A Research Collection for Marketers
The Social Media Data Stacks
D ATA I N S I G H T S
The Social Media Data Stacks
The charts in this collection are ready to use, download, format, and otherwise support your marketing goals.
Feel free to share the whole presentation or any slide, with your colleagues and business partners, but please
preserve credits to our sponsor, HubSpot, our research partners who provide the source data, and our links to
MarketingCharts.com.
“The Social Media Data Stacks” is part of Watershed Publishing’s Data Insights series featuring trends, data
and research. This collection brings together months of surveys, reports and insights released by nationally
recognized research and marketing organizations focused on keeping pace with the latest data about social
media – its growth and use.
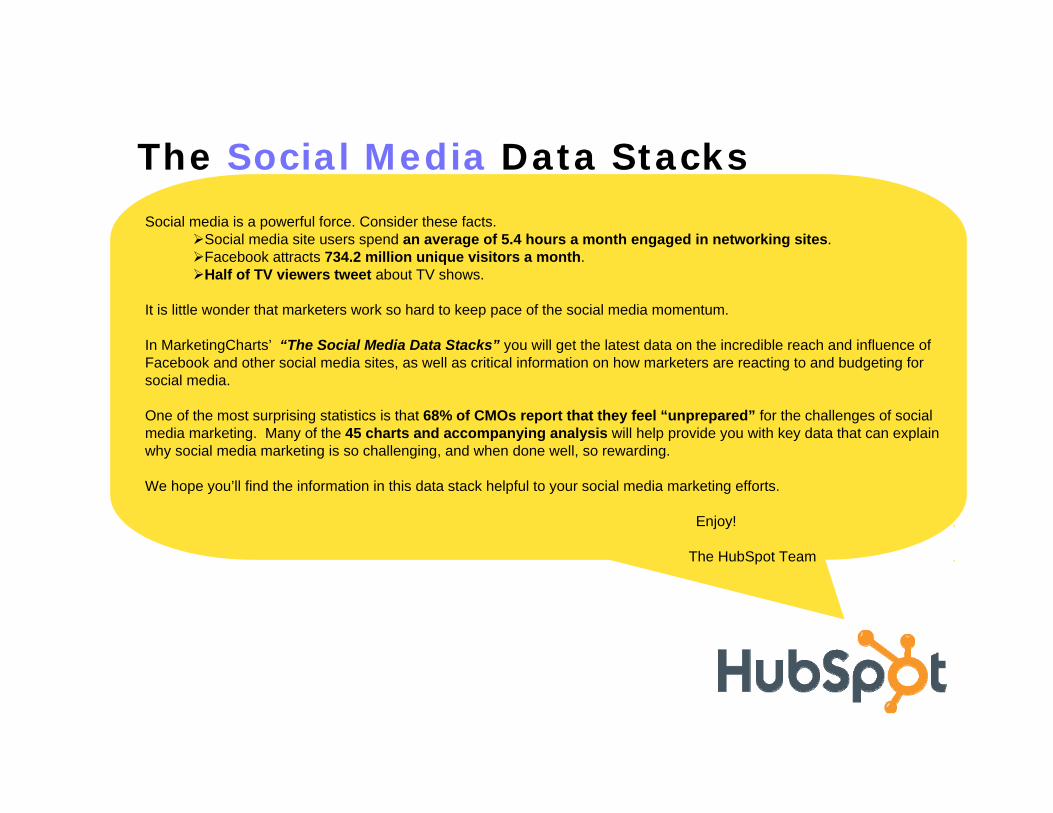
The Social Media Data StacksSocial media is a powerful force. Consider these facts.
Social media site users spend an average of 5.4 hours a month engaged in networking sites.Facebook attracts 734.2 million unique visitors a month.Half of TV viewers tweet about TV shows.
It is little wonder that marketers work so hard to keep pace of the social media momentum.
In MarketingCharts’ “The Social Media Data Stacks” you will get the latest data on the incredible reach and influence of Facebook and other social media sites, as well as critical information on how marketers are reacting to and budgeting for social media.
One of the most surprising statistics is that 68% of CMOs report that they feel “unprepared” for the challenges of social media marketing. Many of the 45 charts and accompanying analysis will help provide you with key data that can explain why social media marketing is so challenging, and when done well, so rewarding.
We hope you’ll find the information in this data stack helpful to your social media marketing efforts.
Enjoy! ,
The HubSpot Team .
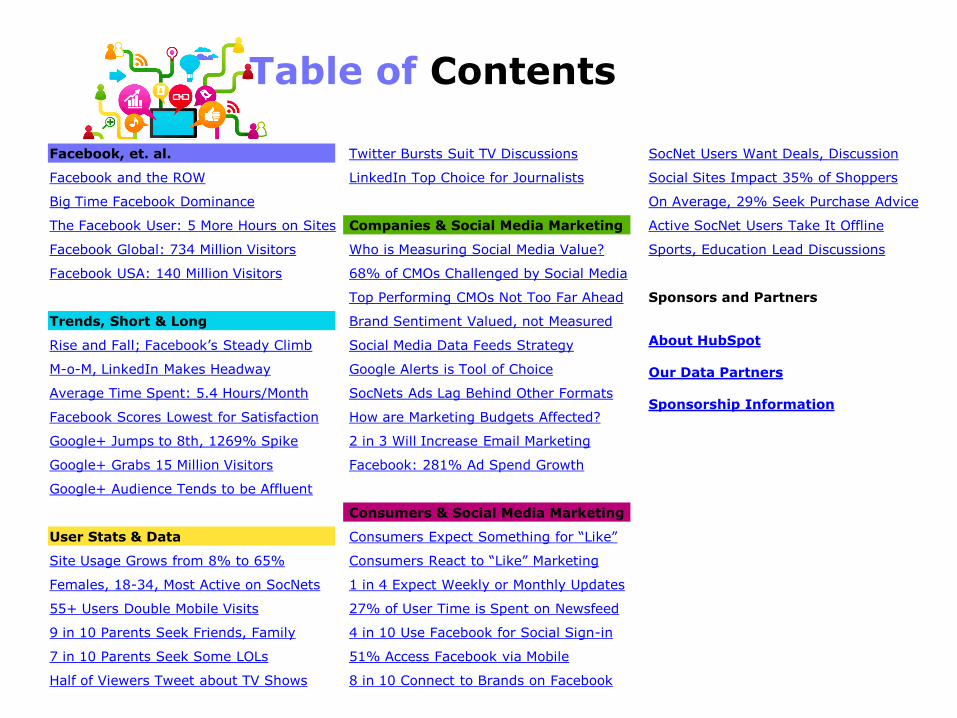
Table of Contents
Facebook, et. al.
Facebook and the ROW
Big Time Facebook Dominance
The Facebook User: 5 More Hours on Sites
Facebook Global: 734 Million Visitors
Facebook USA: 140 Million Visitors
Trends, Short & Long
Rise and Fall; Facebook’s Steady Climb
M-o-M, LinkedIn Makes Headway
Average Time Spent: 5.4 Hours/Month
Facebook Scores Lowest for Satisfaction
Google+ Jumps to 8th, 1269% Spike
Google+ Grabs 15 Million Visitors
Google+ Audience Tends to be Affluent
User Stats & Data
Site Usage Grows from 8% to 65%
Females, 18-34, Most Active on SocNets
55+ Users Double Mobile Visits
9 in 10 Parents Seek Friends, Family
7 in 10 Parents Seek Some LOLs
Half of Viewers Tweet about TV Shows
Twitter Bursts Suit TV Discussions
LinkedIn Top Choice for Journalists
Companies & Social Media Marketing
Who is Measuring Social Media Value?
68% of CMOs Challenged by Social Media
Top Performing CMOs Not Too Far Ahead
Brand Sentiment Valued, not Measured
Social Media Data Feeds Strategy
Google Alerts is Tool of Choice
SocNets Ads Lag Behind Other Formats
How are Marketing Budgets Affected?
2 in 3 Will Increase Email Marketing
Facebook: 281% Ad Spend Growth
Consumers & Social Media Marketing
Consumers Expect Something for “Like”
Consumers React to “Like” Marketing
1 in 4 Expect Weekly or Monthly Updates
27% of User Time is Spent on Newsfeed
4 in 10 Use Facebook for Social Sign-in
51% Access Facebook via Mobile
8 in 10 Connect to Brands on Facebook
SocNet Users Want Deals, Discussion
Social Sites Impact 35% of Shoppers
On Average, 29% Seek Purchase Advice
Active SocNet Users Take It Offline
Sports, Education Lead Discussions
Sponsors and Partners
About HubSpot Our Data Partners Sponsorship Information

FACEBOOK, ET. AL.
The Social Media Data Stacks
6
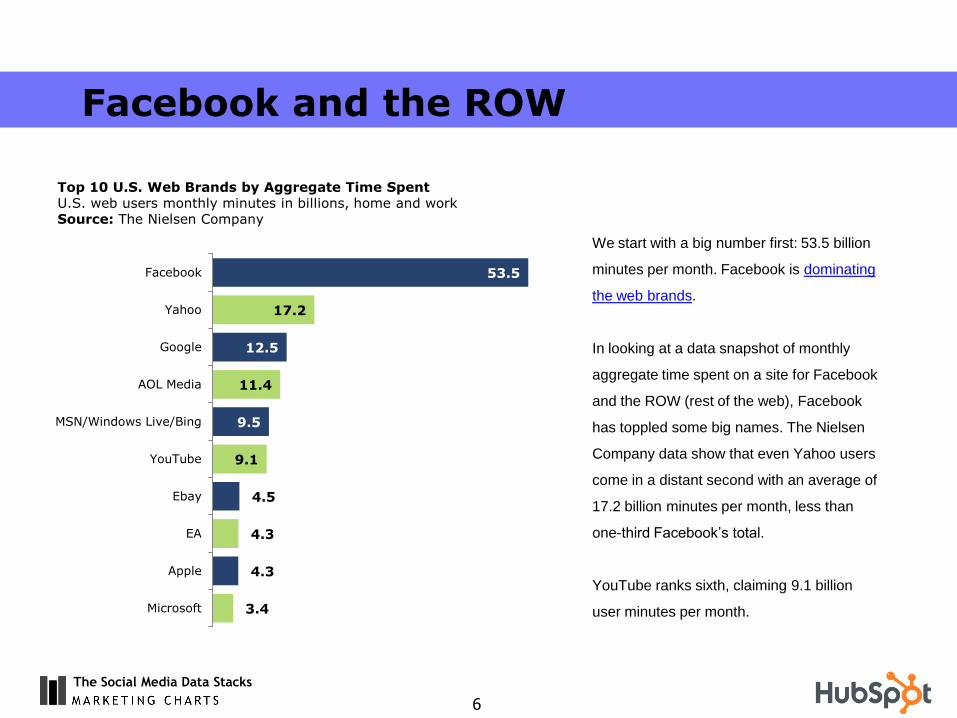
We start with a big number first: 53.5 billion
minutes per month. Facebook is dominating
the web brands.
In looking at a data snapshot of monthly
aggregate time spent on a site for Facebook
and the ROW (rest of the web), Facebook
has toppled some big names. The Nielsen
Company data show that even Yahoo users
come in a distant second with an average of
17.2 billion minutes per month, less than
one-third Facebook’s total.
YouTube ranks sixth, claiming 9.1 billion
user minutes per month.
Facebook and the ROW
Top 10 U.S. Web Brands by Aggregate Time Spent U.S. web users monthly minutes in billions, home and work Source: The Nielsen Company
53.5
17.2
12.5
11.4
9.5
9.1
4.5
4.3
4.3
3.4
Yahoo
AOL Media
MSN/Windows Live/Bing
YouTube
Ebay
EA
Apple
Microsoft
The Social Media Data Stacks
7
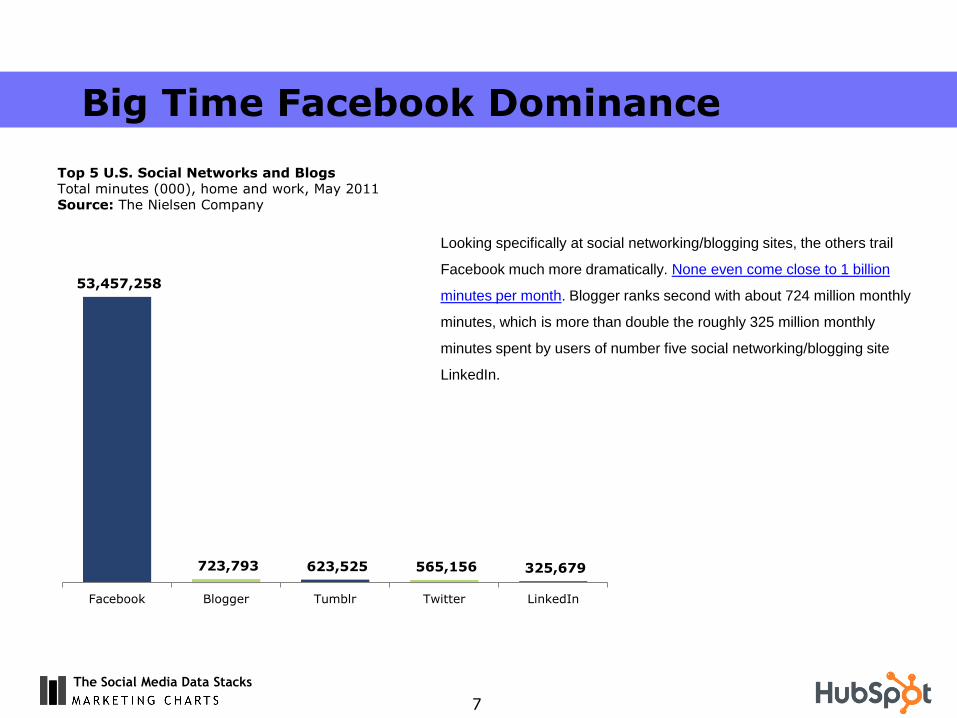
Looking specifically at social networking/blogging sites, the others trail
Facebook much more dramatically. None even come close to 1 billion
minutes per month. Blogger ranks second with about 724 million monthly
minutes, which is more than double the roughly 325 million monthly
minutes spent by users of number five social networking/blogging site
LinkedIn.
Big Time Facebook Dominance
Top 5 U.S. Social Networks and Blogs Total minutes (000), home and work, May 2011 Source: The Nielsen Company
53,457,258
723,793 623,525 565,156 325,679
Facebook Blogger Tumblr Twitter LinkedIn
The Social Media Data Stacks
8
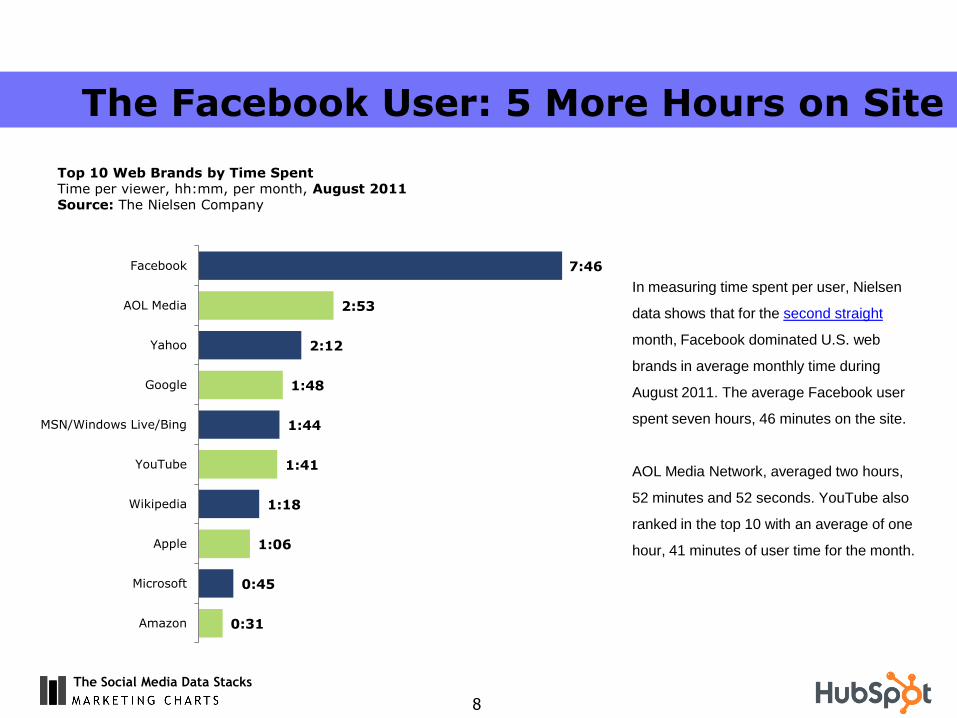
In measuring time spent per user, Nielsen
data shows that for the second straight
month, Facebook dominated U.S. web
brands in average monthly time during
August 2011. The average Facebook user
spent seven hours, 46 minutes on the site.
AOL Media Network, averaged two hours,
52 minutes and 52 seconds. YouTube also
ranked in the top 10 with an average of one
hour, 41 minutes of user time for the month.
The Facebook User: 5 More Hours on Site
Top 10 Web Brands by Time Spent Time per viewer, hh:mm, per month, August 2011 Source: The Nielsen Company
0:31
0:45
1:06
1:18
1:41
1:44
1:48
2:12
2:53
7:46
Amazon
Microsoft
Apple
Wikipedia
YouTube
MSN/Windows Live/Bing
Yahoo
AOL Media
The Social Media Data Stacks
9
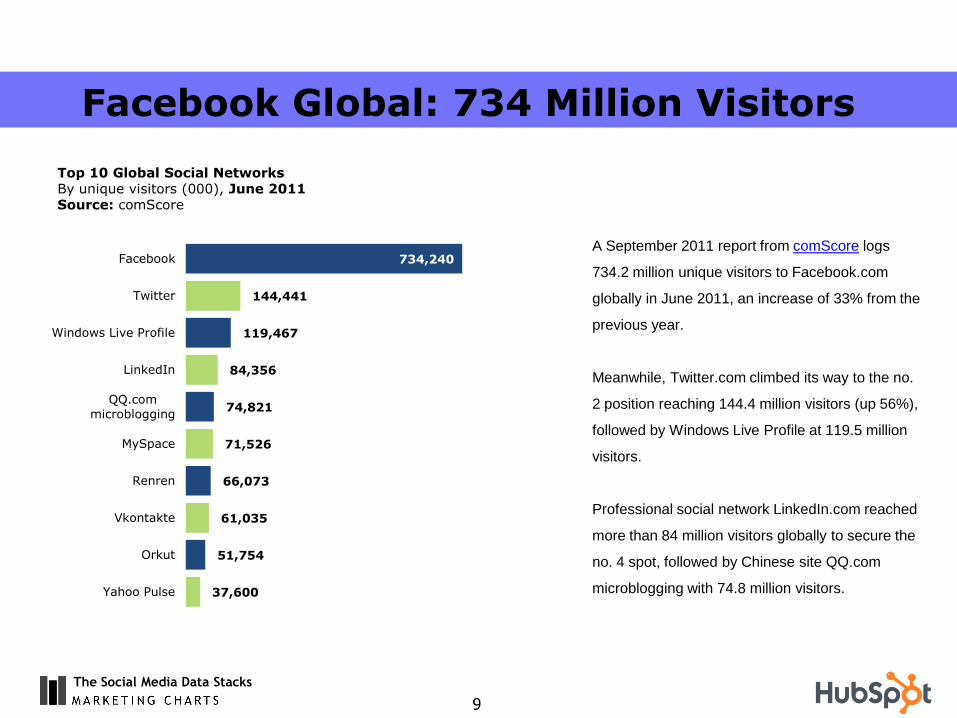
A September 2011 report from comScore logs
734.2 million unique visitors to Facebook.com
globally in June 2011, an increase of 33% from the
previous year.
Meanwhile, Twitter.com climbed its way to the no.
2 position reaching 144.4 million visitors (up 56%),
followed by Windows Live Profile at 119.5 million
visitors.
Professional social network LinkedIn.com reached
more than 84 million visitors globally to secure the
no. 4 spot, followed by Chinese site QQ.com
microblogging with 74.8 million visitors.
Facebook Global: 734 Million Visitors
Top 10 Global Social Networks By unique visitors (000), June 2011 Source: comScore
734,240
144,441
119,467
84,356
74,821
71,526
66,073
61,035
51,754
37,600
Windows Live Profile
QQ.com
microblogging
MySpace
Renren
Vkontakte
Orkut
Yahoo Pulse
The Social Media Data Stacks
10
140,336
50,055
23,617 22,417 19,250 17,786
11,870 8,578 8,397 7,601
Facebook Blogger Twitter Wordpress MySpace LinkedIn Tumblr Six Apart
Typepad
Yahoo Pulse Wikia
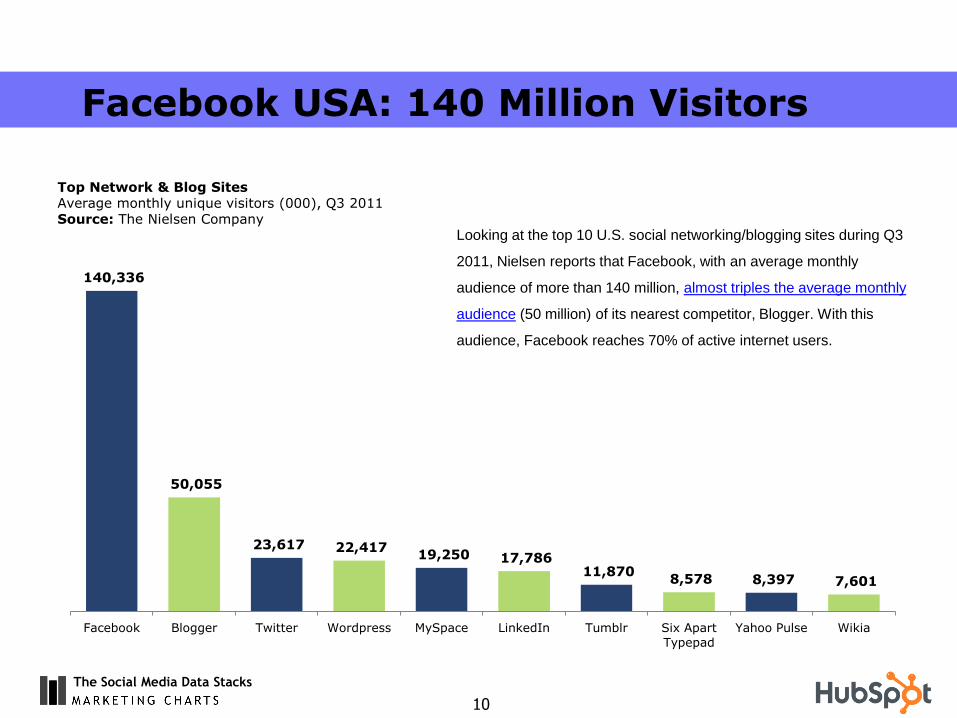
Looking at the top 10 U.S. social networking/blogging sites during Q3
2011, Nielsen reports that Facebook, with an average monthly
audience of more than 140 million, almost triples the average monthly
audience (50 million) of its nearest competitor, Blogger. With this
audience, Facebook reaches 70% of active internet users.
Facebook USA: 140 Million Visitors
Top Network & Blog Sites Average monthly unique visitors (000), Q3 2011 Source: The Nielsen Company
TRENDS, SHORT & LONG
The Social Media Data Stacks
12
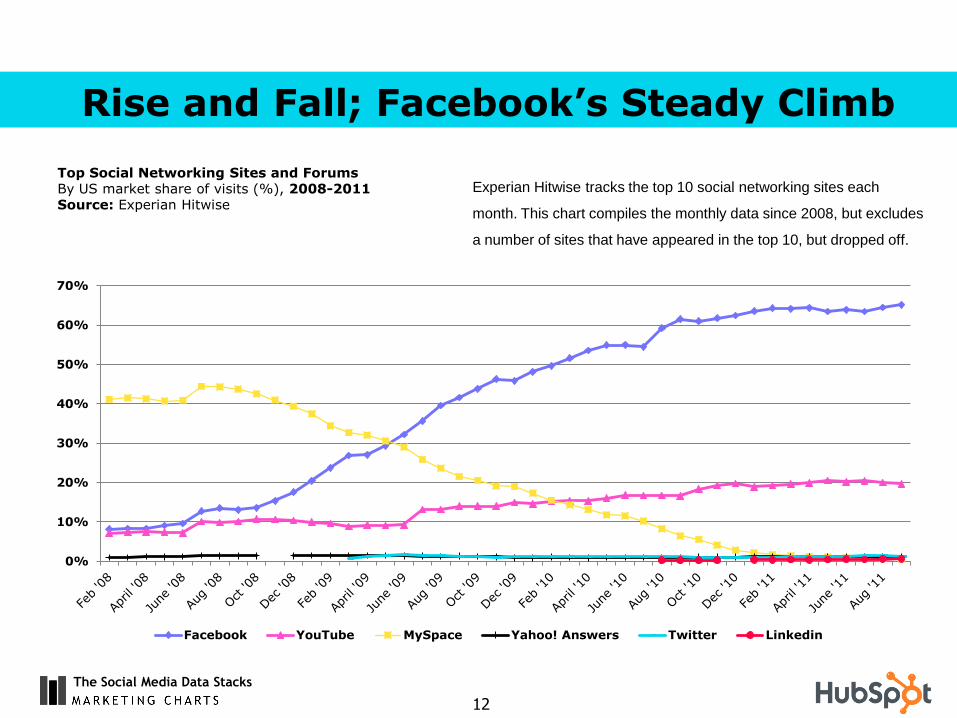
Rise and Fall; Facebook’s Steady Climb
Top Social Networking Sites and Forums By US market share of visits (%), 2008-2011 Source: Experian Hitwise
0%
10%
20%
30%
40%
50%
60%
70%
Facebook YouTube MySpace Yahoo! Answers Twitter Linkedin
Experian Hitwise tracks the top 10 social networking sites each
month. This chart compiles the monthly data since 2008, but excludes
a number of sites that have appeared in the top 10, but dropped off.
The Social Media Data Stacks
13
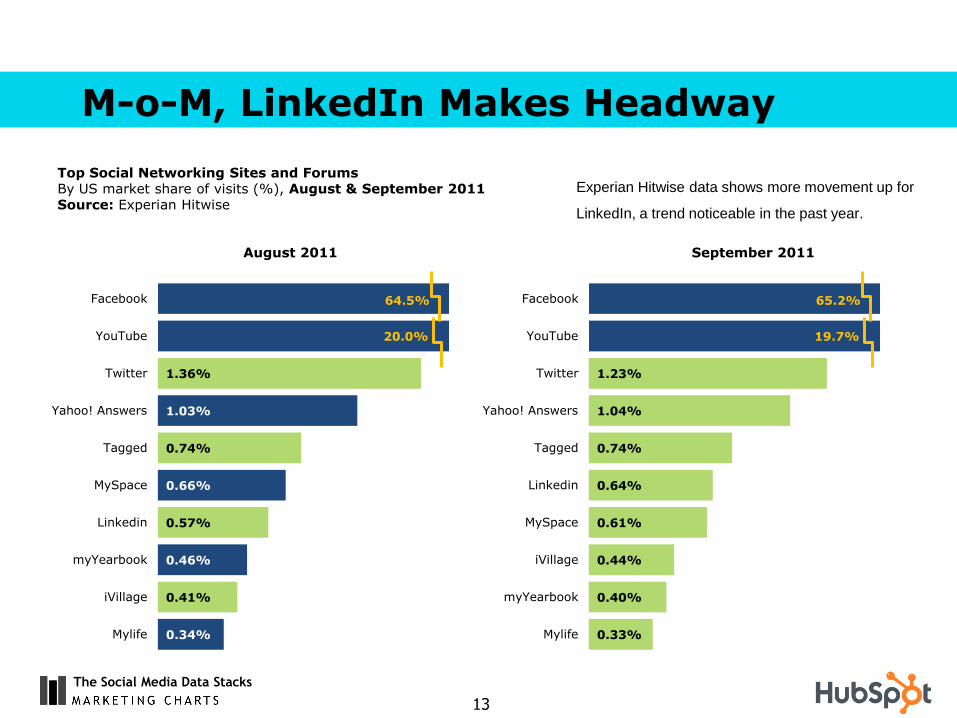
M-o-M, LinkedIn Makes Headway
Top Social Networking Sites and Forums By US market share of visits (%), August & September 2011 Source: Experian Hitwise
65.2%
19.7%
1.23%
1.04%
0.74%
0.64%
0.61%
0.44%
0.40%
0.33%
YouTube
Yahoo! Answers
Tagged
MySpace
iVillage
myYearbook
Mylife
64.5%
20.0%
1.36%
1.03%
0.74%
0.66%
0.57%
0.46%
0.41%
0.34%
YouTube
Yahoo! Answers
Tagged
MySpace
myYearbook
iVillage
Mylife
September 2011 August 2011
Experian Hitwise data shows more movement up for
LinkedIn, a trend noticeable in the past year.
The Social Media Data Stacks
14
30.1%
18.1%
32.5%
10.2% 9.1%
38.1%
21.4%
16.5%
12.8% 11.2%
Europe N. America Asia-Pacific Latin America Mid East-Africa
Share of visitors Share of minutes
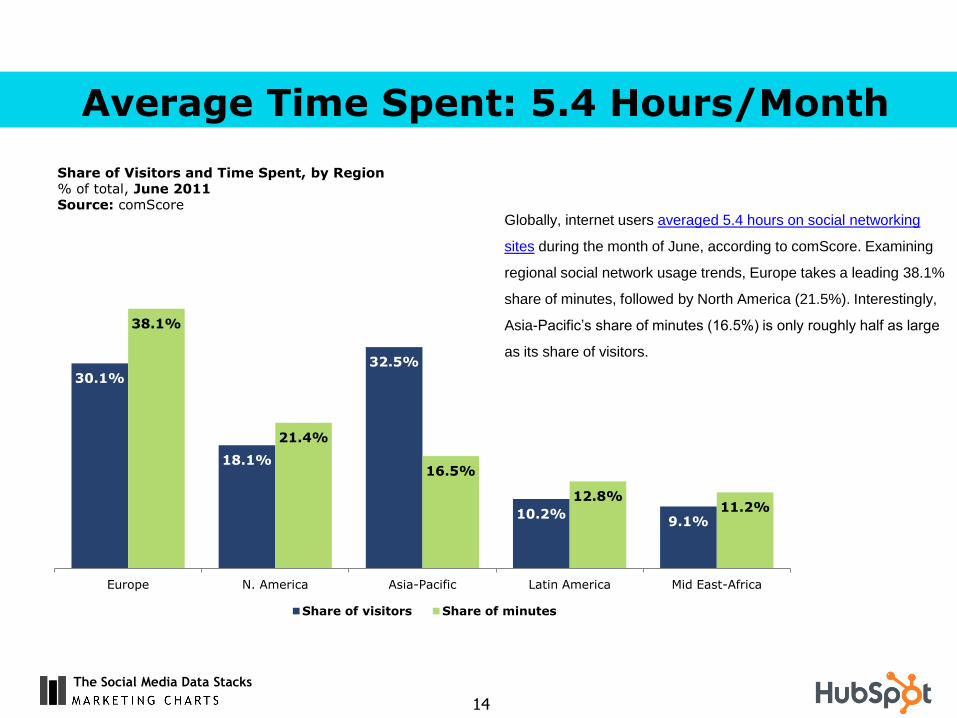
Globally, internet users averaged 5.4 hours on social networking
sites during the month of June, according to comScore. Examining
regional social network usage trends, Europe takes a leading 38.1%
share of minutes, followed by North America (21.5%). Interestingly,
Asia-Pacific’s share of minutes (16.5%) is only roughly half as large
as its share of visitors.
Average Time Spent: 5.4 Hours/Month
Share of Visitors and Time Spent, by Region % of total, June 2011 Source: comScore
The Social Media Data Stacks
15
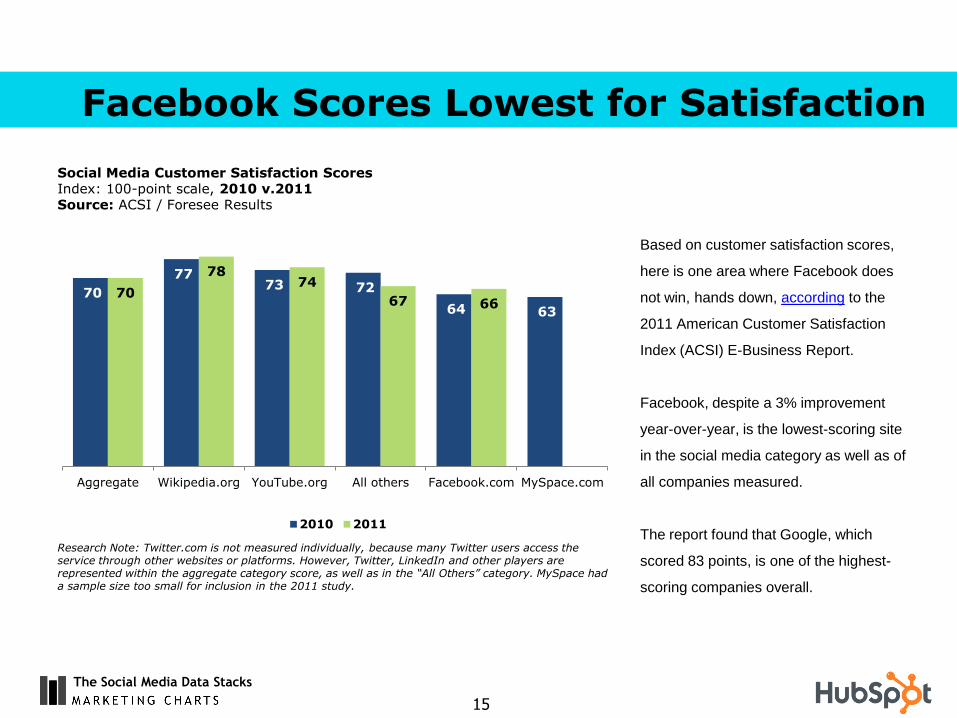
Based on customer satisfaction scores,
here is one area where Facebook does
not win, hands down, according to the
2011 American Customer Satisfaction
Index (ACSI) E-Business Report.
Facebook, despite a 3% improvement
year-over-year, is the lowest-scoring site
in the social media category as well as of
all companies measured.
The report found that Google, which
scored 83 points, is one of the highest-
scoring companies overall.
Facebook Scores Lowest for Satisfaction
Social Media Customer Satisfaction Scores Index: 100-point scale, 2010 v.2011 Source: ACSI / Foresee Results
70
77 73 72
64 63
70
78 74
67 66
Aggregate Wikipedia.org YouTube.org All others Facebook.com MySpace.com
2010 2011
Research Note: Twitter.com is not measured individually, because many Twitter users access the service through other websites or platforms. However, Twitter, LinkedIn and other players are represented within the aggregate category score, as well as in the “All Others” category. MySpace had a sample size too small for inclusion in the 2011 study.
The Social Media Data Stacks
16
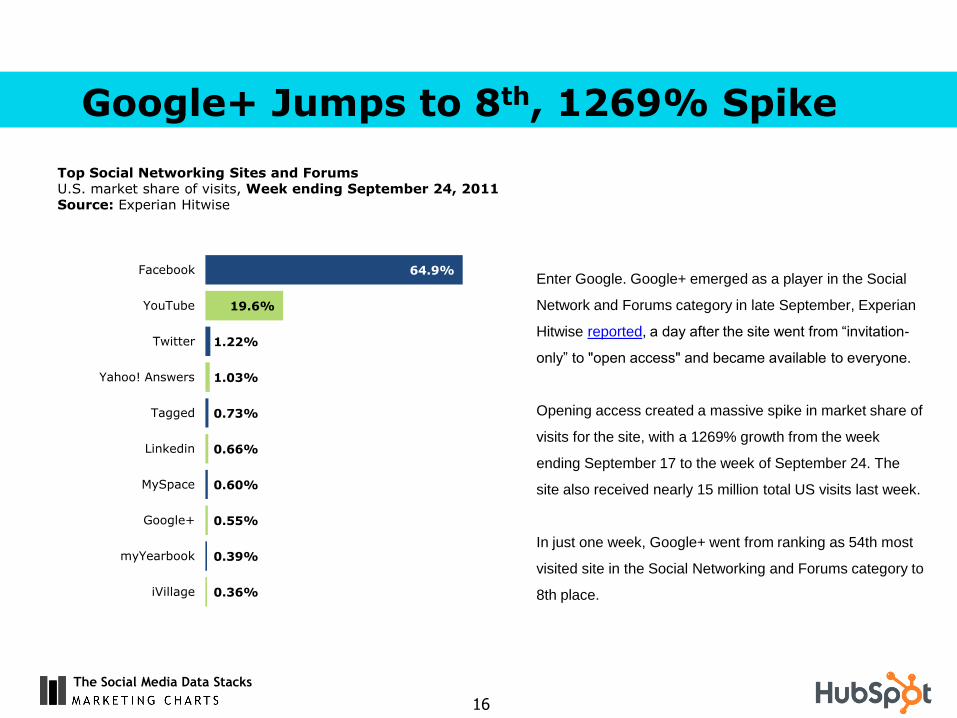
Enter Google. Google+ emerged as a player in the Social
Network and Forums category in late September, Experian
Hitwise reported, a day after the site went from “invitation-
only” to "open access" and became available to everyone.
Opening access created a massive spike in market share of
visits for the site, with a 1269% growth from the week
ending September 17 to the week of September 24. The
site also received nearly 15 million total US visits last week.
In just one week, Google+ went from ranking as 54th most
visited site in the Social Networking and Forums category to
8th place.
Google+ Jumps to 8th, 1269% Spike
Top Social Networking Sites and Forums U.S. market share of visits, Week ending September 24, 2011 Source: Experian Hitwise
64.9%
19.6%
1.22%
1.03%
0.73%
0.66%
0.60%
0.55%
0.39%
0.36%
YouTube
Yahoo! Answers
Tagged
MySpace
Google+
myYearbook
iVillage
The Social Media Data Stacks
17
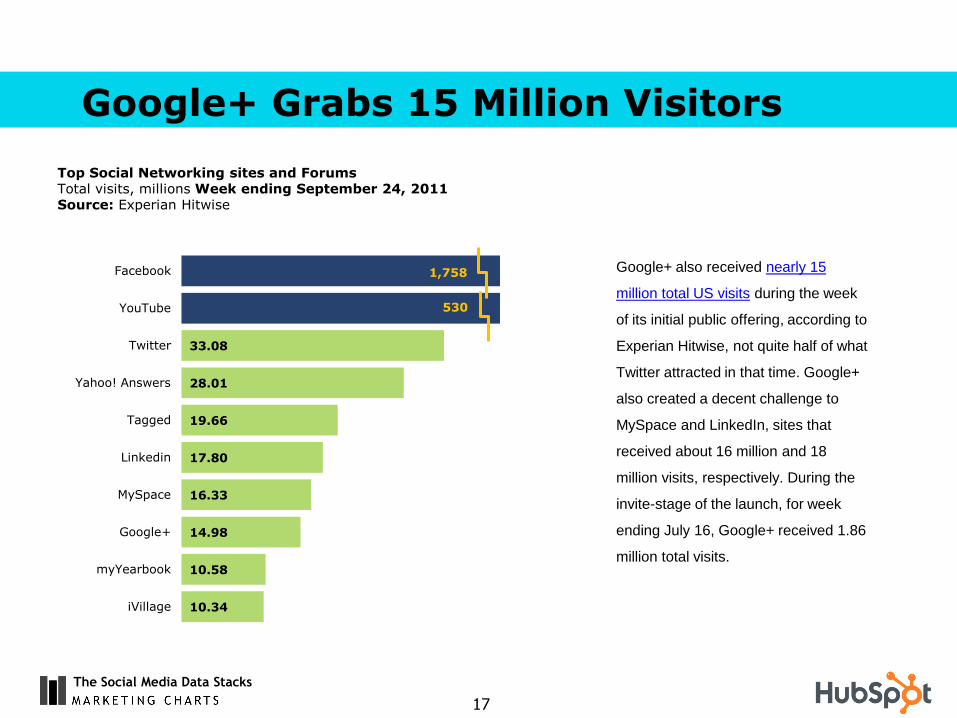
Google+ also received nearly 15
million total US visits during the week
of its initial public offering, according to
Experian Hitwise, not quite half of what
Twitter attracted in that time. Google+
also created a decent challenge to
MySpace and LinkedIn, sites that
received about 16 million and 18
million visits, respectively. During the
invite-stage of the launch, for week
ending July 16, Google+ received 1.86
million total visits.
Google+ Grabs 15 Million Visitors
Top Social Networking sites and Forums Total visits, millions Week ending September 24, 2011 Source: Experian Hitwise
1,758
530
33.08
28.01
19.66
17.80
16.33
14.98
10.58
10.34
YouTube
Yahoo! Answers
Tagged
MySpace
Google+
myYearbook
iVillage
The Social Media Data Stacks
18
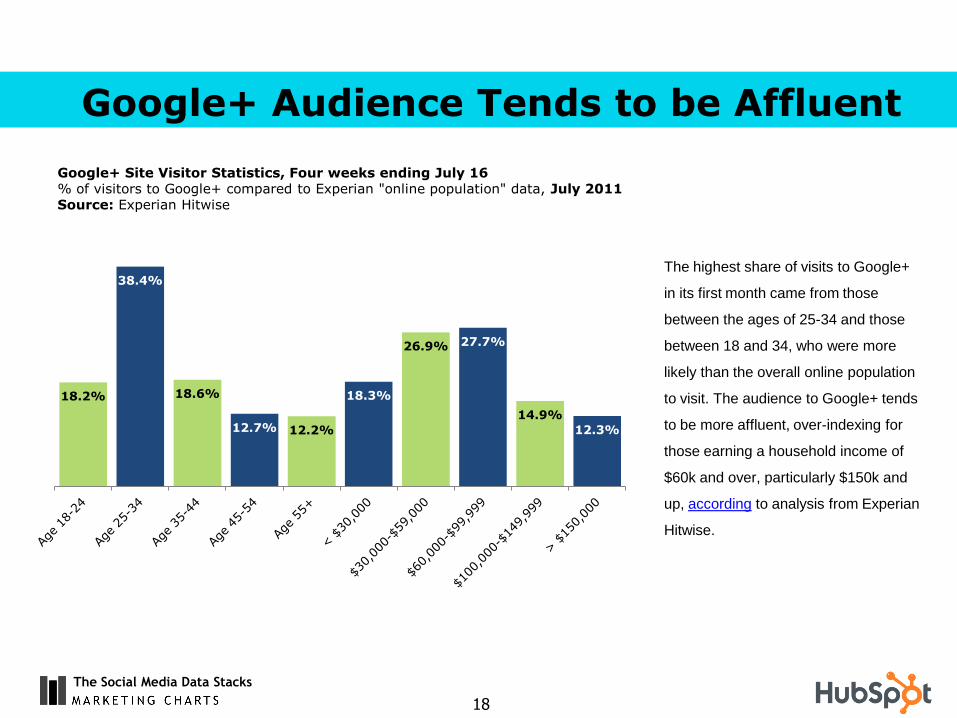
The highest share of visits to Google+
in its first month came from those
between the ages of 25-34 and those
between 18 and 34, who were more
likely than the overall online population
to visit. The audience to Google+ tends
to be more affluent, over-indexing for
those earning a household income of
$60k and over, particularly $150k and
up, according to analysis from Experian
Hitwise.
Google+ Audience Tends to be Affluent
Google+ Site Visitor Statistics, Four weeks ending July 16 % of visitors to Google+ compared to Experian "online population" data, July 2011 Source: Experian Hitwise
18.2%
38.4%
18.6%
12.7% 12.2%
18.3%
26.9% 27.7%
14.9%
12.3%
USER STATS & DATA
The Social Media Data Stacks
20
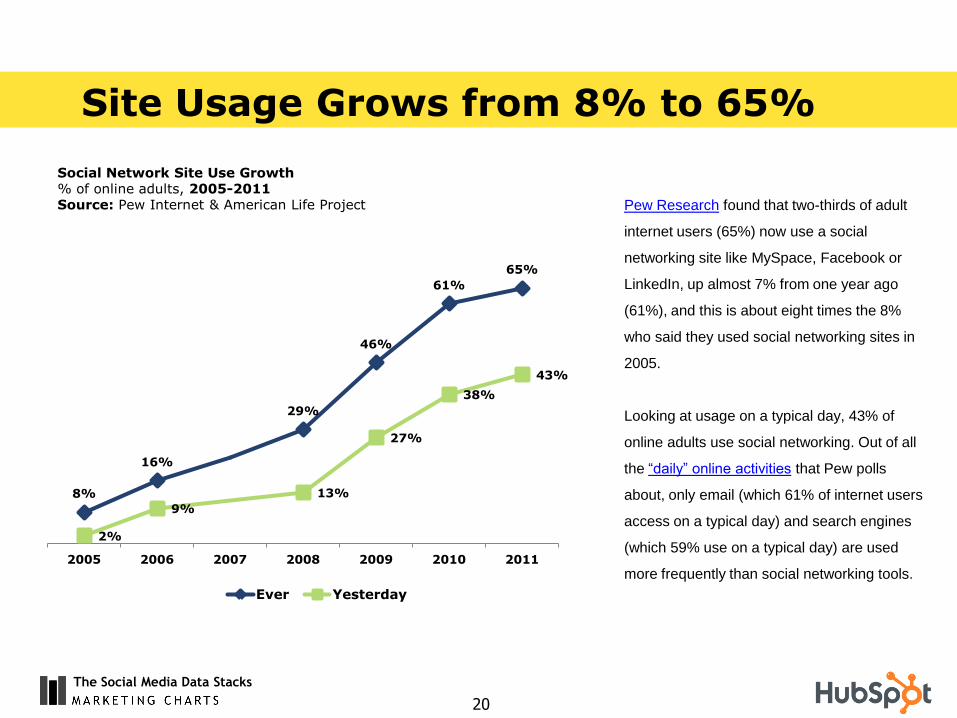
Pew Research found that two-thirds of adult
internet users (65%) now use a social
networking site like MySpace, Facebook or
LinkedIn, up almost 7% from one year ago
(61%), and this is about eight times the 8%
who said they used social networking sites in
2005.
Looking at usage on a typical day, 43% of
online adults use social networking. Out of all
the “daily” online activities that Pew polls
about, only email (which 61% of internet users
access on a typical day) and search engines
(which 59% use on a typical day) are used
more frequently than social networking tools.
Site Usage Grows from 8% to 65%
Social Network Site Use Growth % of online adults, 2005-2011 Source: Pew Internet & American Life Project
8%
16%
29%
46%
61%
65%
2%
9%
13%
27%
38%
43%
2005 2006 2007 2008 2009 2010 2011
Ever Yesterday
The Social Media Data Stacks
21
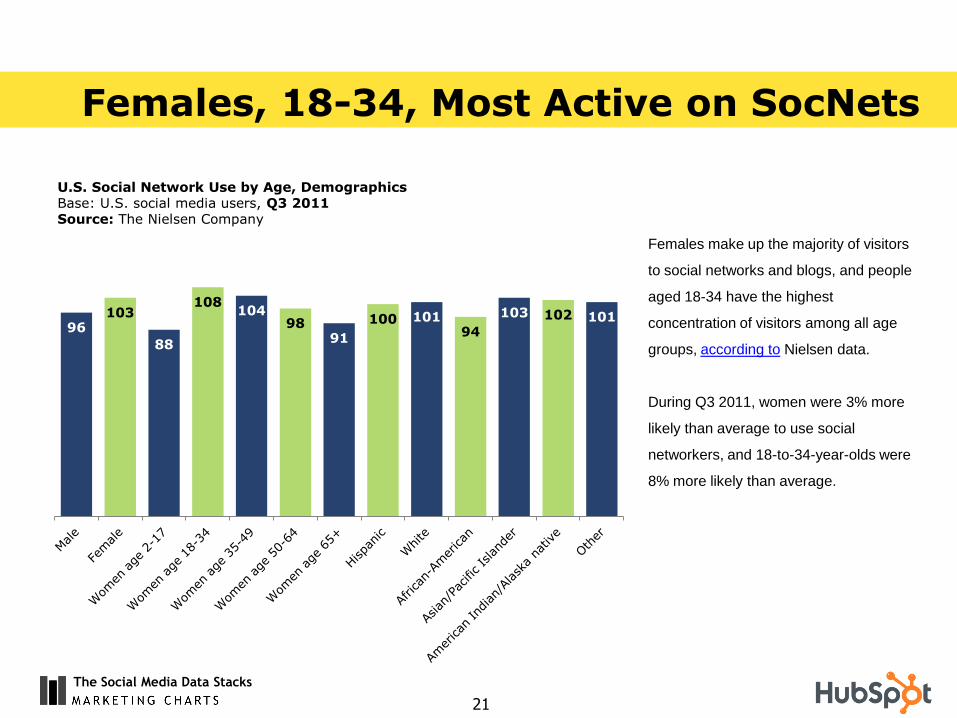
Females make up the majority of visitors
to social networks and blogs, and people
aged 18-34 have the highest
concentration of visitors among all age
groups, according to Nielsen data.
During Q3 2011, women were 3% more
likely than average to use social
networkers, and 18-to-34-year-olds were
8% more likely than average.
Females, 18-34, Most Active on SocNets
U.S. Social Network Use by Age, Demographics Base: U.S. social media users, Q3 2011 Source: The Nielsen Company
96 103
88
108 104
98 91
100 101 94
103 102 101
The Social Media Data Stacks
22
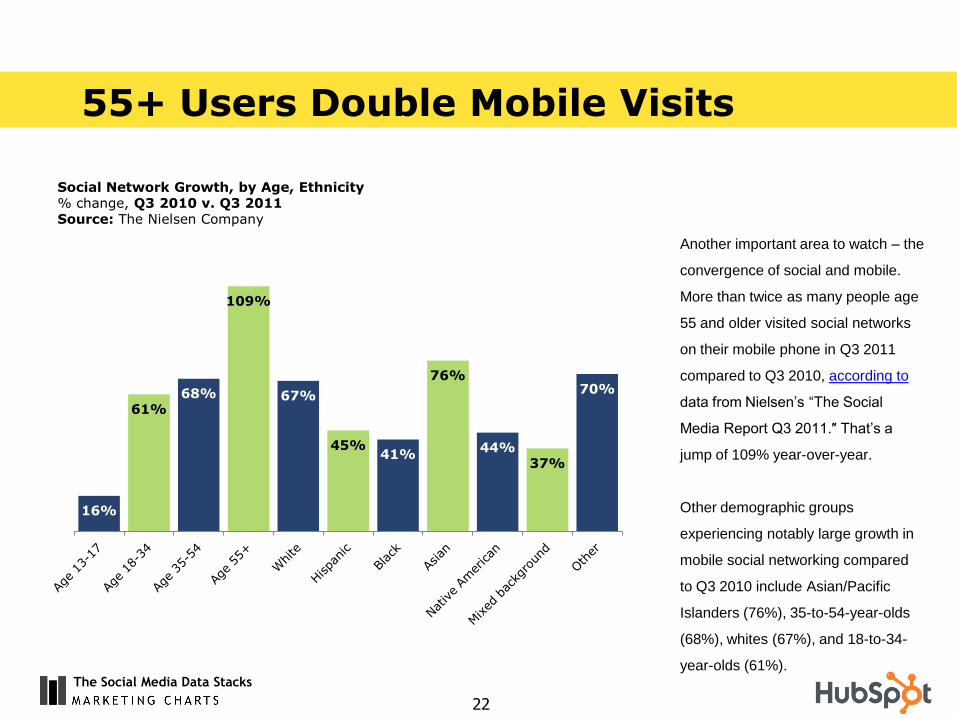
Another important area to watch – the
convergence of social and mobile.
More than twice as many people age
55 and older visited social networks
on their mobile phone in Q3 2011
compared to Q3 2010, according to
data from Nielsen’s “The Social
Media Report Q3 2011.″ That’s a
jump of 109% year-over-year.
Other demographic groups
experiencing notably large growth in
mobile social networking compared
to Q3 2010 include Asian/Pacific
Islanders (76%), 35-to-54-year-olds
(68%), whites (67%), and 18-to-34-
year-olds (61%).
55+ Users Double Mobile Visits
Social Network Growth, by Age, Ethnicity % change, Q3 2010 v. Q3 2011 Source: The Nielsen Company
16%
61% 68%
109%
67%
45% 41%
76%
44% 37%
70%
The Social Media Data Stacks
23
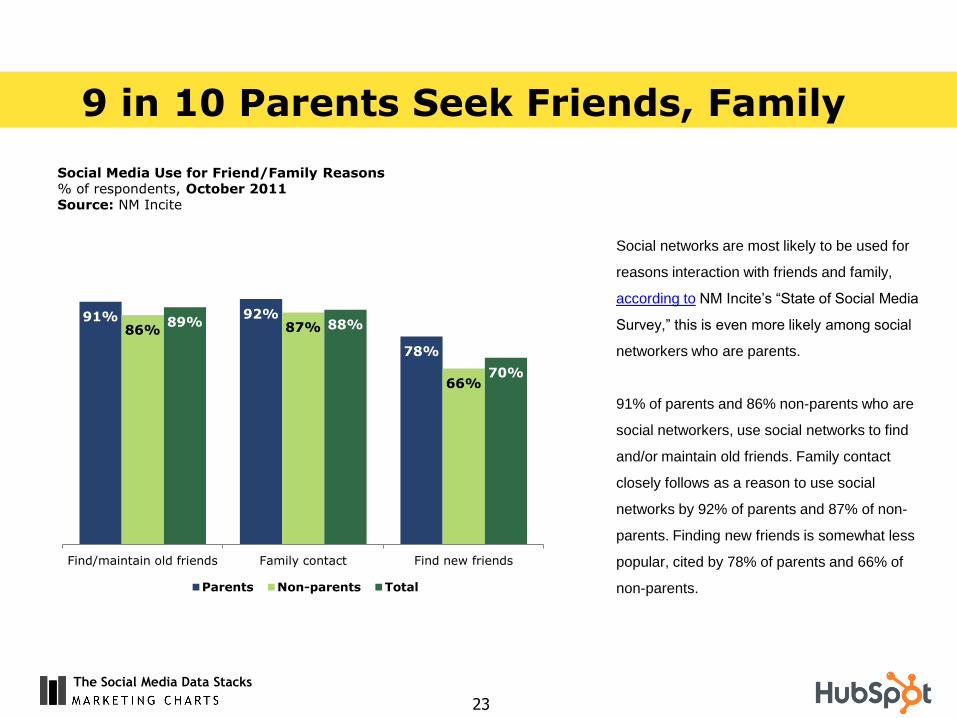
Social networks are most likely to be used for
reasons interaction with friends and family,
according to NM Incite’s “State of Social Media
Survey,” this is even more likely among social
networkers who are parents.
91% of parents and 86% non-parents who are
social networkers, use social networks to find
and/or maintain old friends. Family contact
closely follows as a reason to use social
networks by 92% of parents and 87% of non-
parents. Finding new friends is somewhat less
popular, cited by 78% of parents and 66% of
non-parents.
9 in 10 Parents Seek Friends, Family
Social Media Use for Friend/Family Reasons % of respondents, October 2011 Source: NM Incite
91% 92%
78%
86% 87%
66%
89% 88%
70%
Find/maintain old friends Family contact Find new friends
Parents Non-parents Total
The Social Media Data Stacks
24
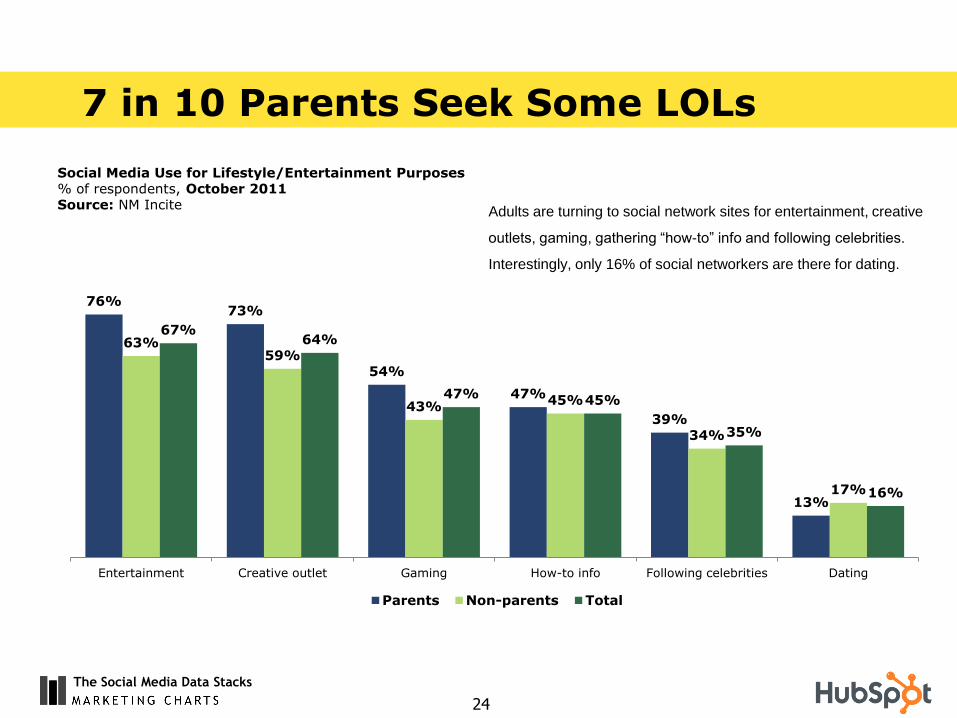
Adults are turning to social network sites for entertainment, creative
outlets, gaming, gathering “how-to” info and following celebrities.
Interestingly, only 16% of social networkers are there for dating.
7 in 10 Parents Seek Some LOLs
Social Media Use for Lifestyle/Entertainment Purposes % of respondents, October 2011 Source: NM Incite
76% 73%
54%
47%
39%
13%
63% 59%
43% 45%
34%
17%
67% 64%
47% 45%
35%
16%
Entertainment Creative outlet Gaming How-to info Following celebrities Dating
Parents Non-parents Total
The Social Media Data Stacks
1
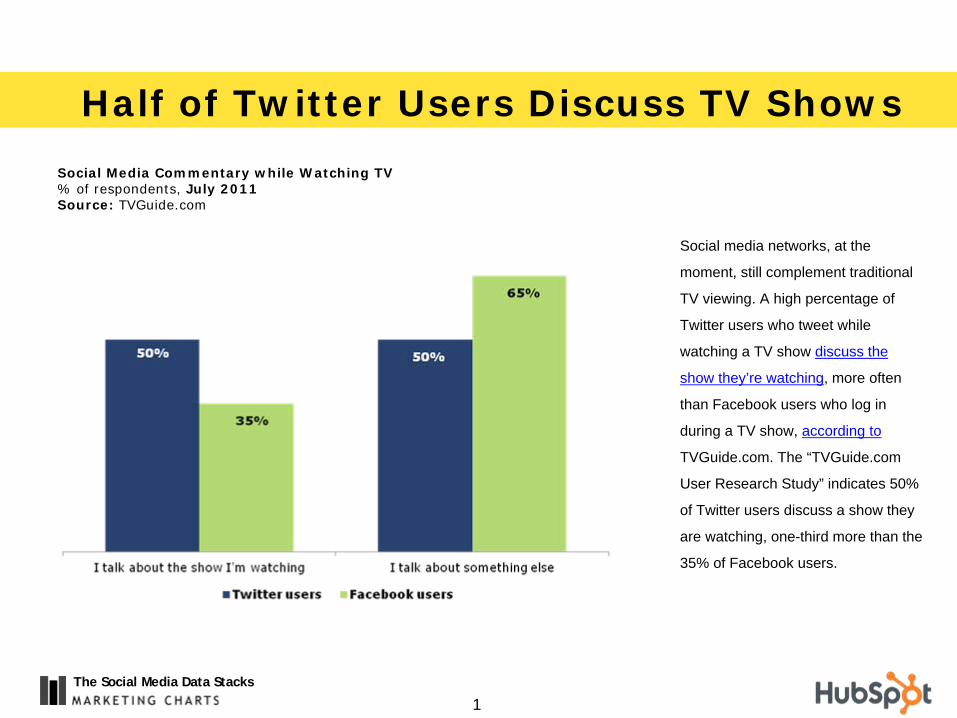
Social media networks, at the
moment, still complement traditional
TV viewing. A high percentage of
Twitter users who tweet while
watching a TV show discuss the
show they’re watching, more often
than Facebook users who log in
during a TV show, according to
TVGuide.com. The “TVGuide.com
User Research Study” indicates 50%
of Twitter users discuss a show they
are watching, one-third more than the
35% of Facebook users.
Half of Twitter Users Discuss TV Shows
Social Media Commentary while Watching TV% of respondents, July 2011Source: TVGuide.com

The Social Media Data Stacks
25
Social media networks, at the
moment, still complement traditional
TV viewing. A high percentage of
Twitter users who tweet while
watching a TV show discuss the
show they’re watching, more often
than Facebook users who log in
during a TV show, according to
TVGuide.com. The “TVGuide.com
User Research Study” indicates 50%
of Twitter users discuss a show they
are watching, one-third more than the
35% of Facebook users.
Half of Viewers Tweet about TV Shows
Social Media Commentary while Watching TV % of respondents, July 2011 Source: TVGuide.com
50% 50%
35%
65%
I talk about the show I'm watching I talk about something else
Twitter users Facebook users
The Social Media Data Stacks
26
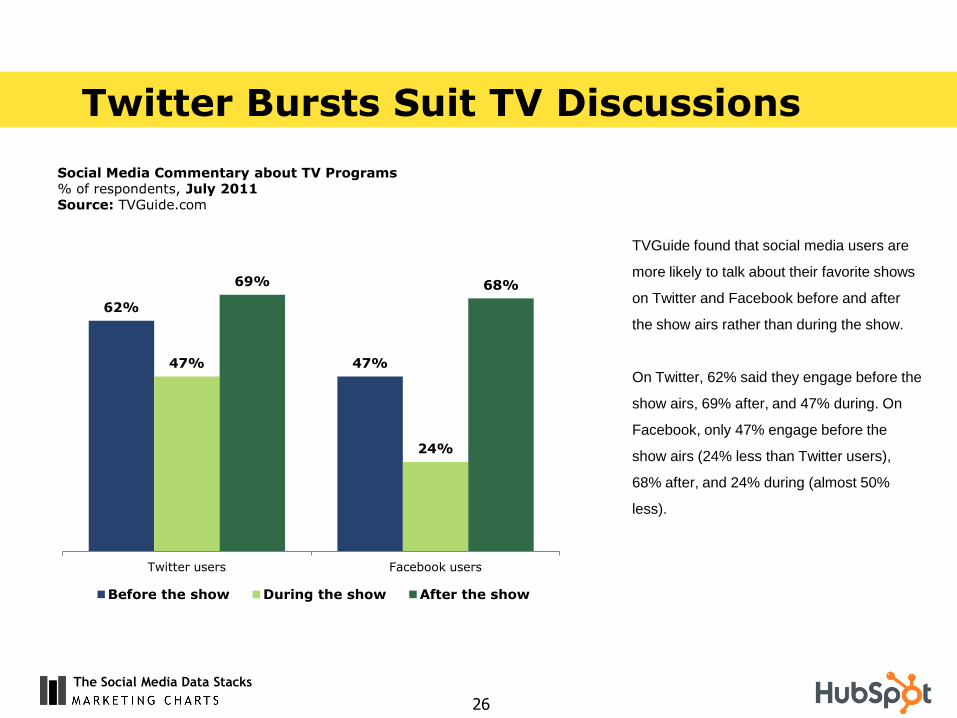
TVGuide found that social media users are
more likely to talk about their favorite shows
on Twitter and Facebook before and after
the show airs rather than during the show.
On Twitter, 62% said they engage before the
show airs, 69% after, and 47% during. On
Facebook, only 47% engage before the
show airs (24% less than Twitter users),
68% after, and 24% during (almost 50%
less).
Twitter Bursts Suit TV Discussions
Social Media Commentary about TV Programs % of respondents, July 2011 Source: TVGuide.com
62%
47% 47%
24%
69% 68%
Twitter users Facebook users
Before the show During the show After the show
The Social Media Data Stacks
27
LinkedIn Top Choice for Journalists
Social Media Use by Journalists % of respondents, August 2011 Source: Arketi Web Watch
92%
85% 84%
58%
49%
28%
20% 18%
15% 14%
LinkedIn Facebook Twitter YouTube Blog site Flickr Digg MySpace Delicious Foursquare
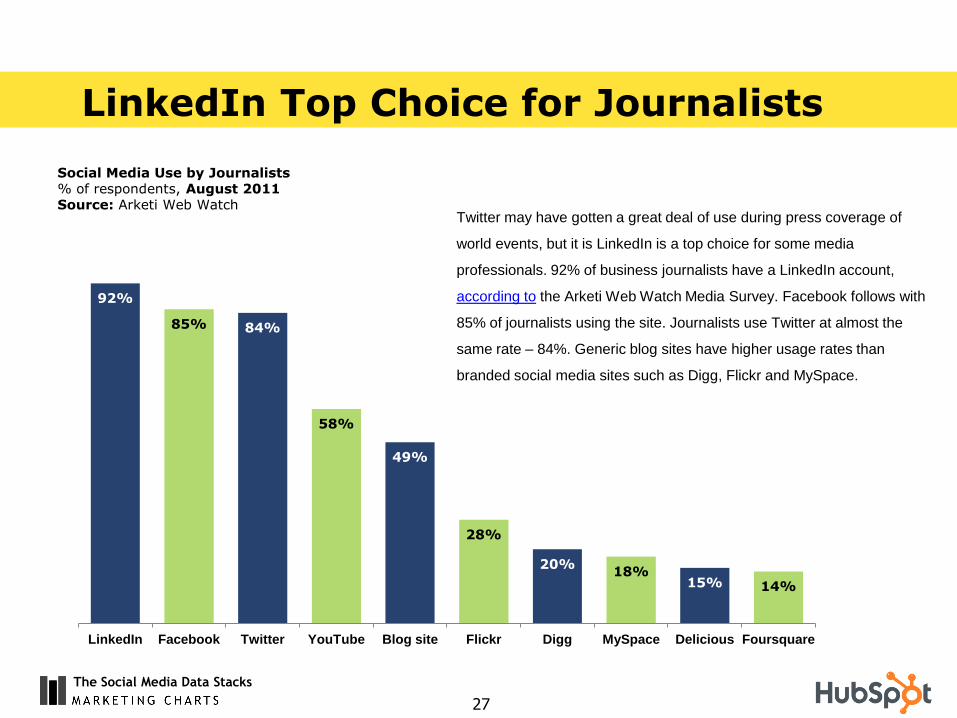
Twitter may have gotten a great deal of use during press coverage of
world events, but it is LinkedIn is a top choice for some media
professionals. 92% of business journalists have a LinkedIn account,
according to the Arketi Web Watch Media Survey. Facebook follows with
85% of journalists using the site. Journalists use Twitter at almost the
same rate – 84%. Generic blog sites have higher usage rates than
branded social media sites such as Digg, Flickr and MySpace.

COMPANIES & SOCIAL MEDIA MARKETING
The Social Media Data Stacks
29
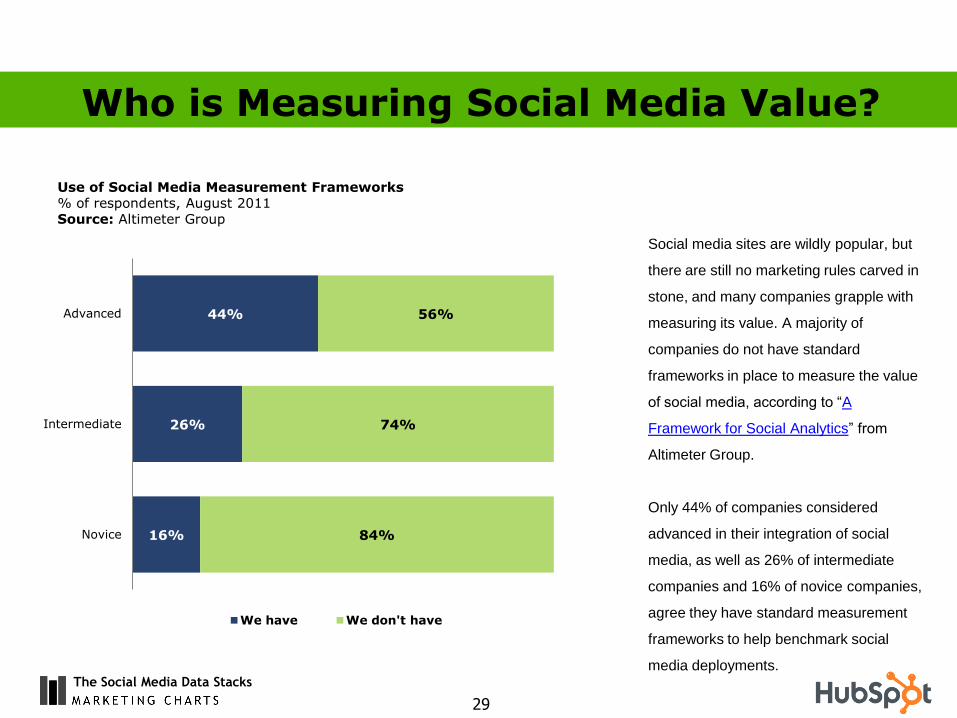
Social media sites are wildly popular, but
there are still no marketing rules carved in
stone, and many companies grapple with
measuring its value. A majority of
companies do not have standard
frameworks in place to measure the value
of social media, according to “A
Framework for Social Analytics” from
Altimeter Group.
Only 44% of companies considered
advanced in their integration of social
media, as well as 26% of intermediate
companies and 16% of novice companies,
agree they have standard measurement
frameworks to help benchmark social
media deployments.
Who is Measuring Social Media Value?
Use of Social Media Measurement Frameworks % of respondents, August 2011 Source: Altimeter Group
16%
26%
44%
84%
74%
56%
Novice
Intermediate
Advanced
We have We don't have
The Social Media Data Stacks
30
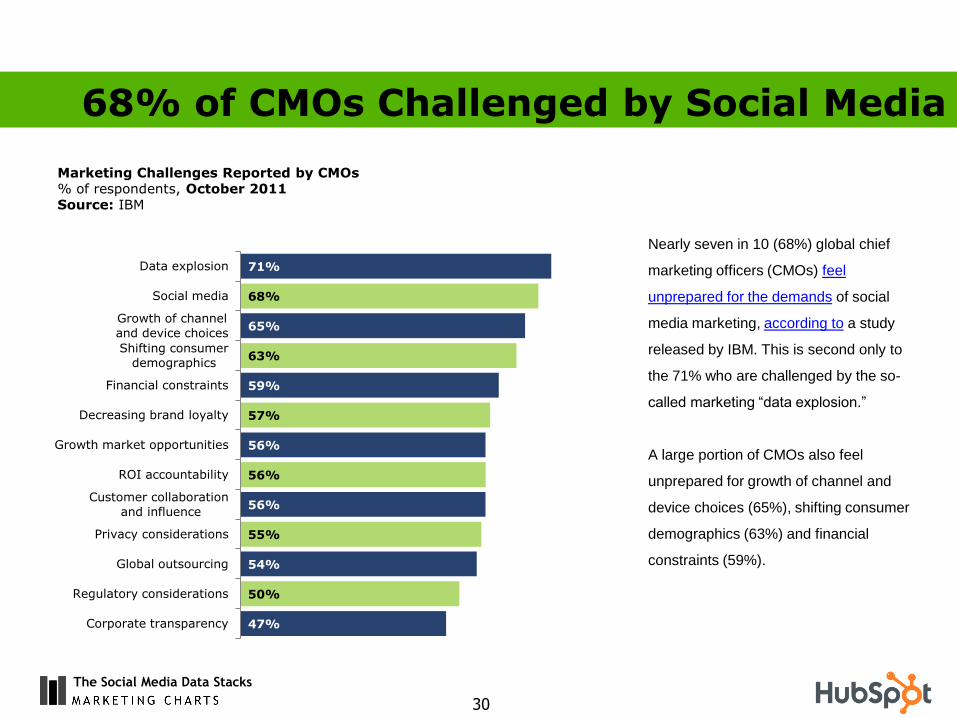
Nearly seven in 10 (68%) global chief
marketing officers (CMOs) feel
unprepared for the demands of social
media marketing, according to a study
released by IBM. This is second only to
the 71% who are challenged by the so-
called marketing “data explosion.”
A large portion of CMOs also feel
unprepared for growth of channel and
device choices (65%), shifting consumer
demographics (63%) and financial
constraints (59%).
68% of CMOs Challenged by Social Media
Marketing Challenges Reported by CMOs % of respondents, October 2011 Source: IBM
71%
68%
65%
63%
59%
57%
56%
56%
56%
55%
54%
50%
47%
Data explosion
Social media
Growth of channel
and device choices
Shifting consumer
demographics
Financial constraints
Decreasing brand loyalty
Growth market opportunities
ROI accountability
Customer collaboration
and influence
Privacy considerations
Global outsourcing
Regulatory considerations
Corporate transparency
The Social Media Data Stacks
31
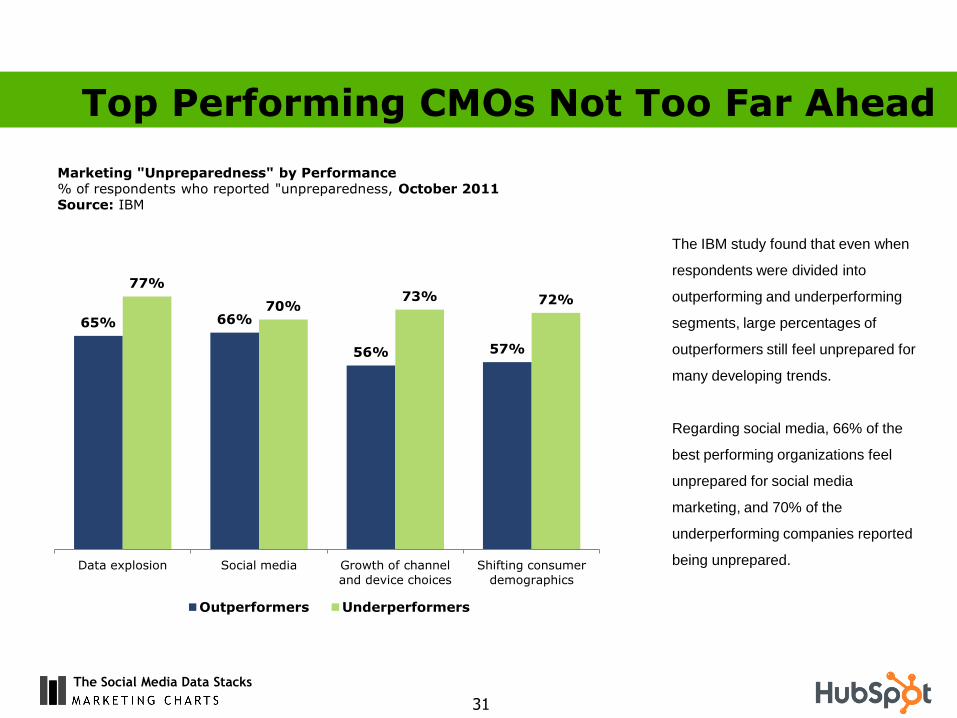
The IBM study found that even when
respondents were divided into
outperforming and underperforming
segments, large percentages of
outperformers still feel unprepared for
many developing trends.
Regarding social media, 66% of the
best performing organizations feel
unprepared for social media
marketing, and 70% of the
underperforming companies reported
being unprepared.
Top Performing CMOs Not Too Far Ahead
Marketing "Unpreparedness" by Performance % of respondents who reported "unpreparedness, October 2011 Source: IBM
65% 66%
56% 57%
77%
70% 73% 72%
Data explosion Social media Growth of channel
and device choices
Shifting consumer
demographics
Outperformers Underperformers
The Social Media Data Stacks
32
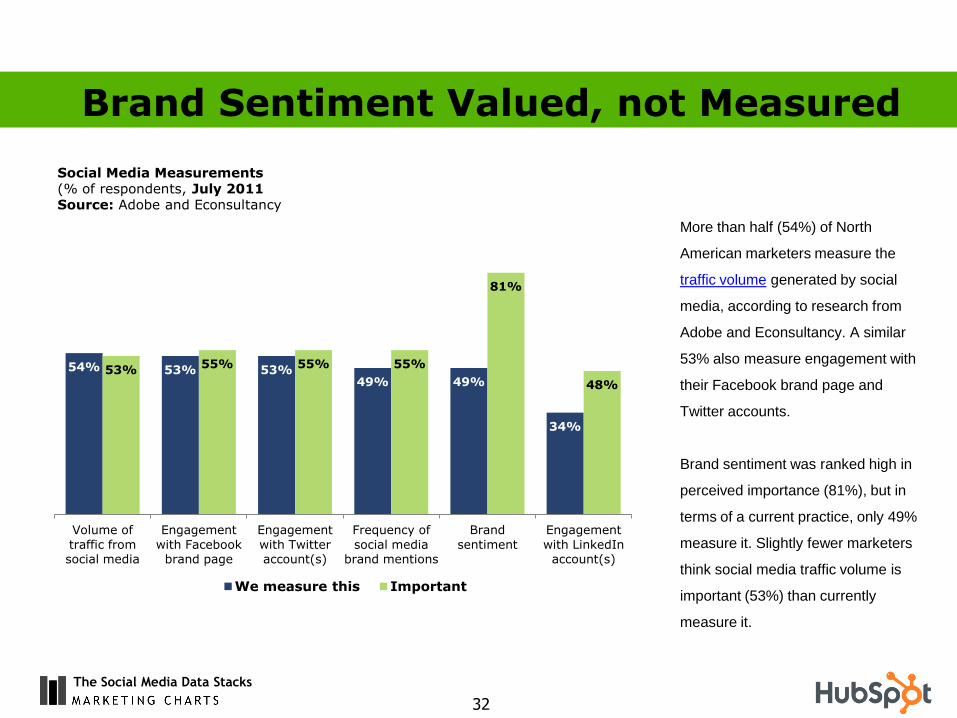
More than half (54%) of North
American marketers measure the
traffic volume generated by social
media, according to research from
Adobe and Econsultancy. A similar
53% also measure engagement with
their Facebook brand page and
Twitter accounts.
Brand sentiment was ranked high in
perceived importance (81%), but in
terms of a current practice, only 49%
measure it. Slightly fewer marketers
think social media traffic volume is
important (53%) than currently
measure it.
Brand Sentiment Valued, not Measured
Social Media Measurements (% of respondents, July 2011 Source: Adobe and Econsultancy
54% 53% 53% 49% 49%
34%
53% 55% 55% 55%
81%
48%
Volume of
traffic from social media
Engagement
with Facebook brand page
Engagement
with Twitter account(s)
Frequency of
social media brand mentions
Brand
sentiment
Engagement
with LinkedIn account(s)
We measure this Important
The Social Media Data Stacks
33
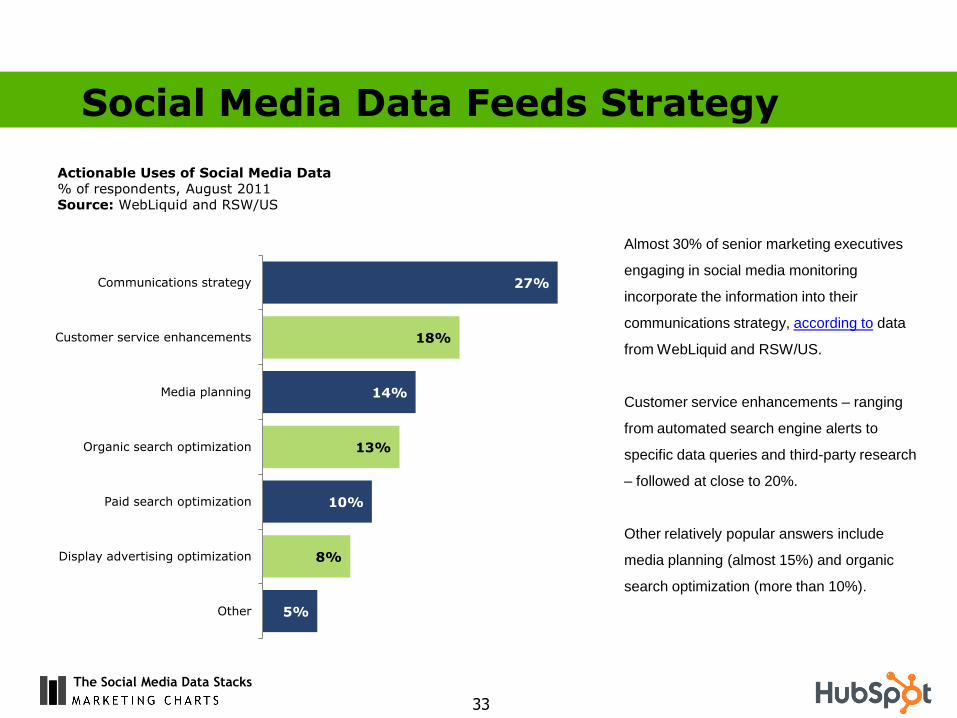
Almost 30% of senior marketing executives
engaging in social media monitoring
incorporate the information into their
communications strategy, according to data
from WebLiquid and RSW/US.
Customer service enhancements – ranging
from automated search engine alerts to
specific data queries and third-party research
– followed at close to 20%.
Other relatively popular answers include
media planning (almost 15%) and organic
search optimization (more than 10%).
Social Media Data Feeds Strategy
Actionable Uses of Social Media Data % of respondents, August 2011 Source: WebLiquid and RSW/US
5%
8%
10%
13%
14%
18%
27%
Other
Display advertising optimization
Paid search optimization
Organic search optimization
Media planning
Customer service enhancements
Communications strategy
The Social Media Data Stacks
34
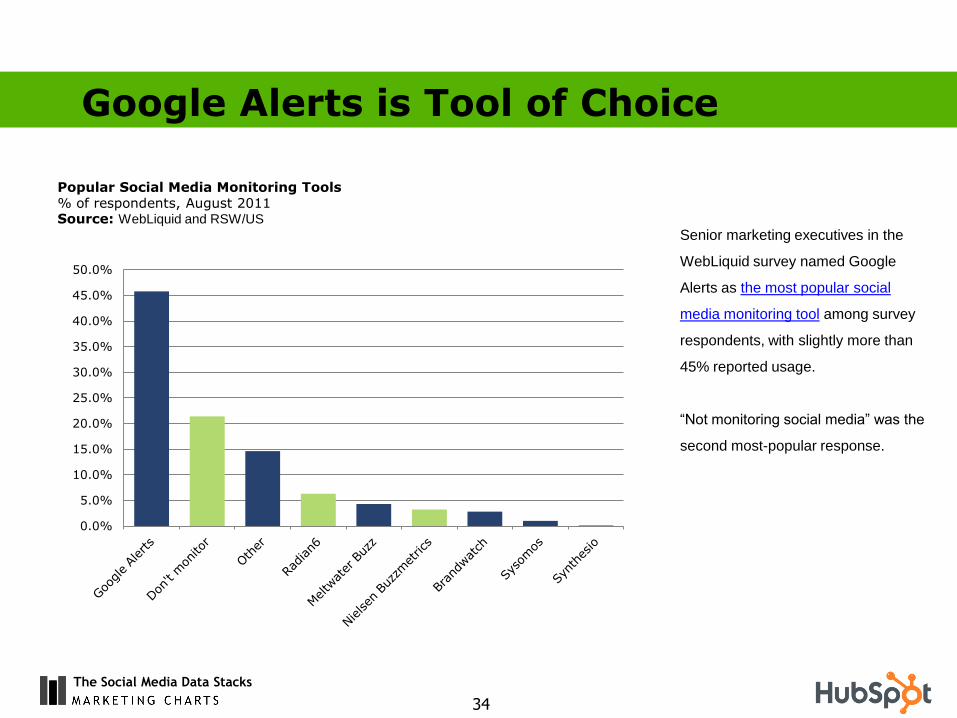
Senior marketing executives in the
WebLiquid survey named Google
Alerts as the most popular social
media monitoring tool among survey
respondents, with slightly more than
45% reported usage.
“Not monitoring social media” was the
second most-popular response.
Google Alerts is Tool of Choice
Popular Social Media Monitoring Tools % of respondents, August 2011 Source: WebLiquid and RSW/US
0.0%
5.0%
10.0%
15.0%
20.0%
25.0%
30.0%
35.0%
40.0%
45.0%
50.0%
The Social Media Data Stacks
35
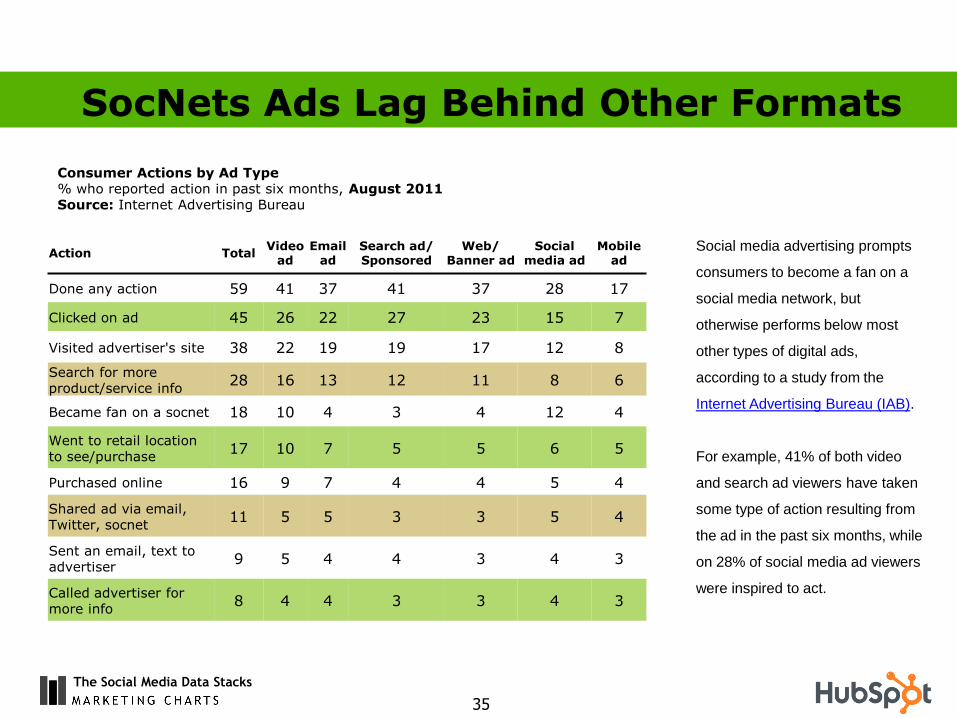
Social media advertising prompts
consumers to become a fan on a
social media network, but
otherwise performs below most
other types of digital ads,
according to a study from the
Internet Advertising Bureau (IAB).
For example, 41% of both video
and search ad viewers have taken
some type of action resulting from
the ad in the past six months, while
on 28% of social media ad viewers
were inspired to act.
SocNets Ads Lag Behind Other Formats
Consumer Actions by Ad Type % who reported action in past six months, August 2011 Source: Internet Advertising Bureau
Action Total Video
ad Email
ad Search ad/ Sponsored
Web/ Banner ad
Social media ad
Mobile ad
Done any action 59 41 37 41 37 28 17
Clicked on ad 45 26 22 27 23 15 7
Visited advertiser's site 38 22 19 19 17 12 8
Search for more product/service info
28 16 13 12 11 8 6
Became fan on a socnet 18 10 4 3 4 12 4
Went to retail location to see/purchase
17 10 7 5 5 6 5
Purchased online 16 9 7 4 4 5 4
Shared ad via email, Twitter, socnet
11 5 5 3 3 5 4
Sent an email, text to advertiser
9 5 4 4 3 4 3
Called advertiser for more info
8 4 4 3 3 4 3
The Social Media Data Stacks
36
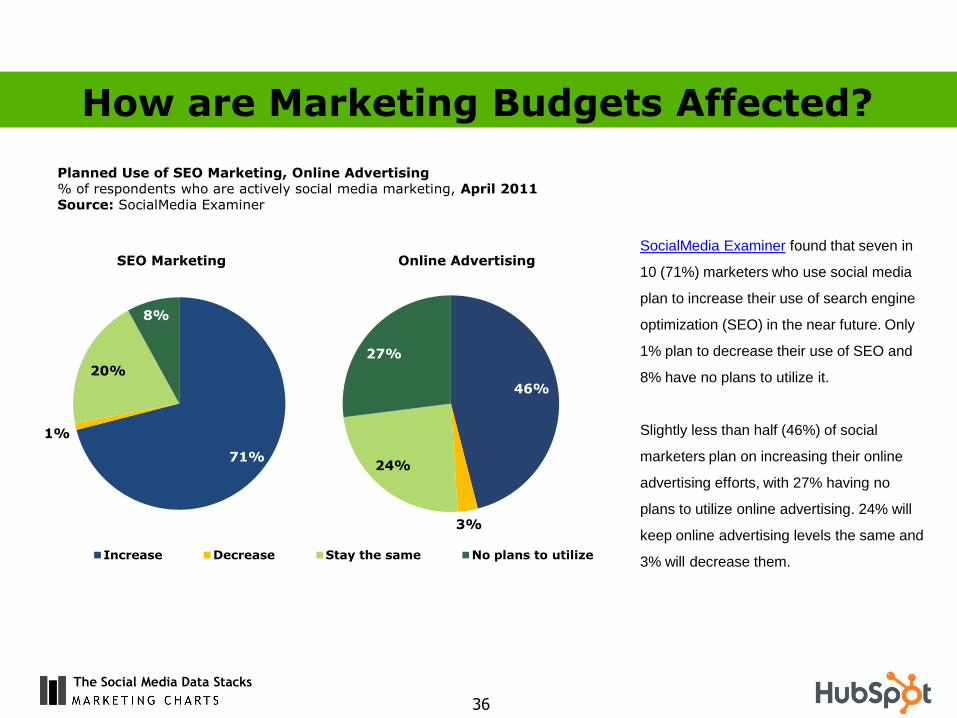
SocialMedia Examiner found that seven in
10 (71%) marketers who use social media
plan to increase their use of search engine
optimization (SEO) in the near future. Only
1% plan to decrease their use of SEO and
8% have no plans to utilize it.
Slightly less than half (46%) of social
marketers plan on increasing their online
advertising efforts, with 27% having no
plans to utilize online advertising. 24% will
keep online advertising levels the same and
3% will decrease them.
How are Marketing Budgets Affected?
Planned Use of SEO Marketing, Online Advertising % of respondents who are actively social media marketing, April 2011 Source: SocialMedia Examiner
71%
1%
20%
8%
Increase Decrease Stay the same No plans to utilize
46%
3%
24%
27%
SEO Marketing Online Advertising
The Social Media Data Stacks
37
65%
3%
27%
5%
Increase Decrease Stay the same No plans to utilize
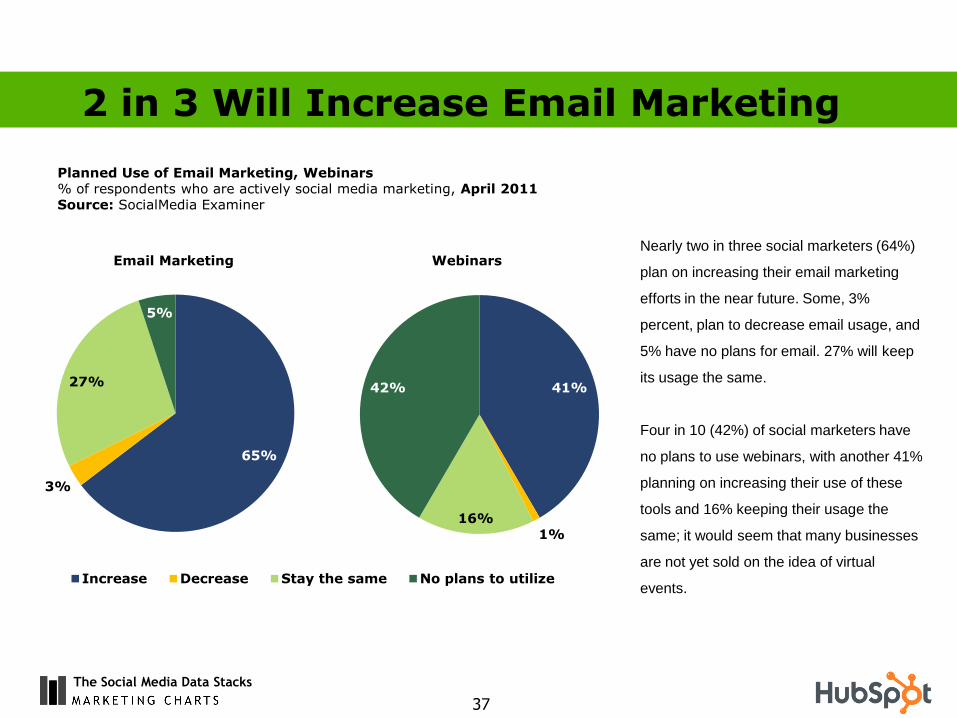
Nearly two in three social marketers (64%)
plan on increasing their email marketing
efforts in the near future. Some, 3%
percent, plan to decrease email usage, and
5% have no plans for email. 27% will keep
its usage the same.
Four in 10 (42%) of social marketers have
no plans to use webinars, with another 41%
planning on increasing their use of these
tools and 16% keeping their usage the
same; it would seem that many businesses
are not yet sold on the idea of virtual
events.
2 in 3 Will Increase Email Marketing
Planned Use of Email Marketing, Webinars % of respondents who are actively social media marketing, April 2011 Source: SocialMedia Examiner
Email Marketing Webinars
41%
1% 16%
42%
The Social Media Data Stacks
38
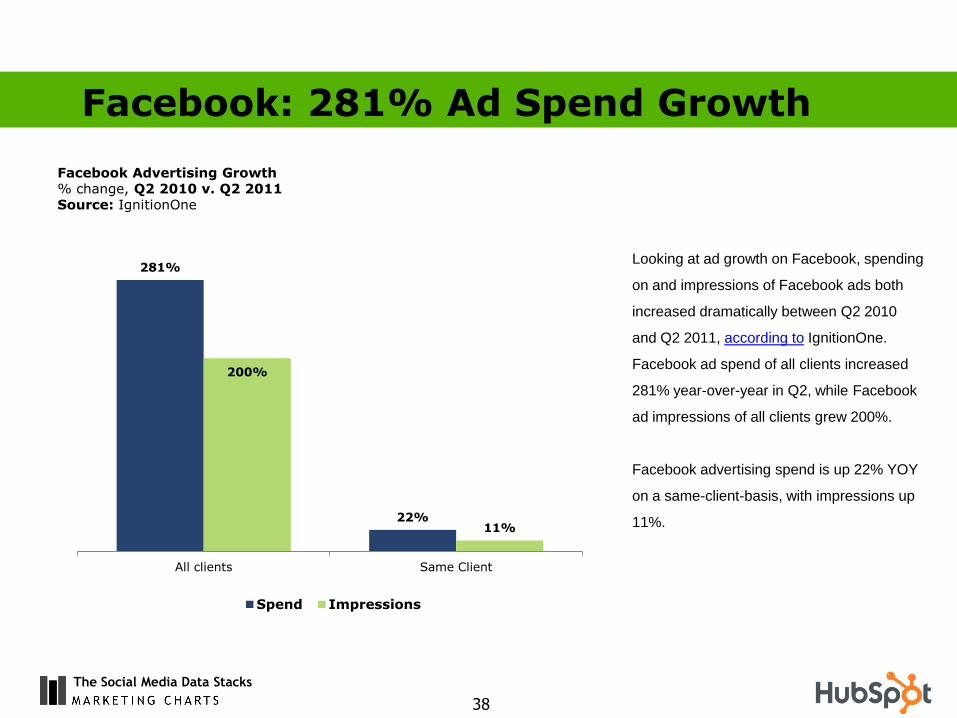
Looking at ad growth on Facebook, spending
on and impressions of Facebook ads both
increased dramatically between Q2 2010
and Q2 2011, according to IgnitionOne.
Facebook ad spend of all clients increased
281% year-over-year in Q2, while Facebook
ad impressions of all clients grew 200%.
Facebook advertising spend is up 22% YOY
on a same-client-basis, with impressions up
11%.
Facebook: 281% Ad Spend Growth
Facebook Advertising Growth % change, Q2 2010 v. Q2 2011 Source: IgnitionOne
281%
22%
200%
11%
All clients Same Client
Spend Impressions
CONSUMERS & SOCIAL MEDIA MARKETING
The Social Media Data Stacks
40
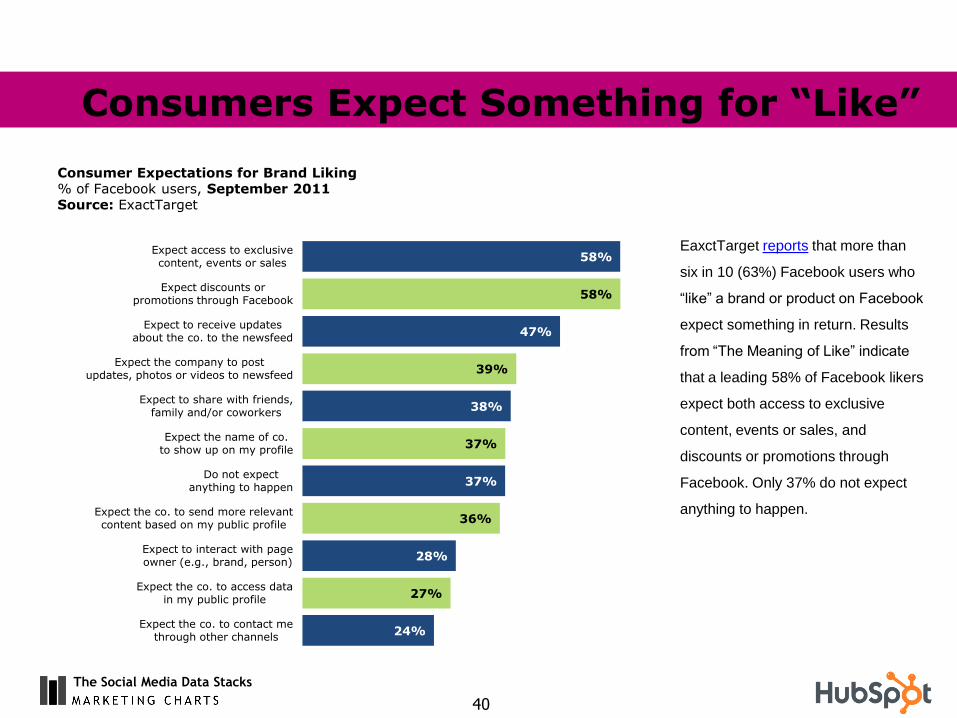
EaxctTarget reports that more than
six in 10 (63%) Facebook users who
“like” a brand or product on Facebook
expect something in return. Results
from “The Meaning of Like” indicate
that a leading 58% of Facebook likers
expect both access to exclusive
content, events or sales, and
discounts or promotions through
Facebook. Only 37% do not expect
anything to happen.
Consumers Expect Something for “Like”
Consumer Expectations for Brand Liking % of Facebook users, September 2011 Source: ExactTarget
58%
58%
47%
39%
38%
37%
37%
36%
28%
27%
24%
Expect access to exclusive content, events or sales
Expect discounts or promotions through Facebook
Expect to receive updates about the co. to the newsfeed
Expect the company to post updates, photos or videos to newsfeed
Expect to share with friends, family and/or coworkers
Expect the name of co. to show up on my profile
Do not expect anything to happen
Expect the co. to send more relevant content based on my public profile
Expect to interact with page owner (e.g., brand, person)
Expect the co. to access data in my public profile
Expect the co. to contact me through other channels
The Social Media Data Stacks
41
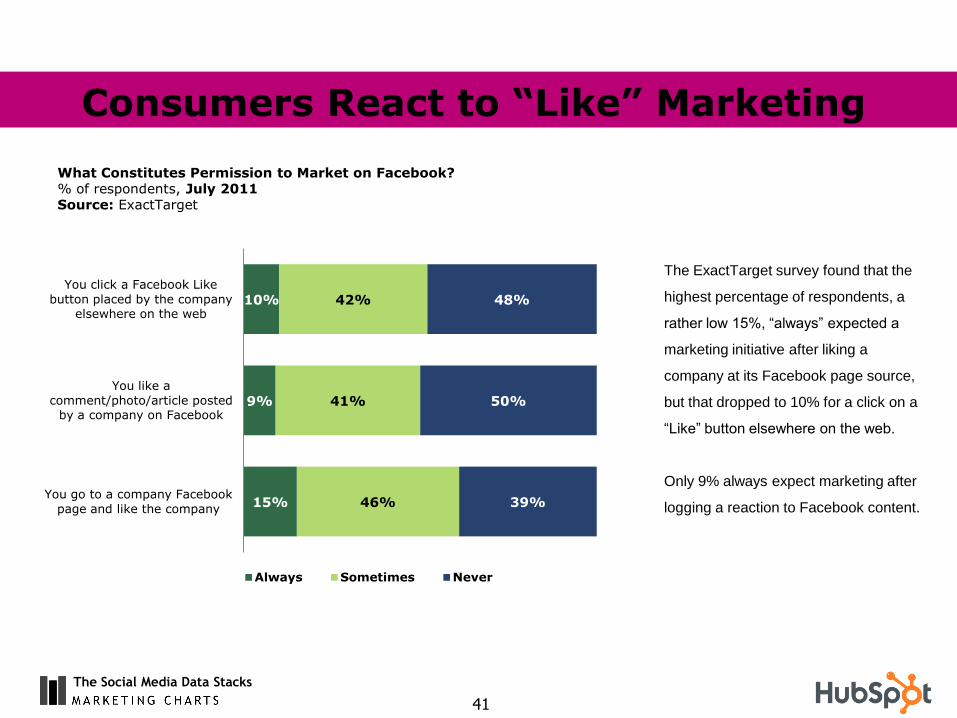
The ExactTarget survey found that the
highest percentage of respondents, a
rather low 15%, “always” expected a
marketing initiative after liking a
company at its Facebook page source,
but that dropped to 10% for a click on a
“Like” button elsewhere on the web.
Only 9% always expect marketing after
logging a reaction to Facebook content.
Consumers React to “Like” Marketing
What Constitutes Permission to Market on Facebook? % of respondents, July 2011 Source: ExactTarget
15%
9%
10%
46%
41%
42%
39%
50%
48%
You go to a company Facebook
page and like the company
You like a
comment/photo/article posted by a company on Facebook
You click a Facebook Like
button placed by the company elsewhere on the web
Always Sometimes Never
The Social Media Data Stacks
42
3%
7% 6%
11%
26%
13%
28%
4% 2%
More than
once a day
Once
a day
Every other
day
Twice
a week
Once
a week
Twice a
month
Once a
month or
less
Never Other
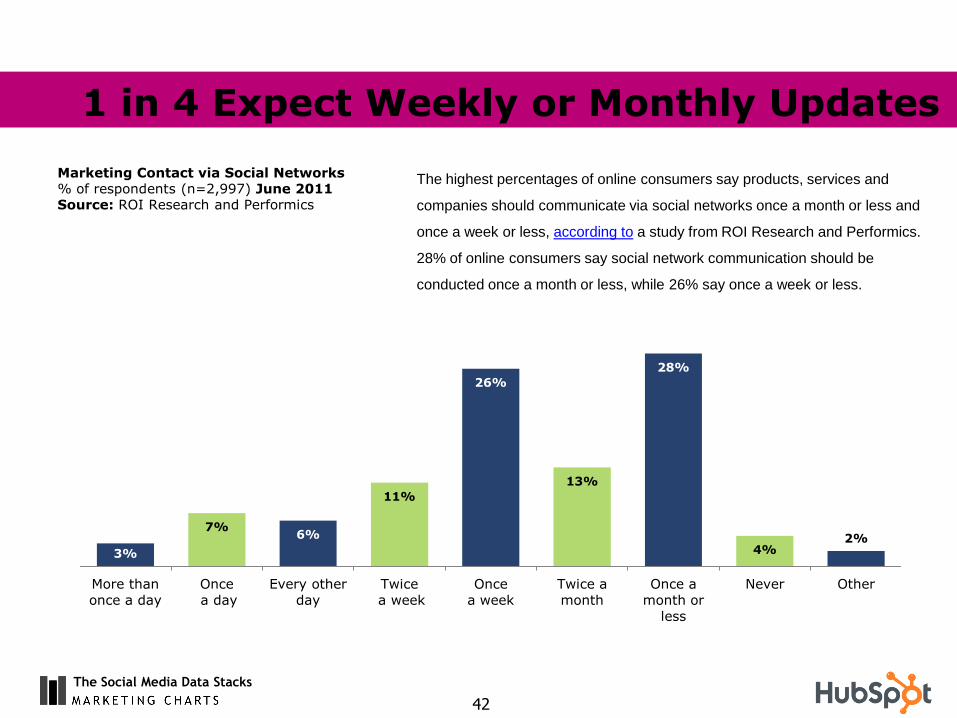
The highest percentages of online consumers say products, services and
companies should communicate via social networks once a month or less and
once a week or less, according to a study from ROI Research and Performics.
28% of online consumers say social network communication should be
conducted once a month or less, while 26% say once a week or less.
1 in 4 Expect Weekly or Monthly Updates
Marketing Contact via Social Networks % of respondents (n=2,997) June 2011 Source: ROI Research and Performics
The Social Media Data Stacks
43
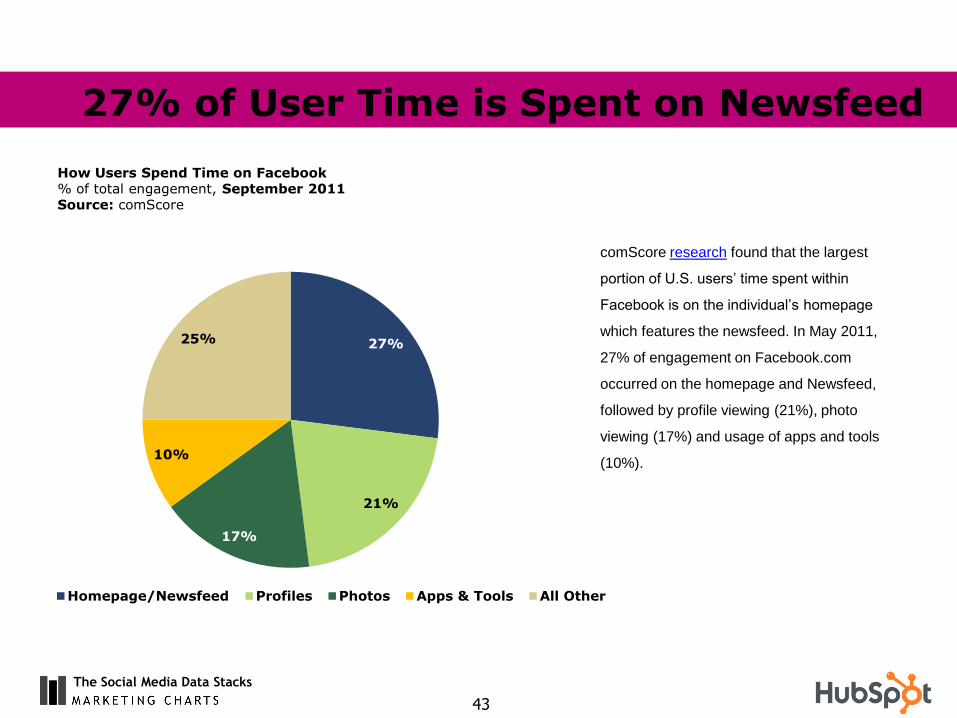
comScore research found that the largest
portion of U.S. users’ time spent within
Facebook is on the individual’s homepage
which features the newsfeed. In May 2011,
27% of engagement on Facebook.com
occurred on the homepage and Newsfeed,
followed by profile viewing (21%), photo
viewing (17%) and usage of apps and tools
(10%).
27% of User Time is Spent on Newsfeed
How Users Spend Time on Facebook % of total engagement, September 2011 Source: comScore
27%
21%
17%
10%
25%
Homepage/Newsfeed Profiles Photos Apps & Tools All Other
The Social Media Data Stacks
44
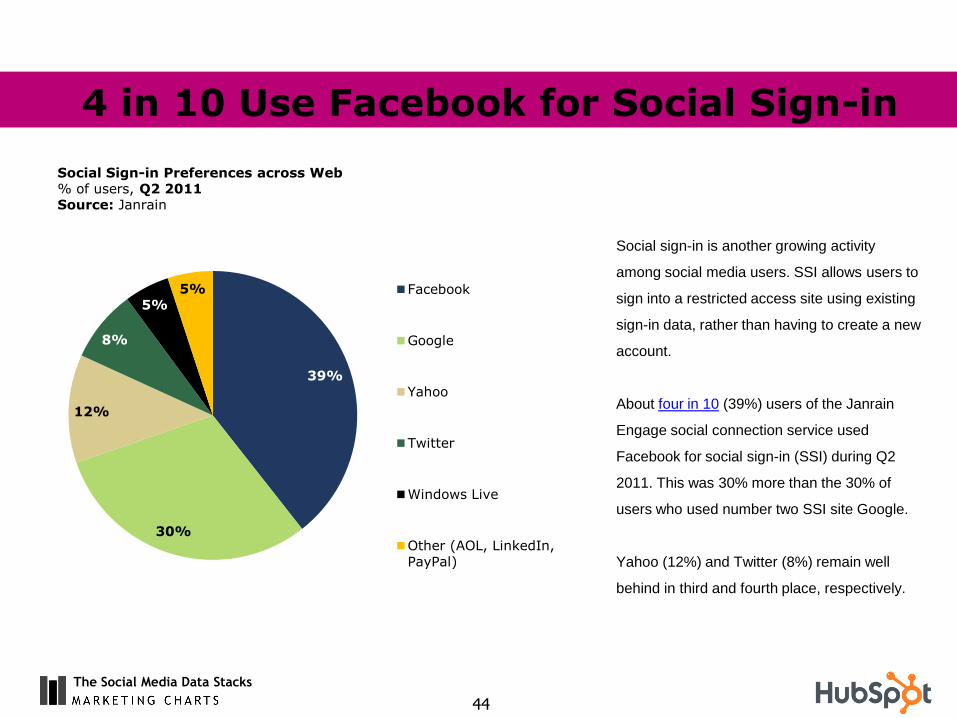
Social sign-in is another growing activity
among social media users. SSI allows users to
sign into a restricted access site using existing
sign-in data, rather than having to create a new
account.
About four in 10 (39%) users of the Janrain
Engage social connection service used
Facebook for social sign-in (SSI) during Q2
2011. This was 30% more than the 30% of
users who used number two SSI site Google.
Yahoo (12%) and Twitter (8%) remain well
behind in third and fourth place, respectively.
4 in 10 Use Facebook for Social Sign-in
Social Sign-in Preferences across Web % of users, Q2 2011 Source: Janrain
39%
30%
12%
8%
5% 5% Facebook
Yahoo
Windows Live
Other (AOL, LinkedIn,
PayPal)
The Social Media Data Stacks
45
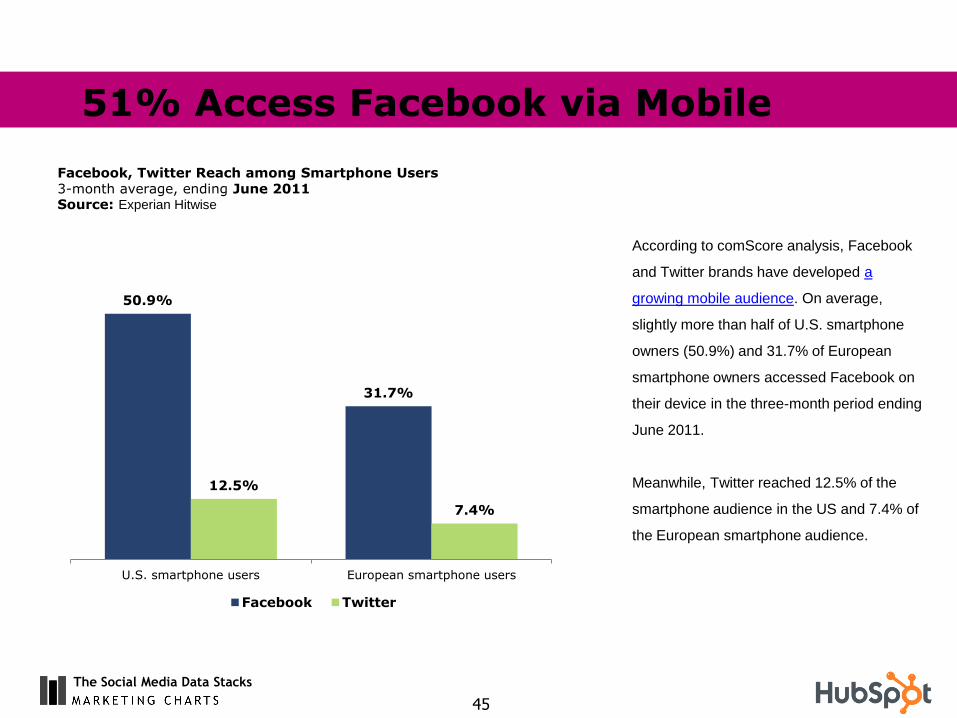
According to comScore analysis, Facebook
and Twitter brands have developed a
growing mobile audience. On average,
slightly more than half of U.S. smartphone
owners (50.9%) and 31.7% of European
smartphone owners accessed Facebook on
their device in the three-month period ending
June 2011.
Meanwhile, Twitter reached 12.5% of the
smartphone audience in the US and 7.4% of
the European smartphone audience.
51% Access Facebook via Mobile
Facebook, Twitter Reach among Smartphone Users 3-month average, ending June 2011 Source: Experian Hitwise
50.9%
31.7%
12.5%
7.4%
U.S. smartphone users European smartphone users
Facebook Twitter
The Social Media Data Stacks
46
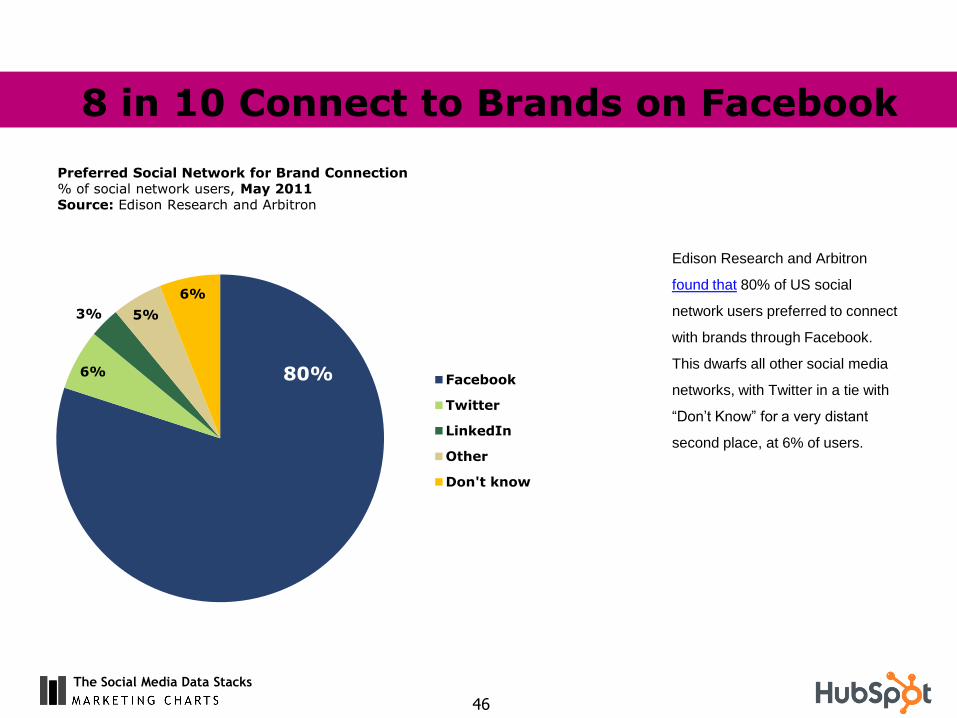
Edison Research and Arbitron
found that 80% of US social
network users preferred to connect
with brands through Facebook.
This dwarfs all other social media
networks, with Twitter in a tie with
“Don’t Know” for a very distant
second place, at 6% of users.
8 in 10 Connect to Brands on Facebook
Preferred Social Network for Brand Connection % of social network users, May 2011 Source: Edison Research and Arbitron
80% 6%
3% 5%
6%
Other
Don't know
The Social Media Data Stacks
47
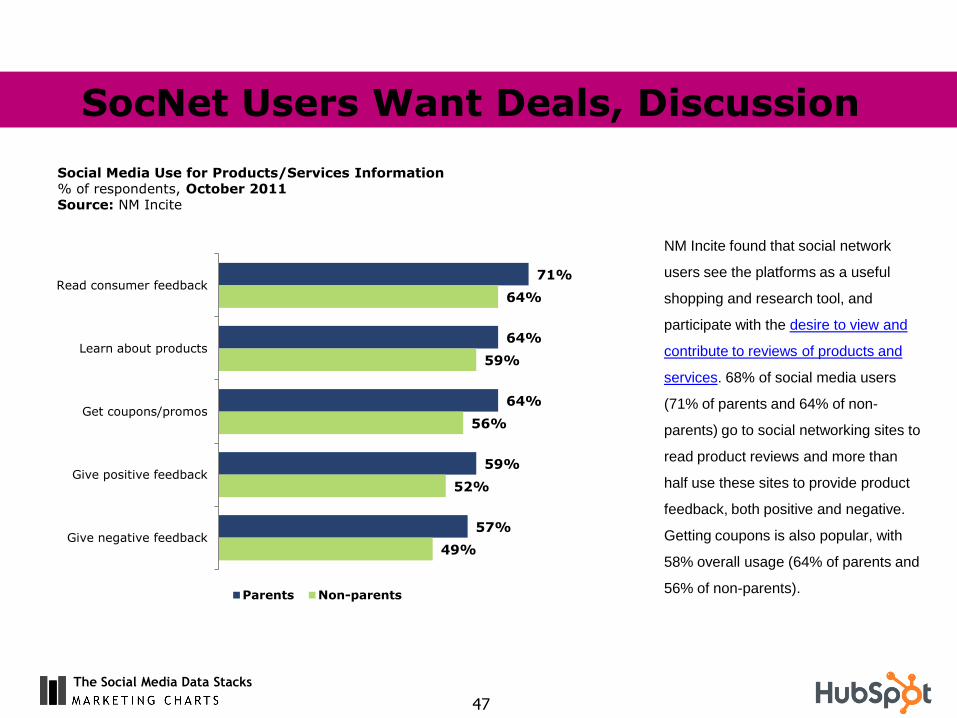
NM Incite found that social network
users see the platforms as a useful
shopping and research tool, and
participate with the desire to view and
contribute to reviews of products and
services. 68% of social media users
(71% of parents and 64% of non-
parents) go to social networking sites to
read product reviews and more than
half use these sites to provide product
feedback, both positive and negative.
Getting coupons is also popular, with
58% overall usage (64% of parents and
56% of non-parents).
SocNet Users Want Deals, Discussion
Social Media Use for Products/Services Information % of respondents, October 2011 Source: NM Incite
71%
64%
64%
59%
57%
64%
59%
56%
52%
49%
Read consumer feedback
Learn about products
Get coupons/promos
Give positive feedback
Give negative feedback
Parents Non-parents
The Social Media Data Stacks
48
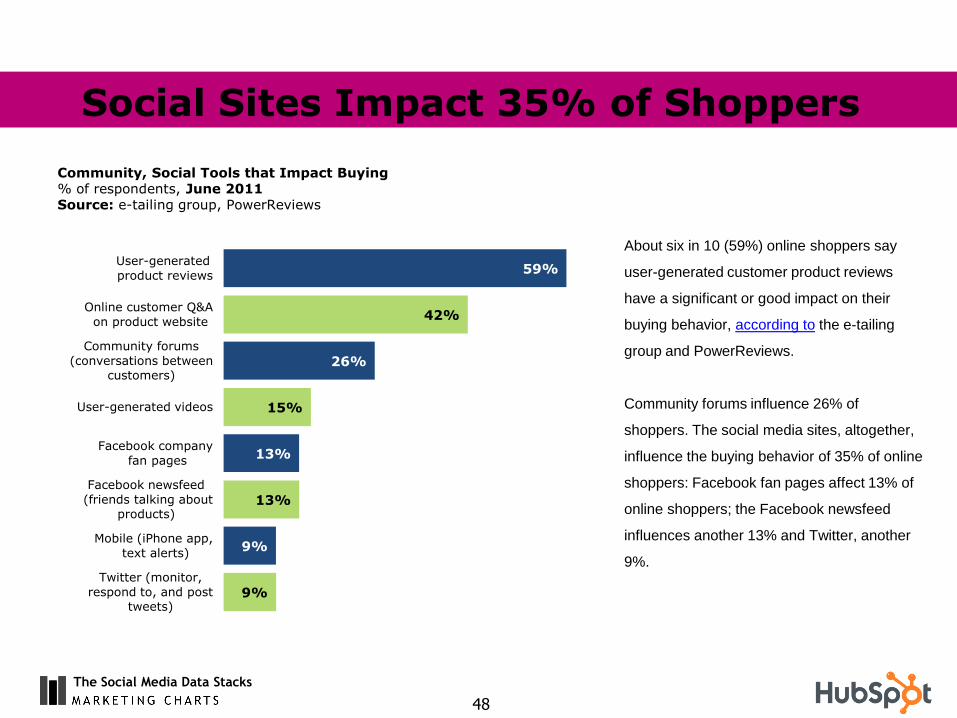
About six in 10 (59%) online shoppers say
user-generated customer product reviews
have a significant or good impact on their
buying behavior, according to the e-tailing
group and PowerReviews.
Community forums influence 26% of
shoppers. The social media sites, altogether,
influence the buying behavior of 35% of online
shoppers: Facebook fan pages affect 13% of
online shoppers; the Facebook newsfeed
influences another 13% and Twitter, another
9%.
Social Sites Impact 35% of Shoppers
Community, Social Tools that Impact Buying % of respondents, June 2011 Source: e-tailing group, PowerReviews
59%
42%
26%
15%
13%
13%
9%
9%
User-generated
product reviews
Online customer Q&A
on product website
Community forums
(conversations between customers)
User-generated videos
Facebook company
fan pages
Facebook newsfeed
(friends talking about products)
Mobile (iPhone app,
text alerts)
Twitter (monitor,
respond to, and post tweets)
The Social Media Data Stacks
49
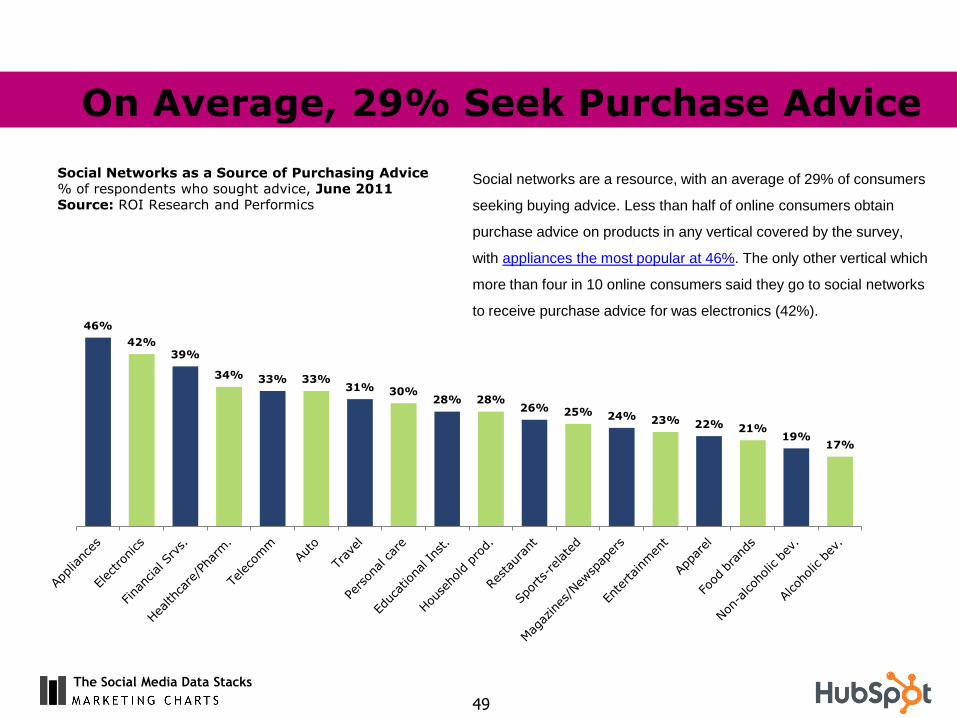
Social networks are a resource, with an average of 29% of consumers
seeking buying advice. Less than half of online consumers obtain
purchase advice on products in any vertical covered by the survey,
with appliances the most popular at 46%. The only other vertical which
more than four in 10 online consumers said they go to social networks
to receive purchase advice for was electronics (42%).
On Average, 29% Seek Purchase Advice
Social Networks as a Source of Purchasing Advice % of respondents who sought advice, June 2011 Source: ROI Research and Performics
46%
42% 39%
34% 33% 33% 31% 30%
28% 28% 26% 25% 24% 23% 22% 21%
19% 17%
The Social Media Data Stacks
50
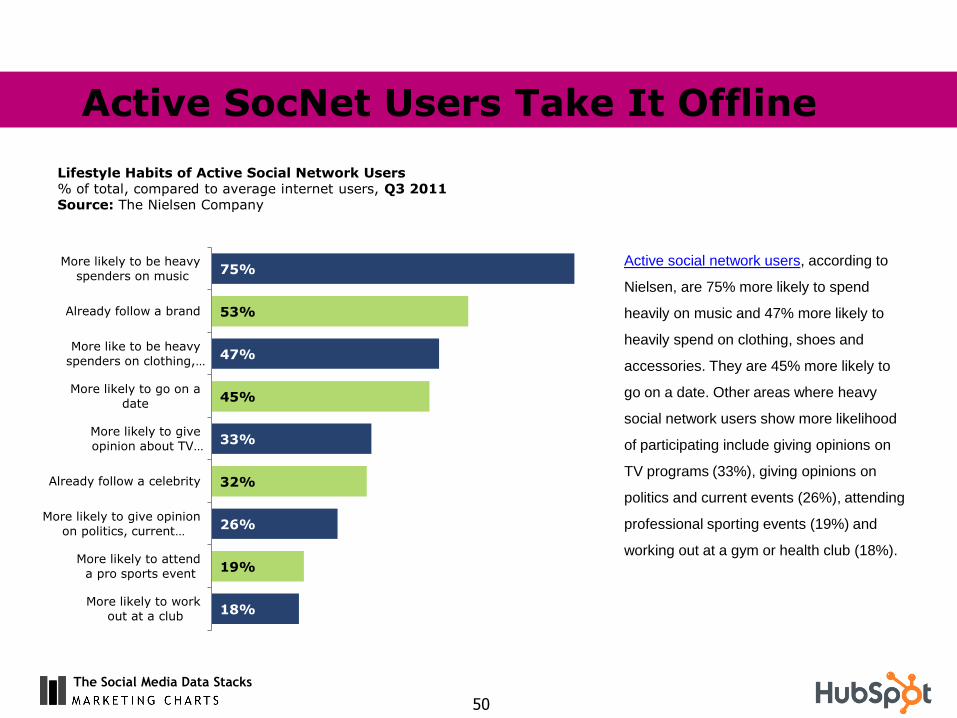
Active social network users, according to
Nielsen, are 75% more likely to spend
heavily on music and 47% more likely to
heavily spend on clothing, shoes and
accessories. They are 45% more likely to
go on a date. Other areas where heavy
social network users show more likelihood
of participating include giving opinions on
TV programs (33%), giving opinions on
politics and current events (26%), attending
professional sporting events (19%) and
working out at a gym or health club (18%).
Active SocNet Users Take It Offline
Lifestyle Habits of Active Social Network Users % of total, compared to average internet users, Q3 2011 Source: The Nielsen Company
18%
19%
26%
32%
33%
45%
47%
53%
75%
More likely to work
out at a club
More likely to attend
a pro sports event
More likely to give opinion
on politics, current …
Already follow a celebrity
More likely to give
opinion about TV …
More likely to go on a
date
More like to be heavy
spenders on clothing, …
Already follow a brand
More likely to be heavy
spenders on music
The Social Media Data Stacks
51
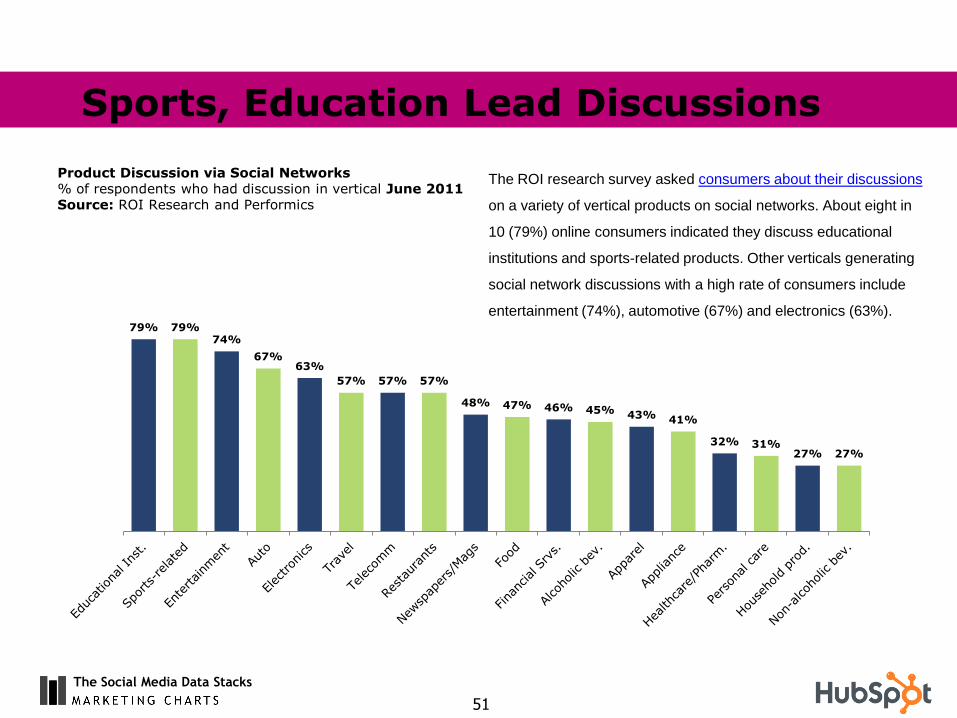
The ROI research survey asked consumers about their discussions
on a variety of vertical products on social networks. About eight in
10 (79%) online consumers indicated they discuss educational
institutions and sports-related products. Other verticals generating
social network discussions with a high rate of consumers include
entertainment (74%), automotive (67%) and electronics (63%).
Sports, Education Lead Discussions
Product Discussion via Social Networks % of respondents who had discussion in vertical June 2011 Source: ROI Research and Performics
79% 79% 74%
67% 63%
57% 57% 57%
48% 47% 46% 45% 43% 41%
32% 31% 27% 27%
The all-in-one marketing software platform for businesses
Simple and integrated to help your company:
Connect with social media networks Get found online and on smartphones by more qualified visitors Convert more visitors into leads and customers Nurture and close those leads efficiently Make smart marketing investments
Find out how 5,000 + companies use HubSpot to generate over 500,000 leads per month.
Test drive HubSpot free for 30 days!
http://www.hubspot.com/free-trial
Our data sources for “The Social Media Data Stacks” are:
ACSI / Foresee Results Adobe and Econsultancy Altimeter Group Arketi Web Watch e-
tailing group and PowerReviews ExactTarget IBM IgnitionOne Internet Advertising Bureau
Janrain The Nielsen Company NM Incite Pew Internet & American Life Project ROI
Research and Performics SocialMedia Examiner TVGuide.com WebLiquid and RSW/US
At MarketingCharts, we consistently follow and locate new data sets from our partners in order to publish
the most relevant resources for our readers, including our data partners at MarketingCharts.com that are
also featured in this report:
MarketingCharts.com is part of the Watershed Publishing network of business-to-business
online trade publications. The Social Media Data Stacks is from Watershed Publishing’s
Data Insights series.
Please contact Sarah Roberts at [email protected] to become a sponsor of a
Data Insights package.
53
Data Partners