social insights/ consumer technology
TRANSCRIPT

Social Insights/ Consumer Technology © Brandwatch.com | 1 © Brandwatch.com
Social Insights/
Consumer Technology

Social Insights/ Consumer Technology © Brandwatch.com | 2
1.0 With Great Change Comes Great ResponsibilityConsumer technology brands have changed our world forever.
Electronics companies have put a smartphone in nearly half the global population’s hands1. Previously “dumb” technology like watches and appliances are being upgraded with web capabilities, amplifying the network of products in what is repeatedly dubbed the “internet of things.” These trends encompass the huge technological shift towards wireless, digital, and interconnective products, changing how every part of our lives function.
Because of these advancements, electronics brands constitute many of the most rapidly growing sectors in the United States2. While the growth of the technology market comes with opportunities for companies to flourish, a comprehensive look at the industry reveals that these opportunities come at a price.
Consumer technology brands are forced to regularly evaluate and react to their changing place in a very fluid market. When a company releases an innovative product or feature, consumers expect all other players in the sector to respond. This was the case when Microsoft popularized the scroll wheel on a computer mouse3. Additionally, consumers regularly exhibit their power on the direction of technology companies by rejecting new technologies when they don’t see their value. The home electronics market learned this after seeing underwhelming sales of 3DTVs4.
As the consumer technology industry continues to grow and innovate, it becomes increasingly difficult for brands to stay at pace with expectations of their customers and up-to-date with consumer needs. Knowing or not knowing the place of one’s brand in the context of a changing market can make or break a product release, a promotional campaign, or an entire technical direction of a company. Technology companies must utilize the most innovative technologies available to best understand their market.
Social media intelligence offers brands the ability to acquire important insights about both consumers and the market. Social analytics maximizes on advanced technologies like machine learning and natural language processing to parse the abundance of information on social media.
With this advanced social data, companies can be proactive in the face of a changing market. Using such data, brands can uncover consumers sentiments, stay versed on innovations within any given sector, optimize the effectiveness of promotional campaigns and use consumer-generated evidence to inform new products and features. Social media analytics can give brands the competitive edge in an industry where daily innovation is commonplace.
Nick BarnaStrategic Accounts at Brandwatch
1 Pew Global. Smartphone Ownership and Internet Usage Continues to Climb in Emerging Economies. 2016 2 Bureau of Labor Statistics. Industries with the fastest growing and most rapidly declining output. 2015 3 Coding Horror. Meet The Inventor of the Mouse Wheel. 2007 4 CNET. Poll: Is 3D TV dead? Do you care?. 2015

Social Insights/ Consumer Technology © Brandwatch.com | 3
Contents1.0 With Great Change Comes Great Responsibility ..................................................... 2
2.0 Aim & Methodology ........................................................................................................ 4
2.1 Aim ................................................................................................................................. 4
2.2 Methodology .................................................................................................................. 5
3.0 The Consumer Technology Social Index.................................................................. 6
4.0 The Brand-Audience Relationship .............................................................................. 9
4.1 Share of Conversation ................................................................................................... 9
4.2 Facebook Post Format ..................................................................................................11
5.0 A Look at Technology Consumers ............................................................................12
5.1 Gender Analysis .............................................................................................................12
5.2 Profession Analysis .......................................................................................................14
6.0 Brand Monitoring Within Product Sectors ..............................................................16
6.1 How Brands Measure Up in Big Three Tech Sectors .....................................................16
6.2 Focused Brands Thrive in Audio, Gaming and Wearables ............................................17
6.3 Innovation Drives Conversation in Established Industries ..........................................18
6.4 New Sectors Experience Constant Change ..................................................................19
7.0 Insights into Consumer and Brand Language .......................................................20
7.1 Associated Adjectives Analysis ................................................................................... 20
7.2 Feature Analysis .......................................................................................................... 22
8.0 The Consumer Tech Industry At A Glance ..............................................................24
9.0 About Brandwatch ........................................................................................................25

Social Insights/ Consumer Technology © Brandwatch.com | 4
2.0 Aim & Methodology
2.1 Aim The following report examines the social presence of leading consumer electronics brands. The aim is to provide an extensive illustration of current trends and themes within consumer technology discourse, in the context of a constantly changing market.
The analysis of the online conversation is broken down into five parts:
• The Consumer Technology Social Index: Provides a comprehensive ranking for 50 electronics brands across five key factors: Social Visibility, General Visibility, Net Sentiment, Reach Growth, and Social Engagement & Content.
• The Brand-Audience Relationship: Summarizes important benchmarks regarding the current space brands comprise in the online conversation and how well content is received by their audience.
• A Look at Technology Consumers: Examines the gender and professions of tech companies’ audiences at the brand, product sub-sector, and greater electronics industry level.
• Brand Monitoring Within Product Sectors: Discusses which brands dominate discussion of ten product sub-sectors and analyzes trends in discussion of products over time.
• Insights into Consumer and Brand Language: Analyzes the language used when discussing consumer technology brands, products, and features.

Social Insights/ Consumer Technology © Brandwatch.com | 5
2.2 MethodologyThe data that powers the charts and insights in this report is derived through enterprise social intelligence software Brandwatch Analytics.
The data is collected through three formats:
• Queries: Collects general mentions of consumer technology brands and products online. Based on boolean operators, Brandwatch Queries are specifically customized to filter out spam and disambiguate the data, leaving only relevant conversation. As such, volume estimates remain conservative.
• Twitter Channels: Collects Twitter data based on specific brands’ accounts. Twitter Channels tracks @mentions, replies, retweets directed at selected brands.
• Facebook Channels: Collects Facebook data based on specific brands’ accounts. Facebook Channels tracks likes, posts, comments, shares on selected brands’ Facebook content.
Due to the breadth of consumer technology products and brands, we limited the scope of the analyses in this report by focusing first and foremost on brands specializing in computing, television, and mobile technologies, which make up the products most associated with the terms “consumer electronics” and “consumer technology”.5,6 Leading brands in other sectors like home appliances were included based on annual sales figures and social media audience followings.
Finally, a quick note on product sector analyses: Throughout the report and particularly in Section 6: Brand Monitoring Within Product Sectors, analyses use categories to examine interesting differences by type of technology. Conversations that mention consumer tech products by type (e.g. “cell phone”, “vr”) or by brand name (e.g. “Galaxy S4”, “vive”) are labelled using complex Brandwatch Rules.
Ultimately, the ten product sectors for which categories were created are the following: televisions and home cinema products; mobile phones; computers, including laptops, tablets, and computer peripheral products like keyboards; camera and imaging equipment not including phone or web cameras; home appliances; video games, gaming equipment, and game consoles; wearable technology not including VR headsets; audio devices, including speakers and headphones; virtual reality technology; and drones. If mentions included two or more products within it (e.g. “playing video games in VR is amazing”), the mention was included in each appropriate category.
For further questions on the aim, methodology or analysis in this report, please contact Brandwatch directly.
5 L2 Inc. Top 10 Consumer Electronics Brands in Digital. 2015 6 Consumer Technology Association. Owning Innovation: CEA Study Shows Major Shifts in the Technology We Own. 2015

Social Insights/ Consumer Technology © Brandwatch.com | 6
3.0 The Consumer Technology Social IndexThe Consumer Technology Social Index presents important metrics in a brand’s online presence and displays each brand’s social media performance across five different factors.
The index evaluates 50 brands across these five factors:
• Social Visibility: measures the volume of conversation a brand generates across key social channels.
• General Visibility: measures the volume of conversation a brand generates on blogs, news outlets and forums.
• Net Sentiment: evaluates the composition of negative and positive mentions of a brand in the context of that brand’s entire conversation.
• Reach Growth: measures the growth of the brand’s following over the course of a month, appropriately weighted according to the brand’s current following..
• Social Engagement & Content: evaluates how effective brands are at communicating or responding to their audiences and how well their social content is received across social channels.
The Composite Score reflects a brand’s performance across the five categories. For all five categories, brands are normalized against a single leader, which receives a score of 100. As such, the maximum potential score is 500.

Social Insights/ Consumer Technology © Brandwatch.com | 7
RANK BRAND SOCIAL VISIBILITY
GENERAL VISIBILITY
NET SENTIMENT
REACH GROWTH
ENGAGEMENT & CONTENT
OVERALL SCORE
1 Lenovo 100 59 59 89 100 407
2 Nintendo 52 72 54 98 99 375
3 Samsung Electronics 66 78 52 93 78 368
4 Intel 73 71 56 93 67 360
5 ASUS 84 45 60 90 71 350
6 Microsoft 49 94 48 100 51 342
7 LG Electronics 33 54 100 82 72 340
8 Garmin 28 46 64 87 91 315
9 HTC 45 65 64 93 43 309
10 GE Appliances 18 41 76 70 100 304
11 Sony 45 76 60 91 32 304
12 GoPro 57 54 67 91 32 301
13 Dell 32 49 47 88 83 299
14 Bosch 49 34 59 82 75 299
15 Hewlett-Packard 50 51 54 85 56 296
16 NVidia 53 59 66 86 30 293
17 Huawei 49 52 54 96 40 290
18 FitBit 42 52 62 93 39 288
19 Logitech 26 33 63 82 79 282
20 IBM 51 57 55 81 39 282
21 Acer 47 39 52 77 66 281
22 Sharp 8 35 68 68 100 280
23 Seagate 22 32 50 79 88 271
24 Bose 51 35 61 82 39 268
25 Keurig 32 35 64 77 60 268
26 Beats Electronics 58 24 51 86 46 266
27 Canon 27 57 71 79 30 264
28 JBL 40 34 76 77 34 261
29 Nokia 39 49 54 89 30 261
30 Epson 17 33 55 73 80 259

Social Insights/ Consumer Technology © Brandwatch.com | 8
RANK BRAND SOCIAL VISIBILITY
GENERAL VISIBILITY
NET SENTIMENT
REACH GROWTH
ENGAGEMENT & CONTENT
OVERALL SCORE
31 Xiaomi 31 44 54 84 45 258
32 Belkin 20 25 63 67 83 258
33 Roku 32 35 63 74 55 257
34 BlackBerry 36 52 56 92 21 257
35 Electrolux 18 27 66 90 53 253
36 SanDisk 43 33 59 84 33 252
37 Apple 41 100 50 59 0 250
38 Vizio 32 26 52 68 67 245
39 Motorola 32 52 50 91 18 244
40 Western Digital 38 29 33 78 62 241
41 Bowers & Wilkins 25 21 79 67 41 233
42 Alcatel 16 34 57 76 49 232
43 Texas Instruments 24 38 56 70 39 226
44 Panasonic 21 45 51 70 37 223
45 Toshiba 18 40 46 74 43 222
46 iRobot 31 22 33 82 53 221
47 Xerox 28 27 60 75 29 220
48 Jawbone 21 38 60 69 29 217
49 Nikon 18 55 80 32 0 186
50 Philips 24 40 53 34 0 150
Figure 1: Analyzes 5,547,802 online conversations across Twitter, Facebook, news sites, blogs, and forums from April 1st - June 16th, 2016

Social Insights/ Consumer Technology © Brandwatch.com | 9
4.0 The Brand-Audience RelationshipWith the rise of product research and purchasing taking place online, social media plays a vital role in the technology buyer’s journey. Overall, 62% of electronics sales are influenced by brand’s digital content, with at least half of those consumers specifically using social media.7 These percentages increase among the younger and more technically savvy consumers, a demographic that makes up both the majority of people on social and the consumer electronics industry’s “prime customers”. 8,9
As a result, social media becomes a critical space for technology brands to communicate news with their audience, maintain their brand image, and address customer inquiries and issues. Analyzing the relationship between brands’ social channels and their audiences exposes how effective top electronics and software brands are and outlines areas for improvement.
4.1 Share of ConversationWhen looking at the online discussion of consumer technology brands, over 95% of tweets come from audience accounts.
AUDIENCE
• @MENTIONS
• RETWEETS
• REPLIES
BRAND
• REPLIES
• TWEETS
• RETWEETS
CONSUMER TECH BRAND AND AUDIENCE ACTIVITY
12%
62%
22%
1% <1%
3%
Figure 2: Analyzes 1,593,152 Twitter conversations from April 1st - May 27th, 2016.
7 Deloitte. Navigating the New Digital Divide: Capitalizing on digital influence in retail. 2015 8 McKinsey. Getting a Sharper Picture of Social Media’s Influence. 2015. 9 Gallup. Three in 10 in US Own and Array of Consumer Electronics. 2014
Social Insights/ Consumer Technology © Brandwatch.com | 10
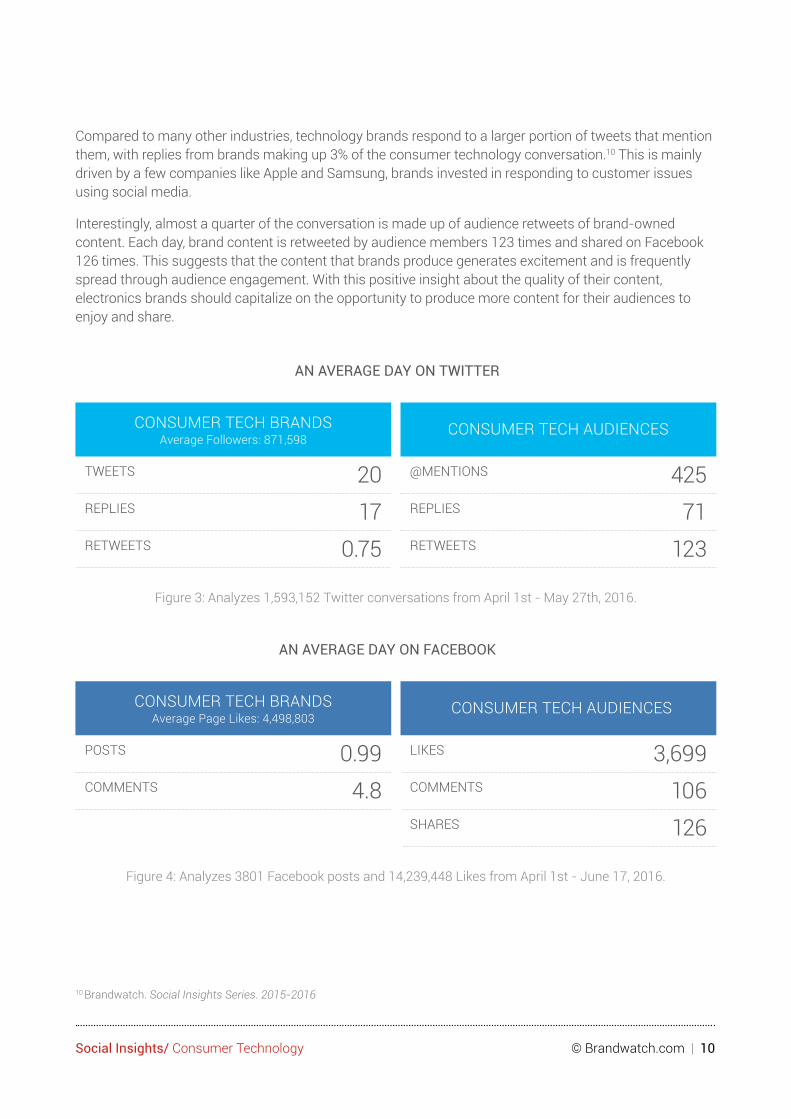
Compared to many other industries, technology brands respond to a larger portion of tweets that mention them, with replies from brands making up 3% of the consumer technology conversation.10 This is mainly driven by a few companies like Apple and Samsung, brands invested in responding to customer issues using social media.
Interestingly, almost a quarter of the conversation is made up of audience retweets of brand-owned content. Each day, brand content is retweeted by audience members 123 times and shared on Facebook 126 times. This suggests that the content that brands produce generates excitement and is frequently spread through audience engagement. With this positive insight about the quality of their content, electronics brands should capitalize on the opportunity to produce more content for their audiences to enjoy and share.
AN AVERAGE DAY ON TWITTER
CONSUMER TECH BRANDSAverage Followers: 871,598
TWEETS 20REPLIES 17RETWEETS 0.75
CONSUMER TECH AUDIENCES
@MENTIONS 425REPLIES 71RETWEETS 123
Figure 3: Analyzes 1,593,152 Twitter conversations from April 1st - May 27th, 2016.
AN AVERAGE DAY ON FACEBOOK
CONSUMER TECH BRANDSAverage Page Likes: 4,498,803
POSTS 0.99COMMENTS 4.8
CONSUMER TECH AUDIENCES
LIKES 3,699
SHARES 126
COMMENTS 106
Figure 4: Analyzes 3801 Facebook posts and 14,239,448 Likes from April 1st - June 17, 2016.
10 Brandwatch. Social Insights Series. 2015-2016

Social Insights/ Consumer Technology © Brandwatch.com | 11
4.2 Facebook Post FormatThe type of content a brand shares on social media will accumulate different responses from their audiences. Knowing which types of content provoke the reactions a brand desires can make the right content stand out among the crowd.
CONSUMER TECH BRANDS’ FACEBOOK CONTENT
21%
55%
23%
Likes: 3,621Comments: 59Shares: 69
Likes: 1,826Comments: 132Shares: 408
Likes: 5,329Comments: 37Shares: 56
Likes: 206Comments: 61Shares: 73
Photo (55%)
Video (21%) Status (1%)
Image Link (23%)
Figure 5: Analyzes 2772 Facebook posts from April 1st - May 26th 2016.
1%
Although photos are by far the most used form of content by brands on Facebook, they are not the most engaging type of content. On average, when a brand shares a link, the post gets nearly two thousand more likes than when a photo is shared.
In addition, videos are the most commented and shared type of content with consumer technology brands, on average over half as engaging as photos.
Aligning content with audience engagement behavior maximizes the positive feedback and reach of important posts and interesting news within the industry.

Social Insights/ Consumer Technology © Brandwatch.com | 12
5.0 A Look at Technology ConsumersBy digitizing and automating many of our day-to-day activities, modern technology brands have secured an important place in our professional and personal lives. However, companies and products resonate with different demographics in unique ways. Understanding these differences can help businesses better conceptualize the varying effects their products have on their audience.
Learning how different demographics discuss consumer technology can reveal trends in the relationship between brands or products and specific groups.
5.1 Gender AnalysisConversations surrounding most tech companies are dominated by male authors. On average, a third of the conversations about consumer technology comes from women. However, the variation of gender composition in audience participation provides insights into what types of electronics reach and prompt discussion in men and women.
AVERAGE
AUDIENCE GENDER COMPOSITION
• FEMALE • MALE
GARMIN NIKON
SAMSUNG ELECTRONICS GOPRO
ACER
IBM LG ELECTRONICS
VIZIO BELKIN APPLE
BEATS ELECTRONICS DELL BOSE
TOSHIBA CANON
LENOVO ELECTROLUX
HEWLETT-PACKARD WESTERN DIGITAL
JBL GE APPLIANCES
XEROX EPSON INTEL
PANASONIC
0% 25% 50% 75% 100%
IROBOT KEURIG
ALCATEL SHARP
JAWBONE LOGITECH
FITBIT PHILIPS
ROKU SANDISK
• FEMALE • MALE
Figure 6: Analyzes the gender of 728,443 Twitter conversations from April 1st - May 26th, 2016, using online profile information and advanced machine learning techniques.
AVERAGE
NINTENDO TEXAS INSTRUMENTS
OCULUS ASUS
HTC XIAOMI
BLACKBERRY BOWERS & WILKINS
NVIDIA HUAWEI
0% 25% 50% 75% 100%
SEAGATE SONY
NOKIA BOSCH
MOTOROLA

Social Insights/ Consumer Technology © Brandwatch.com | 13
AVERAGE
AUDIENCE GENDER COMPOSITION
• FEMALE • MALE
GARMIN NIKON
SAMSUNG ELECTRONICS GOPRO
ACER
IBM LG ELECTRONICS
VIZIO BELKIN APPLE
BEATS ELECTRONICS DELL BOSE
TOSHIBA CANON
LENOVO ELECTROLUX
HEWLETT-PACKARD WESTERN DIGITAL
JBL GE APPLIANCES
XEROX EPSON INTEL
PANASONIC
0% 25% 50% 75% 100%
IROBOT KEURIG
ALCATEL SHARP
JAWBONE LOGITECH
FITBIT PHILIPS
ROKU SANDISK
• FEMALE • MALE
Figure 6: Analyzes the gender of 728,443 Twitter conversations from April 1st - May 26th, 2016, using online profile information and advanced machine learning techniques.
AVERAGE
NINTENDO TEXAS INSTRUMENTS
OCULUS ASUS
HTC XIAOMI
BLACKBERRY BOWERS & WILKINS
NVIDIA HUAWEI
0% 25% 50% 75% 100%
SEAGATE SONY
NOKIA BOSCH
MOTOROLA

Social Insights/ Consumer Technology © Brandwatch.com | 14
While most brands see over half of their conversations involving men, a few brands garner at least as much female-driven conversation as male. Specifically, iRobot, Keurig, Alcatel, Sharp, Jawbone, Logitech, FitBit, Philips, and Roku are predominantly discussed by women.
With 81% of women expressing an interest in consumer technology and spending only 8% less than their male counterparts on consumer electronics a year, this disparity in gender composition in many technology conversations is staggering.11
Companies have power to address the discrepancy between the purchasing behavior and the online discussions surrounding these brands and products. Ensuring advertising and brand-created content on social does not exclude or isolate groups of consumers can ensure companies don’t miss out on the thriving and growing market of female technology consumers.
5.2 Profession AnalysisExamining the demographic makeup of the audiences can reveal more than how consumers discuss consumer technology. Learning the profession of the main players in certain technology conversations will uncover the different stakeholders in each technology sector, providing important insights into the state of that sector.
11 Consumer Technology Association. Tip for Valentine's Day: Women Want Electronics. 2012

Social Insights/ Consumer Technology © Brandwatch.com | 15
PROFESSION ANALYSIS BY PRODUCT SECTOR
• ARTIST • EXECUTIVE • HEALTH PRACTITIONER • JOURNALIST • LEGAL • POLITICIAN • SALES/MARKETING/PR • SCIENTIST & RESEARCHER • SOFTWARE DEVELOPER & IT
• SPORTPERSONS & TRAINER • STUDENT • TEACHER & LECTURER
0%
20%
40%
60%
80%
100%
WEARABLES
VIRTUAL REALITY
TV/HOME VID
EO
MOBILE PHONES
APPLIANCES
GAMING
DRONES
COMPUTERS
CAMERAS
AUDIO D
EVICES
Figure 7: Analyzes the profession of 54,273 Twitter authors from April 1st - June 17th, 2016, using online profile information and advanced machine learning techniques.
For instance, compared to all of the other product sectors, the conversation surrounding virtual reality technology consists of among the highest percentage of sales/marketing professionals and the highest percentage of software developers.
This reflects its early stages of development as an industry: VR technology is very new so its first products are being monitored and discussed by developers and companies are still learning how to best market their products.
In contrast, over a third of the discussion of camera technology garners attention from artists. This suggests that many of those discussing imaging products are the consumers and potential consumers in this sector. It is likely that since camera and imaging electronics in a more established market than VR, these companies are more successful in accumulating discussion from their own consumer base than the newer sectors.

Social Insights/ Consumer Technology © Brandwatch.com | 16
6.0 Brand Monitoring Within Product SectorsOne of the most important use cases of social media analytics is monitoring the brands within an industry. This becomes even more important in a large industry like consumer technology, where brands are constantly fighting for first place in the hearts of their audiences.
In the following analyses, consumer electronics conversations are divided into ten main product sectors and the top five mentioned brands on social media for each sector are shown. The ten sectors include: televisions and home cinema products; mobile phones; computers, including laptops, tablets, and computer peripheral products like keyboards; camera and imaging equipment; home appliances; games, gaming equipment, and game consoles; wearable technology; audio devices, including speakers and headphones; virtual reality technology; and drones.
6.1 How Brands Measure Up in Big Three Tech SectorsAs of 2015, televisions and home cinema products, mobile phones, and computers make up the most owned types of technology in the United States13. As three cornerstone sectors for many big consumer tech businesses, knowing where your business ranks in audience conversations within these sectors becomes a crucial and financially significant strategy to stay ahead.
0% 20% 40% 60% 80% 100%
MOBILE PHONES
TV/HOME VIDEO
COMPUTERS DELL HP LOGITECH MICROSOFT APPLE
• APPLE • DELL • HP • HTC • LG • LOGITECH
• MICROSOFT • NOKIA • ROKU • SAMSUNG • SONY • VIZIO
HTC
MICROSOFT
NOKIA
SAMSUNG
APPLE
LG ROKU SONY VISIOAPPLE
Figure 8: Analyzing mentions of consumer tech brands within the Computer, TV/Home Video, and Mobile Phone conversations from April 1st to June 16th, 2016. Mentions within the various product sub-sector conversations were identified and synthesized using Brandwatch’s Rules and Categories features
13 CTA. CEA Study Shows Major Shifts in the Technology We Own. 2015

Social Insights/ Consumer Technology © Brandwatch.com | 17
Unsurprisingly, amongst conversations about computers and their accessories, Microsoft and Apple are the two most discussed brands. Microsoft commanded 29% of the computer conversations mentioning the top five brands, with most conversations centered around the Windows 10 operating system. Apple is the second most mentioned brand in the computer conversation; 26% of the mentions are directed at Apple’s support Twitter channel with consumer’s technical issues and questions.
Apple also netted the majority of the conversations about mobile phones, with over half of the conversations surrounding mobile’s five biggest brands on social. HTC’s recent release of the HTC 10 produced a lot of buzz on social media, ranking it number two among cell phone conversations.
In the television conversation, LG beats out the competition, followed closely by Vizio. Within the discussions about televisions, 4K HD, smart televisions, and virtual reality were among the most discussed topics.
6.2 Focused Brands Thrive in Audio, Gaming and WearablesFor gaming, audio, and wearable technology sectors, the conversations on social are dominated by brands that specialize in specific product sectors.
0% 20% 40% 60% 80% 100%
GAMING
WEARABLES
AUDIO DEVICES BOSE
BOWERS & WILKINS (TW)
JBL SONY BEATS
NINTENDO NVIDIA SONY
SAMSUNG
APPLE
MICROSOFT
FITBIT
GARMIN XIAOMI
• APPLE • BEATS • BOSE • BOWERS & WILKINS (TW) • FITBIT
• GARMIN • JAWBONE • JBL • MICROSOFT • NINTENDO • NVIDIA
• SAMSUNG • SONY • XIAOMI
JAWBONE
Figure 9: Analyzing mentions of consumer tech brands within the Audio, Wearable, and Gaming technologies conversations from April 1st to June 16th, 2016. Mentions within the various product sub- sector conversations were identified and synthesized using Brandwatch’s Rules and Categories features.
Unlike most of the other brands analyzed, Bose, Beats Electronics, FitBit and Nintendo are entirely embedded in one specific category of consumer technology products. In the three product sectors above, these brands command more of the conversation than companies like Microsoft, Apple, and Sony that aren’t focused in any one sector.
For being a relatively new company, Beats has earned a hefty share of the conversation surrounding audio devices; however, veteran Bose is the leader among the brands associated with audio tech, garnering 40% of the mentions of the top five audio brands.

Social Insights/ Consumer Technology © Brandwatch.com | 18
Similarly, Fitbit’s specific focus on wearable fitness tracking placed it at the center of the wearable conversation. On social, the four most popular wearable technology companies behind Fitbit comprise only 6% of the wearable conversation mentioning the top five brands.
Nintendo has been a frontrunner in the home gaming industry for decades, constantly showing innovation in their consoles, controllers, and portable devices. With this stronghold in the market, even big competitors like Microsoft’s Xbox and Sony’s Playstation fail to match Nintendo’s social presence.
6.3 Innovation Drives Conversation in Established Industries Established markets tend to have established leaders who have spent years or decades developing their products and brand. However, in recent years, there have been industry-shaking innovations within camera products and home appliances that are reflected on social media.
The release of the Roomba by iRobot was one such innovation. The Roomba’s automation of vacuuming made iRobot the most talked about brand among appliance conversations, with the most used adjectives describing the brand being “simple” and “cool”.
• CANON • ELECTROLUX • GE • GOPRO • IROBOT
• KEURIG • LG • NIKON • NOKIA • SONY
0% 20% 40% 60% 80% 100%
CAMERAS
APPLIANCES
ELECTROLUX
GE IROBOT LG
CANON
GOPRO NIKON NOKIA SONY
KEURIG
Figure 10: Analyzing mentions of consumer tech brands within the Appliances and Cameras conversations from April 1st to June 16th, 2016. Mentions within the various product sub-sector conversations were identified and synthesized using Brandwatch’s Rules and Categories features.
The most buzz-worthy brand in cameras and imaging is the veteran company, Sony. However, as a very close number two, GoPro’s success in the conversation is vital to understanding the industry as a whole. GoPro’s 14-year acceleration to the forefront of imaging conversations indicates a critical deviation in the direction of camera technology.
As physical photos lose value to digital photos and online platforms like Facebook and Instagram become the main method of sharing images, GoPro found success by making it easy to take pictures on-the-go and immediately share online.

Social Insights/ Consumer Technology © Brandwatch.com | 19
6.4 New Sectors Experience Constant ChangeVirtual reality and drone technologies are in the beginning stages of their relationships with their customers. As such, the brands that are most mentioned in conversations surrounding these sectors quickly fluctuate as a result of events, releases and news within the industry.
FLUCTUATIONS IN BRAND MENTIONS IN DRONE CONVERSATION
• XIAOMI • LG ELECTRONICS • GOPRO • PANASONIC • NOKIA
-10%
0%
10%
20%
30%
40%
50%
60%
JUN 2016APR 2016APR 2016MAR 2016FEB 2016JAN 2016
RELEASE OF 4K DRONE
NAB SHOWCES 2016
Figure 11: Analyzing mentions of consumer tech brands within the Drone conversations from January 1st to June 16th, 2016. Mentions within the various product sub-sector conversations were identified and synthesized using Brandwatch’s Rules and Categories features.
For instance, discussion of drones peaked for LG’s audience after the company’s demonstration at the Consumer Electronics Show in January, while the release of their 4K drone camera triggered a spike in mentions for Xiaomi on May 25. April found Panasonic the most discussed brand in the drone conversation following the NAB Show in Las Vegas.
Without looking at the volume of mentions in this historical context, comparing and analyzing brands’ share of voice within these budding industries would paint a picture of the conversations that would be incomplete at best, and completely inaccurate at worst. However, diagnosing these fluctuations is an important use case for consumer technology brands investing in these new sectors trying to measure the success of campaigns, releases, and demonstrations.

Social Insights/ Consumer Technology © Brandwatch.com | 20
7.0 Insights into Consumer and Brand LanguageCompanies producing cutting-edge consumer tech have spent years, even decades, creating and maintaining their brand image and reputation. Important to managing these brand identities is understanding the language used when people discuss the brand.
Analyzing the words associated with specific products and brands is one important way brands can examine their position in the market. The following analyses look at the adjectives and features mentioned when discussing brands, products and the industry as a whole.
7.1 Associated Adjectives Analysis Overall, when technology consumers discuss consumer electronics companies, the most common adjectives used are “cool” and “innovative” by a big margin. Exposing consumer expectations of technology, this finding exemplifies the pressure that brands face to compete in this industry.
ASSOCIATED ADJECTIVES BY TECHNOLOGY SECTOR
OVERALL
0% 20% 40% 60% 80% 100%
WEARABLES
VIRTUAL REALITY
TV/HOME VIDEO
MOBILE PHONES
HOME APPLIANCES
GAMING
DRONES
COMPUTERS
CAMERA
AUDIO DEVICES
• AFFORDABLE • COOL • INNOVATIVE • QUICK • SIMPLE • USEFUL
Figure 12: Analyzing mentions of consumer tech brands by product sub-sector and language used, from April 1st to June 16th, 2016. Product sub-sector categories and adjective mentions were identified and separated using Brandwatch’s Rules and Categories features.

Social Insights/ Consumer Technology © Brandwatch.com | 21
Within specific sector conversations, further trends are revealed. Drones garner the most discussion of innovation, while people discussing mobile phones and televisions value simplicity more than other discussions.
The following analyses compare the adjectives used by audiences @mentioning brands to the adjectives brand-owned accounts use in order to gauge how well brands communicate their desired images to their audiences.
ADJECTIVES USED BY BRAND AND AUDIENCE
• AFFORDABLE • COOL • INNOVATIVE • QUICK • SIMPLE • USEFUL
0%
20%
40%
60%
80%
100%
LENOVO'S AUDIENCELENOVOINTEL'S AUDIENCEINTEL
Figure 13: Analyzing mentions of consumer tech brands by product sub-sector and language used, from April 1st to June 16th, 2016. Product sub-sector categories and adjective mentions were identified and separated using Brandwatch’s Rules and Categories features.
Of the brands analyzed, Intel was the best at aligning their consumer’s language to the adjectives they use on social media. Upon examining the conversation surrounding Lenovo, audience authors on Twitter most frequently use words associated with the brand’s innovation. This demonstrates an unused opportunity for Lenovo to capitalize on this positive association their customers have with their brand on social.

Social Insights/ Consumer Technology © Brandwatch.com | 22
7.2 Feature Analysis In consumer technology, coming out with new or improved features is an important way for brands to set themselves apart from the rest of the industry. Additionally, when features or functionalities are missing in a brand, product, or sector, consumers notice.
Social media is the perfect space for technology consumers to share their reactions to new features and functions and explain what they expect from different products. In this section, mentions of specific features and functions are analyzed to reveal these expectations.
• WIRELESS
• BLUETOOTH
• PORTABLE
• COMPATIBILITY
• DURABLE
• WATERPROOF
• WIFI
AUDIO DEVICES
7%
65%
25%
1%1%1%1%
Figure 14: Analyzing mentions of Audio Devices within conversations of consumer tech brands from April 1st to June 16th, 2016. Audio Device and adjective mentions were identified and separated using Brandwatch’s Rules and Categories features.
When looking at the conversation about audio devices, the most talked about features involved wireless and bluetooth capabilities. The ability to have remote headphones and speakers is clearly very important to audio consumers, an important insight to brands targeting these consumers.
Social Insights/ Consumer Technology © Brandwatch.com | 23
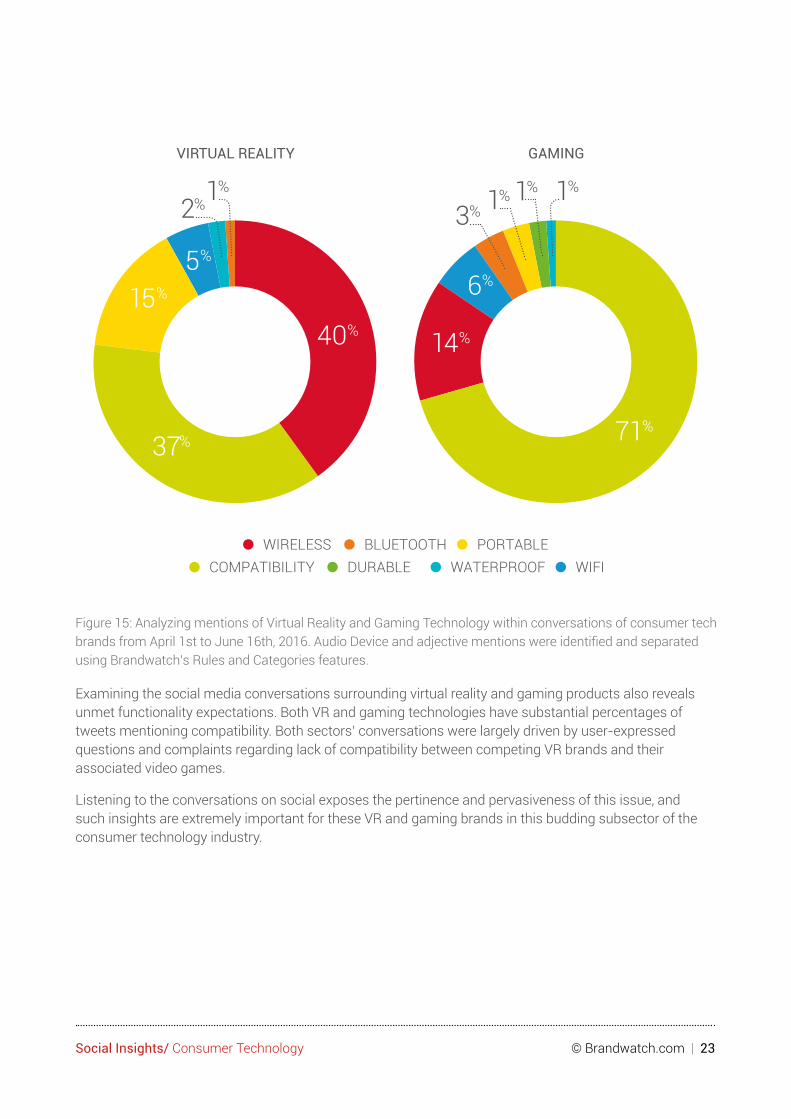
VIRTUAL REALITY GAMING
15%
5%
40%
37%
1%
2%
6%
71%
14%
1%3%
• WIRELESS • BLUETOOTH • PORTABLE • COMPATIBILITY • DURABLE • WATERPROOF • WIFI
1%1%
Figure 15: Analyzing mentions of Virtual Reality and Gaming Technology within conversations of consumer tech brands from April 1st to June 16th, 2016. Audio Device and adjective mentions were identified and separated using Brandwatch’s Rules and Categories features.
Examining the social media conversations surrounding virtual reality and gaming products also reveals unmet functionality expectations. Both VR and gaming technologies have substantial percentages of tweets mentioning compatibility. Both sectors’ conversations were largely driven by user-expressed questions and complaints regarding lack of compatibility between competing VR brands and their associated video games.
Listening to the conversations on social exposes the pertinence and pervasiveness of this issue, and such insights are extremely important for these VR and gaming brands in this budding subsector of the consumer technology industry.

Social Insights/ Consumer Technology © Brandwatch.com | 24
8.0 The Consumer Tech Industry At A GlanceThe role that technology plays in our lives is far from constant. In just a few years we’ve gone from dial-up internet and physical copies of photos, music and videos to 72% of households owning smartphones and two-thirds owning laptops.13 Technology changes, adapts and gets replaced at a rate unlike many other industries. With consumer technology brands, staying ahead-of-the-game means just successfully keeping up with these changes.
This report summarizes key benchmarks and provides important insights regarding the state of social among consumer technology industry, however our analyses are only part of the many use cases and opportunities afforded using social data.
Given the breadth of the consumer technology industry, and the important differences in the way brands and products are used and discussed, social intelligence has a great deal to offer technology companies aiming to become experts in their markets and optimize their business strategies. For more information on how social data and social intelligence can revolutionize your business, contact us at Brandwatch or request a demo.
Key Takeaways:
• Lenovo, Nintendo, and Samsung are Brandwatch’s three consumer tech leaders on social.
• Overall, the audiences of leading consumer technology brands skew heavily male.
• Microsoft, LG, and Apple dominate conversations around the three big consumer tech sub-sectors.
• Focused, niche brands perform best on social for audio, gaming, and wearable products.
• Industry-disrupting innovations among appliances and cameras influence iRobot’s and GoPro’s commands of conversations.
• Very new product sectors are still in constant state of flux, with brands leaders changing with time.
• The most common adjectives used to describe consumer technology brands are “cool” and “innovative”, with variations by product sub-sectors.
• When it comes to functionality, audience members are talking about wireless and bluetooth capabilities for audio devices, and better compatibility between gaming manufacturers and VR brands.
13 Consumer Electronics Association. 17th Annual CE Ownership and Market Potential Study. 2015

Social Insights/ Consumer Technology © Brandwatch.com | 25
9.0 About BrandwatchBrandwatch is the world’s leading social intelligence company. Brandwatch Analytics and Vizia products fuel smarter decision making around the world.
The Brandwatch Analytics platform gathers millions of online conversations every day and provides users with the tools to analyze them, empowering the world’s most admired brands and agencies to make insightful, data-driven business decisions. Vizia distributes visually-engaging insights to the physical places where the action happens.
The Brandwatch platform is used by over 1,200 brands and agencies, including Cisco, Whirlpool, British Airways, Heineken, Walmart and Dell. Brandwatch continues on its impressive business trajectory, recently named a global leader in enterprise social listening platforms by the latest reports from several independent research firms. Increasing its worldwide presence, the company has offices around the world including Brighton, New York, San Francisco, Berlin and Singapore.
Brandwatch. Now You Know.
www.brandwatch.com | @Brandwatch | press office | contact

Contact/ Email [email protected] brandwatch.comTwitter @brandwatch TelephoneUS +1 212 229 2240UK +44 (0)1273 234290DE +49 (0)30 5683 7004-0
© Brandwatch.com