snapshot africa - ghana - home | food and agriculture ... · snapshot africa - ghana snapshot...
TRANSCRIPT
SNAPSHOT AFRICA - GHANA �
Snapshot Africa - Ghana
Benchmarking FDI Competitiveness
Multilateral Investment Guarantee Agency
Government of Madagascar in association with
the Private Sector Development Project II
of the International Development Association
Swiss State Secretariat for Economic Affairs
Austrian Development Agency
United States Agency for International Development
JANUARY 2007
SNAPSHOT AFRICA - GHANA
The Multilateral Investment Guarantee Agency (MIGA) of the World Bank Group was established
in 1988 to promote the flow of private foreign investment to developing member countries.
MIGA offers political risk insurance coverage to eligible investors for qualified investments
in developing member countries. MIGA also offers technical assistance programs to develop
and implement effective strategies for attracting and retaining foreign direct investment. This
hands-on technical assistance focuses on three primary areas: dissemination of information on
investment opportunities and business operating conditions in developing member countries
through online services; capacity building of the organizations and institutions involved in the
promotion of foreign investment; and, investment facilitation activities supporting the efforts of
developing countries to identify and attract investment.
Research for the sub-Saharan Africa benchmarking study was conducted and carried out by The
Services Group, one of MIGA’s principal contractors for the global Enterprise Benchmarking
Program.
Copyright © 2006
World Bank Group/MIGA
1818 H Street, NW
Washington, DC 20433
All rights reserved
Manufactured in the United States of America
November 2006
Available online at www.fdi.net/snapshot_africa
For more information, contact:
MIGA Operations
1818 H Street, NW
Washington, DC 20433
t. 202.458.2076 f. 202.522.2650
www.miga.org
The material in this publication is copyrighted.
Requests for permission to reproduce portions
of it should be sent to MIGA Operations at the
above address.
SNAPSHOT AFRICA - GHANA �
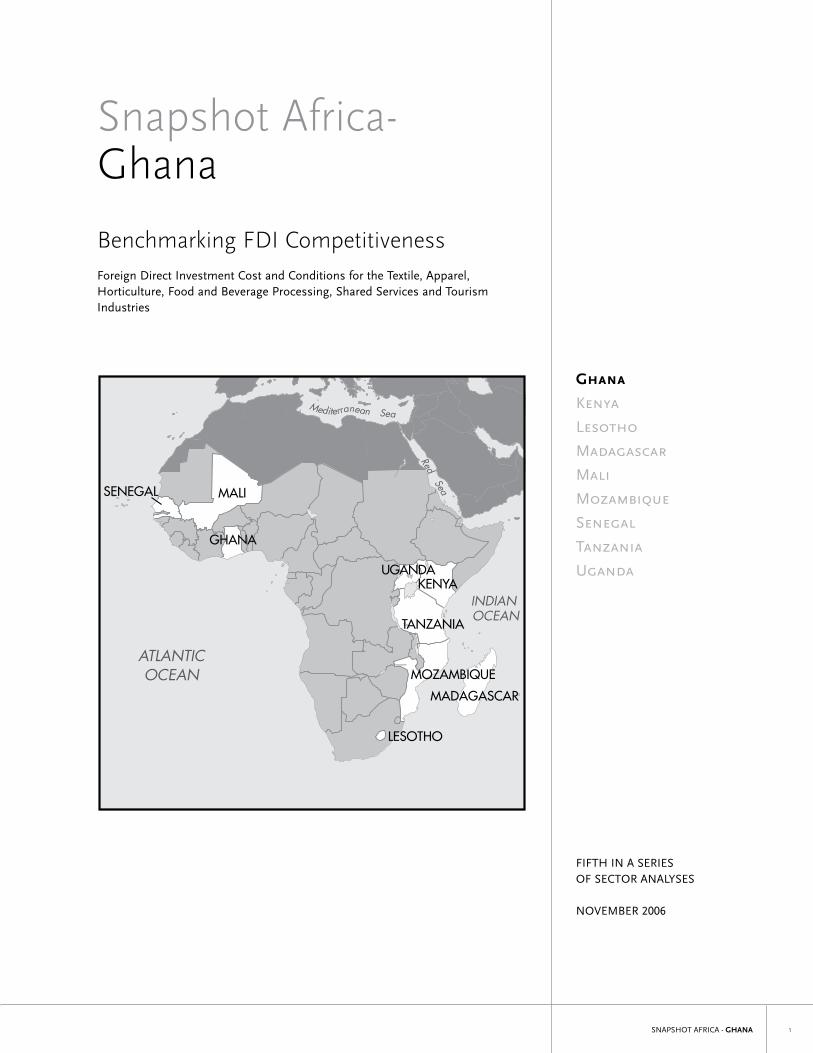
Snapshot Africa-Ghana
Benchmarking FDI CompetitivenessForeign Direct Investment Cost and Conditions for the Textile, Apparel, Horticulture, Food and Beverage Processing, Shared Services and Tourism Industries
FIFTH IN A SERIES OF SECTOR ANAlYSES
NOVEMBER 2006
Ghana
Kenya
Lesotho
Madagascar
Mali
Mozambique
Senegal
Tanzania
Uganda
SNAPSHOT AFRICA - GHANA�
The Multilateral Investment Guarantee Agency is not, by means of this publication, rendering
accounting, business, financial, investment, legal, tax, site selection, or other professional advice
or services, and shall not be responsible for any loss sustained by any person who relies on this
publication as a substitute for such professional advice or services. Before making any decision
or taking any action that may affect your business, you should consult a qualified professional
advisor.
Table of Content
Sector
Textile .......................................................................................................................9 Apparel ...................................................................................................................13 Horticulture ...........................................................................................................17 Food and Beverage Processing .............................................................................21 Shared Services .....................................................................................................25 Tourism ..................................................................................................................29
Appendices
I. Acronyms and Abbreviations .............................................................................34
II. Data Definitions and Sources ..........................................................................35
III. Tables and Findings .........................................................................................44
IV. The Ghana Investment Promotion Centre (GIPC) .........................................63
SNAPSHOT AFRICA - GHANA �
Introduction
As part of MIGA’s global Enterprise Benchmarking Program (EBP), a study was conducted in sub-Saharan African countries among six industries to compare the operating costs and conditions for investors located in nine sub-Saharan African countries: Ghana, Kenya, lesotho, Madagascar, Mali, Mozambique, Senegal, Tanzania and Uganda. This report summarizes the study’s findings, and presents the result of the sub-Saharan Africa EBP, adhering to the location benchmarking approach commonly used by foreign investors to evaluate alternative global investment sites. As an analytical tool, location benchmarking enables an investing company to narrow its site selection options to a short-list of locations best suited to the requirements of the investment project. Countries were evaluated based on the actual costs and operating conditions reported by existing investors with facilities in these countries.
The study was conducted by the Multilateral Investment Guarantee Agency of the World Bank Group, with the financial support of the Government of Madagascar in association with the Private Sector Development Project II (International Development Association [IDA]), the Swiss State Secretariat for Economic Affairs (SECO), the Austrian Development Agency (ADA), United States Agency for International Development (USAID) and Japan Policy and Human Resources Development Trust Fund (World Bank).
The Africa EBP was designed to deliver on several specific components, many with associated outputs integral to the participating countries’ investment promotion strategies, capacities and processes. Its key objectives were to:• Compare the operating costs and conditions associated with the selected
industries in each country in order to identify industries with a strong com-petitive position, relative to competing locations. This can then be incorporated into inward investment promotion strategies and marketing efforts;
• Use SWOT analysis to identify each country’s comparative strengths, weak-nesses, opportunities and threats as a destination for inward investment in the selected industries;
• Identify each country’s comparative advantages and make recommendations for improving the investment climate and attractiveness of each country for inward investment promotion, which can assist an IPI in developing sector-specific key selling messages to attract inward investment;
• Develop expertise within the IPIs through their involvement in the execution of the work program and through targeted capacity building so that lessons learned are institutionalized.
Methodology
MIGA’s EBP methodology aims to capture a snapshot of an industry in one location at a static point in time from the unique perspective of the investor. Part of this snapshot reflects objective, quantitative operating costs; another portion is based on investors’ perceptions of qualitative operating conditions. Perceptions of operating conditions, while subjective, are formed by the actual experiences of the investor and can significantly influence the investment location decision.
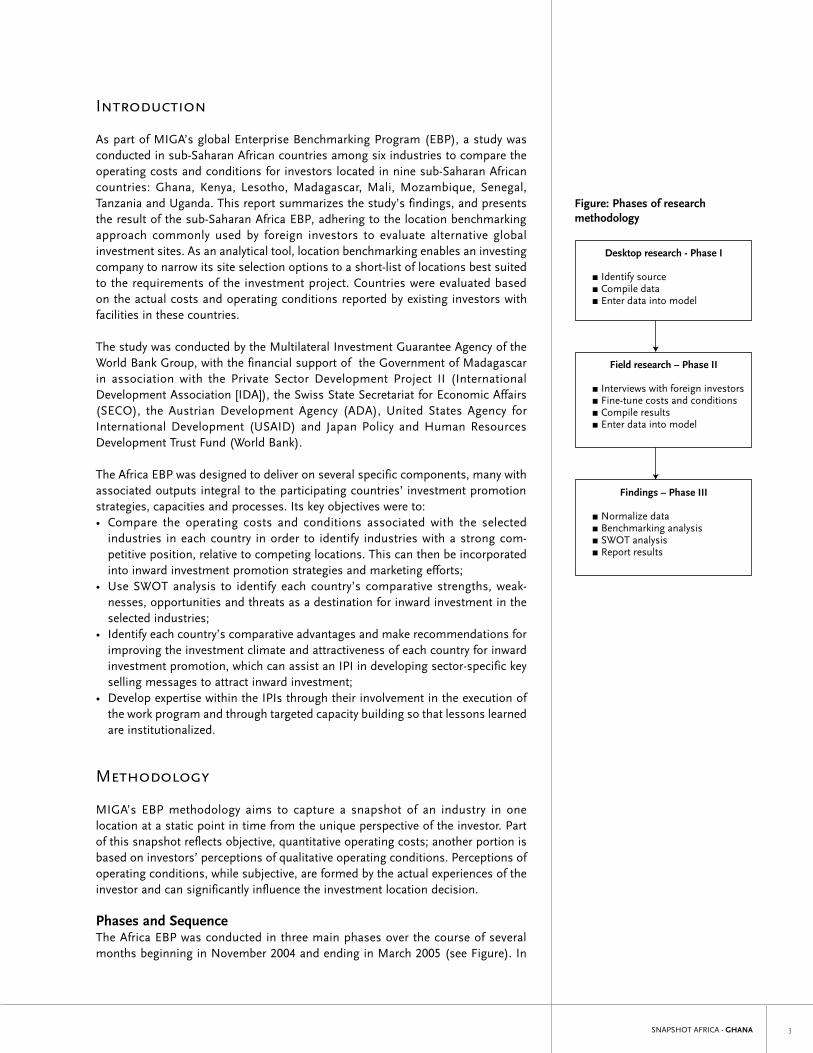
Phases and SequenceThe Africa EBP was conducted in three main phases over the course of several months beginning in November 2004 and ending in March 2005 (see Figure). In
Desktop research - Phase I
r Identify sourcer Compile datar Enter data into model
Field research – Phase II
r Interviews with foreign investorsr Fine-tune costs and conditionsr Compile resultsr Enter data into model
Findings – Phase III
r Normalize datar Benchmarking analysisr SWOT analysisr Report results
Figure: Phases of research methodology
SNAPSHOT AFRICA - GHANA�
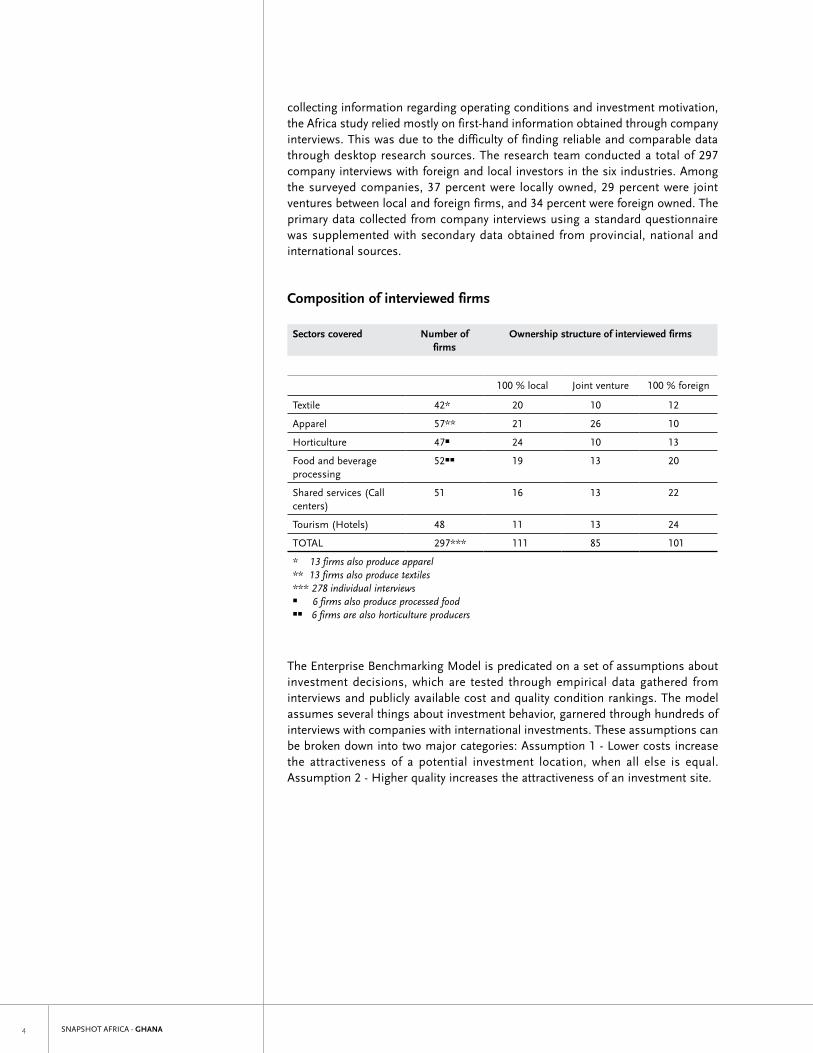
collecting information regarding operating conditions and investment motivation, the Africa study relied mostly on first-hand information obtained through company interviews. This was due to the difficulty of finding reliable and comparable data through desktop research sources. The research team conducted a total of 297 company interviews with foreign and local investors in the six industries. Among the surveyed companies, 37 percent were locally owned, 29 percent were joint ventures between local and foreign firms, and 34 percent were foreign owned. The primary data collected from company interviews using a standard questionnaire was supplemented with secondary data obtained from provincial, national and international sources.
Composition of interviewed firms
Sectors covered Number of firms
Ownership structure of interviewed firms
100 % local Joint venture 100 % foreign
Textile 42* 20 10 12
Apparel 57** 21 26 10
Horticulture 47r 24 10 13
Food and beverage processing
52rr 19 13 20
Shared services (Call centers)
51 16 13 22
Tourism (Hotels) 48 11 13 24
TOTAl 297*** 111 85 101
* 13 firms also produce apparel ** 13 firms also produce textiles *** 278 individual interviews r 6 firms also produce processed food rr 6 firms are also horticulture producers
The Enterprise Benchmarking Model is predicated on a set of assumptions about investment decisions, which are tested through empirical data gathered from interviews and publicly available cost and quality condition rankings. The model assumes several things about investment behavior, garnered through hundreds of interviews with companies with international investments. These assumptions can be broken down into two major categories: Assumption 1 - lower costs increase the attractiveness of a potential investment location, when all else is equal. Assumption 2 - Higher quality increases the attractiveness of an investment site.
SNAPSHOT AFRICA - GHANA �
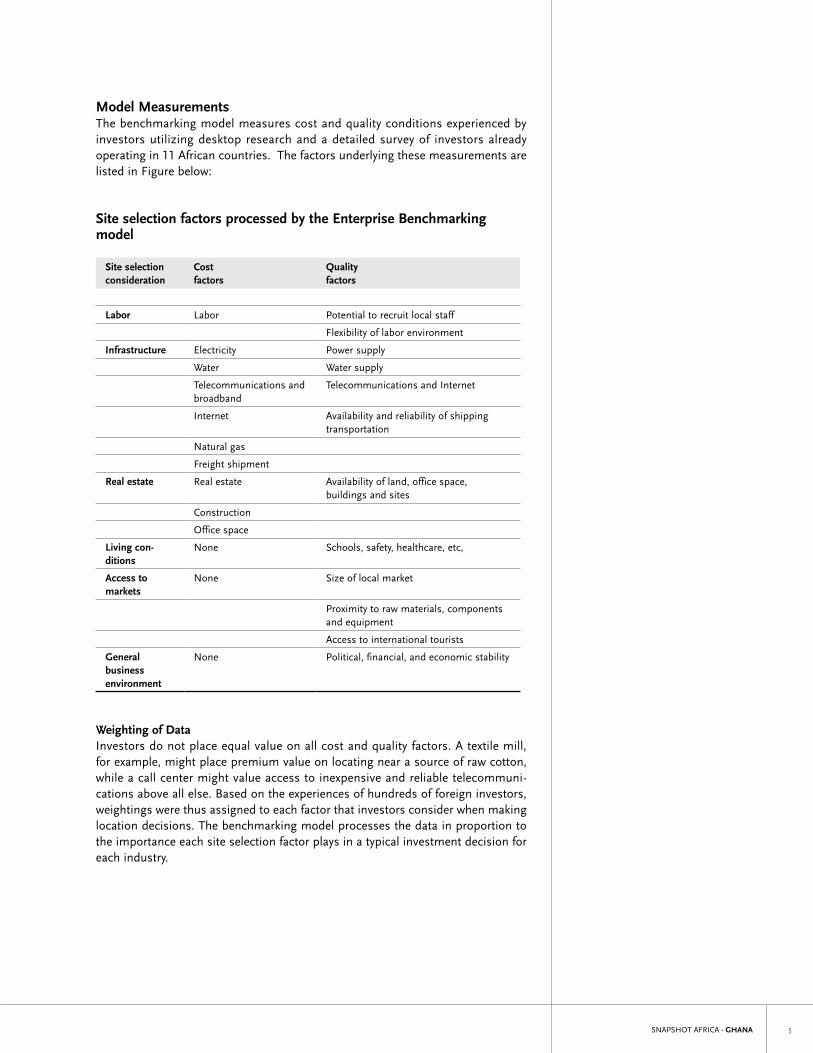
Model MeasurementsThe benchmarking model measures cost and quality conditions experienced by investors utilizing desktop research and a detailed survey of investors already operating in 11 African countries. The factors underlying these measurements are listed in Figure below:
Site selection factors processed by the Enterprise Benchmarking model
Site selection consideration
Cost factors
Quality factors
Labor labor Potential to recruit local staff
Flexibility of labor environment
Infrastructure Electricity Power supply
Water Water supply
Telecommunications and broadband
Telecommunications and Internet
Internet Availability and reliability of shipping transportation
Natural gas
Freight shipment
Real estate Real estate Availability of land, office space, buildings and sites
Construction
Office space
Living con-ditions
None Schools, safety, healthcare, etc,
Access to markets
None Size of local market
Proximity to raw materials, components and equipment
Access to international tourists
Generalbusiness environment
None Political, financial, and economic stability
Weighting of DataInvestors do not place equal value on all cost and quality factors. A textile mill, for example, might place premium value on locating near a source of raw cotton, while a call center might value access to inexpensive and reliable telecommuni-cations above all else. Based on the experiences of hundreds of foreign investors, weightings were thus assigned to each factor that investors consider when making location decisions. The benchmarking model processes the data in proportion to the importance each site selection factor plays in a typical investment decision for each industry.
SNAPSHOT AFRICA - GHANA�
Ghana
With its political stability, economic l iberal ism, abundant natural resources, h ighly motivated work force and infrastructure improvements, Ghana is positioned to become West Africa’s premier gateway country, providing investors access to a regional market of over 250 million people. Ghana’s natural resource driven economy is the third largest in West Africa. It is the second largest exporter of lumber and gold on the continent, and the second
largest exporter of cocoa worldwide. Ghana also enjoys ample mineral deposits of diamonds, bauxite, manganese and salt, and lays claim to a vast expanse of arable land, forests and marine and fishing stocks. Ghanaians have also established a number of value-added industries including automobile, bus and truck assembly, textile and tire manufacturing, and flour and steel milling. Ghana also produces various consumer goods, such as beverages and canned goods. The country’s growing tourism sector has stimulated infrastructure development and increased government revenue.
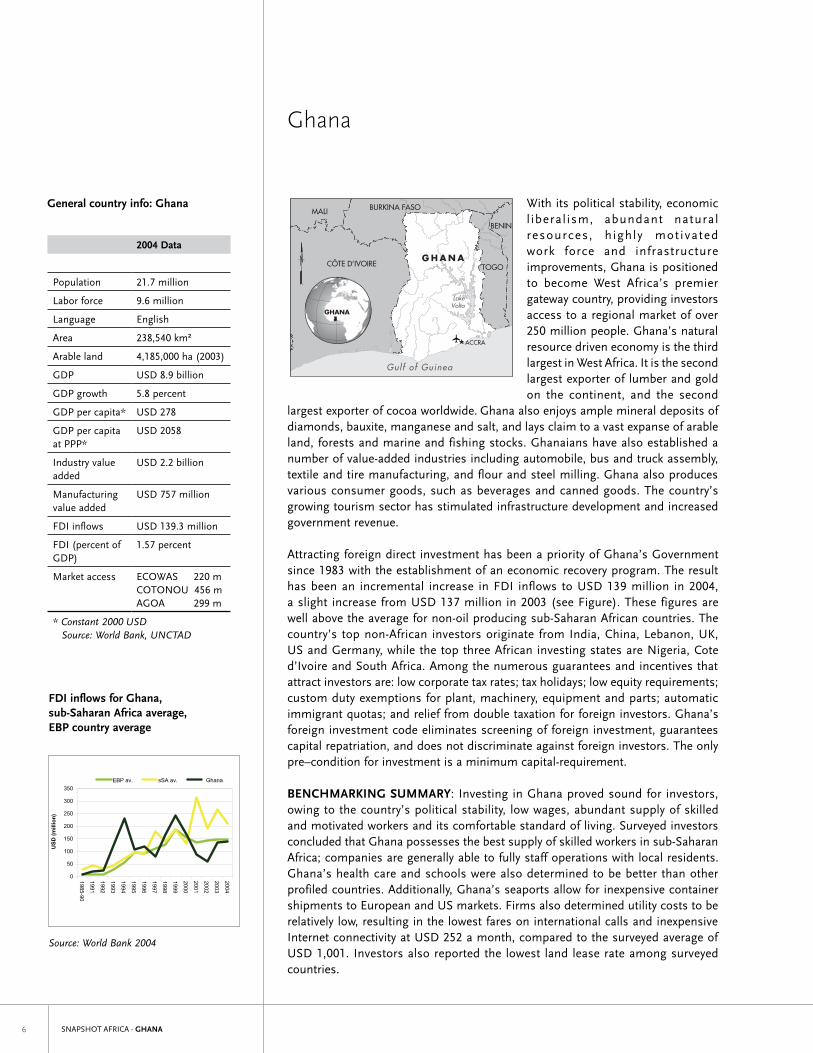
Attracting foreign direct investment has been a priority of Ghana’s Government since 1983 with the establishment of an economic recovery program. The result has been an incremental increase in FDI inflows to USD 139 million in 2004, a slight increase from USD 137 million in 2003 (see Figure). These figures are well above the average for non-oil producing sub-Saharan African countries. The country’s top non-African investors originate from India, China, lebanon, UK, US and Germany, while the top three African investing states are Nigeria, Cote d’Ivoire and South Africa. Among the numerous guarantees and incentives that attract investors are: low corporate tax rates; tax holidays; low equity requirements; custom duty exemptions for plant, machinery, equipment and parts; automatic immigrant quotas; and relief from double taxation for foreign investors. Ghana’s foreign investment code eliminates screening of foreign investment, guarantees capital repatriation, and does not discriminate against foreign investors. The only pre–condition for investment is a minimum capital-requirement.
BENCHMARKING SUMMARY: Investing in Ghana proved sound for investors, owing to the country’s political stability, low wages, abundant supply of skilled and motivated workers and its comfortable standard of living. Surveyed investors concluded that Ghana possesses the best supply of skilled workers in sub-Saharan Africa; companies are generally able to fully staff operations with local residents. Ghana’s health care and schools were also determined to be better than other profiled countries. Additionally, Ghana’s seaports allow for inexpensive container shipments to European and US markets. Firms also determined utility costs to be relatively low, resulting in the lowest fares on international calls and inexpensive Internet connectivity at USD 252 a month, compared to the surveyed average of USD 1,001. Investors also reported the lowest land lease rate among surveyed countries.
General country info: Ghana
2004 Data
Population 21.7 million
labor force 9.6 million
language English
Area 238,540 km²
Arable land 4,185,000 ha (2003)
GDP USD 8.9 billion
GDP growth 5.8 percent
GDP per capita* USD 278
GDP per capita at PPP*
USD 2058
Industry value added
USD 2.2 billion
Manufacturing value added
USD 757 million
FDI inflows USD 139.3 million
FDI (percent of GDP)
1.57 percent
Market access ECOWAS 220 mCOTONOU 456 mAGOA 299 m
* Constant 2000 USD Source: World Bank, UNCTAD
FDI inflows for Ghana, sub-Saharan Africa average, EBP country average
Source: World Bank 2004
1985-90 1991 1992 1993 1994 1995EBP Total 84 77 92 267 519 853EBP av. 9 9 10 30 58 95sSA av. 28 45 33 46 72 95 Sub-Saharan Africa Total 1257 2076 1498 2099 3304 4361 Ghana 8 20 23 125 233 107 Kenya 37 19 6 2 4 32 Lesotho 10 7 3 15 19 275 Madagascar 9 14 21 15 6 10 Mali 1 1 -22 4 17 111 Mozambique 4 23 25 32 35 45 Senegal 12 -8 21 -1 67 32 Tanzania 3 0 12 20 50 120 Uganda 0 1 3 55 88 121
Data are in millionsPage: Series: Foreign direct investment, net inflows in reporting economy (D
0
50
100
150
200
250
300
350
1985-90
1991
1992
1993
1994
1995
1996
1997
1998
1999
2000
2001
2002
2003
2004
USD
(mill
ion)
EBP av. sSA av. Ghana
0
50
100
150
200
250
300
350
1985-90
1991
1992
1993
1994
1995
1996
1997
1998
1999
2000
2001
2002
2003
2004
USD
(mill
ion)
EBP av. sSA av. Kenya
SNAPSHOT AFRICA - GHANA �
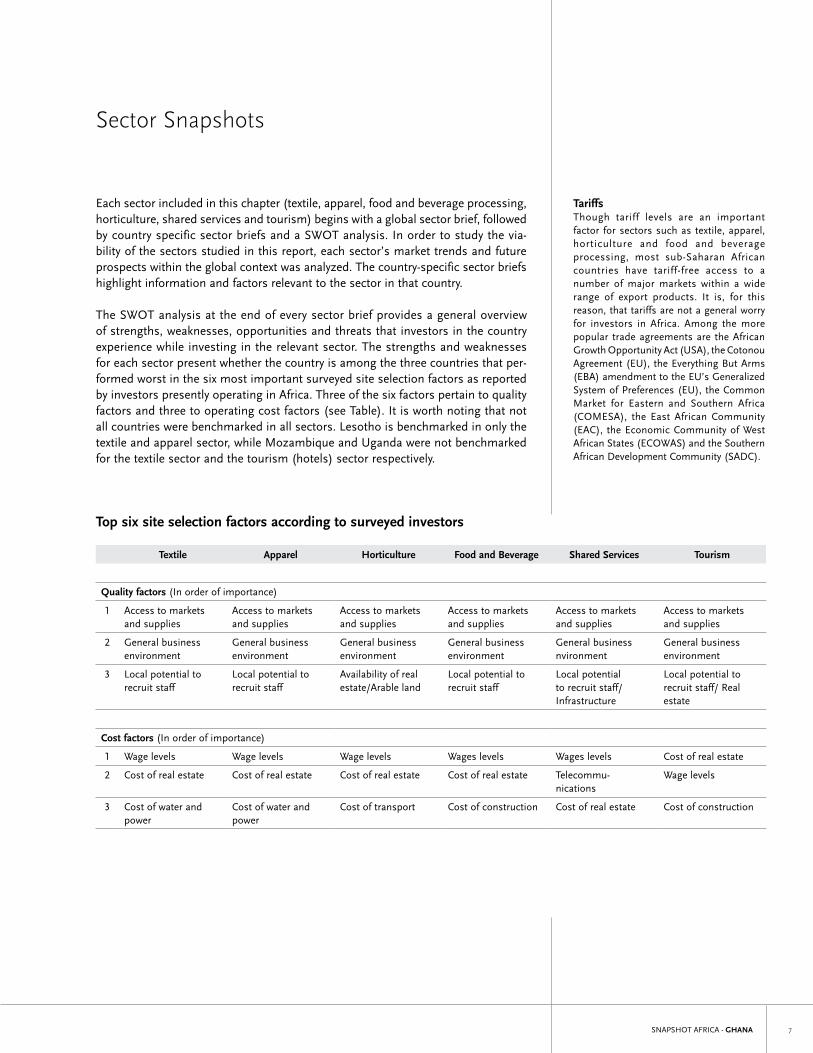
Sector Snapshots
Each sector included in this chapter (textile, apparel, food and beverage processing, horticulture, shared services and tourism) begins with a global sector brief, followed by country specific sector briefs and a SWOT analysis. In order to study the via-bility of the sectors studied in this report, each sector’s market trends and future prospects within the global context was analyzed. The country-specific sector briefs highlight information and factors relevant to the sector in that country.
The SWOT analysis at the end of every sector brief provides a general overview of strengths, weaknesses, opportunities and threats that investors in the country experience while investing in the relevant sector. The strengths and weaknesses for each sector present whether the country is among the three countries that per-formed worst in the six most important surveyed site selection factors as reported by investors presently operating in Africa. Three of the six factors pertain to quality factors and three to operating cost factors (see Table). It is worth noting that not all countries were benchmarked in all sectors. lesotho is benchmarked in only the textile and apparel sector, while Mozambique and Uganda were not benchmarked for the textile sector and the tourism (hotels) sector respectively.
Top six site selection factors according to surveyed investors
Textile Apparel Horticulture Food and Beverage Shared Services Tourism
Quality factors (In order of importance)
1 Access to markets and supplies
Access to markets and supplies
Access to markets and supplies
Access to markets and supplies
Access to markets and supplies
Access to markets and supplies
2 General business environment
General business environment
General business environment
General business environment
General business nvironment
General business environment
3 local potential to recruit staff
local potential to recruit staff
Availability of real estate/Arable land
local potential to recruit staff
local potential to recruit staff/ Infrastructure
local potential to recruit staff/ Real estate
Cost factors (In order of importance)
1 Wage levels Wage levels Wage levels Wages levels Wages levels Cost of real estate
2 Cost of real estate Cost of real estate Cost of real estate Cost of real estate Telecommu-nications
Wage levels
3 Cost of water and power
Cost of water and power
Cost of transport Cost of construction Cost of real estate Cost of construction
TariffsThough tariff levels are an important factor for sectors such as textile, apparel, horticulture and food and beverage processing, most sub-Saharan African countries have tariff-free access to a number of major markets within a wide range of export products. It is, for this reason, that tariffs are not a general worry for investors in Africa. Among the more popular trade agreements are the African Growth Opportunity Act (USA), the Cotonou Agreement (EU), the Everything But Arms (EBA) amendment to the EU’s Generalized System of Preferences (EU), the Common Market for Eastern and Southern Africa (COMESA), the East African Community (EAC), the Economic Community of West African States (ECOWAS) and the Southern African Development Community (SADC).

SNAPSHOT AFRICA - GHANA�
SNAPSHOT AFRICA - GHANA �
Textile Sector
Between 2000 and 2004, the value of world exports of textile products grew at an average annual rate of 4.4 percent. With exports from emerging economies growing at a slightly higher rate, their share of world exports increased by 1.5 per-centage points to 46.7 percent in 2004. Currently, the major players in the global textile market are China, the US, the EU, India, Pakistan, Japan, Republic of Korea and Turkey. low cotton prices provide cheap inputs to textile operations worldwide. According to the EIU, estimated global consumption of cotton in 2004/05, at 23.4m tons, is slightly higher than expected and represents an increase of almost 10 percent over the last year. Overall, world cotton consumption in 2005/06 is forecast to reach 24.35m tons, an increase of 4 percent.
The elimination at the end of 2004 of quantitative import restrictions under the World Trade Organization (WTO) Agreement on Textiles and Clothing (ATC) has greatly affected the textile industry (see Table). A recent study predicts the following trends as a result of the elimination of quotas on textiles: an increase in the share of world exports for textiles emanating from emerging economies; a considerable gain in the export shares of countries with low labor costs, such as China, India and Pakistan; heightened competition among suppliers in low-cost countries; and increased specialization of products among source countries.
The textile industry is usually characterized as capital intensive and highly automated, with a reliance on unskilled labor. Although labor costs in Africa are generally competitive with those in China or India, the main factor decreasing the competitiveness of Africa in the global textile trade is high utility costs, particularly for electricity and water, coupled with supply unreliability. A number of successful textile producing countries, such as China and India, rely on strong backward linkages for production inputs, and textile industries in Africa have yet to create such linkages to the local economy.
A number of countries benefit from AGOA’s third-country fabric sourcing allowance, which permits African countries, exporting under the AGOA agreement, to source raw material inputs from non-AGOA countries. This arrangement is slated to expire in 2007, which will increase the need for AGOA countries to source inputs from local suppliers. African textile exports under AGOA totaled USD 1.4 billion in 2005, which represents a 12 percent decline from the previous year, due to increased global competition, brought about by the elimination of the multi-fiber agreement (MFA). Africa has had little success thus far in attracting FDI into the textile sector. According to loco Monitor, an online FDI tool, Africa receives just 2 percent of global FDI, while Asia Pacific and Europe together account for almost 80 percent. The largest share of FDI in Africa in the textile sector is from the EU, followed by North America and Asia Pacific, while Africa and the Middle East account for many small-scale projects.
Sub-Saharan Africa does possess a number of advantages that increase its attrac-tiveness as an investment location, particularly its low labor costs and abundance of unskilled labor. Investors in Africa can also benefit from preferential access to a number of global markets, including AGOA, and large and still developing regional trade zones. A number of sub-Saharan African governments are putting increased emphasis on developing EPZs that provide improved access to global markets and infrastructure. Successful EPZ investments are evident in African countries such as Mauritius and lesotho.
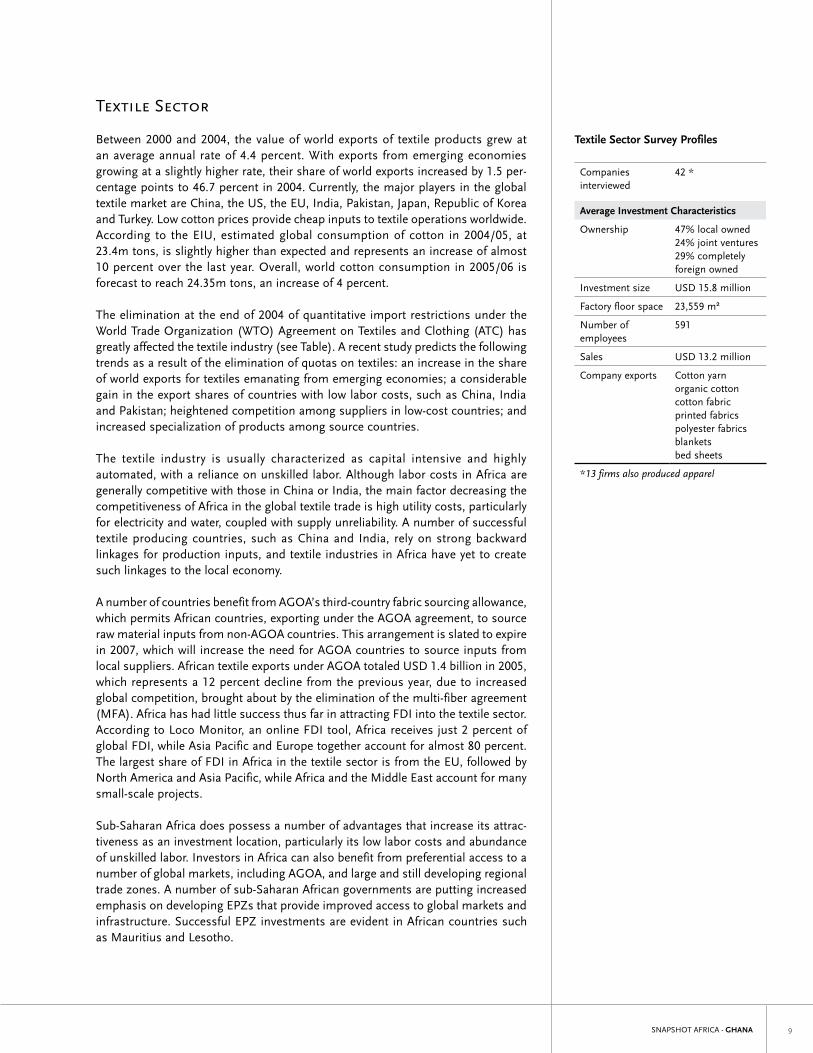
Textile Sector Survey Profiles
Companies interviewed
42 *
Average Investment Characteristics
Ownership 47% local owned24% joint ventures29% completely foreign owned
Investment size USD 15.8 million
Factory floor space 23,559 m²
Number of employees
591
Sales USD 13.2 million
Company exports Cotton yarn organic cotton cotton fabric printed fabrics polyester fabrics blankets bed sheets
*13 firms also produced apparel
SNAPSHOT AFRICA - GHANA�0
Textile Brief
• Ghana has a long tradition of woven cotton fabrics, including the widely cel-ebrated Kente cloth of the Ashanti and Ewe people.
• Textile manufacturing in Ghana is a small industry consisting of five textile mills producing batik – wax cloth, fancy printed cloth and Kente cloth - and three gin-neries. The industry has shown signs of growth in recent years.
• Promoting high-quality, traditionally designed fabrics as “Made in Ghana” could appeal to the niche US markets.
• Cotton is grown by 7,500 farmers in Ghana, and annual production stands at 35,000 tons. While Ghana does not have a large local supply of cotton or other natural fibers, these materials are readily available in the regional market or from Asia.
• Firms have situated themselves in Ghana to serve local and regional markets for printed African patterned fabrics.
• Ghanaian textile companies prefer to settle within designated industrial areas because of Ghana’s free zone regime and stable operating environment within these areas.
The elimination of the Multi-fiber Agreement
The MFA was set up in 1974 to protect the European and American textile and apparel industries from low-cost products from Asian countries. In time, the MFA developed into a complex system of quotas and restrictions on various products. In order to cope with these restrictions, exporting countries became adept at shifting production to less restricted product categories and countries when they reached their quotas on specific products. Since quota allocations were usually based on historic export performance, there was a further incentive to increase exports to unrestricted markets, even when it was not profitable, in order to increase subsequent years’ quota allotments. As a result, the quota system provided many developing countries with access to markets they otherwise would not have accessed. These countries are being adversely affected by the phase-out. In addition, in order to avoid quotas a number of countries moved up into higher value-added production, sourcing out low-cost production to less quota-restricted countries. This encouraged the fracturing of the global value chain and developed textile and apparel firms in developing countries. During the Uruguay Round of WTO negotiations, the ATC called for the phase-out of quotas on textiles and apparel over a 10-year period, beginning in January 1995, and ending in January 2005. There is general agreement that the elimination of textile and apparel quotas will immediately benefit a small handful of developing countries - those that possess a strong and diversified mix of textile and apparel products, engage in full-package production, produce high-quality, high value-added products, and possess diverse markets outside the US and the EU. These countries include China, India and Pakistan.
(Source: UNCTAD 2005)
Snapshot Africa Report
Motivation Graphs: Pg. 14 – 17
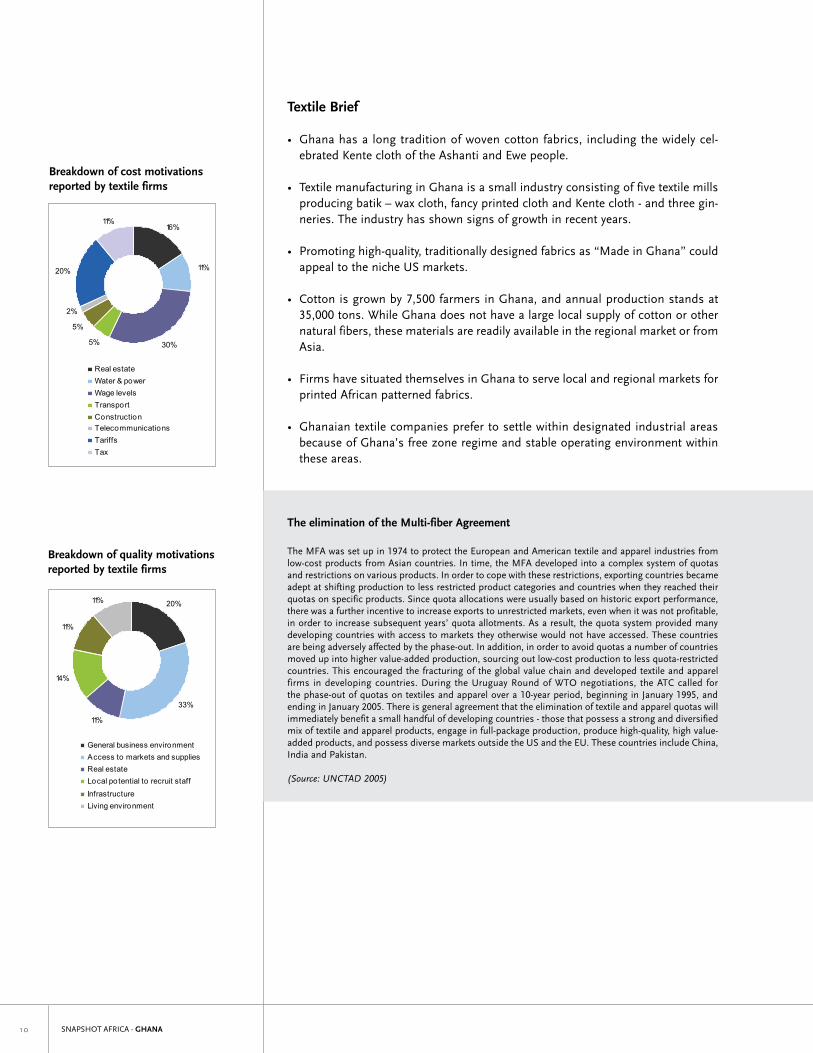
Figure 4: Breakdown of cost motivations reported by textile firms
11%
20%
2%
5%
5% 30%
11%
16%
Real estateWater & powerWage levelsTransportConstructionTelecommunicationsTariffsTax
Figure 5: Breakdown of quality motivations reported by textile firms
20%
33%
11%
14%
11%
11%
General business environmentAccess to markets and suppliesReal estateLocal potential to recruit staff
InfrastructureLiving environment
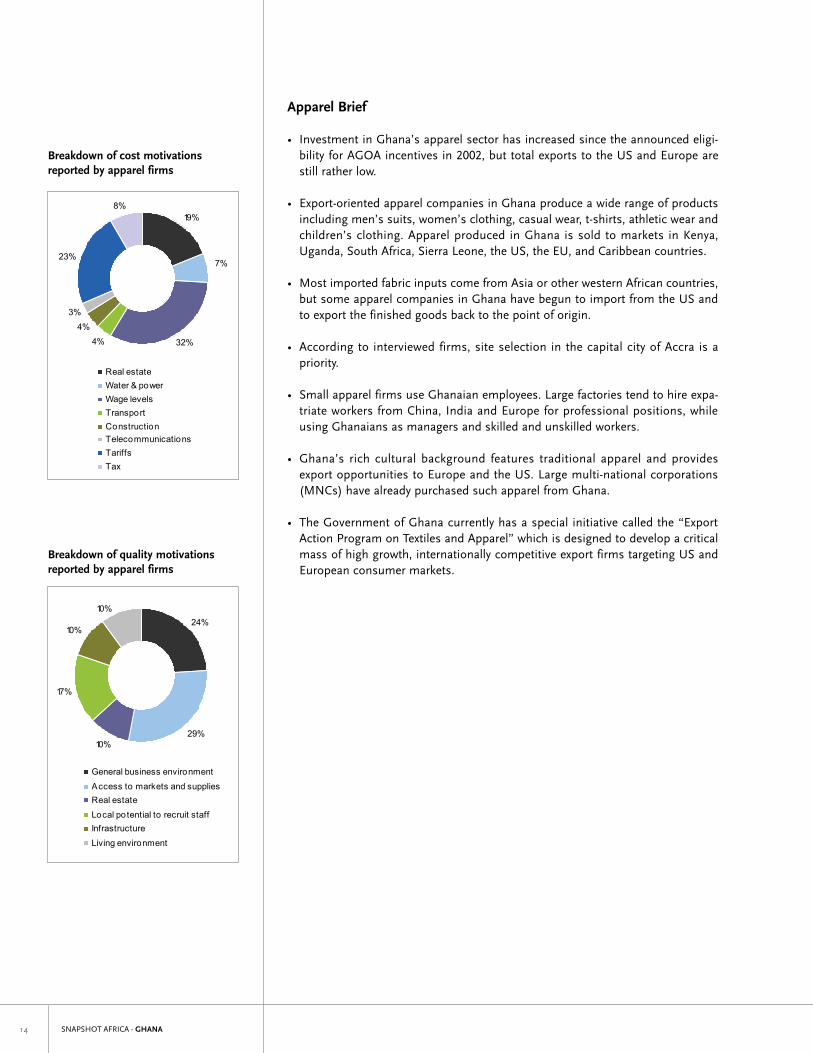
Figure 6: Breakdown of cost motivations reported by apparel firms
8%
23%
3%
4%
4% 32%
7%
19%
Real estateWater & powerWage levelsTransportConstructionTelecommunicationsTariffsTax
Figure 7: Breakdown of quality motivations reported by apparel firms
24%
29%10%
17%
10%
10%
General business environment
Access to markets and suppliesReal estate
Local potential to recruit staffInfrastructure
Living environment
Snapshot Africa Report
Motivation Graphs: Pg. 14 – 17
Figure 4: Breakdown of cost motivations reported by textile firms
11%
20%
2%
5%
5% 30%
11%
16%
Real estateWater & powerWage levelsTransportConstructionTelecommunicationsTariffsTax
Figure 5: Breakdown of quality motivations reported by textile firms
20%
33%
11%
14%
11%
11%
General business environmentAccess to markets and suppliesReal estateLocal potential to recruit staff
InfrastructureLiving environment
Figure 6: Breakdown of cost motivations reported by apparel firms
8%
23%
3%
4%
4% 32%
7%
19%
Real estateWater & powerWage levelsTransportConstructionTelecommunicationsTariffsTax
Figure 7: Breakdown of quality motivations reported by apparel firms
24%
29%10%
17%
10%
10%
General business environment
Access to markets and suppliesReal estate
Local potential to recruit staffInfrastructure
Living environment
Breakdown of cost motivations reported by textile firms
Breakdown of quality motivations reported by textile firms
SNAPSHOT AFRICA - GHANA ��
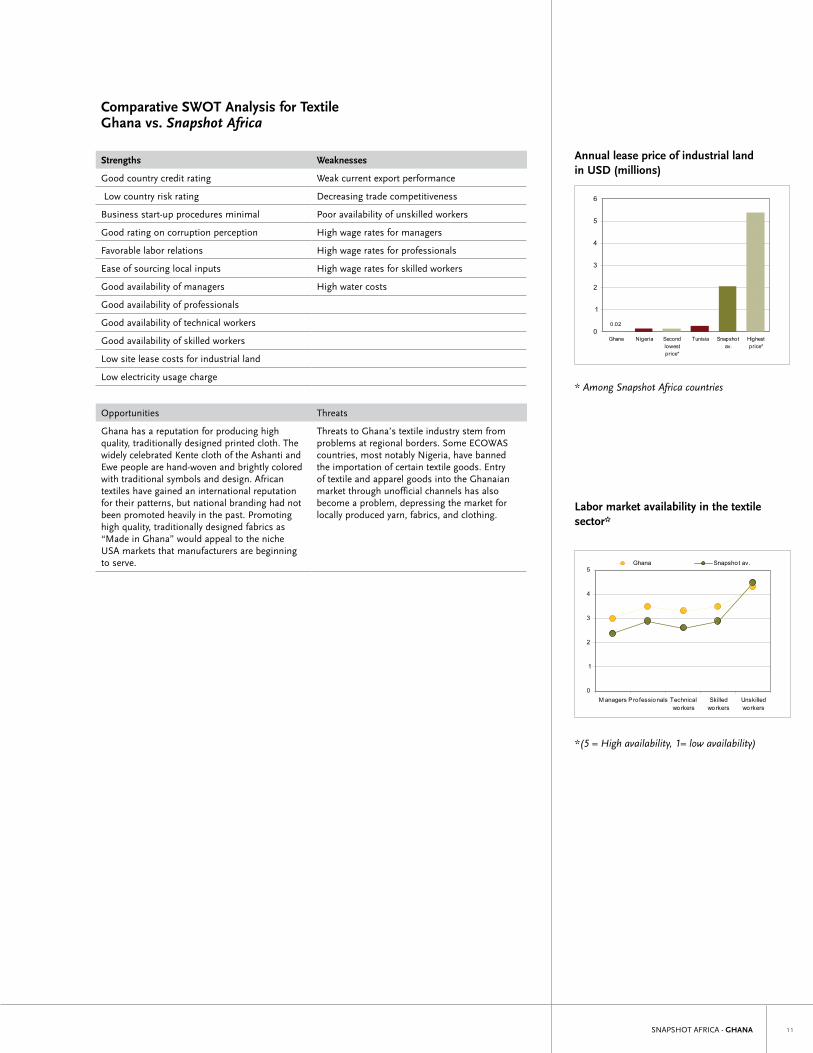
Annual lease price of industrial land in USD (millions)
0.020
1
2
3
4
5
6
Ghana Nigeria Secondlowestprice*
Tunisia Snapshotav.
Highestprice*
*Among Snapshot Africa countries
Labor market availability in the textile sector*
0
1
2
3
4
5
M anagers Professionals Technicalworkers
Skilledworkers
Unskilledworkers
Ghana Snapshot av.
*(5 = High availability, 1= low availability)
Annual lease price of industrial land in USD (millions)
* Among Snapshot Africa countries
Annual lease price of industrial land in USD (millions)
0.020
1
2
3
4
5
6
Ghana Nigeria Secondlowestprice*
Tunisia Snapshotav.
Highestprice*
*Among Snapshot Africa countries
Labor market availability in the textile sector*
0
1
2
3
4
5
M anagers Professionals Technicalworkers
Skilledworkers
Unskilledworkers
Ghana Snapshot av.
*(5 = High availability, 1= low availability)
Labor market availability in the textile sector*
*(5 = High availability, 1= low availability)
Comparative SWOT Analysis for Textile Ghana vs. Snapshot Africa
Strengths Weaknesses
Good country credit rating Weak current export performance
low country risk rating Decreasing trade competitiveness
Business start-up procedures minimal Poor availability of unskilled workers
Good rating on corruption perception High wage rates for managers
Favorable labor relations High wage rates for professionals
Ease of sourcing local inputs High wage rates for skilled workers
Good availability of managers High water costs
Good availability of professionals
Good availability of technical workers
Good availability of skilled workers
low site lease costs for industrial land
low electricity usage charge
Opportunities Threats
Ghana has a reputation for producing high quality, traditionally designed printed cloth. The widely celebrated Kente cloth of the Ashanti and Ewe people are hand-woven and brightly colored with traditional symbols and design. African textiles have gained an international reputation for their patterns, but national branding had not been promoted heavily in the past. Promoting high quality, traditionally designed fabrics as “Made in Ghana” would appeal to the niche USA markets that manufacturers are beginning to serve.
Threats to Ghana’s textile industry stem from problems at regional borders. Some ECOWAS countries, most notably Nigeria, have banned the importation of certain textile goods. Entry of textile and apparel goods into the Ghanaian market through unofficial channels has also become a problem, depressing the market for locally produced yarn, fabrics, and clothing.

SNAPSHOT AFRICA - GHANA��
SNAPSHOT AFRICA - GHANA ��
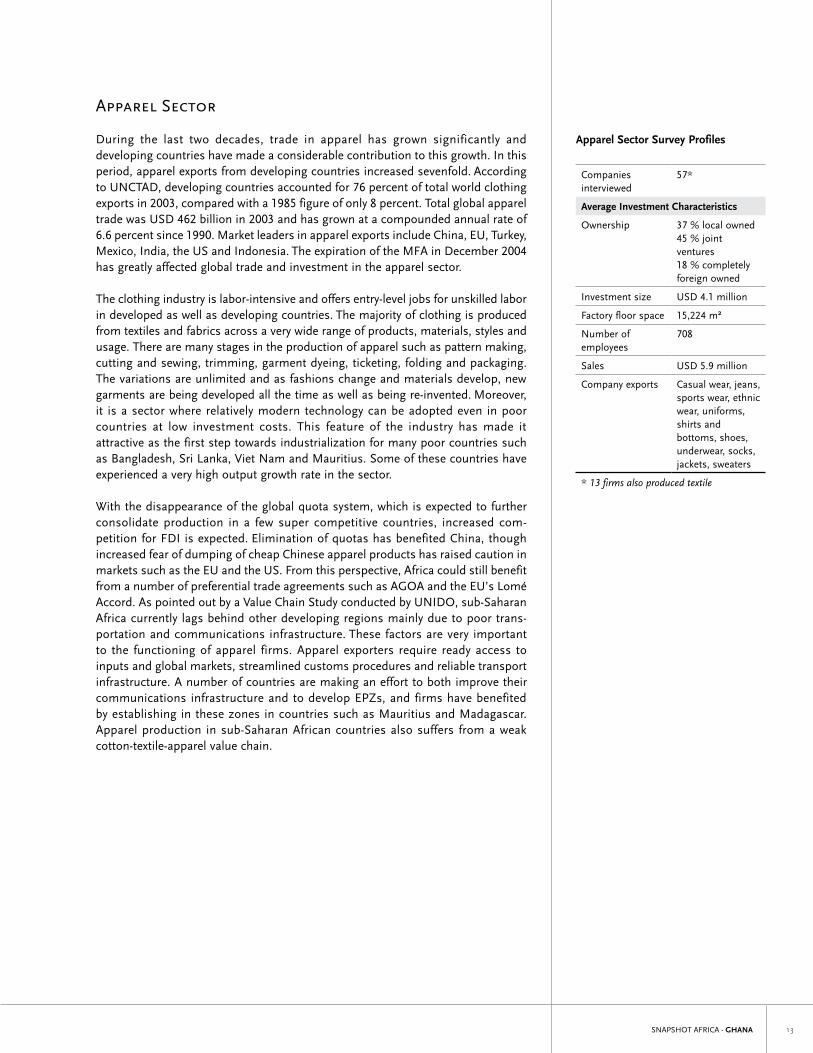
Apparel Sector
During the last two decades, trade in apparel has grown significantly and developing countries have made a considerable contribution to this growth. In this period, apparel exports from developing countries increased sevenfold. According to UNCTAD, developing countries accounted for 76 percent of total world clothing exports in 2003, compared with a 1985 figure of only 8 percent. Total global apparel trade was USD 462 billion in 2003 and has grown at a compounded annual rate of 6.6 percent since 1990. Market leaders in apparel exports include China, EU, Turkey, Mexico, India, the US and Indonesia. The expiration of the MFA in December 2004 has greatly affected global trade and investment in the apparel sector.
The clothing industry is labor-intensive and offers entry-level jobs for unskilled labor in developed as well as developing countries. The majority of clothing is produced from textiles and fabrics across a very wide range of products, materials, styles and usage. There are many stages in the production of apparel such as pattern making, cutting and sewing, trimming, garment dyeing, ticketing, folding and packaging. The variations are unlimited and as fashions change and materials develop, new garments are being developed all the time as well as being re-invented. Moreover, it is a sector where relatively modern technology can be adopted even in poor countries at low investment costs. This feature of the industry has made it attractive as the first step towards industrialization for many poor countries such as Bangladesh, Sri lanka, Viet Nam and Mauritius. Some of these countries have experienced a very high output growth rate in the sector.
With the disappearance of the global quota system, which is expected to further consolidate production in a few super competitive countries, increased com-petition for FDI is expected. Elimination of quotas has benefited China, though increased fear of dumping of cheap Chinese apparel products has raised caution in markets such as the EU and the US. From this perspective, Africa could still benefit from a number of preferential trade agreements such as AGOA and the EU’s lomé Accord. As pointed out by a Value Chain Study conducted by UNIDO, sub-Saharan Africa currently lags behind other developing regions mainly due to poor trans-portation and communications infrastructure. These factors are very important to the functioning of apparel firms. Apparel exporters require ready access to inputs and global markets, streamlined customs procedures and reliable transport infrastructure. A number of countries are making an effort to both improve their communications infrastructure and to develop EPZs, and firms have benefited by establishing in these zones in countries such as Mauritius and Madagascar. Apparel production in sub-Saharan African countries also suffers from a weak cotton-textile-apparel value chain.
Apparel Sector Survey Profiles
Companies interviewed
57*
Average Investment Characteristics
Ownership 37 % local owned45 % joint ventures18 % completely foreign owned
Investment size USD 4.1 million
Factory floor space 15,224 m²
Number of employees
708
Sales USD 5.9 million
Company exports Casual wear, jeans, sports wear, ethnic wear, uniforms, shirts and bottoms, shoes, underwear, socks, jackets, sweaters
* 13 firms also produced textile
SNAPSHOT AFRICA - GHANA��
Apparel Brief
• Investment in Ghana’s apparel sector has increased since the announced eligi-bility for AGOA incentives in 2002, but total exports to the US and Europe are still rather low.
• Export-oriented apparel companies in Ghana produce a wide range of products including men’s suits, women’s clothing, casual wear, t-shirts, athletic wear and children’s clothing. Apparel produced in Ghana is sold to markets in Kenya, Uganda, South Africa, Sierra leone, the US, the EU, and Caribbean countries.
• Most imported fabric inputs come from Asia or other western African countries, but some apparel companies in Ghana have begun to import from the US and to export the finished goods back to the point of origin.
• According to interviewed firms, site selection in the capital city of Accra is a priority.
• Small apparel firms use Ghanaian employees. large factories tend to hire expa-triate workers from China, India and Europe for professional positions, while using Ghanaians as managers and skilled and unskilled workers.
• Ghana’s rich cultural background features traditional apparel and provides export opportunities to Europe and the US. large multi-national corporations (MNCs) have already purchased such apparel from Ghana.
• The Government of Ghana currently has a special initiative called the “Export Action Program on Textiles and Apparel” which is designed to develop a critical mass of high growth, internationally competitive export firms targeting US and European consumer markets.
Breakdown of cost motivations reported by apparel firms
Breakdown of quality motivations reported by apparel firms
Snapshot Africa Report
Motivation Graphs: Pg. 14 – 17
Figure 4: Breakdown of cost motivations reported by textile firms
11%
20%
2%
5%
5% 30%
11%
16%
Real estateWater & powerWage levelsTransportConstructionTelecommunicationsTariffsTax
Figure 5: Breakdown of quality motivations reported by textile firms
20%
33%
11%
14%
11%
11%
General business environmentAccess to markets and suppliesReal estateLocal potential to recruit staff
InfrastructureLiving environment
Figure 6: Breakdown of cost motivations reported by apparel firms
8%
23%
3%
4%
4% 32%
7%
19%
Real estateWater & powerWage levelsTransportConstructionTelecommunicationsTariffsTax
Figure 7: Breakdown of quality motivations reported by apparel firms
24%
29%10%
17%
10%
10%
General business environment
Access to markets and suppliesReal estate
Local potential to recruit staffInfrastructure
Living environment
SNAPSHOT AFRICA - GHANA ��
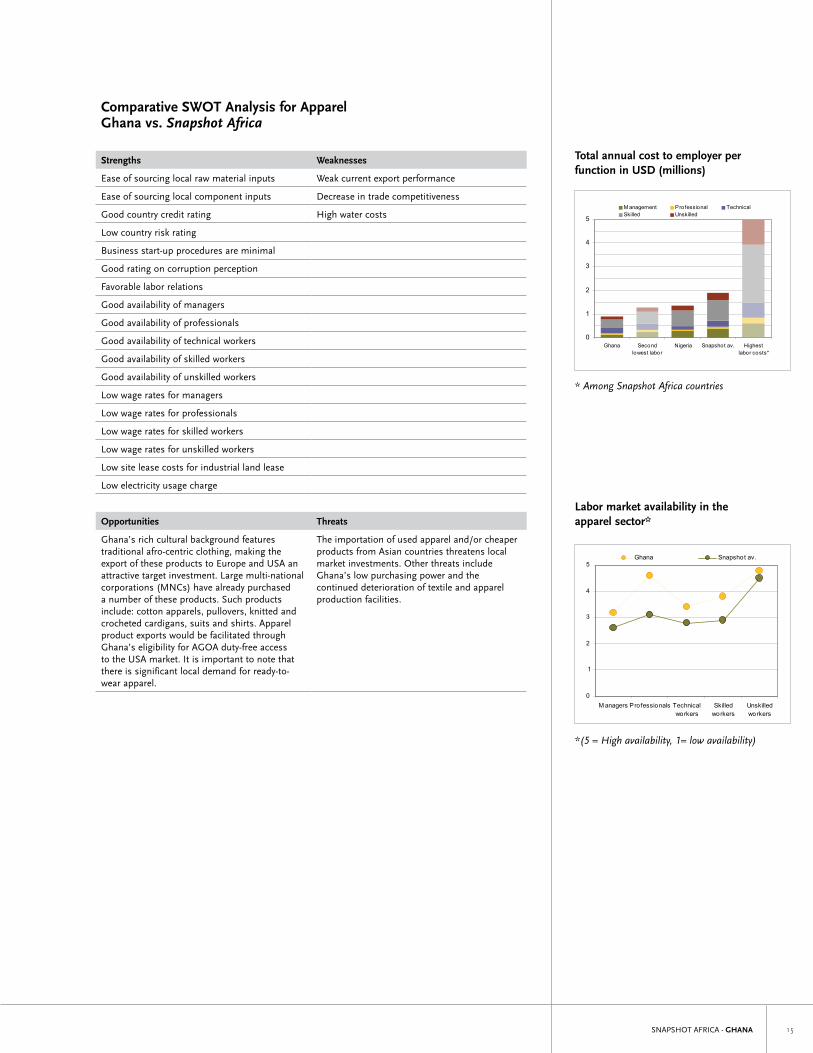
Total annual cost to employer per function in USD (millions)
0
1
2
3
4
5
Ghana Secondlowest labor
costs*
Nigeria Snapshot av. Highestlabor costs*
M anagement Professional TechnicalSkilled Unskilled
*Among Snapshot Africa countries
Labor market availability in the apparel sector*
0
1
2
3
4
5
M anagers Professionals Technicalworkers
Skilledworkers
Unskilledworkers
Ghana Snapshot av.
*(5 = High availability, 1= low availability)
Total annual cost to employer per function in USD (millions)
* Among Snapshot Africa countries
Labor market availability in the apparel sector*
*(5 = High availability, 1= low availability)
Comparative SWOT Analysis for Apparel Ghana vs. Snapshot Africa
Strengths Weaknesses
Ease of sourcing local raw material inputs Weak current export performance
Ease of sourcing local component inputs Decrease in trade competitiveness
Good country credit rating High water costs
low country risk rating
Business start-up procedures are minimal
Good rating on corruption perception
Favorable labor relations
Good availability of managers
Good availability of professionals
Good availability of technical workers
Good availability of skilled workers
Good availability of unskilled workers
low wage rates for managers
low wage rates for professionals
low wage rates for skilled workers
low wage rates for unskilled workers
low site lease costs for industrial land lease
low electricity usage charge
Opportunities Threats
Ghana’s rich cultural background features traditional afro-centric clothing, making the export of these products to Europe and USA an attractive target investment. large multi-national corporations (MNCs) have already purchased a number of these products. Such products include: cotton apparels, pullovers, knitted and crocheted cardigans, suits and shirts. Apparel product exports would be facilitated through Ghana’s eligibility for AGOA duty-free access to the USA market. It is important to note that there is significant local demand for ready-to-wear apparel.
The importation of used apparel and/or cheaper products from Asian countries threatens local market investments. Other threats include Ghana’s low purchasing power and the continued deterioration of textile and apparel production facilities.
Total annual cost to employer per function in USD (millions)
0
1
2
3
4
5
Ghana Secondlowest labor
costs*
Nigeria Snapshot av. Highestlabor costs*
M anagement Professional TechnicalSkilled Unskilled
*Among Snapshot Africa countries
Labor market availability in the apparel sector*
0
1
2
3
4
5
M anagers Professionals Technicalworkers
Skilledworkers
Unskilledworkers
Ghana Snapshot av.
*(5 = High availability, 1= low availability)

SNAPSHOT AFRICA - GHANA��
SNAPSHOT AFRICA - GHANA ��
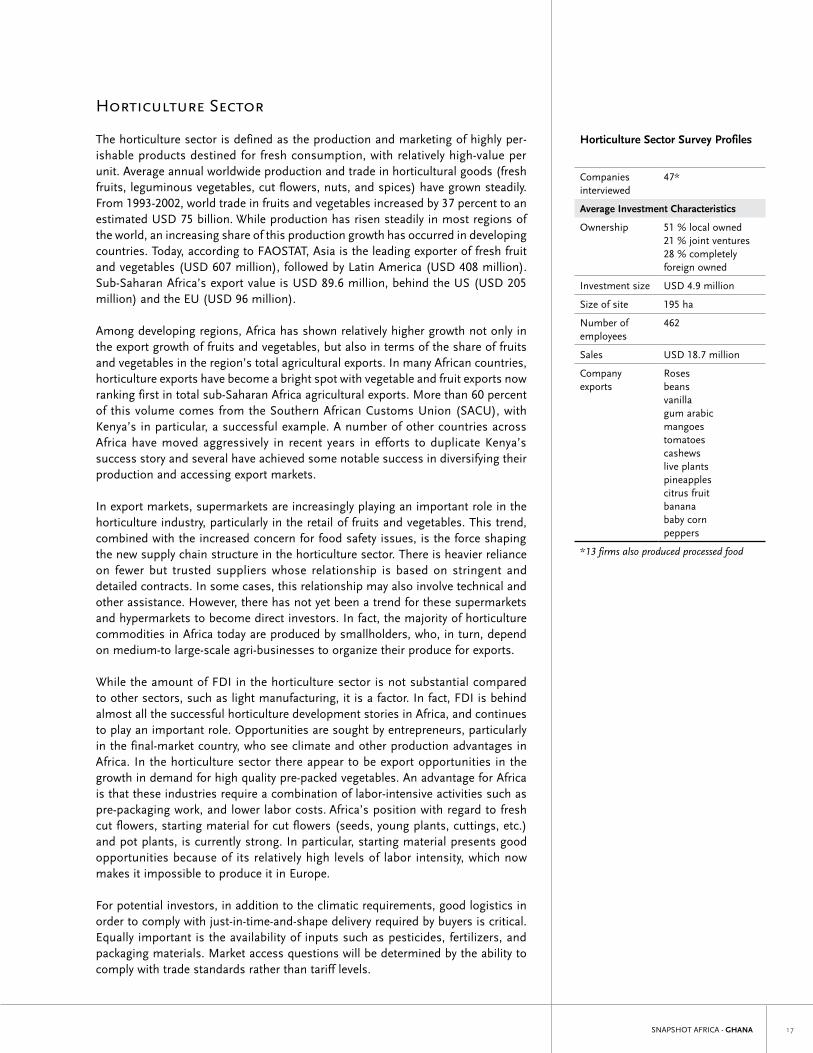
Horticulture Sector
The horticulture sector is defined as the production and marketing of highly per-ishable products destined for fresh consumption, with relatively high-value per unit. Average annual worldwide production and trade in horticultural goods (fresh fruits, leguminous vegetables, cut flowers, nuts, and spices) have grown steadily. From 1993-2002, world trade in fruits and vegetables increased by 37 percent to an estimated USD 75 billion. While production has risen steadily in most regions of the world, an increasing share of this production growth has occurred in developing countries. Today, according to FAOSTAT, Asia is the leading exporter of fresh fruit and vegetables (USD 607 million), followed by latin America (USD 408 million). Sub-Saharan Africa’s export value is USD 89.6 million, behind the US (USD 205 million) and the EU (USD 96 million).
Among developing regions, Africa has shown relatively higher growth not only in the export growth of fruits and vegetables, but also in terms of the share of fruits and vegetables in the region’s total agricultural exports. In many African countries, horticulture exports have become a bright spot with vegetable and fruit exports now ranking first in total sub-Saharan Africa agricultural exports. More than 60 percent of this volume comes from the Southern African Customs Union (SACU), with Kenya’s in particular, a successful example. A number of other countries across Africa have moved aggressively in recent years in efforts to duplicate Kenya’s success story and several have achieved some notable success in diversifying their production and accessing export markets.
In export markets, supermarkets are increasingly playing an important role in the horticulture industry, particularly in the retail of fruits and vegetables. This trend, combined with the increased concern for food safety issues, is the force shaping the new supply chain structure in the horticulture sector. There is heavier reliance on fewer but trusted suppliers whose relationship is based on stringent and detailed contracts. In some cases, this relationship may also involve technical and other assistance. However, there has not yet been a trend for these supermarkets and hypermarkets to become direct investors. In fact, the majority of horticulture commodities in Africa today are produced by smallholders, who, in turn, depend on medium-to large-scale agri-businesses to organize their produce for exports.
While the amount of FDI in the horticulture sector is not substantial compared to other sectors, such as light manufacturing, it is a factor. In fact, FDI is behind almost all the successful horticulture development stories in Africa, and continues to play an important role. Opportunities are sought by entrepreneurs, particularly in the final-market country, who see climate and other production advantages in Africa. In the horticulture sector there appear to be export opportunities in the growth in demand for high quality pre-packed vegetables. An advantage for Africa is that these industries require a combination of labor-intensive activities such as pre-packaging work, and lower labor costs. Africa’s position with regard to fresh cut flowers, starting material for cut flowers (seeds, young plants, cuttings, etc.) and pot plants, is currently strong. In particular, starting material presents good opportunities because of its relatively high levels of labor intensity, which now makes it impossible to produce it in Europe.
For potential investors, in addition to the climatic requirements, good logistics in order to comply with just-in-time-and-shape delivery required by buyers is critical. Equally important is the availability of inputs such as pesticides, fertilizers, and packaging materials. Market access questions will be determined by the ability to comply with trade standards rather than tariff levels.
Horticulture Sector Survey Profiles
Companies interviewed
47*
Average Investment Characteristics
Ownership 51 % local owned21 % joint ventures28 % completely foreign owned
Investment size USD 4.9 million
Size of site 195 ha
Number of employees
462
Sales USD 18.7 million
Company exports
Rosesbeansvanillagum arabicmangoestomatoescashewslive plantspineapplescitrus fruitbananababy cornpeppers
*13 firms also produced processed food
SNAPSHOT AFRICA - GHANA��
Horticulture Brief
• In 2004, around 120,000 tons of fruit were exported from Ghana. Currently, Ghana exports primarily to the EU and Commonwealth of Independent States (CIS). Ghana also cultivates horticulture for the local market.
• The primary export product of surveyed firms was pineapple. Other tropical fruits, such as mango, banana and papaya, were exported as well.
• Ghana’s climate is well suited for pineapple cultivation. Given the increased demand for pineapples, Ghana is well positioned for production increases and several surveyed businesses have plans for expansion. Investors also noted opportunities to begin cultivation of MD2 pineapples, which are very sweet, have a longer shelf life and sell better on the world market.
• Besides pineapples, horticulture products that are grown in Ghana and are open to investment include bananas, mangos, papayas, chili, yams and flowers. Currently, citrus is one of the fastest developing crops in Ghana and enjoys both high regional and global demand. Ghana has strong potential to develop its mango exports, which have seen increased demand from European countries.
• Fertilizers, pesticides, and other agricultural chemicals are sourced locally or imported from Germany or Côte d’Ivoire. Many packaging materials, such as cardboard cartons, are imported from Brazil or France.
• In Ghana, horticulture firms search for sites with ample access to landline tele-phones and for adequate road access to the seaport and international airport.
• Surveyed horticulture firms employ between 160 and 800 workers. laborers often seek temporary employment and leave after achieving fixed revenue goals.
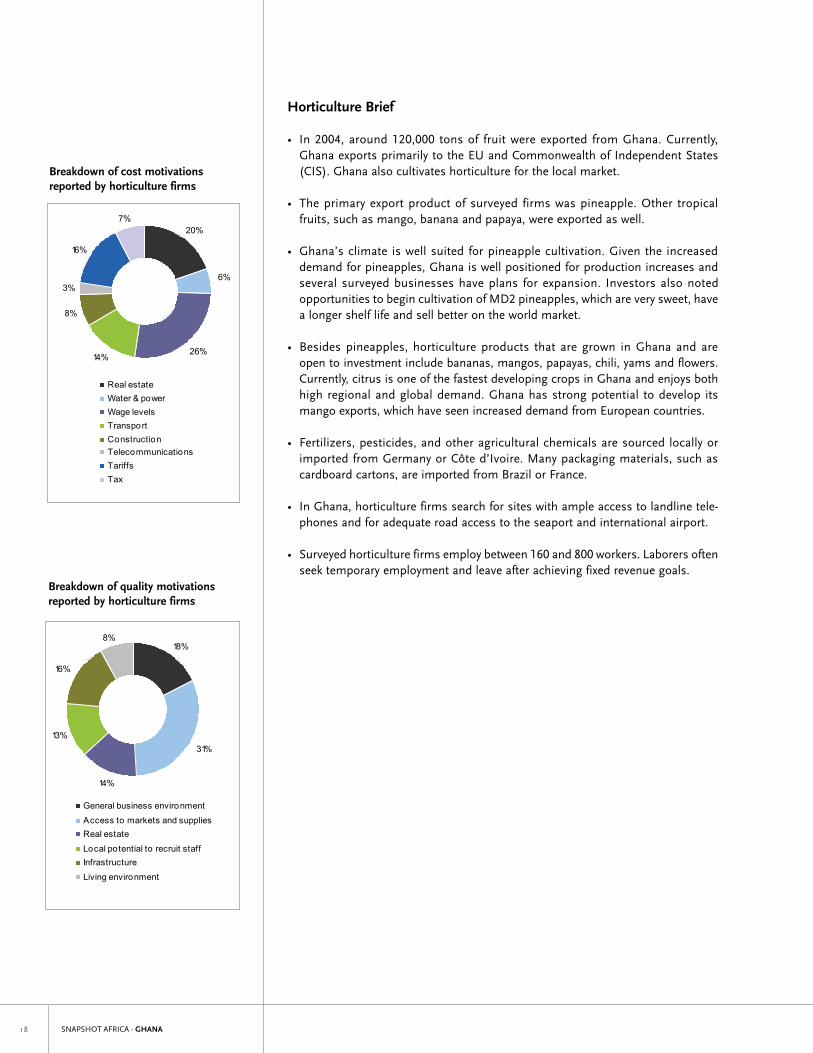
Breakdown of cost motivations reported by horticulture firms
Breakdown of quality motivations reported by horticulture firms
Figure 8: Breakdown of cost motivations reported by horticulture firms
20%
6%
26%14%
8%
3%
16%
7%
Real estateWater & powerWage levelsTransportConstructionTelecommunicationsTariffsTax
Figure 9: Breakdown of quality motivations reported by horticulture firms
18%
31%
14%
13%
16%
8%
General business environment
Access to markets and suppliesReal estate
Local potential to recruit staffInfrastructure
Living environment
Figure 10: Breakdown of cost motivations reported by food and beverage processing firms
16%
7%
23%
11%
12%
3%
18%
10%
Real estateWater & powerWage levelsTransportConstructionTelecommunicationsTariffsTax
Figure 11: Breakdown of quality motivations reported by food and beverage processing firms
18%
43%
8%
10%
13%
8%
General business environment
Access to markets and supplies
Real estate
Local potential to recruit staff
Infrastructure
Living environment
SNAPSHOT AFRICA - GHANA ��
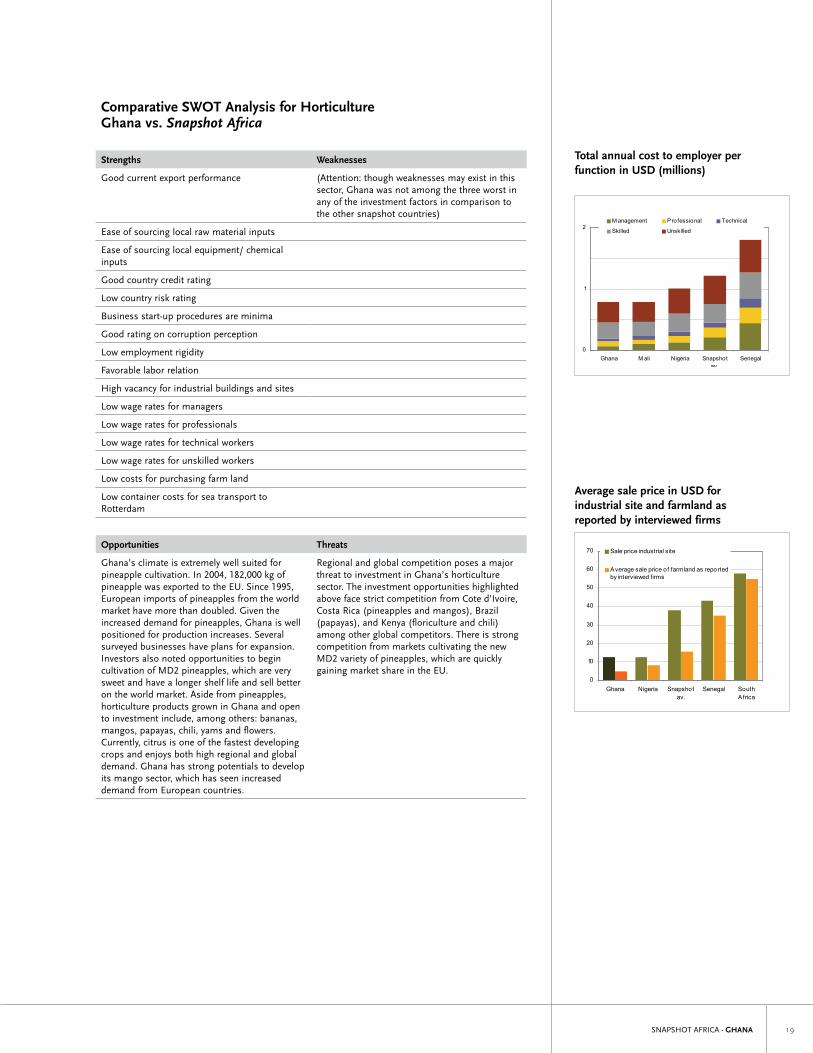
Total annual cost to employer per function in USD (millions)
0
1
2
Ghana M ali Nigeria Snapshotav.
Senegal
M anagement Professional Technical
Skilled Unskilled
Average sale price for industrial site and farmland as reported by interviewed firms
0
10
20
30
40
50
60
70
Ghana Nigeria Snapshotav.
Senegal SouthAfrica
Sale price industrial site
Average sale price of farmland as reportedby interviewed firms
Total annual cost to employer per function in USD (millions)
Total annual cost to employer per function in USD (millions)
0
1
2
Ghana M ali Nigeria Snapshotav.
Senegal
M anagement Professional Technical
Skilled Unskilled
Average sale price for industrial site and farmland as reported by interviewed firms
0
10
20
30
40
50
60
70
Ghana Nigeria Snapshotav.
Senegal SouthAfrica
Sale price industrial site
Average sale price of farmland as reportedby interviewed firms
Average sale price in USD for industrial site and farmland as reported by interviewed firms
Comparative SWOT Analysis for Horticulture Ghana vs. Snapshot Africa
Strengths Weaknesses
Good current export performance (Attention: though weaknesses may exist in this sector, Ghana was not among the three worst in any of the investment factors in comparison to the other snapshot countries)
Ease of sourcing local raw material inputs
Ease of sourcing local equipment/ chemical inputs
Good country credit rating
low country risk rating
Business start-up procedures are minima
Good rating on corruption perception
low employment rigidity
Favorable labor relation
High vacancy for industrial buildings and sites
low wage rates for managers
low wage rates for professionals
low wage rates for technical workers
low wage rates for unskilled workers
low costs for purchasing farm land
low container costs for sea transport to Rotterdam
Opportunities Threats
Ghana’s climate is extremely well suited for pineapple cultivation. In 2004, 182,000 kg of pineapple was exported to the EU. Since 1995, European imports of pineapples from the world market have more than doubled. Given the increased demand for pineapples, Ghana is well positioned for production increases. Several surveyed businesses have plans for expansion. Investors also noted opportunities to begin cultivation of MD2 pineapples, which are very sweet and have a longer shelf life and sell better on the world market. Aside from pineapples, horticulture products grown in Ghana and open to investment include, among others: bananas, mangos, papayas, chili, yams and flowers. Currently, citrus is one of the fastest developing crops and enjoys both high regional and global demand. Ghana has strong potentials to develop its mango sector, which has seen increased demand from European countries.
Regional and global competition poses a major threat to investment in Ghana’s horticulture sector. The investment opportunities highlighted above face strict competition from Cote d’Ivoire, Costa Rica (pineapples and mangos), Brazil (papayas), and Kenya (floriculture and chili) among other global competitors. There is strong competition from markets cultivating the new MD2 variety of pineapples, which are quickly gaining market share in the EU.

SNAPSHOT AFRICA - GHANA�0
SNAPSHOT AFRICA - GHANA ��
Food and Beverage Processing Sector
The food and beverage processing sector refers to the manufacturing, processing and preservation of meat, fish, fruit, vegetables, oils and fats; manufacture of dairy products; manufacture of grain mill products, starches and starch products and prepared animals feeds; manufacture of other food products (e.g. bread, sugar, chocolate, pasta, coffee, nuts and spices); and the manufacture of bottled and canned soft drinks, fruit juices, beer, wines, etc.
Global market growth for processed food and beverages has been strong in recent years, with sales totaling an estimated USD 3.2 trillion, or about three-fourths of total world food sales. Africa is no exception. Agro-processing is one of the most significant manufacturing activities in Africa. In fact, agribusiness activity, of which food processing represents a large share, accounts for approximately one-fifth (or USD 70 billion) of the region’s GDP and just under half of the region’s value-added in manufacturing and services.
Despite strong production and sales growth of processed foods and beverage in recent years, growth in trade has been slow, at about 6 percent of sales. The presence of tariff escalation and growing use of trade remedy measures (such as antidumping and countervailing duties and safeguard measures) are partly to blame. Such mechanisms favor trade in raw commodities at the expense of pro-cessed products, reflecting countries’ efforts to encourage domestic processing. As a result, firms looking for access to foreign markets often opt to make foreign direct investment. Market saturation at home and the search for higher profit margins in new underserved markets is pushing food manufacturers to seek overseas markets. These companies are looking to capitalize on increased local demand for higher value foods, a trend driven by rising incomes and increased urbanization. At the same time, consumer-driven changes are increasingly pushing food suppliers to meet consumer demand and preferences at a local level. This requires food suppliers to be capable of tailoring their products to the unique char-acteristics of consumer demands in each market that they serve, for which FDI offers a better tool than exports.
The largest food companies such as Nestlé, Kraft, Unilever, Coca-Cola and Pepsi already have a strong presence across the developing world. In Africa alone, the Coca-Cola Co. has more than 100 bottling and canning plants; Nestlé has 27 factories supplying African consumers with a wide range of products including powdered milk, soluble coffees, bottled water, breakfast cereals, chilled dairy and ice cream and infant nutrition. Unilever is currently operating in 13 countries with more than USD 2 billion sales annually. In recent years, South African firms in particular have expanded into the region with new retail food formats, fast food outlets, and pan-African processed food brands. Given the importance of the size of the local or regional market, formulating regional trade blocs is one way to enhance attractiveness to investors. According to the UN’s Food and Agriculture Organization (FAO), the East African milk market alone is due to double by 2030 to 475 million metric tons. Fisheries is a constantly expanding sub-sector, espe-cially in East Africa, as the region is endowed with some of the largest freshwater lakes and abundant fishery resources, including the Nile perch, the most widely processed fish for export in the region. From 1995-2001, exports of fish and fish products from the EAC nearly tripled in value. In West Africa, Ghana successfully tapped into the endowment of fish supply and attracted FDI: Starkist’s investment in canned tuna manufacturing tripled Ghana’s export capacity of processed tuna.
Food and Beverage Processing Sector Survey Profile
Companies interviewed
52*
Average Investment Characteristics
Ownership 37 % local owned25 % joint ventures38 % completely foreign owned
Investment size USD 38.1 million
Factory floor space
35,795 m²
Number of employees
518
Sales USD 52.9 million
Company exports
Dried fruits and vegetablesbottle beverages and fruit juicespalm oilpeanut oilsugarsjellies and jamspowdered milksbiscuitscookiescandycanned fruits and vegetables
*13 firms also produced horticulture
SNAPSHOT AFRICA - GHANA��
Food and Beverage Processing Brief
• In Ghana, food and beverage processing firms produce products exclusively for local and West African markets, which have grown in recent years.
• Manufacturing FDI is concentrated among processing activities such as canning tuna and pineapple, and export is oriented mainly to the EU and North America. From 1994 – 2002, FDI in the manufacturing sector amounted to USD 346 million and represented 19.5 percent of all registered investment projects.
• Ghanaian companies in this sector typically rely on imported inputs for pro-duction and packaging materials. In Ghana, most food processing is executed on a small scale, but maize and cassava are processed in large quantities.
• Surveyed companies in the Ghanaian food and beverage processing sector employ up to 2,000 workers.
• The seafood processing sub-sector is emerging as one of the most attractive investment sectors. Ghana’s EPZ currently includes one of West Africa’s major fish processing firms, processing about 170 tons of seafood (mostly tuna) a day. There is a large volume of tuna available all year round in Ghana’s coastal seas. The processing of tuna and other marine species presents an excellent oppor-tunity for investors interested in seafood processing.
• Ghana has a well-established international beverage processing sub-sector with opportunities existing in the production of fruit juices and soft drinks.
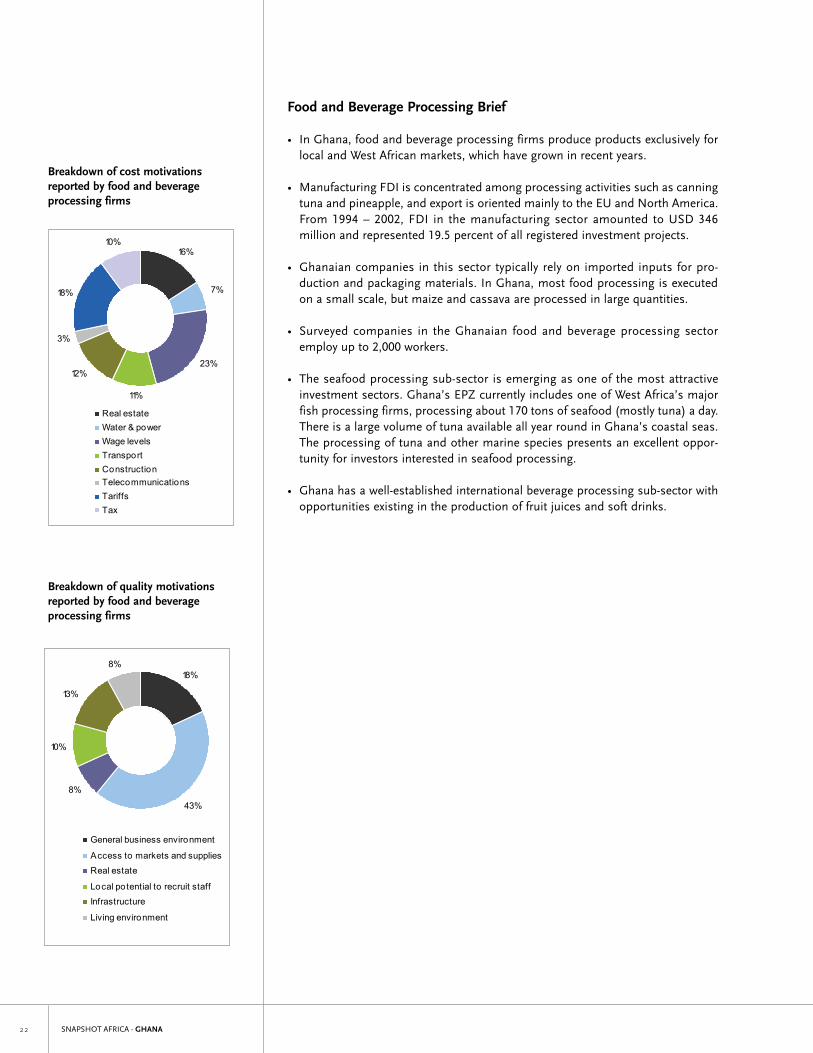
Breakdown of cost motivations reported by food and beverage processing firms
Breakdown of quality motivations reported by food and beverage processing firms
10%
18%
3%
12%
11%
23%
7%
16%
Real estateWater & powerWage levelsTransportConstructionTelecommunicationsTariffsTax
Figure 8: Breakdown of cost motivations reported by horticulture firms
20%
6%
26%14%
8%
3%
16%
7%
Real estateWater & powerWage levelsTransportConstructionTelecommunicationsTariffsTax
Figure 9: Breakdown of quality motivations reported by horticulture firms
18%
31%
14%
13%
16%
8%
General business environment
Access to markets and suppliesReal estate
Local potential to recruit staffInfrastructure
Living environment
Figure 10: Breakdown of cost motivations reported by food and beverage processing firms
16%
7%
23%
11%
12%
3%
18%
10%
Real estateWater & powerWage levelsTransportConstructionTelecommunicationsTariffsTax
Figure 11: Breakdown of quality motivations reported by food and beverage processing firms
18%
43%
8%
10%
13%
8%
General business environment
Access to markets and supplies
Real estate
Local potential to recruit staff
Infrastructure
Living environment
SNAPSHOT AFRICA - GHANA ��
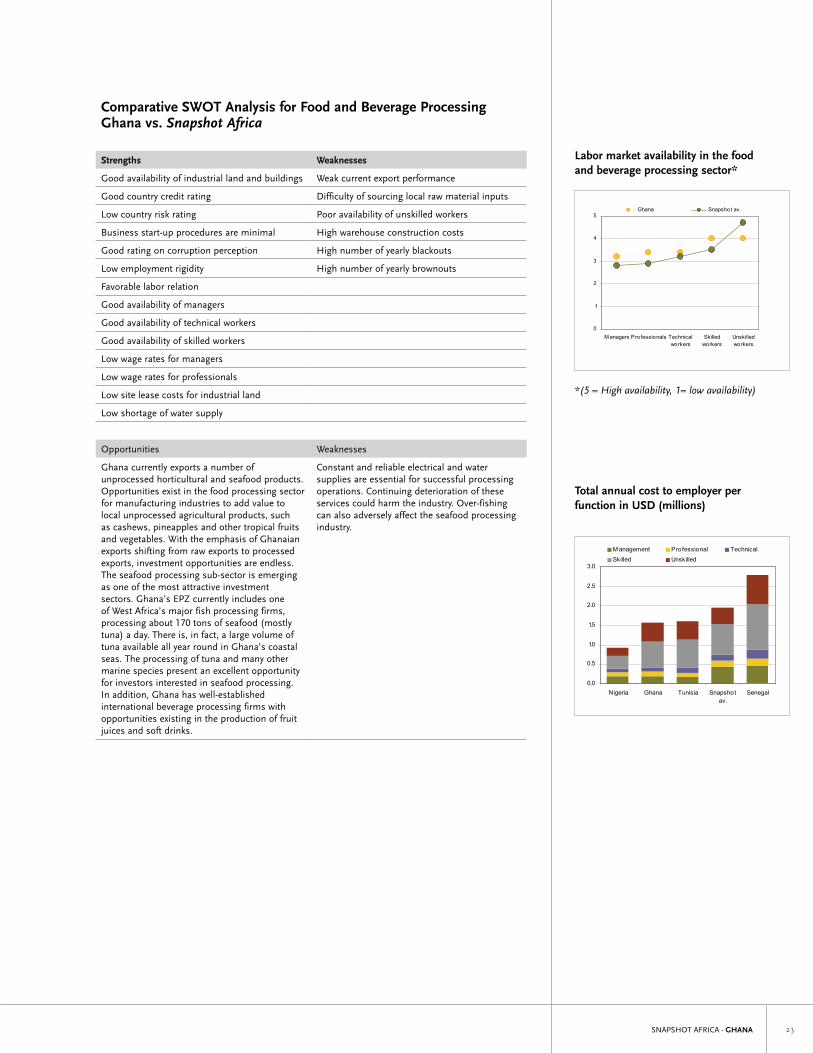
Labor market availability in the food and beverage processing sector*
0
1
2
3
4
5
M anagers Professionals Technicalworkers
Skilledworkers
Unskilledworkers
Ghana Snapshot av.
*(5 = High availability, 1= low availability)
Total annual cost to employer per function in USD (millions)
0.0
0.5
1.0
1.5
2.0
2.5
3.0
Nigeria Ghana Tunisia Snapshotav.
Senegal
M anagement Professional TechnicalSkilled Unskilled
Labor market availability in the food and beverage processing sector*
Labor market availability in the food and beverage processing sector*
0
1
2
3
4
5
M anagers Professionals Technicalworkers
Skilledworkers
Unskilledworkers
Ghana Snapshot av.
*(5 = High availability, 1= low availability)
Total annual cost to employer per function in USD (millions)
0.0
0.5
1.0
1.5
2.0
2.5
3.0
Nigeria Ghana Tunisia Snapshotav.
Senegal
M anagement Professional TechnicalSkilled Unskilled
Total annual cost to employer per function in USD (millions)
*(5 = High availability, 1= low availability)
Comparative SWOT Analysis for Food and Beverage Processing Ghana vs. Snapshot Africa
Strengths Weaknesses
Good availability of industrial land and buildings Weak current export performance
Good country credit rating Difficulty of sourcing local raw material inputs
low country risk rating Poor availability of unskilled workers
Business start-up procedures are minimal High warehouse construction costs
Good rating on corruption perception High number of yearly blackouts
low employment rigidity High number of yearly brownouts
Favorable labor relation
Good availability of managers
Good availability of technical workers
Good availability of skilled workers
low wage rates for managers
low wage rates for professionals
low site lease costs for industrial land
low shortage of water supply
Opportunities Weaknesses
Ghana currently exports a number of unprocessed horticultural and seafood products. Opportunities exist in the food processing sector for manufacturing industries to add value to local unprocessed agricultural products, such as cashews, pineapples and other tropical fruits and vegetables. With the emphasis of Ghanaian exports shifting from raw exports to processed exports, investment opportunities are endless. The seafood processing sub-sector is emerging as one of the most attractive investment sectors. Ghana’s EPZ currently includes one of West Africa’s major fish processing firms, processing about 170 tons of seafood (mostly tuna) a day. There is, in fact, a large volume of tuna available all year round in Ghana’s coastal seas. The processing of tuna and many other marine species present an excellent opportunity for investors interested in seafood processing. In addition, Ghana has well-established international beverage processing firms with opportunities existing in the production of fruit juices and soft drinks.
Constant and reliable electrical and water supplies are essential for successful processing operations. Continuing deterioration of these services could harm the industry. Over-fishing can also adversely affect the seafood processing industry.

SNAPSHOT AFRICA - GHANA��
SNAPSHOT AFRICA - GHANA ��
Shared Services (Call Centers) Sector
Call center operation is a segment within the outsourcing trend. Outsourcing occurs when one company delegates responsibility for performing a function or series of tasks to another company. Outsourcing services span a wide range – from call center functions (outbound tele-marketing campaigns, data-cleaning, surveys, help desks, inbound services) to business process functions such as fulfilling financial, insurance, healthcare, human resource, tax compliance functions, data conversion, and IT services. In sub-Saharan Africa, where the sector is still nascent, outsourcing is almost exclusively in call center operation, with the exception of South Africa. Offshore outsourcing now represents a USD 100 billion market that is growing at more than 30 percent per annum. The majority of current demand for offshore outsourcing services comes from developed countries: the United States and Canada (15.9 percent) and Western Europe (44.8 percent). The primary countries exporting services to satisfy this demand include Ireland, India, and Canada. In sub-Saharan Africa, South Africa and Mauritius are the only countries that have begun to emerge on the radar screen of investors, but their estimated market size is still miniscule compared to competitors around the world.
Behind the rapid growth in offshore outsourcing are the improved quality and lower costs of telecommunications and Internet infrastructure. The development of the industry has led to an increased general knowledge and experience in offshore out-sourcing. This means there is now less risk associated with including offshore out-sourcing in the evaluation and implementation process of a company’s business plan. As a consequence, there is international competitive pressure to include offshore outsourcing as a component of overall business strategy to reduce cost and/or to increase productivity.
The factors making a foreign country an attractive base for offshore outsourcing services, according to an index developed by A.T. Kearney, are the following: financial structure, people skills and availability, and business environment. The market growth of offshore outsourcing does not necessarily lead to higher levels of FDI in the industry, as the relationship between offshore outsourcing service providers and their clients is generally contractual. Nevertheless, there is plenty of opportunity for FDI growth.
Trends in offshore outsourcing indicate a promising future. As with any maturing market, offshore outsourcing moves up the value chain, reflecting increased levels of provider competence and confidence among their customers. Customers will multi-source from more than one provider (and country), depending upon type of services required, costs and risks. Due to increased competition and risk man-agement, providers extend their services offerings (e.g., call-center services extend to back-office services) and offer new value-added services. Mature offshore markets then outsource to new, lower cost countries or locations within the same country. Higher value outsourcing services (IT and financial) migrate to those countries with greater protection of intellectual property and privacy. Increased demand and competition for offshore outsourcing services is likely to lead to rising labor costs, resulting in decreased service levels and the tendency to move offshore to lower cost countries.
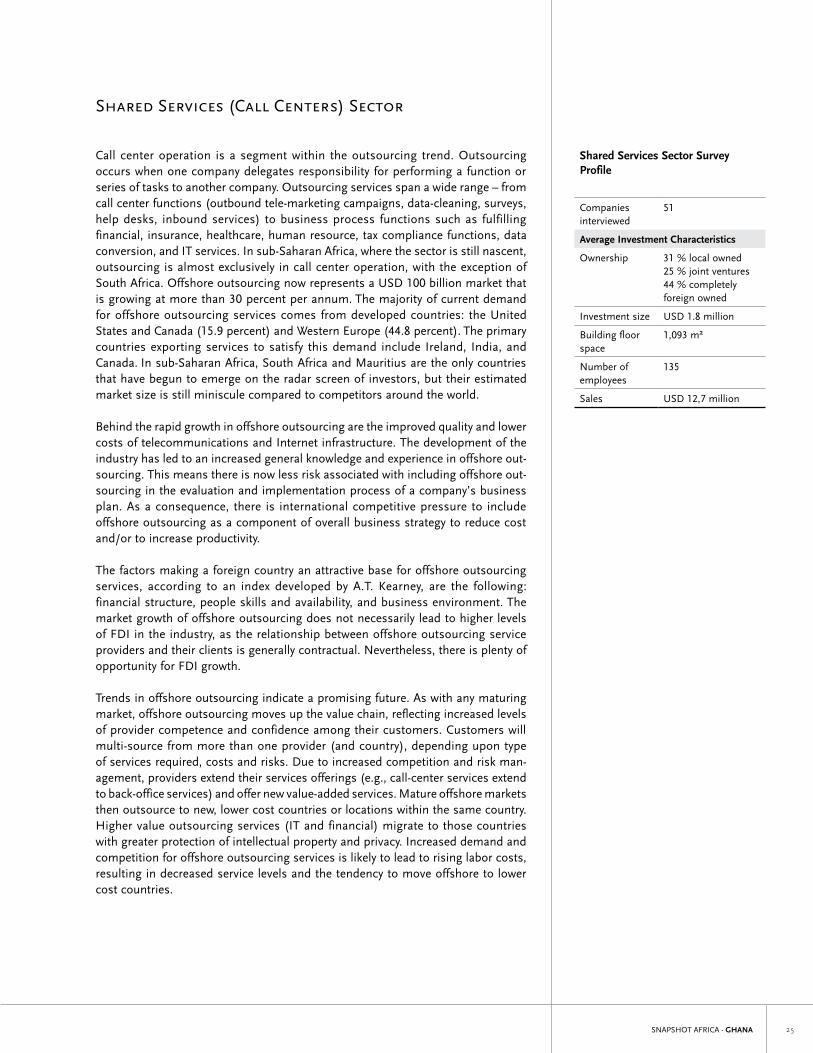
Shared Services Sector Survey Profile
Companies interviewed
51
Average Investment Characteristics
Ownership 31 % local owned25 % joint ventures44 % completely foreign owned
Investment size USD 1.8 million
Building floor space
1,093 m²
Number of employees
135
Sales USD 12,7 million
SNAPSHOT AFRICA - GHANA��
Shared Services (Call Centers) Brief
• The call centers sector is an emerging sector that shows strong potential. The sector’s development has been compared to Bangalore prior to its emergence as a leader in the call center industry.
• Almost all capital goods for shared services operations, such as computer ter-minals, network routers and servers, and telephone-switching devices must be imported.
• Ghanaian shared services firms primarily serve the local market, but some have recently expanded to serve US clients.
• Shared service firms in Ghana employ between 16 and 150 workers, with third party call centers having higher employment than data processing operations.
• There are a number of institutions offering training in different aspects of shared services. Investment expansion in this sector can therefore rely on a steady stream of young professionals prepared to serve English-speaking countries in North America, Europe and elsewhere.
• Since 2001, the Government has made impressive progress in improving and expanding access to telecommunications in both rural and urban areas.
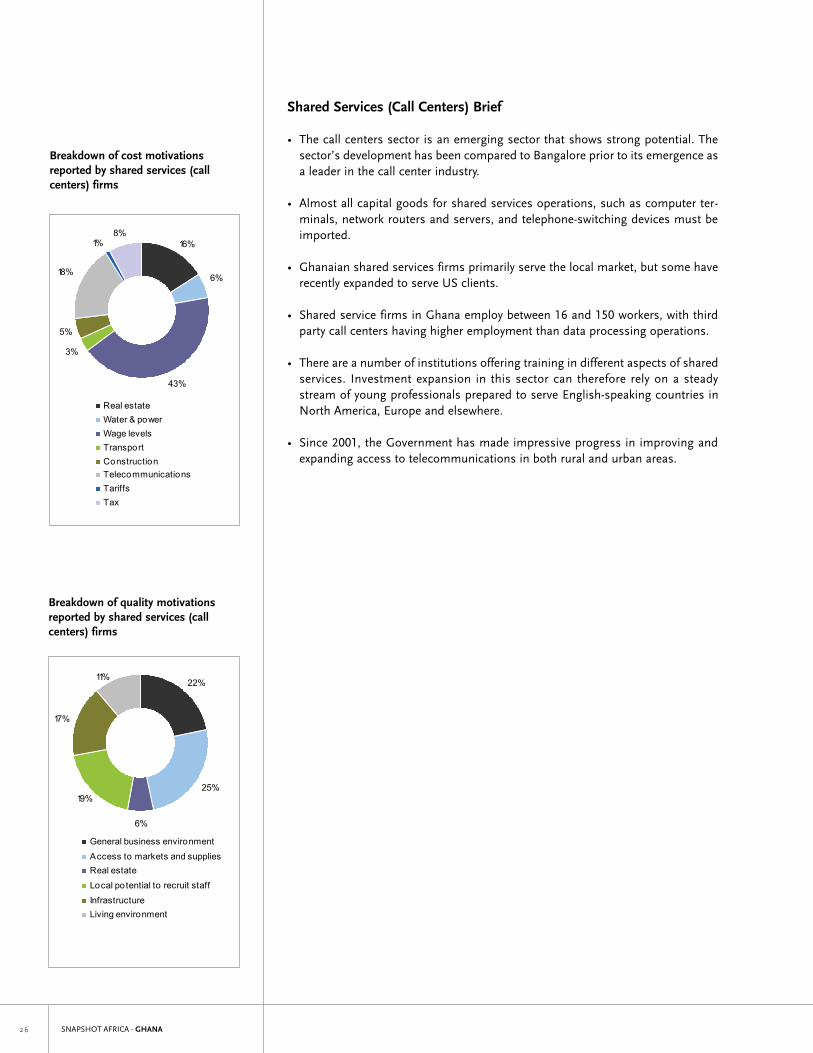
Breakdown of cost motivations reported by shared services (call centers) firms
Breakdown of quality motivations reported by shared services (call centers) firms
Figure 12: Breakdown of cost motivations reported by shared services (call centers) firms
16%
6%
43%
3%
5%
18%
1%8%
Real estateWater & powerWage levelsTransportConstructionTelecommunicationsTariffsTax
Figure 13: Breakdown of quality motivations reported by shared services (call centers) firms
22%
25%
6%
19%
17%
11%
General business environment
Access to markets and suppliesReal estate
Local potential to recruit staff
InfrastructureLiving environment
Figure 14: Breakdown of cost motivations reported by Tourism (Hotels) firms
41%
3%29%
1%
16%
3%1% 6%
Real estateWater & powerWage levelsTransportConstructionTelecommunicationsTariffsTax
Figure 15: Breakdown of quality motivations reported by Tourism (Hotels) firms
11%
7%
15%
14% 21%
32%
General business environment
Access to markets and suppliesReal estate
Local potential to recruit staffInfrastructure
Living environment
SNAPSHOT AFRICA - GHANA ��
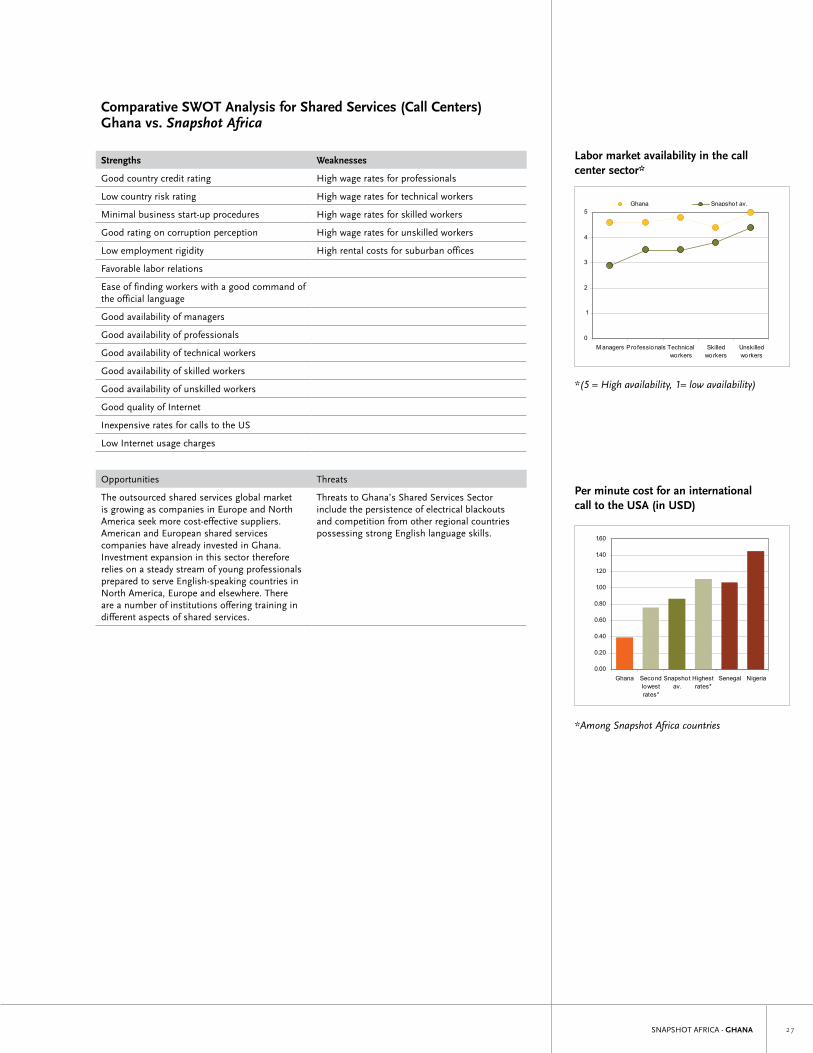
Labor market availability in the call center sector*
0
1
2
3
4
5
M anagers Professionals Technicalworkers
Skilledworkers
Unskilledworkers
Ghana Snapshot av.
*(5 = High availability, 1= low availability)
Per minute cost for an international call to the USA per minute (in USD)
0.00
0.20
0.40
0.60
0.80
1.00
1.20
1.40
1.60
*Among Snapshot Africa countries
Labor market availability in the call center sector*
Changes to Graph
GHANA
Pg. 27. Per minute cost for an international call to the USA in USD
0.00
0.20
0.40
0.60
0.80
1.00
1.20
1.40
1.60
Ghana Secondlowestrates*
Snapshotav.
Highestrates*
Senegal Nigeria
Madagascar
Pg. 31: Hotel construction costs in USD per square meter
0
200
400
600
800
1,000
1,200
1,400
1,600
1,800
M adagascar M ozambique Tunisia Tanzania Snapshot av. Kenya M auritius
Per minute cost for an international call to the USA (in USD)
*(5 = High availability, 1= low availability)
*Among Snapshot Africa countries
Comparative SWOT Analysis for Shared Services (Call Centers) Ghana vs. Snapshot Africa
Strengths Weaknesses
Good country credit rating High wage rates for professionals
low country risk rating High wage rates for technical workers
Minimal business start-up procedures High wage rates for skilled workers
Good rating on corruption perception High wage rates for unskilled workers
low employment rigidity High rental costs for suburban offices
Favorable labor relations
Ease of finding workers with a good command of the official language
Good availability of managers
Good availability of professionals
Good availability of technical workers
Good availability of skilled workers
Good availability of unskilled workers
Good quality of Internet
Inexpensive rates for calls to the US
low Internet usage charges
Opportunities Threats
The outsourced shared services global market is growing as companies in Europe and North America seek more cost-effective suppliers. American and European shared services companies have already invested in Ghana. Investment expansion in this sector therefore relies on a steady stream of young professionals prepared to serve English-speaking countries in North America, Europe and elsewhere. There are a number of institutions offering training in different aspects of shared services.
Threats to Ghana’s Shared Services Sector include the persistence of electrical blackouts and competition from other regional countries possessing strong English language skills.

SNAPSHOT AFRICA - GHANA��
SNAPSHOT AFRICA - GHANA ��
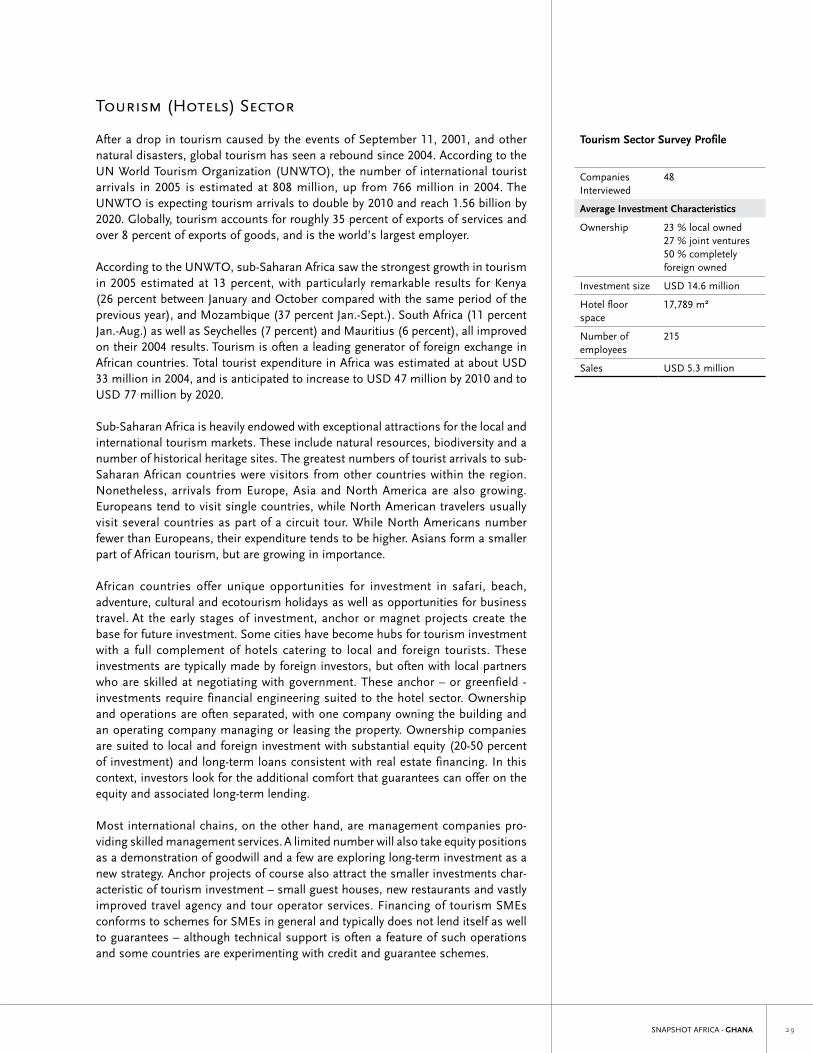
Tourism Sector Survey Profile
Companies Interviewed
48
Average Investment Characteristics
Ownership 23 % local owned27 % joint ventures50 % completely foreign owned
Investment size USD 14.6 million
Hotel floor space
17,789 m²
Number of employees
215
Sales USD 5.3 million
Tourism (Hotels) Sector
After a drop in tourism caused by the events of September 11, 2001, and other natural disasters, global tourism has seen a rebound since 2004. According to the UN World Tourism Organization (UNWTO), the number of international tourist arrivals in 2005 is estimated at 808 million, up from 766 million in 2004. The UNWTO is expecting tourism arrivals to double by 2010 and reach 1.56 billion by 2020. Globally, tourism accounts for roughly 35 percent of exports of services and over 8 percent of exports of goods, and is the world’s largest employer.
According to the UNWTO, sub-Saharan Africa saw the strongest growth in tourism in 2005 estimated at 13 percent, with particularly remarkable results for Kenya (26 percent between January and October compared with the same period of the previous year), and Mozambique (37 percent Jan.-Sept.). South Africa (11 percent Jan.-Aug.) as well as Seychelles (7 percent) and Mauritius (6 percent), all improved on their 2004 results. Tourism is often a leading generator of foreign exchange in African countries. Total tourist expenditure in Africa was estimated at about USD 33 million in 2004, and is anticipated to increase to USD 47 million by 2010 and to USD 77 million by 2020.
Sub-Saharan Africa is heavily endowed with exceptional attractions for the local and international tourism markets. These include natural resources, biodiversity and a number of historical heritage sites. The greatest numbers of tourist arrivals to sub-Saharan African countries were visitors from other countries within the region. Nonetheless, arrivals from Europe, Asia and North America are also growing. Europeans tend to visit single countries, while North American travelers usually visit several countries as part of a circuit tour. While North Americans number fewer than Europeans, their expenditure tends to be higher. Asians form a smaller part of African tourism, but are growing in importance.
African countries offer unique opportunities for investment in safari, beach, adventure, cultural and ecotourism holidays as well as opportunities for business travel. At the early stages of investment, anchor or magnet projects create the base for future investment. Some cities have become hubs for tourism investment with a full complement of hotels catering to local and foreign tourists. These investments are typically made by foreign investors, but often with local partners who are skilled at negotiating with government. These anchor – or greenfield - investments require financial engineering suited to the hotel sector. Ownership and operations are often separated, with one company owning the building and an operating company managing or leasing the property. Ownership companies are suited to local and foreign investment with substantial equity (20-50 percent of investment) and long-term loans consistent with real estate financing. In this context, investors look for the additional comfort that guarantees can offer on the equity and associated long-term lending.
Most international chains, on the other hand, are management companies pro-viding skilled management services. A limited number will also take equity positions as a demonstration of goodwill and a few are exploring long-term investment as a new strategy. Anchor projects of course also attract the smaller investments char-acteristic of tourism investment – small guest houses, new restaurants and vastly improved travel agency and tour operator services. Financing of tourism SMEs conforms to schemes for SMEs in general and typically does not lend itself as well to guarantees – although technical support is often a feature of such operations and some countries are experimenting with credit and guarantee schemes.
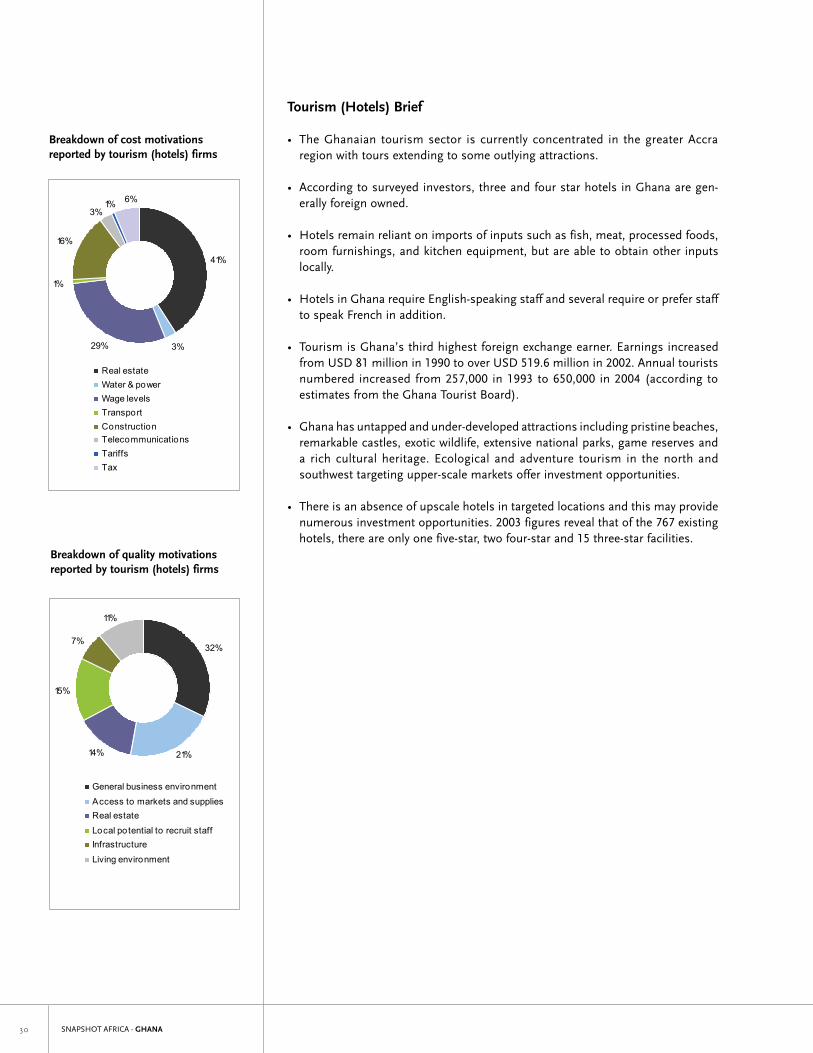
SNAPSHOT AFRICA - GHANA�0
Tourism (Hotels) Brief
• The Ghanaian tourism sector is currently concentrated in the greater Accra region with tours extending to some outlying attractions.
• According to surveyed investors, three and four star hotels in Ghana are gen-erally foreign owned.
• Hotels remain reliant on imports of inputs such as fish, meat, processed foods, room furnishings, and kitchen equipment, but are able to obtain other inputs locally.
• Hotels in Ghana require English-speaking staff and several require or prefer staff to speak French in addition.
• Tourism is Ghana’s third highest foreign exchange earner. Earnings increased from USD 81 million in 1990 to over USD 519.6 million in 2002. Annual tourists numbered increased from 257,000 in 1993 to 650,000 in 2004 (according to estimates from the Ghana Tourist Board).
• Ghana has untapped and under-developed attractions including pristine beaches, remarkable castles, exotic wildlife, extensive national parks, game reserves and a rich cultural heritage. Ecological and adventure tourism in the north and southwest targeting upper-scale markets offer investment opportunities.
• There is an absence of upscale hotels in targeted locations and this may provide numerous investment opportunities. 2003 figures reveal that of the 767 existing hotels, there are only one five-star, two four-star and 15 three-star facilities.
Breakdown of cost motivations reported by tourism (hotels) firms
Breakdown of quality motivations reported by tourism (hotels) firms
Figure 12: Breakdown of cost motivations reported by shared services (call centers) firms
16%
6%
43%
3%
5%
18%
1%8%
Real estateWater & powerWage levelsTransportConstructionTelecommunicationsTariffsTax
Figure 13: Breakdown of quality motivations reported by shared services (call centers) firms
22%
25%
6%
19%
17%
11%
General business environment
Access to markets and suppliesReal estate
Local potential to recruit staff
InfrastructureLiving environment
Figure 14: Breakdown of cost motivations reported by Tourism (Hotels) firms
41%
3%29%
1%
16%
3%1% 6%
Real estateWater & powerWage levelsTransportConstructionTelecommunicationsTariffsTax
Figure 15: Breakdown of quality motivations reported by Tourism (Hotels) firms
11%
7%
15%
14% 21%
32%
General business environment
Access to markets and suppliesReal estate
Local potential to recruit staffInfrastructure
Living environment
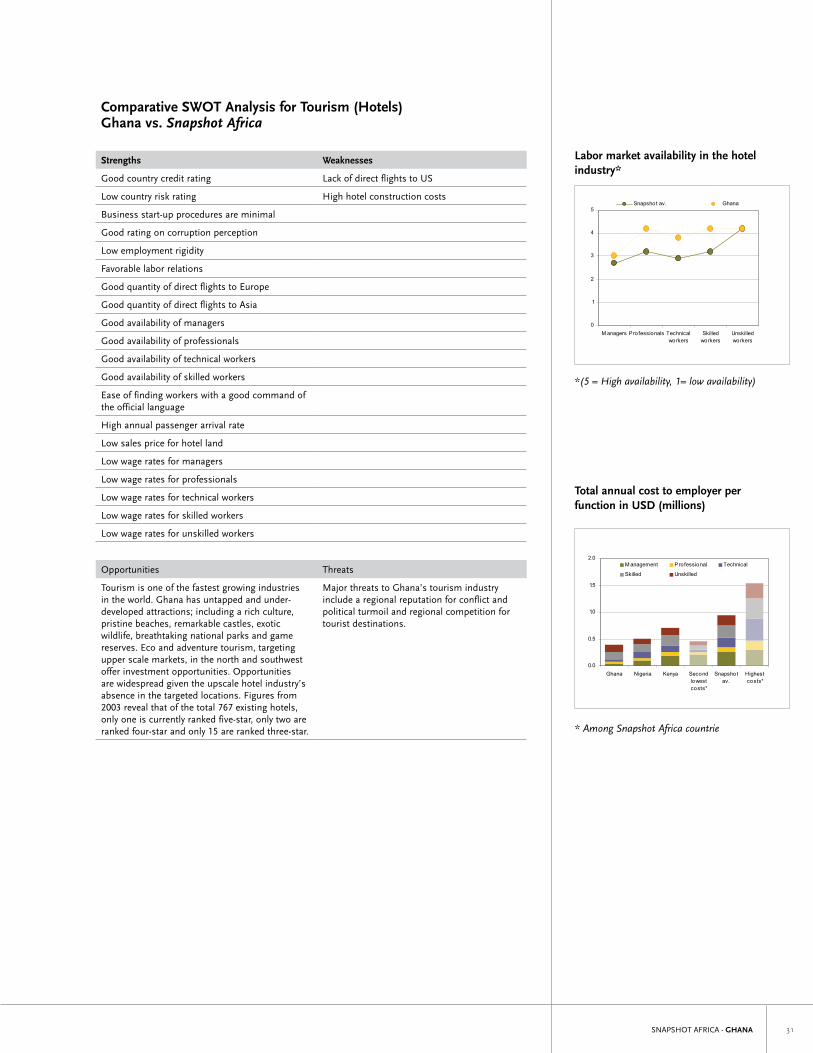
SNAPSHOT AFRICA - GHANA ��
Labor market availability in the hotel industry*
0
1
2
3
4
5
M anagers Professionals Technicalworkers
Skilledworkers
Unskilledworkers
Snapshot av. Ghana
*(5 = High availability, 1= low availability)
Total annual cost to employer per function in USD (millions)
0.0
0.5
1.0
1.5
2.0
Ghana Nigeria Kenya Secondlowestcosts*
Snapshotav.
Highestcosts*
M anagement Professional Technical
Skilled Unskilled
*Among Snapshot Africa countries
Labor market availability in the hotel industry*
Labor market availability in the hotel industry*
0
1
2
3
4
5
M anagers Professionals Technicalworkers
Skilledworkers
Unskilledworkers
Snapshot av. Ghana
*(5 = High availability, 1= low availability)
Total annual cost to employer per function in USD (millions)
0.0
0.5
1.0
1.5
2.0
Ghana Nigeria Kenya Secondlowestcosts*
Snapshotav.
Highestcosts*
M anagement Professional Technical
Skilled Unskilled
*Among Snapshot Africa countries
Total annual cost to employer per function in USD (millions)
*(5 = High availability, 1= low availability)
* Among Snapshot Africa countrie
Comparative SWOT Analysis for Tourism (Hotels) Ghana vs. Snapshot Africa
Strengths Weaknesses
Good country credit rating lack of direct flights to US
low country risk rating High hotel construction costs
Business start-up procedures are minimal
Good rating on corruption perception
low employment rigidity
Favorable labor relations
Good quantity of direct flights to Europe
Good quantity of direct flights to Asia
Good availability of managers
Good availability of professionals
Good availability of technical workers
Good availability of skilled workers
Ease of finding workers with a good command of the official language
High annual passenger arrival rate
low sales price for hotel land
low wage rates for managers
low wage rates for professionals
low wage rates for technical workers
low wage rates for skilled workers
low wage rates for unskilled workers
Opportunities Threats
Tourism is one of the fastest growing industries in the world. Ghana has untapped and under-developed attractions; including a rich culture, pristine beaches, remarkable castles, exotic wildlife, breathtaking national parks and game reserves. Eco and adventure tourism, targeting upper scale markets, in the north and southwest offer investment opportunities. Opportunities are widespread given the upscale hotel industry’s absence in the targeted locations. Figures from 2003 reveal that of the total 767 existing hotels, only one is currently ranked five-star, only two are ranked four-star and only 15 are ranked three-star.
Major threats to Ghana’s tourism industry include a regional reputation for conflict and political turmoil and regional competition for tourist destinations.

SNAPSHOT AFRICA - GHANA��
SNAPSHOT AFRICA - GHANA ��
Appendices
I. Acronyms and AbbreviationsII. Data Definitions and SourcesIII. Tables and FindingsIV. The Ghana Investment Promotion Centre
SNAPSHOT AFRICA - GHANA��
Appendix I. Acronyms and Abbreviations
AGOA American Growth and Opportunity Act
API-Mali Agence de Promotion des Investissement Mali
APIX Agence de Promotion des Investissements et des Grands Travaux
ATC Agreement on Textiles and Clothing av. AverageCFA West African FrancCIS Community of Independent StatesCITES Convention on International Trade in
Endangered Species of Wild Fauna and Flora
COMESA Common Market for Eastern and Southern Africa
CPI Centro de Promoção de Investimentos Mozambique
CTI Computer Telephony IntegrationDTIS Diagnostic Trade Integration StudyEAC East African CommunityEASSy Eastern Africa Submarine Cable
SystemEBA Everything But ArmsEBP Enterprise Benchmarking ProgramECOWAS Economic Community of West
African StatesEIU Economist Intelligence UnitEPZ Export Processing ZoneEU European UnionEUREPGAP Global Partnership for Safe and
Sustainable AgricultureFAO Food and Agriculture OrganizationFAOSTAT Food and Agriculture Organization
Statistical DatabaseFDI Foreign Direct InvestmentFEE Free Export EnterpriseGDP gross domestic productGIPC Ghana Investment Promotion CenterGUIDE Guichet Unique des Investissements
et de Développement des EntreprisesHa HectareHACCP Hazard Analysis and Critical Control
PointsICT Information and Communications
TechnologyIFC International Finance CenterIFZ Industrial Free ZoneIPA Investment Promotion AgencyIPC Investment Promotion Center
IPI Investment Promotion Intermediary IPZ Industrial Processing ZonesISP Internet Service ProviderIT Information TechnologyJV joint-ventureKIA Kenya Investment AuthoritykVA Kilovolt-amperekWh Kilo-Watts hourlNDC lesotho National Development
CorporationMFA Multi-Fiber Arrangement MIGA Multilateral Investment Guarantee
AgencyMNC multi-national corporation MUB Manufacturing Under BondNDC National Development CouncilOECD Organization for Economic Co-
operation and DevelopmentPABX Private Automatic Branch ExchangePAD Port autonome de DakarPATI Priority Areas for Tourism InvestmentPPP Purchasing Power Parity SACU Southern African Customs UnionSADC Southern African Development
CommunitySEZ Special Economic ZonesSME small and medium-sized enterprisesSWOT Strength, Weakness, Opportunities
and ThreatsTFCA Trans-frontiers Conservation AreasTIC Tanzania Investment CenterUAE United Arab EmiratesUEMOA Union Economique et Monétaire
Ouest AfricaineUIA Uganda Investment Authority UK United KingdomUNCTAD United Nations Conference on Trade
and DevelopmentUNIDO United Nations Industrial
Development OrganizationUNWTO United Nations World Tourism
OrganizationUSA United States of AmericaUSAID United States Agency for International
DevelopmentUSD United States DollarUHT Ultra High TemperatureVAT value added taxVoIP Voice-over Internet ProtocolWTO World Trade Organization
SNAPSHOT AFRICA - GHANA ��
Appendix II: Data Definitions and Sources
4. Customs Clearance Source: Company interviews
Interviewed company managers were asked how long it normally takes for imported inputs to clear customs based on the expe-rience of their firms.
Intellectual Property Rights Protection
Source: Global Competitiveness Report 2004 – 2005, World Economic Forum Data are based on a survey of intellectual property rights by the
World Economic Forum.
Corporate Taxation (Refer to Table 2)
Corporate Tax Rate Source: Price Waterhouse Coopers Tax Guide and/or
local tax authorities• Ghana - Ghana Internal Revenue Service • Kenya - Kenya Revenue Authority, Price Waterhouse Coopers Tax
Guide and/or local tax authorities• lesotho - lesotho National Development Corporation (lNDC) • Madagascar - Price Waterhouse Coopers Tax Guide and/or local
tax authorities• Mali - Maître Cheickne Touré ACGE Tax Adviser• Mozambique - 3rd supplement to BR No. 30 (2002), www.forum-
turafrica.org• Senegal - Price Waterhouse Coopers Tax Guide and/or local tax
authorities • Tanzania - Price Waterhouse Cooper Tax Datacard• Uganda - Uganda Revenue Authority Data on the highest corporate tax rate in each country were col-
lected and entered in the Enterprise Benchmarking Model
Sales Tax Rate Source: Price Waterhouse Coopers Tax Guide and/or
local tax authorities• Ghana - Ghana VAT Service• Kenya - Kenya Revenue Authority • lesotho - lesotho National Development Corporation (lNDC) • Madagascar - Price Waterhouse Coopers Tax Guide and/or local
tax authorities• Mali - Maître Cheickne Touré ACGE Tax Adviser• Mozambique - law No. 3 (1998), BR No. 1, www.forumturafrica.
org• Senegal - Price Waterhouse Coopers Tax Guide and/or local tax
authorities • Tanzania - Price Waterhouse Cooper Tax Datacard• Uganda - Uganda Revenue AuthorityData on sales tax or VAT were entered in the benchmarking model.
This appendix provides detail on quantitative and quali-tative data collected for this study, both through desktop research and fieldwork, and the sources used.
General Business Environment (Refer to Table 1)
Economic, Financial, and Political Stability1. Country Credit Rating Source: Institutional Investors
This Index is based on a biannual survey of leading commercial banks, and captures risk perceptions of the main commercial lenders. The Index is widely referenced in International Finance Corporation/World Bank Group publications.
2. Country Risk Rating Source: Euromoney
The data are taken from Euromoney’s semiannual rating of the political and economic performances of 185 sovereign countries. To obtain the overall country risk score, Euromoney assigns a weighting to nine categories: political risk (25 percent), economic performance (25 percent), debt indicators (10 percent), debt in default or rescheduled (10 percent), credit ratings (10 percent), access to bank finance (5 percent), access to short-term finance (5 percent), access to capital markets (5 percent) and forfeiting (5 percent).
Doing Business and Bureaucracy1. Number of Procedures Required to Start a Business Source: Doing Business in 2005, World Bank
The Doing Business survey examines the start-up of com-mercial or industrial firms. It counts all procedures required to incorporate and register a firm. A ‘procedure’ is defined as any interaction of the company founder with external parties such as government agencies, lawyers, auditors and notaries.
2. Number of Days Normally Required to Start a Business
Source: Doing Business in 2005, World Bank The Doing Business survey examines the start-up of commercial
or industrial firms. It counts the number of days required to incor-porate and register a newly formed company. Time is recorded in calendar days.
3. Corruption Perception Index Source: Transparency International
This Index measures countries in terms of the degree to which corruption is perceived to exist among public officials and poli-ticians. The Index is the composite of corruption indices from independent sources. Countries are given an index score between 0 and 10, with a score of 10 indicating no perceived corruption and a score of 0 indicating extreme perceived corruption.
SNAPSHOT AFRICA - GHANA��
Property Tax Rate Source: Price Waterhouse Coopers Tax Guide and/ or local tax authorities
• Ghana - Director of Research, Ghana Internal Revenue Service• Kenya - Nairobi City Council • lesotho - lesotho Revenue Authority • Madagascar - Price Waterhouse Coopers Tax Guide and/or local
tax authorities• Mali - Maître Cheickne Touré ACGE Tax Adviser• Mozambique - Decree No. 50 (2000), Rro 51 (2000), taxchina.
org • Senegal - Price Waterhouse Coopers Tax Guide and/or local tax
authorities.• Tanzania - Implementing Tax Reform in Tanzania, by Roy Kelly
and Zanab Musunu• Uganda - Uganda Revenue Authority Data on property tax rates were entered in the model. In some
countries, property is taxed as a corporate profit based on the value of the property rental income. In those cases, the rental income of a property was assumed to be 10 percent of the property value and the property tax rate was entered as 10 percent of the corporate tax rate.
Access to Markets (Refer to Tables 3-7)
Export Competitiveness1. Current Export Performance Source: ITC Trade Performance Current Index,
International Trade Center The ITC Trade Performance Current Index measures the trade
performance of a sector in a variety of countries. The index covers 184 countries and 14 sectors. It provides a static view of a country’s recent export performance, ranked between 1 and 184. If a country did not show up in the index, it means that the country was not a big performer in trade in a particular industry. In those cases, a value of 185 was entered in the Enterprise Benchmarking Model. The ITC Index for textiles, processed foods, and fresh fruits were utilized in the model.
2. Change in Export Performance Source: ITC Trade Performance Change Index,
International Trade Center The ITC Trade Performance Change Index captures recent trends
of the change of a country’s export performance. The index ranks 184 countries in 14 sectors. If a country does not have a change ranking for a sector, it means that the country is not likely a large performer in trade in that particular industry. In those cases, a value of 185 was entered in the Enterprise Benchmarking Model. The ITC Index for textiles, processed foods, and fresh fruits were utilized in the model.
3. Average Tariff for Imported Inputs Source: Consolidated Trade Database, World Trade
Organization Data on the average import tariffs for textiles and electric
machinery were gathered and entered into the Enterprise Benchmarking Model. These data serve as indications as to the openness of a country to imports as well as the cost of importing needed capital inputs and intermediate goods for production.
Size of Domestic Market Source: Gross domestic product, World Development
Indicators, World Bank This datum takes each country’s gross domestic product as
a proxy for the size of the domestic market. Many firms, par-ticularly in the apparel and food processing sectors specifically chose their locations in order to serve the local markets in Mali and other sub-Saharan African countries.
Access to International Tourists1. Number of Weekly Direct Flights from Country Source: Airlines that serve each country
• Ghana - Ghana Civil Aviation Authority• Kenya - KQ Air, Air India, and Ethiopian Airlines• lesotho - International passenger flights to overseas markets are
not available• Madagascar - Air Madagascar• Mali - Regie Administrative de l’Activité, assistance (RAGAAE),
Monsieur Maïga, Chef d’escale Airport Service, Bamako• Mozambique - Mozambique Civil Aviation Authority• Senegal - Air Senegal, Air France, British Airways, lufthansa• Tanzania - British Airways, KlM, Swiss International, Emirates
Air, Oman Air, and Kenya Airways• Uganda - Civil Aviation Authority Data were collected on the number of weekly direct flights from
each country to the United States, Europe, and Asia. ‘Direct flight’ is defined as a flight given a single flight number that originates in the studied country and terminates or discharges passengers in the US, the EU or Asia. Direct flights are not necessarily non-stop, as long as passengers remain on the same aircraft.
2. Passenger Arrivals Source: World Tourism Organization93
Data on the number of annual arrivals of tourists were collected as an indication of the size of the current market for hotels and other tourist services in each country.
Real Estate Quality (Refer to Table 8)
Availability of Land Source: Company interviews
Firms were asked to recall the number of industrial, agricultural, hotel, or office sites within the country they considered during their initial investment decision. The greater the number of sites, the higher the quality score calculated by the Enterprise Benchmarking Model.
Availability of Agricultural Land Source: Availability of Arable Areas, Food and
Agriculture Production Yearbook, United Nations Food and Agriculture Organization This study utilized the FAO’s Annual survey of agricultural land.
The availability of arable land is gathered and noted in thousands of hectares for each surveyed country.
Vacancy Rate for Industrial Land and Buildings Source: Real estate agencies, free zones, and industrial
estates• Ghana - Ghana Investment Promotion Center• Kenya - CB Richard Ellis
SNAPSHOT AFRICA - GHANA ��
• lesotho - lesotho National Development Corporation (lNDC) • Madagascar - Financière d’Investessement Aro (FIARO)
Industries• Mali - Average of values provided by Agence des zones indus-
trials; Agence de cessions immobilières; and IFA Baco Agence immobilières
• Mozambique - Average of values provided by JHI Real Estate, Imovisa, and Jat
• Senegal – Source not available • Tanzania - Survey of vacancy rates in industrially zoned areas,
industrial estates, and free zones near Dar es Salaam• Uganda - Bageine & Company and Knight Frank The vacancy rates or percentage of available industrial land and
buildings, within 20 kilometers of the capital city was gathered and entered into the Enterprise Benchmarking Model.
Vacancy Rate for Office Space Source: Real estate agencies and office building man-
agement companies• Ghana - Ghana Investment Promotion Center• Kenya - CB Richard Ellis• lesotho - lesotho National Development Corporation (lNDC) • Madagascar - Financière d’Investessement Aro (FIARO)
Industries• Mali - Average of values provided by Agence des zones indus-
trials; Agence de cessions immobilières; and IFA Baco Agence immobilières
• Mozambique - Average of values provided by JHI Real Estate, Imovisa, and Jat
• Senegal – Source not available • Tanzania - Average vacancy rates reported by Waterfront,
Millennium Tower, PPF Towers, and JM Mall• Uganda - Bageine & Company and Knight Frank The vacancy rates, or percentage of available office space in
the center of the capital city, was gathered and entered into the Enterprise Benchmarking Model.
Real Estate Costs (Refer to Tables 9-10)
Cost of Land
1. Purchase Price of Industrial land Source: Real estate agencies, investment promotion
agencies, and free zones and industrial estates• Ghana - Ghana Investment Promotion Center• Kenya - The Property Gallery• lesotho - lesotho National Development Corporation (lNDC) • Madagascar - Financière d’Investessement Aro (FIARO)
Industries• Mali - Average of the prices quoted by the following: AZI Sa
Agence de zones industrials du Mali; ACI Agence de cessions immobilières; Architect/expertise AUE; Architect Coulibaly Concept AU; IFA Baco agence immobilières
• Mozambique - Mozambique Investment Promotion Center• Senegal - Pyramid Group• Tanzania - Ministry of land and Human Settlement• Uganda – Uganda Investment Authority (UIA) The cost of purchasing industrially zoned land or industrial estates
was researched and entered in the Enterprise Benchmarking Model as the cost per square meter. These data were verified in company interviews, when respondents were asked how much they paid for their sites. Where laws did not allow purchase of land, long-term leases were also considered as “purchases” for the purpose of this datum.
2. lease Price of Industrial land Source: Real estate agencies, investment promotion
agencies, and free zones and industrial estates.• Ghana - land Developers Company ltd.• Kenya - CB Richard Ellis• lesotho - lesotho National Development Corporation (lNDC) • Madagascar - Financière d’Investessement Aro (FIARO)
Industries• Mali - Average of the prices quoted by the following: AZI Sa
Agence de zones industrials du Mali; ACI Agence de cessions immobilières; Architect/expertise AUE; Architect Coulibaly Concept AU; and IFA Baco agence immobilières
• Mozambique - JHI Real Estate• Senegal - Pyramid Group• Tanzania - Ministry of land and Human Settlement
• Uganda - Uganda Investment Authority (UIA) The cost of a yearly lease for industrially zoned land or
industrial estate was researched and entered into the Enterprise Benchmarking Model.
3. Additional Industrial Site Occupancy Charges Source: Real estate agencies, investment promotion
agencies, and free zones and industrial estates.• Ghana - The Consultant PSI Properties• Kenya - CB Richard Ellis• lesotho - lesotho National Development Corporation (lNDC) • Madagascar - Financière d’Investessement Aro (FIARO)
Industries• Mali - Average of the prices quoted by the following: AZI Sa
Agence de zones industrials du Mali; ACI Agence de cessions immobilières; Architect/expertise AUE; Architect Coulibaly Concept AU; and IFA Baco agence immobilières
• Mozambique - Mozambique Investment Promotion Center• Senegal - Pyramid Group• Tanzania - Ministry of land and Human Settlement• Uganda - Uganda Investment Authority (UIA) In cases where industrial estates or free zones charge additional
maintenance fees or security charges, those data were entered into the model as additional costs per square meter.
4. Purchase Price of Tourist Hotel land Source: Real estate agencies and investment pro-
motion agencies• Ghana - land Bank Management Officer, Ghana Investment
Promotion Center• Kenya - The Property Gallery• lesotho - lesotho National Development Corporation (lNDC) • Madagascar - Financière d’Investessement Aro (FIARO)
Industries• Mali - Average of the prices quoted by the following: AZI Sa
Agence de zones industrials du Mali; ACI Agence de cessions immobilières; Architect/expertise AUE; Architect Coulibaly Concept AU; and IFA Baco agence immobilières
• Mozambique - Average of the prices quoted by Abrantina and JHI Real Estate
• Senegal - Pyramid Group• Tanzania - MyBeach real estate agency and the Ministry of Natural
Resources and Tourism• Uganda - Uganda Investment Authority (UIA) The purchase price of land in locations suitable for tourist devel-
opment - beaches, game parks, and city center - was researched and entered into the Enterprise Benchmarking model as the cost per square meter. Where laws do not allow purchase of land, long-term leases were also considered as “purchases”.
SNAPSHOT AFRICA - GHANA��
Cost of Office Space1. lease Price of Class A Office Space Source: Real estate agencies and office building man-
agement companies• Ghana - Ghana Investment Promotion Center• Kenya - The Property Gallery• lesotho - lesotho National Development Corporation (lNDC) • Madagascar - Financière d’Investessement Aro (FIARO)
Industries• Mali - Average of prices provided by SICG Habitat, Blal; Agence
de cessions immobilières; Architect Sidibe; and IFA Baco agence immobilières
• Mozambique - JHI Real Estate• Senegal - Pyramid Group• Tanzania - Average of prices provided by 50 Mirambo, PPF Tower,
and JM Mall• Uganda – Uganda Investment Authority (UIA) Class A office space is defined as offices in or near the center
of the capital city. These costs were entered in the model as the price per square meter for a one-year lease.
2. lease Price of Class B Office Space Source: Real estate agencies and office building man-
agement companies• Ghana - A&C Development Company • Kenya - The Property Gallery• lesotho - lesotho National Development Corporation (lNDC) • Madagascar - Financière d’Investessement Aro (FIARO)
Industries• Mali - Average of prices provided by SICG Habitat, Blal; Agence
de cessions immobilières; Architect Sidibe; and IFA Baco agence immobilières
• Mozambique - JHI Real Estate• Senegal - Pyramid Group• Tanzania - Average of prices provided Millennium Tower and
Water Front• Uganda – Uganda Investment Authority (UIA) Class B office space is defined as office buildings within 20 kilo-
meters outside the city center. These costs were entered in the model as the price per square meter for a one-year lease.
3. Additional Office Space Occupancy Charges Source: Real estate agencies and office building man-
agement companies• Ghana - Average of prices provided by A&C Development
Company and Ghana Investment Promotion Center• Kenya - The Property Gallery• lesotho - lesotho National Development Corporation (lNDC) • Madagascar - Financière d’Investessement Aro (FIARO)
Industries• Mali - Average of prices provided by SICG Habitat, Blal; Agence
de cessions immobilières; Architect Sidibe; and IFA Baco agence immobilières
• Mozambique - JHI Real Estate• Senegal - Pyramid Group• Tanzania - Average of prices provided by 50 Mirambo, PPF Tower,
JM Mall Millennium Tower, and Water Front• Uganda – Uganda Investment Authority (UIA) In cases where office buildings charge additional maintenance,
parking or security fees, those data were entered into the model as additional costs per square meter.
Construction Costs1. Cost of Warehouse Construction Source: Local engineering and construction com-
panies• Ghana - Business Development Manager, Taysec- A
TaylorWoodrow Company• Kenya - The Property Gallery• lesotho - lesotho National Development Corporation (lNDC) • Madagascar - Tectra SARl• Mali - Average of prices provided by SICG Habitat; Architect
Sidibe AUE; Architect Coulibaly Concept; and IFA Baco agence immobilières
• Mozambique - Average of the prices quoted by Abrantina and JHI Real Estate
• Senegal - Pyramid Group• Tanzania - Caspian Construction Company• Uganda - Uganda Investment Authority (UIA) The price of construction of a concrete block warehouse was
entered into the Enterprise Benchmarking Model as the cost per square meter of construction. Warehouse construction cost was also used as a proxy for the construction of a simple factory shell, since there is little actual difference in cost. This study did not investigate the cost of outfitting a factory with machinery.
2. Cost of Hotel Construction Source: Local engineering and construction com-
panies• Ghana - Property Manager, Ghana Investment Promotion Center• Kenya - The Property Gallery• lesotho - lesotho National Development Corporation (lNDC) • Madagascar - Tectra SARl• Mali - Average of prices provided by SICG Habitat; Architect
Sidibe AUE; Architect Coulibaly Concept; and IFA Baco agence immobilières
• Mozambique - Average of the prices quoted by Abrantina and JHI Real Estate
• Senegal - Pyramid Group• Tanzania - Caspian Construction Company• Uganda - Uganda Investment Authority (UIA) The construction price of a five-star quality hotel was entered
into the Enterprise Benchmarking Model as the cost per square meter of construction. This study did not investigate the cost of outfitting a hotel with furnishings and equipment.
Utility Costs (Refer to Table 11)
Cost of Telecommunications Source: Telecommunication companies
• Ghana - Ghana Telecom• Kenya - Telkom Kenya • lesotho - lesotho National Development Corporation (lNDC)
“Investing in lesotho”• Madagascar – Telma• Mali - Société des telecommunications du Mali (Sotelma)• Mozamibique - Mozambique Telecommunications• Senegal - Société National de Télécommunications de Senegal
(SONATEl)• Tanzania-Tanzania Telecommunications Co., ltd• Uganda-Uganda Telecom ltd and MTN Uganda ltd Data were gathered on the per minute cost of landline telephone
calls from the capital city of each country to the following locations:
1. Domestic call within the same country 2. Call to a neighboring country 3. Call to the United States
SNAPSHOT AFRICA - GHANA ��
Cost of High-Speed Internet1. Monthly High-Bandwidth Internet Charge Source: Internet service providers
• Ghana - Ghana Telecom• Kenya - JamboNet• lesotho - Telecom lesotho• Madagascar - Simicro and Blueline• Mali - IKATEl • Mozambique - TV Cabo• Sénégal - Société National de Télécommunications de Senegal
(SONATEl)• Tanzania - Benson Online• Uganda - Uganda Telecom ltd Data were gathered on the monthly charges for a 256-kbps
Internet connection.
2. Internet Usage Charges Source: Internet service providers
• Ghana - Ghana Telecom• Kenya - JamboNet• lesotho - Telecom lesotho lesotho - Telecom lesotho• Madagascar - Simicro and Blueline• Mali - IKATEl • Mozambique - TV Cabo• Senegal - Société National de Télécommunications de Senegal
(SONATEl)• Tanzania - Secretarial Services at Business Centers in Dar es
Salaam • Uganda - Uganda Telecom ltd Data were gathered on the per minute usage charges for high-
speed (256-kpbs) Internet, if any.
Cost of Power1. Electricity Capacity Demand Charges Source: Electricity utilities in each country
• Ghana - Electricity Company of Ghana• Kenya - Kenya Power and lighting Co.• lesotho - lesotho National Development Corporation (lNDC) • Madagascar - Jirama• Mali - Energie du Mali• Mozambique - Electricidade de Mocambique (ECM)• Senegal - Société Senegalaise d’Électricité (SENElEC)• Tanzania - Tanzania Electric Supply Company, ltd (TANESCO)• Uganda - Uganda Electricity Distribution Company, ltd (UEDCl) Data were collected on charges levied by power companies for
the maximum capacity of electricity demanded for low to medium voltage power, measured in kilowatts (KW) or in kilovolt amperes (KVA).
2. Electricity Usage Charges Source: Electricity utilities in each country
• Ghana - Electricity Company of Ghana• Kenya - Kenya Power and lighting Co.• lesotho - lesotho National Development Corporation (lNDC) • Madagascar - Jirama• Mali - Energie du Mali• Mozambique - Electricidade de Mocambique (ECM)• Senegal - Société Senegalaise d’Électricité (SENElEC)• Tanzania - Tanzania Electric Supply Company, ltd (TANESCO)• Uganda - Uganda Electricity Distribution Company, ltd (UEDCl) Data were collected on the charges per kilowatt-hour (kWh) for
industrial electricity usage during peak operating periods.
3. Cost of Power Generator Operation Source: Company interviews
Interviewees were asked whether or not their firms used their own power generators, how many hours the generators operated each month, and the cost of generator operation per hour. These data were used to calculate the overall cost of electricity for the average firm in each sector.
Cost of Water Source: Water utilities in each country
• Ghana - Ghana Water Company• Kenya - Nairobi Water Company• lesotho - Average rate from local utility companies• Madagascar - Jirama• Mali - Energie du Mali• Mozambique - Mozambique Investment Promotion Center• Senegal - Senegalaise des Eaux (SDE)• Tanzania- City Water• Uganda - National Water and Sewerage Company Data were collected on the charges per cubic meter for water
used for industrial and agricultural uses.
Cost of Gas1. Cost of Natural Gas (Methane) Source: Natural gas utilities, where available
Madagascar – No information available Tanzania - average of prices reported by Tanzania Breweries ltd,
Kioo Glass, TANESCO, and Twiga Cement The cost of methane gas was collected, measured in cubic
meters.
2. Cost of liquefied Petroleum Gas (Propane or Butane)
Source: LPG providers• Ghana- Tema Oil Refinery• Kenya - BOC Gases ltd• lesotho - lesotho National Development Corporation (lNDC) • Madagascar - Galana Distribution SA.• Mali - lPG providers• Mozambique - Average of prices provided by Globgas, Mocacor,
and Petrogas• Senegal - Société Africaine de Raffinage• Tanzania - lPG providers• Uganda - Shell, Caltex, Kobil The cost of propane or butane gas was collected, measured in
kilograms.
Transportation Costs (Refer to Tables 12-13)
1. Cost of Air Freight Source: Freight forwarders, airfreight companies, and
airlines• Ghana - McDan Shipping Co. ltd. and Aviance ltd• Kenya - SDV Transami• lesotho - Rates from South Africa were used, plus a 30 percent
increase to account for overland transportation• Madagascar - Air France, Air Mauritius, and Air Madagascar• Mali - Air France Freight Service• Mozambique - Manica Freight Services• Senegal - South African Airways Air Cargo Service• Tanzania - Malai Freight ltd, KlM Airlines, British Airways• Uganda - Emirates Airlines Sky Cargo, British Airways The cost of shipping a parcel of 45 kilograms or less by air was
calculated from the capital city of each country to the following destinations:
SNAPSHOT AFRICA - GHANA�0
Kennedy International Airport, New York City, USA (East Coast) los Angeles International Airport, los Angeles, USA (West
Coast) Schipol International Airport, Amsterdam, Holland Changi International Airport, Singapore New Tokyo International Airport, Narita, Japan Costs do not include the price of insurance, handling, or other
charges.
2. Cost of Sea Freight Source: Freight forwarders and sea freight com-
panies• Ghana - McDan Shipping Co. ltd.• Kenya - SDV Transami and Maersk Sealines, ltd. • lesotho - Rates quoted by Safmarine are for shipment from
South Africa including overland transportation• Madagascar - Scandinavian Eastern Africa line (SEAl),
Mediterranean Shipping Company (MSC), Compagnie Maritime d’Affrètement-Compagnie Générale Maritime (CMA-CGM), and SCAC
• Mali - Maersk lines and Groupe Ami GCM GMM• Mozambique - Manica Freight Services• Senegal - Maersk Senegal SDV• Tanzania - Maersk Sealines, ltd.• Uganda - SDV Transami, Maersk Sealines The costs of shipping a regular 40-foot container, a refrigerated
40-foot container, and bulk items per kilogram were calculated from the capital city of each country - including overland trans-portation to the nearest seaport - to the following locations:
Port of New York City, USA (East Coast) Port of long Beach, USA (West Coast) Port of Rotterdam, Holland Port of Singapore Port of Yokohama, Japan
Costs do not include insurance, handling charges, or other fees.
Labor Market Quality (Refer to Tables 14-19)
Potential to Recruit Local Staff1. Availability of Qualified Personnel Source: Company interviews
Companies rated their satisfaction in recruiting local staff for five categories of job positions - management, professional, technical, skilled, and unskilled workers. Satisfaction ratings were given on a scale of 1 to 5 according to the following criteria:
Score = 5: There are many qualified candidates. It is an employer’s market.
Score = 4: There is a large enough pool of qualified workers, and the company usually has no difficulty in hiring employees.
Score = 3: The company needs to search hard, but eventually finds the right personnel.
Score = 2: At least 50 percent of the time, the company can find the right personnel after a lengthy search.
Score = 1: It is impossible to find the right personnel.
2. Mastery of Required language Skills Source: Company interviews
Companies listed the languages they require employees to speak in the workplace. They rated the ease with which they actually found workers with satisfactory command of those languages. Satisfaction ratings were given on a scale of 1 to 5 according to the following criteria:
Score = 5: There are very many qualified candidates. It is an employer’s market.
Score = 4: There is a large enough pool of qualified workers, and the company usually has no difficulty in hiring employees.
Score = 3: The company needs to search hard, but eventually finds the right personnel.
Score = 2: At least 50 percent of the time, the company can find the right personnel after a lengthy search.
Score = 1: It is impossible to find the right personnel.
Flexibility of Labor Environment
1. Rigidity of Employment Source: Rigidity of Employment Index, Doing Business
in 2005, World Bank Data on the rigidity of employment was sourced directly from
the World Bank’s Doing Business in 2005 publication. The index measures how difficult it is to hire a new worker, how rigid the restrictions are on expanding or contracting the number of working hours, and how difficult and costly it is to dismiss a redundant worker. Specifically, the index is the average of three employment indices that evaluate the following:
1. Difficulty in Hiring: Allowance of term contracts for temporary tasks
Regulated minimum length of term contracts Ratio of mandated minimum wage to average value-added per
worker 2. Rigidity of Hours: Restrictions on night work Allowance of weekend work legal workweek of 5 ½ days or more Allowance for workday to extend to 12 hours or more Annual paid vacation of 21 days or less 3. Difficulty in Firing: Ability to fire workers on grounds of
redundancy Need to notify union for firing one worker Need to notify union for group dismissals Need for union approval for firing one redundant worker Need for union approval for dismissing a group of workers legal mandate for training or replacement of worker prior to dis-
missal Application of priority rules for dismissals Application of priority rules for reemployment
Scores are indexed on a scale of 0 to 100. The higher the value of the index score, the more rigid are labor regulations.
2. Average Weekly Working Hours Source: Company interviews
Firms were asked to indicate the average weekly working hours per employee. This often differed from the legally mandated workweek length, and varied by industry. The longer the workweek, the more attractive the working environment was considered for investors.
3. Social Climate Source: Cooperation in Labor-Employer Relations,
Global Competitiveness Report 2004 - 2005, World Economic Forum The World Economic Forum conducts an annual Executive
Opinion Survey of firms throughout the world. Entrepreneurs and business executives were asked to rate the labor-employer relations in their countries on a scale of 1 (“Generally confronta-tional”) to 7 (“Generally cooperative”).
SNAPSHOT AFRICA - GHANA ��
4. Degree of Unionization Source: Company interviews
Interviewed firms indicated the percentage of workers in their companies that belonged to labor unions. The Enterprise Benchmarking Model is programmed under the assumption that investors prefer low degrees of unionization to high union mem-bership.
5. labor Turnover Source: Company interviews
Companies were asked to indicate the annual average turnover among employees. ‘Annual turnover’ refers to the number of employees who resigned voluntarily in the past year, divided by the total number of employees. lower rates of turnover are con-sidered more preferable to investors than high turnover rates.
Access to Inputs and Outputs (Refer to Tables 20-25)
Availability of Raw Materials Source: Company interviews
Company managers were asked the percentage of raw materials they imported for use in their production. ‘Raw material’ refers to any input that has not yet undergone significant processing, such as raw cotton, timber, sugar, milk, steel ingot, etc. It is assumed that locations in which raw materials can be sourced locally are more attractive than those where raw materials must be imported.
Presence of Suppliers or Clusters Network1. Availability of Components Source: Company interviews
Company managers were asked the percentage of components they imported for production. ‘Component’ refers to any input that has undergone significant processing or transformation, such as yarn, fabric, precision molded plastic, engines, etc.) It is assumed that locations in which components can be sourced locally are more attractive to investors than those where com-ponents must be imported.
2. Availability of Capital Equipment or Chemicals Source: Company interviews
Company managers were asked to indicate the percentage of equipment and chemicals required for production that they import. ‘Equipment’ or ‘chemicals’ refer to all capital inputs like machinery, computers, telephones, fertilizers, hotel furnishings, etc.) It is assumed that locations in which capital equipment can be sourced locally are more attractive to investors than those where equipment must be imported.
Infrastructure Quality (Refer to Tables 26-31)
Freight Shipment by Air1. Punctuality of Air Shipments Source: Company interviews
Investors were asked the percentage of time that airfreight shipments reach their destinations on schedule. If airfreight transportation was not available, a response of ‘0’ was entered.
2. loss of Air Shipments Source: Company interviews
Investors were asked to indicate the percentage of airfreight shipments that become lost or never reach their destination. If airfreight transportation was not available, a response of ‘0’ was entered.
Freight Shipment by Train1. Punctuality of Rail Shipments Source: Company interviews
Investors were asked the percentage of time that rail freight shipments reach their destinations on schedule. If rail freight transportation was not available, a response of ‘0’ was entered.
2. loss of Rail Shipments Source: Company interviews
Investors were asked to indicate the percentage of rail freight shipments that become lost or never reached their destination. If rail freight transportation was not available, a response of ‘0’ was entered.
Freight Shipment by Sea1. Punctuality of Sea Shipments Source: Company interviews
Investors were asked the percentage of time that sea freight shipments reach their destinations on schedule. If sea freight transportation was not available, a response of ‘0’ was entered.
2. loss of Sea Shipments Source : Company interviews
Investors were asked to indicate the percentage of sea freight shipments that become lost or never reach their destination. If sea freight transportation was not available, a response of ‘0’ was entered.
Freight Shipment by Road1. Punctuality of Road Shipments Source: Company interviews
Investors were asked the percentage of time that road freight shipments reach their destinations on schedule. If road freight transportation was not available, a response of ‘0’ was entered.
2. loss of Road Shipments Source: Company interviews
Investors were asked to indicate the percentage of road freight shipments that become lost or never reach their destination. If road freight transportation was not available, a response of ‘0’ was entered.
Telecommunications1. Quality of Telephone Service Source: Company interviews
Companies were asked to rate the quality of landline telecom-munications on a scale of 1 to 5 corresponding to the following:
Score = 5: Connections are always clear. Calls are never dropped.
lines are never down Score = 4: Connection is usually clear. Calls are almost never
dropped. lines are almost never down. Score = 3: Connection is sometimes not clear. Some calls are
dropped. lines are sometimes down. Score = 2: Connection is sometimes not clear. There is a problem
SNAPSHOT AFRICA - GHANA��
with dropped calls. The line is often down. Score = 1: Connection is never clear. Calls are always dropped.
lines are often down, or no landline is available, and mobile tele-phones are necessary for communication.
2. length of Time to Install landline Telephone Service Source: Company interviews
Interviewed companies indicated the length of time it normally takes to install a new telephone landline.
IT Infrastructure1. Quality of Internet Service Source: Company interviews
Companies were asked to rate the quality of high bandwidth Internet (speed greater than 256 kbps) on a scale of 1 to 5, cor-responding to the following:
Score = 5: Internet is always operational. Internet service is never down or disconnected.
Score = 4: Internet service is usually operational. Service is almost never down or disconnected.
Score = 3: Internet service is sometimes not operational. Sometimes the service is dropped or not operational.
Score = 2: Internet service is sometimes not operational. There is a problem with frequent disconnections of service.
Score = 1: High-speed Internet connections are not available.
2. length of Time to Install Internet Service Source: Company interviews
Interviewed firms indicated the length of tome it normally takes to install Internet service in their locations.
Power Supply1. Number of Blackouts Source: Company interviews
Companies were asked the number of hours per month that they experienced a total loss of power without the use of back-up generators. Firms that were totally reliant on generator power were considered to be under permanent blackout conditions, and a value of 300 hours per month was entered in the Enterprise Benchmarking Model.
2. Number of Brownouts Source: Company interviews
Companies were asked to indicate the number of hours per month they experience reductions in voltage lower than the minimum voltage specified for the system, or upward spikes in the power supply.
Water Supply Source: Company interviews
Interviewed firms were asked to indicate the number of days per year they experience a shortage of water supply from the publicly supplied water provider. Companies that did not have access to municipal water supplies and were reliant on their own wells or private water delivery were considered to experience a permanent shortage of water. A value of 365 was entered in these cases, except for horticulture firms, which are typically in rural areas without expectation for municipal water supplies.
Waste Treatment Source: Company interviews
Interviewed companies rated the quality of the public waste treatment system on a scale of 1 to 5, as follows:
Score = 5: Public waste treatment facility provides first stage
(solid particle removal), second stage (aeration, organic matter killed), and third stage (removal of heavy metals and chemicals) biological and chemical treatment to the highest international standards. Tap water is chlorinated and potable.
Score = 4: Public waste treatment facility provides first, second stage, and third stage biological and chemical wastewater treatment, but tap water is not potable.
Score = 3: Public waste treatment facility provides first and second stage treatment only. Wastewater smells.
Score = 2: Public waste treatment facility provides first stage treatment only. Wastewater remains harmful to the envi-ronment.
Score = 1: Public wastewater treatment is not available. Raw sewage freely enters the environment, or company has its own treatment facility.
Quality of Living Conditions (Refer to Tables 32-37)
Cost of Living Source: Company interviews
Companies were asked to rate the cost of living in the investment location on a scale of 1 to 5. Responses differed depending on whether the interviewee was local or foreign.
Score = 5: Much less expensive than where company head-quarters is, or very inexpensive.
Score = 4: Slightly less expensive than where company head-quarters is or fairly inexpensive.
Score = 3: About the same as where the company headquarters is or mediocre, but not ideal.
Score = 2: Slightly more expensive than where company head-quarters is or fairly expensive.
Score = 1: Much more expensive than where company head-quarters is, or very expensive.
Level of Safety Source: Company interviews
Companies were asked to rate the level of personal and company safety in the investment location on a scale of 1 to 5. Responses differed depending on whether the interviewee was local or foreign.
Score = 5: Much safer than where company headquarters is, or very safe.
Score = 4: Slightly safer than where company headquarters is, or fairly safe.
Score = 3: About the same as where the company headquarters is, or mediocre, but not ideal.
Score = 2: Slightly less safe than where company headquarters is, or fairly unsafe.
Score = 1: Much less safe than where company headquarters is, or very unsafe.
Schools1. Number of International Schools Source: Ministries of Education, investment pro-
motion agencies, and school district offices• Ghana - Ghana Education Service • Kenya - Kenya Private Schools Association • lesotho - Department for International Development• Madagascar - Ministry of Education• Mali - Ministry of Education
SNAPSHOT AFRICA - GHANA ��
• Mozambique - Ministries of Education, investment promotion agencies, and school district offices
• Senegal - Ministries of Education, investment promotion agencies, and school district offices
• Tanzania - Ministry of Education and Culture• Uganda - Monitor Business Directory Data on the number of international schools in the capital city of
each country were collected.
2. Quality of International Schools Source: Company interviews
Companies were asked to rate the quality of international schools in the investment location on a scale of 1 to 5 according to the following criteria. Responses differed depending on whether the interviewee was local or foreign. .
Score = 5: Much better than schools where company head-quarters is, or excellent.
Score = 4: Slightly better than schools than where company headquarters is or good.
Score = 3: About the same as where the company headquarters is, or mediocre, but not ideal.
Score = 2: Slightly worse than schools where company head-quarters is, or fairly bad.
Score = 1: Much worse than schools where company head-quarters is, or very bad.
3. Quality of local Schools Source: Company interviews
Companies were asked to rate the quality of local schools in the investment location on a scale of 1 to 5 according to the fol-lowing criteria. Responses differed depending on whether the interviewee was local or foreign.
Score = 5: Much better than schools where company head-
quarters is, or excellent. Score = 4: Slightly better than schools than where company head-
quarters is, or good. Score = 3: About the same as where the company headquarters
is, or mediocre, but not ideal. Score = 2: Slightly worse than schools where company head-
quarters is, or fairly bad. Score = 1: Much worse than schools where company head-
quarters is, or very bad.
Healthcare Source: Company interviews
Companies were asked to rate the quality of healthcare in the investment location on a scale of 1 to 5 according to the fol-lowing criteria. Responses differed depending on whether the interviewee was local or foreign.
Score = 5: Much better than healthcare where company head-quarters is or excellent.
Score = 4: Slightly better than healthcare than where company headquarters is, or good.
Score = 3: About the same as where the company headquarters is, or mediocre, but not ideal.
Score = 2: Slightly worse than healthcare where company head-quarters is, or fairly bad.
Score = 1: Much worse than healthcare where company head-quarters is, or, very bad.
Quality of Recreational Activities Source: Company interviews
Companies were asked to rate the quality of recreational activities in the investment location, such as access to restaurants, family activities, golf and other sports, nature-related, and other activities on a scale of 1 to 5 according to the following criteria.
Responses differed depending on whether the interviewee was local or foreign.
Score = 5: Much better than where company headquarters is, or excellent, many activities.
Score = 4: Slightly better than where company headquarters is, or good, some activities.
Score = 3: About the same as where the company headquarters is, or mediocre, but not ideal.
Score = 2: Slightly worse than where company headquarters is, or fairly bad, not many activities.
Score = 1: Much worse than where company headquarters is, or very bad, hardly any activities.
Operating costs (Refer to Tables 38-43)
Labor Cost Source: Company interviews
labor cost data were collected during the course of 25 company interviews and aggregated by industry sector for analysis by the Enterprise Benchmarking Model. Company officials were asked to indicate the average annual fully burdened gross salaries of workers - including expatriate - they typically hired in the fol-lowing five job categories.
Management: Mid- to upper-level managers Professionals: Chief financial officer, lawyer, consultant Technical Workers: Engineer, programmer, systems analyst,
agronomist, accountants Skilled Workers: Data entry clerks, customer service represen-
tatives, assembly line workers with special skills Unskilled Workers: Drivers, janitors, chambermaids, entry-level
assembly line workers, farmhands Gross salaries include wages and benefits such as mandatory
pension or social security contributions, healthcare, transpor-tation, lodging, and any other benefits paid by the employer. Companies were instructed to provide average salary information for the types of workers that typically fill the above positions. The higher the labor costs, the lower the level of desirability to potential investors.
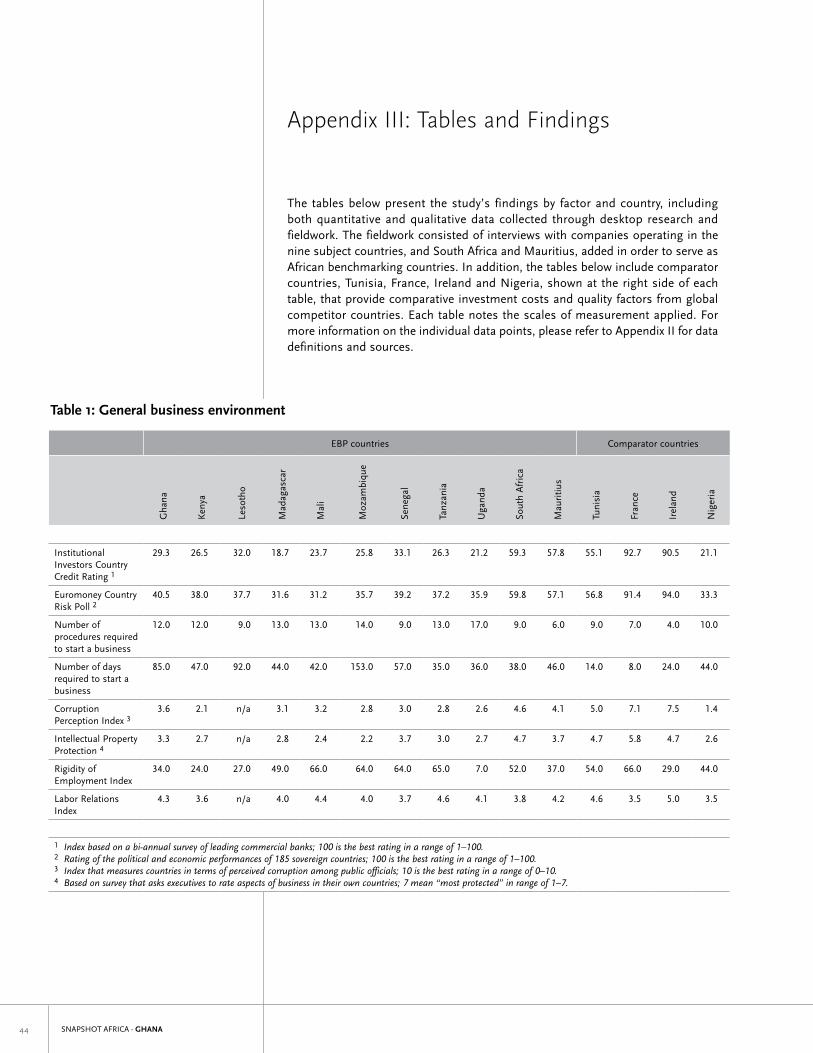
SNAPSHOT AFRICA - GHANA��
Table 1: General business environment
EBP countries Comparator countries
Gha
na
Ken
ya
leso
tho
Mad
agas
car
Mal
i
Moz
ambi
que
Sene
gal
Tanz
ania
Uga
nda
Sout
h A
fric
a
Mau
ritiu
s
Tuni
sia
Fran
ce
Irel
and
Nig
eria
Institutional Investors Country Credit Rating 1
29.3 26.5 32.0 18.7 23.7 25.8 33.1 26.3 21.2 59.3 57.8 55.1 92.7 90.5 21.1
Euromoney Country Risk Poll 2
40.5 38.0 37.7 31.6 31.2 35.7 39.2 37.2 35.9 59.8 57.1 56.8 91.4 94.0 33.3
Number of procedures required to start a business
12.0 12.0 9.0 13.0 13.0 14.0 9.0 13.0 17.0 9.0 6.0 9.0 7.0 4.0 10.0
Number of days required to start a business
85.0 47.0 92.0 44.0 42.0 153.0 57.0 35.0 36.0 38.0 46.0 14.0 8.0 24.0 44.0
Corruption Perception Index 3
3.6 2.1 n/a 3.1 3.2 2.8 3.0 2.8 2.6 4.6 4.1 5.0 7.1 7.5 1.4
Intellectual Property Protection 4
3.3 2.7 n/a 2.8 2.4 2.2 3.7 3.0 2.7 4.7 3.7 4.7 5.8 4.7 2.6
Rigidity of Employment Index
34.0 24.0 27.0 49.0 66.0 64.0 64.0 65.0 7.0 52.0 37.0 54.0 66.0 29.0 44.0
labor Relations Index
4.3 3.6 n/a 4.0 4.4 4.0 3.7 4.6 4.1 3.8 4.2 4.6 3.5 5.0 3.5
1 Index based on a bi-annual survey of leading commercial banks; 100 is the best rating in a range of 1–100.2 Rating of the political and economic performances of 185 sovereign countries; 100 is the best rating in a range of 1–100.3 Index that measures countries in terms of perceived corruption among public officials; 10 is the best rating in a range of 0–10.4 Based on survey that asks executives to rate aspects of business in their own countries; 7 mean “most protected” in range of 1–7.
Appendix III: Tables and Findings
The tables below present the study’s findings by factor and country, including both quantitative and qualitative data collected through desktop research and fieldwork. The fieldwork consisted of interviews with companies operating in the nine subject countries, and South Africa and Mauritius, added in order to serve as African benchmarking countries. In addition, the tables below include comparator countries, Tunisia, France, Ireland and Nigeria, shown at the right side of each table, that provide comparative investment costs and quality factors from global competitor countries. Each table notes the scales of measurement applied. For more information on the individual data points, please refer to Appendix II for data definitions and sources.
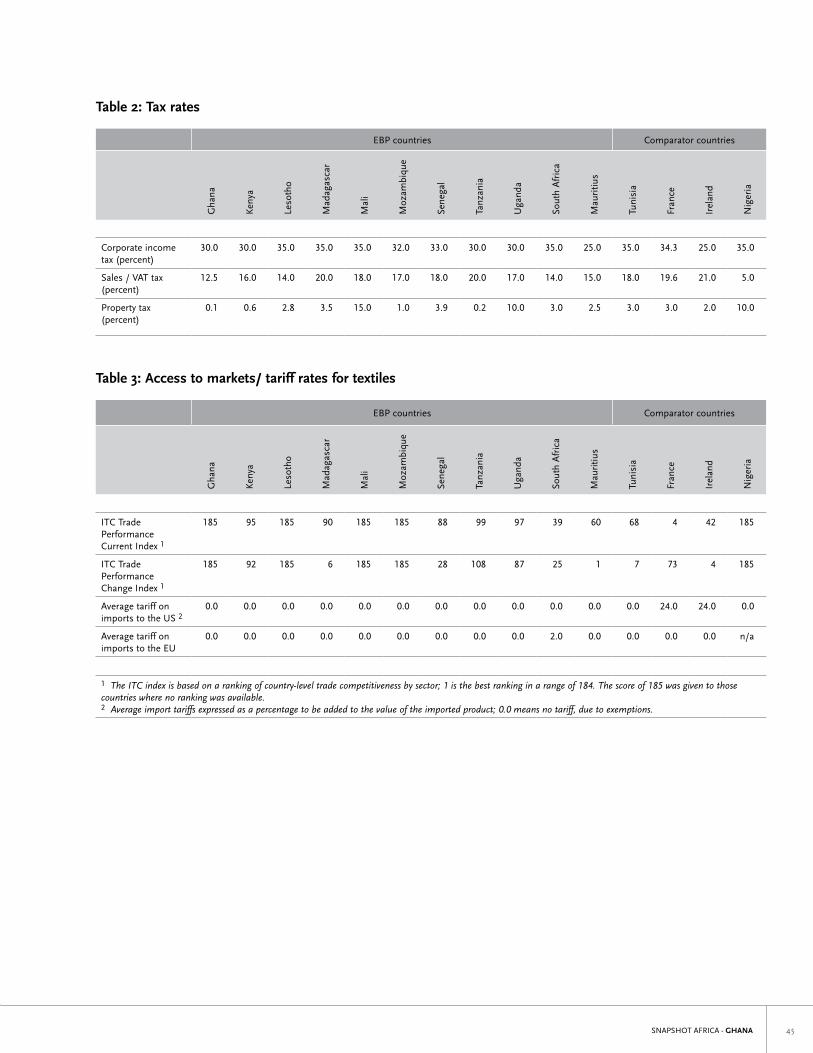
SNAPSHOT AFRICA - GHANA ��
Table 2: Tax rates
EBP countries Comparator countries
Gha
na
Ken
ya
leso
tho
Mad
agas
car
Mal
i
Moz
ambi
que
Sene
gal
Tanz
ania
Uga
nda
Sout
h A
fric
a
Mau
ritiu
s
Tuni
sia
Fran
ce
Irel
and
Nig
eria
Corporate income tax (percent)
30.0 30.0 35.0 35.0 35.0 32.0 33.0 30.0 30.0 35.0 25.0 35.0 34.3 25.0 35.0
Sales / VAT tax (percent)
12.5 16.0 14.0 20.0 18.0 17.0 18.0 20.0 17.0 14.0 15.0 18.0 19.6 21.0 5.0
Property tax (percent)
0.1 0.6 2.8 3.5 15.0 1.0 3.9 0.2 10.0 3.0 2.5 3.0 3.0 2.0 10.0
Table 3: Access to markets/ tariff rates for textiles
EBP countries Comparator countries
Gha
na
Ken
ya
leso
tho
Mad
agas
car
Mal
i
Moz
ambi
que
Sene
gal
Tanz
ania
Uga
nda
Sout
h A
fric
a
Mau
ritiu
s
Tuni
sia
Fran
ce
Irel
and
Nig
eria
ITC Trade Performance Current Index 1
185 95 185 90 185 185 88 99 97 39 60 68 4 42 185
ITC Trade Performance Change Index 1
185 92 185 6 185 185 28 108 87 25 1 7 73 4 185
Average tariff on imports to the US 2
0.0 0.0 0.0 0.0 0.0 0.0 0.0 0.0 0.0 0.0 0.0 0.0 24.0 24.0 0.0
Average tariff on imports to the EU
0.0 0.0 0.0 0.0 0.0 0.0 0.0 0.0 0.0 2.0 0.0 0.0 0.0 0.0 n/a
1 The ITC index is based on a ranking of country-level trade competitiveness by sector; 1 is the best ranking in a range of 184. The score of 185 was given to those countries where no ranking was available.2 Average import tariffs expressed as a percentage to be added to the value of the imported product; 0.0 means no tariff, due to exemptions.
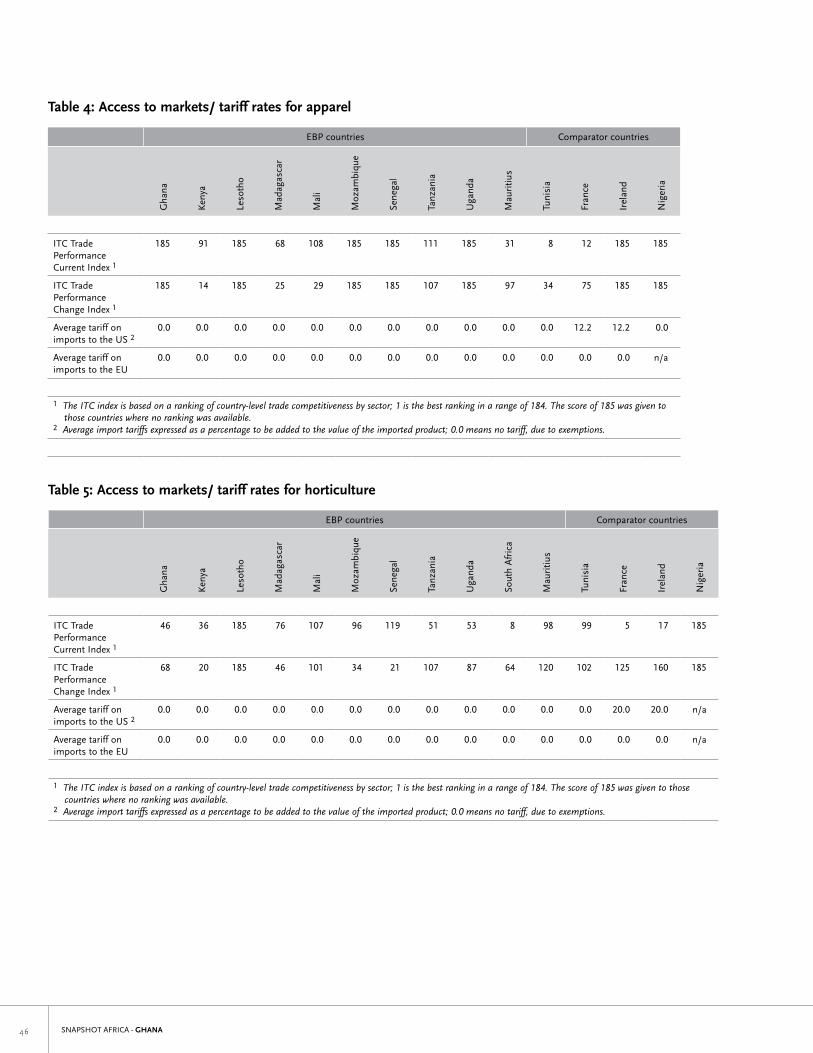
SNAPSHOT AFRICA - GHANA��
Table 5: Access to markets/ tariff rates for horticulture
EBP countries Comparator countries
Gha
na
Ken
ya
leso
tho
Mad
agas
car
Mal
i
Moz
ambi
que
Sene
gal
Tanz
ania
Uga
nda
Sout
h A
fric
a
Mau
ritiu
s
Tuni
sia
Fran
ce
Irel
and
Nig
eria
ITC Trade Performance Current Index 1
46 36 185 76 107 96 119 51 53 8 98 99 5 17 185
ITC Trade Performance Change Index 1
68 20 185 46 101 34 21 107 87 64 120 102 125 160 185
Average tariff on imports to the US 2
0.0 0.0 0.0 0.0 0.0 0.0 0.0 0.0 0.0 0.0 0.0 0.0 20.0 20.0 n/a
Average tariff on imports to the EU
0.0 0.0 0.0 0.0 0.0 0.0 0.0 0.0 0.0 0.0 0.0 0.0 0.0 0.0 n/a
1 The ITC index is based on a ranking of country-level trade competitiveness by sector; 1 is the best ranking in a range of 184. The score of 185 was given to those countries where no ranking was available.2 Average import tariffs expressed as a percentage to be added to the value of the imported product; 0.0 means no tariff, due to exemptions.
Table 4: Access to markets/ tariff rates for apparel
EBP countries Comparator countries
Gha
na
Ken
ya
leso
tho
Mad
agas
car
Mal
i
Moz
ambi
que
Sene
gal
Tanz
ania
Uga
nda
Mau
ritiu
s
Tuni
sia
Fran
ce
Irel
and
Nig
eria
ITC Trade Performance Current Index 1
185 91 185 68 108 185 185 111 185 31 8 12 185 185
ITC Trade Performance Change Index 1
185 14 185 25 29 185 185 107 185 97 34 75 185 185
Average tariff on imports to the US 2
0.0 0.0 0.0 0.0 0.0 0.0 0.0 0.0 0.0 0.0 0.0 12.2 12.2 0.0
Average tariff on imports to the EU
0.0 0.0 0.0 0.0 0.0 0.0 0.0 0.0 0.0 0.0 0.0 0.0 0.0 n/a
1 The ITC index is based on a ranking of country-level trade competitiveness by sector; 1 is the best ranking in a range of 184. The score of 185 was given to those countries where no ranking was available.2 Average import tariffs expressed as a percentage to be added to the value of the imported product; 0.0 means no tariff, due to exemptions.
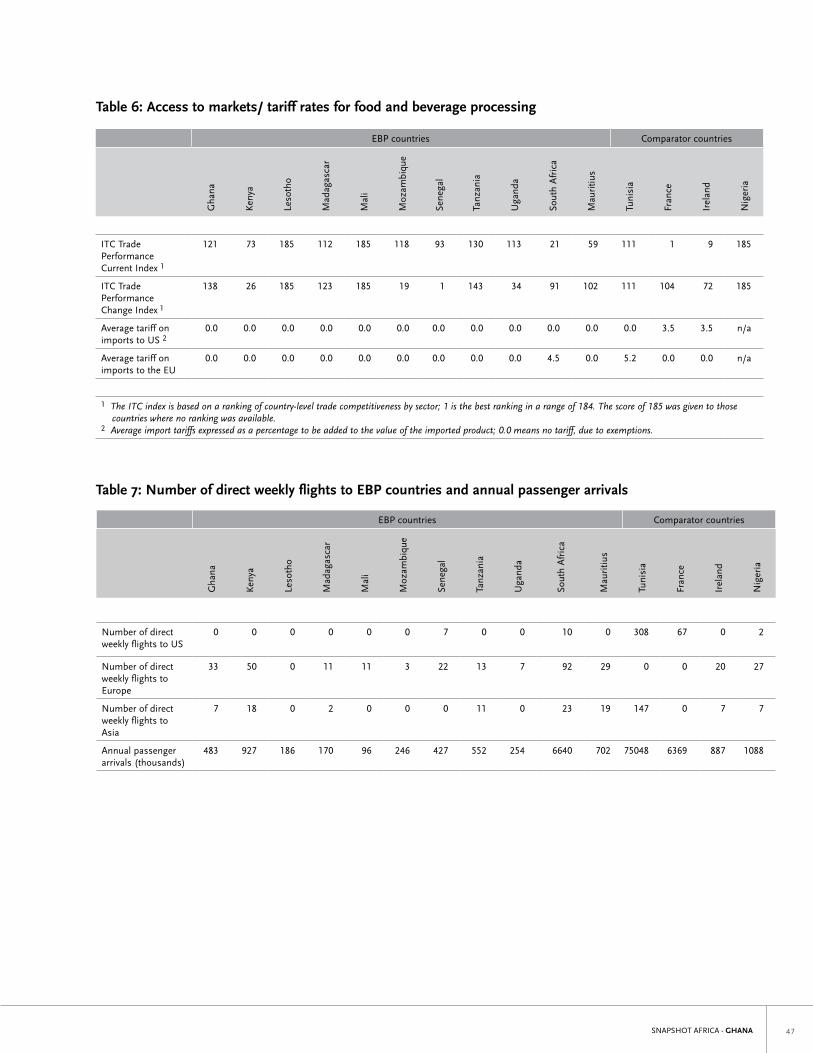
SNAPSHOT AFRICA - GHANA ��
Table 6: Access to markets/ tariff rates for food and beverage processing
EBP countries Comparator countries
Gha
na
Ken
ya
leso
tho
Mad
agas
car
Mal
i
Moz
ambi
que
Sene
gal
Tanz
ania
Uga
nda
Sout
h A
fric
a
Mau
ritiu
s
Tuni
sia
Fran
ce
Irel
and
Nig
eria
ITC Trade Performance Current Index 1
121 73 185 112 185 118 93 130 113 21 59 111 1 9 185
ITC Trade Performance Change Index 1
138 26 185 123 185 19 1 143 34 91 102 111 104 72 185
Average tariff on imports to US 2
0.0 0.0 0.0 0.0 0.0 0.0 0.0 0.0 0.0 0.0 0.0 0.0 3.5 3.5 n/a
Average tariff on imports to the EU
0.0 0.0 0.0 0.0 0.0 0.0 0.0 0.0 0.0 4.5 0.0 5.2 0.0 0.0 n/a
1 The ITC index is based on a ranking of country-level trade competitiveness by sector; 1 is the best ranking in a range of 184. The score of 185 was given to those countries where no ranking was available.2 Average import tariffs expressed as a percentage to be added to the value of the imported product; 0.0 means no tariff, due to exemptions.
Table 7: Number of direct weekly flights to EBP countries and annual passenger arrivals
EBP countries Comparator countries
Gha
na
Ken
ya
leso
tho
Mad
agas
car
Mal
i
Moz
ambi
que
Sene
gal
Tanz
ania
Uga
nda
Sout
h A
fric
a
Mau
ritiu
s
Tuni
sia
Fran
ce
Irel
and
Nig
eria
Number of direct weekly flights to US
0 0 0 0 0 0 7 0 0 10 0 308 67 0 2
Number of direct weekly flights to Europe
33 50 0 11 11 3 22 13 7 92 29 0 0 20 27
Number of direct weekly flights to Asia
7 18 0 2 0 0 0 11 0 23 19 147 0 7 7
Annual passenger arrivals (thousands)
483 927 186 170 96 246 427 552 254 6640 702 75048 6369 887 1088
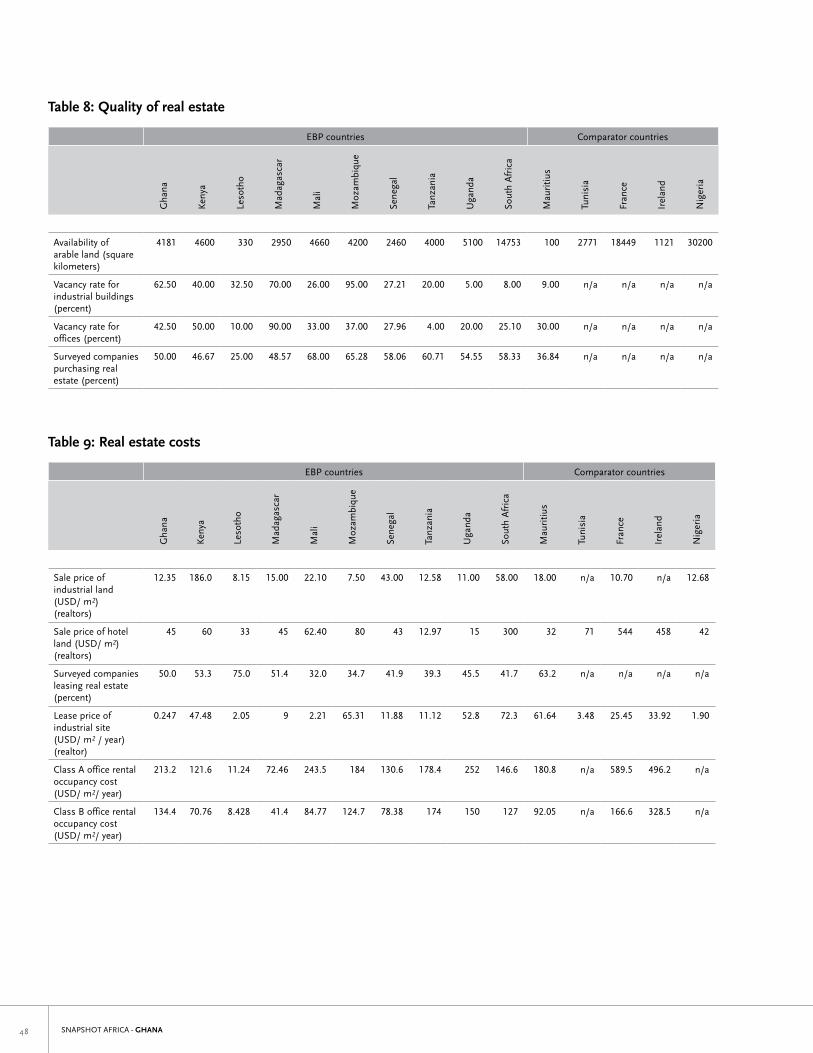
SNAPSHOT AFRICA - GHANA��
Table 8: Quality of real estate
EBP countries Comparator countries
Gha
na
Ken
ya
leso
tho
Mad
agas
car
Mal
i
Moz
ambi
que
Sene
gal
Tanz
ania
Uga
nda
Sout
h A
fric
a
Mau
ritiu
s
Tuni
sia
Fran
ce
Irel
and
Nig
eria
Availability of arable land (square kilometers)
4181 4600 330 2950 4660 4200 2460 4000 5100 14753 100 2771 18449 1121 30200
Vacancy rate for industrial buildings (percent)
62.50 40.00 32.50 70.00 26.00 95.00 27.21 20.00 5.00 8.00 9.00 n/a n/a n/a n/a
Vacancy rate for offices (percent)
42.50 50.00 10.00 90.00 33.00 37.00 27.96 4.00 20.00 25.10 30.00 n/a n/a n/a n/a
Surveyed companies purchasing real estate (percent)
50.00 46.67 25.00 48.57 68.00 65.28 58.06 60.71 54.55 58.33 36.84 n/a n/a n/a n/a
Table 9: Real estate costs
EBP countries Comparator countries
Gha
na
Ken
ya
leso
tho
Mad
agas
car
Mal
i
Moz
ambi
que
Sene
gal
Tanz
ania
Uga
nda
Sout
h A
fric
a
Mau
ritiu
s
Tuni
sia
Fran
ce
Irel
and
Nig
eria
Sale price of industrial land (USD/ m2) (realtors)
12.35 186.0 8.15 15.00 22.10 7.50 43.00 12.58 11.00 58.00 18.00 n/a 10.70 n/a 12.68
Sale price of hotel land (USD/ m2) (realtors)
45 60 33 45 62.40 80 43 12.97 15 300 32 71 544 458 42
Surveyed companies leasing real estate (percent)
50.0 53.3 75.0 51.4 32.0 34.7 41.9 39.3 45.5 41.7 63.2 n/a n/a n/a n/a
lease price of industrial site (USD/ m2 / year) (realtor)
0.247 47.48 2.05 9 2.21 65.31 11.88 11.12 52.8 72.3 61.64 3.48 25.45 33.92 1.90
Class A office rental occupancy cost (USD/ m2/ year)
213.2 121.6 11.24 72.46 243.5 184 130.6 178.4 252 146.6 180.8 n/a 589.5 496.2 n/a
Class B office rental occupancy cost (USD/ m2/ year)
134.4 70.76 8.428 41.4 84.77 124.7 78.38 174 150 127 92.05 n/a 166.6 328.5 n/a
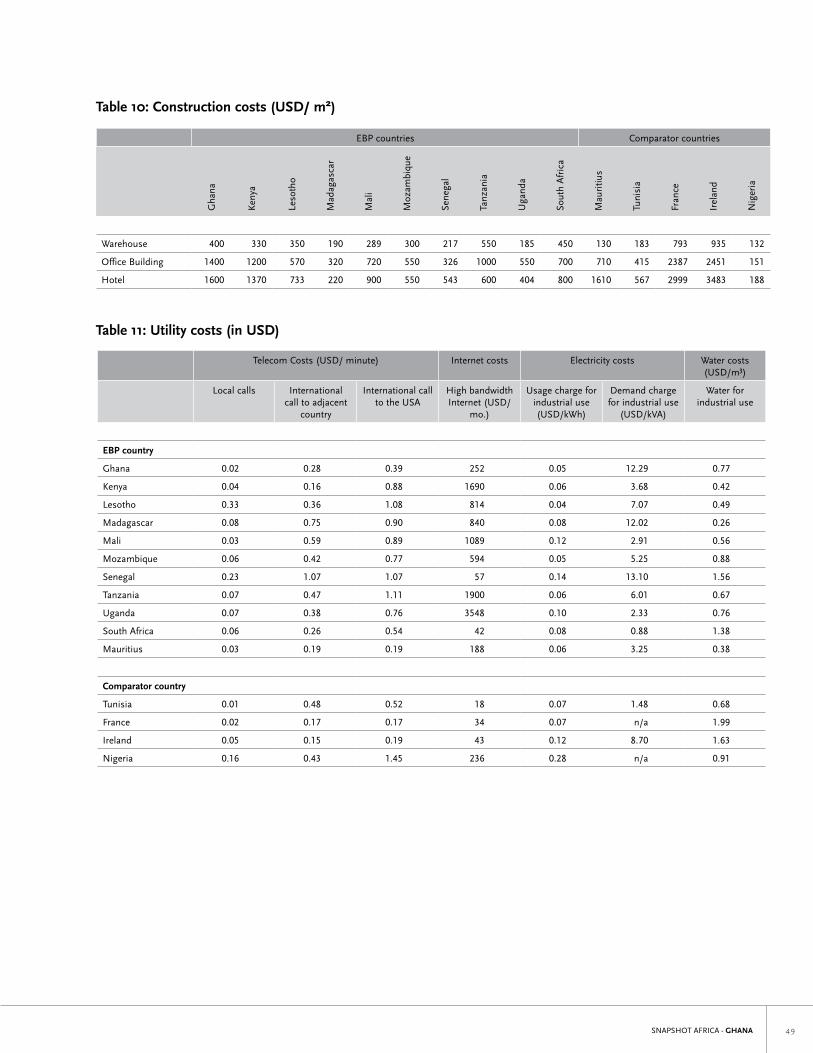
SNAPSHOT AFRICA - GHANA ��
Table 11: Utility costs (in USD)
Telecom Costs (USD/ minute) Internet costs Electricity costs Water costs (USD/m³)
local calls International call to adjacent
country
International call to the USA
High bandwidth Internet (USD/
mo.)
Usage charge for industrial use (USD/kWh)
Demand charge for industrial use
(USD/kVA)
Water for industrial use
EBP country
Ghana 0.02 0.28 0.39 252 0.05 12.29 0.77
Kenya 0.04 0.16 0.88 1690 0.06 3.68 0.42
lesotho 0.33 0.36 1.08 814 0.04 7.07 0.49
Madagascar 0.08 0.75 0.90 840 0.08 12.02 0.26
Mali 0.03 0.59 0.89 1089 0.12 2.91 0.56
Mozambique 0.06 0.42 0.77 594 0.05 5.25 0.88
Senegal 0.23 1.07 1.07 57 0.14 13.10 1.56
Tanzania 0.07 0.47 1.11 1900 0.06 6.01 0.67
Uganda 0.07 0.38 0.76 3548 0.10 2.33 0.76
South Africa 0.06 0.26 0.54 42 0.08 0.88 1.38
Mauritius 0.03 0.19 0.19 188 0.06 3.25 0.38
Comparator country
Tunisia 0.01 0.48 0.52 18 0.07 1.48 0.68
France 0.02 0.17 0.17 34 0.07 n/a 1.99
Ireland 0.05 0.15 0.19 43 0.12 8.70 1.63
Nigeria 0.16 0.43 1.45 236 0.28 n/a 0.91
Table 10: Construction costs (USD/ m²)
EBP countries Comparator countries
Gha
na
Ken
ya
leso
tho
Mad
agas
car
Mal
i
Moz
ambi
que
Sene
gal
Tanz
ania
Uga
nda
Sout
h A
fric
a
Mau
ritiu
s
Tuni
sia
Fran
ce
Irel
and
Nig
eria
Warehouse 400 330 350 190 289 300 217 550 185 450 130 183 793 935 132
Office Building 1400 1200 570 320 720 550 326 1000 550 700 710 415 2387 2451 151
Hotel 1600 1370 733 220 900 550 543 600 404 800 1610 567 2999 3483 188
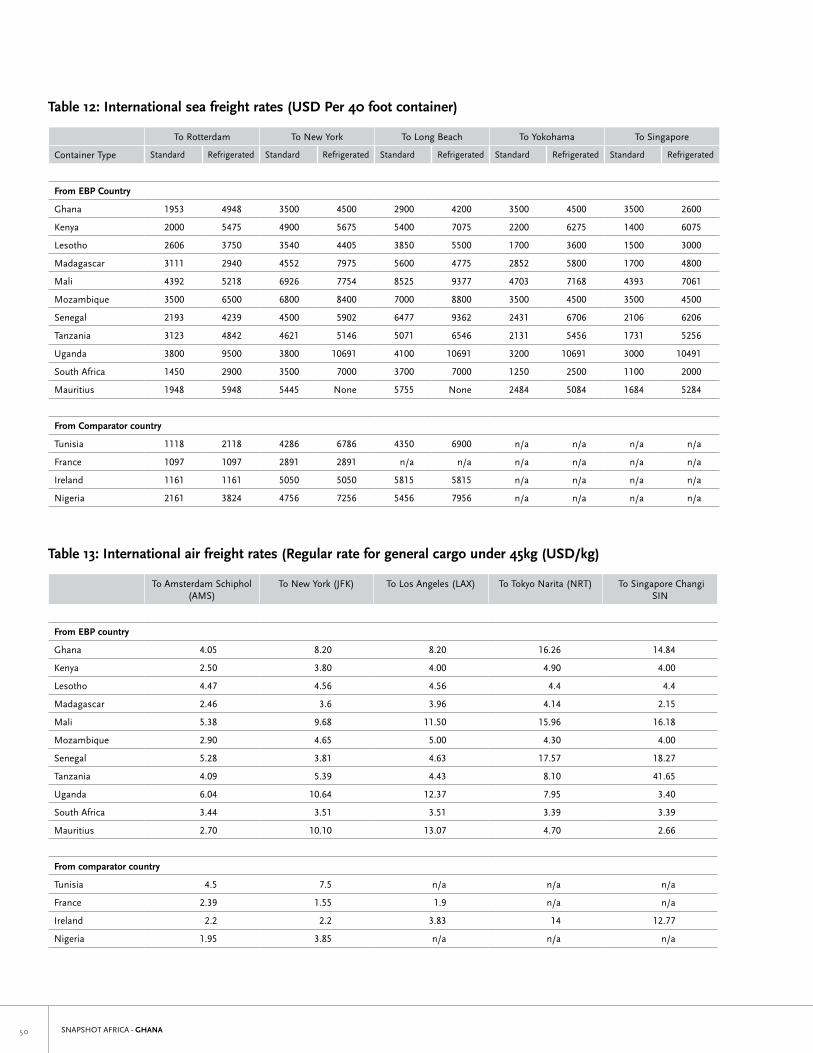
SNAPSHOT AFRICA - GHANA�0
Table 13: International air freight rates (Regular rate for general cargo under 45kg (USD/kg)
To Amsterdam Schiphol (AMS)
To New York (JFK) To los Angeles (lAX) To Tokyo Narita (NRT) To Singapore Changi SIN
From EBP country
Ghana 4.05 8.20 8.20 16.26 14.84
Kenya 2.50 3.80 4.00 4.90 4.00
lesotho 4.47 4.56 4.56 4.4 4.4
Madagascar 2.46 3.6 3.96 4.14 2.15
Mali 5.38 9.68 11.50 15.96 16.18
Mozambique 2.90 4.65 5.00 4.30 4.00
Senegal 5.28 3.81 4.63 17.57 18.27
Tanzania 4.09 5.39 4.43 8.10 41.65
Uganda 6.04 10.64 12.37 7.95 3.40
South Africa 3.44 3.51 3.51 3.39 3.39
Mauritius 2.70 10.10 13.07 4.70 2.66
From comparator country
Tunisia 4.5 7.5 n/a n/a n/a
France 2.39 1.55 1.9 n/a n/a
Ireland 2.2 2.2 3.83 14 12.77
Nigeria 1.95 3.85 n/a n/a n/a
Table 12: International sea freight rates (USD Per 40 foot container)
To Rotterdam To New York To long Beach To Yokohama To Singapore
Container Type Standard Refrigerated Standard Refrigerated Standard Refrigerated Standard Refrigerated Standard Refrigerated
From EBP Country
Ghana 1953 4948 3500 4500 2900 4200 3500 4500 3500 2600
Kenya 2000 5475 4900 5675 5400 7075 2200 6275 1400 6075
lesotho 2606 3750 3540 4405 3850 5500 1700 3600 1500 3000
Madagascar 3111 2940 4552 7975 5600 4775 2852 5800 1700 4800
Mali 4392 5218 6926 7754 8525 9377 4703 7168 4393 7061
Mozambique 3500 6500 6800 8400 7000 8800 3500 4500 3500 4500
Senegal 2193 4239 4500 5902 6477 9362 2431 6706 2106 6206
Tanzania 3123 4842 4621 5146 5071 6546 2131 5456 1731 5256
Uganda 3800 9500 3800 10691 4100 10691 3200 10691 3000 10491
South Africa 1450 2900 3500 7000 3700 7000 1250 2500 1100 2000
Mauritius 1948 5948 5445 None 5755 None 2484 5084 1684 5284
From Comparator country
Tunisia 1118 2118 4286 6786 4350 6900 n/a n/a n/a n/a
France 1097 1097 2891 2891 n/a n/a n/a n/a n/a n/a
Ireland 1161 1161 5050 5050 5815 5815 n/a n/a n/a n/a
Nigeria 2161 3824 4756 7256 5456 7956 n/a n/a n/a n/a
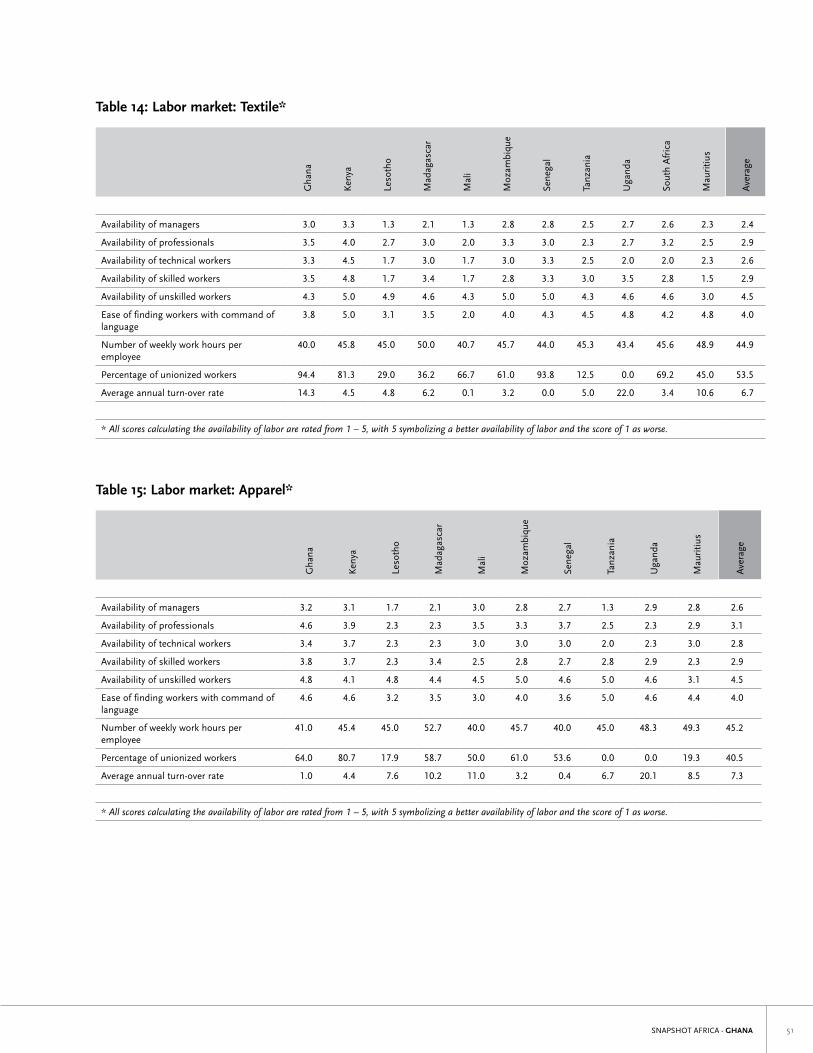
SNAPSHOT AFRICA - GHANA ��
Table 14: Labor market: Textile*
Gha
na
Ken
ya
leso
tho
Mad
agas
car
Mal
i
Moz
ambi
que
Sene
gal
Tanz
ania
Uga
nda
Sout
h A
fric
a
Mau
ritiu
s
Ave
rage
Availability of managers 3.0 3.3 1.3 2.1 1.3 2.8 2.8 2.5 2.7 2.6 2.3 2.4
Availability of professionals 3.5 4.0 2.7 3.0 2.0 3.3 3.0 2.3 2.7 3.2 2.5 2.9
Availability of technical workers 3.3 4.5 1.7 3.0 1.7 3.0 3.3 2.5 2.0 2.0 2.3 2.6
Availability of skilled workers 3.5 4.8 1.7 3.4 1.7 2.8 3.3 3.0 3.5 2.8 1.5 2.9
Availability of unskilled workers 4.3 5.0 4.9 4.6 4.3 5.0 5.0 4.3 4.6 4.6 3.0 4.5
Ease of finding workers with command of language
3.8 5.0 3.1 3.5 2.0 4.0 4.3 4.5 4.8 4.2 4.8 4.0
Number of weekly work hours per employee
40.0 45.8 45.0 50.0 40.7 45.7 44.0 45.3 43.4 45.6 48.9 44.9
Percentage of unionized workers 94.4 81.3 29.0 36.2 66.7 61.0 93.8 12.5 0.0 69.2 45.0 53.5
Average annual turn-over rate 14.3 4.5 4.8 6.2 0.1 3.2 0.0 5.0 22.0 3.4 10.6 6.7
* All scores calculating the availability of labor are rated from 1 – 5, with 5 symbolizing a better availability of labor and the score of 1 as worse.
Table 15: Labor market: Apparel*
Gha
na
Ken
ya
leso
tho
Mad
agas
car
Mal
i
Moz
ambi
que
Sene
gal
Tanz
ania
Uga
nda
Mau
ritiu
s
Ave
rage
Availability of managers 3.2 3.1 1.7 2.1 3.0 2.8 2.7 1.3 2.9 2.8 2.6
Availability of professionals 4.6 3.9 2.3 2.3 3.5 3.3 3.7 2.5 2.3 2.9 3.1
Availability of technical workers 3.4 3.7 2.3 2.3 3.0 3.0 3.0 2.0 2.3 3.0 2.8
Availability of skilled workers 3.8 3.7 2.3 3.4 2.5 2.8 2.7 2.8 2.9 2.3 2.9
Availability of unskilled workers 4.8 4.1 4.8 4.4 4.5 5.0 4.6 5.0 4.6 3.1 4.5
Ease of finding workers with command of language
4.6 4.6 3.2 3.5 3.0 4.0 3.6 5.0 4.6 4.4 4.0
Number of weekly work hours per employee
41.0 45.4 45.0 52.7 40.0 45.7 40.0 45.0 48.3 49.3 45.2
Percentage of unionized workers 64.0 80.7 17.9 58.7 50.0 61.0 53.6 0.0 0.0 19.3 40.5
Average annual turn-over rate 1.0 4.4 7.6 10.2 11.0 3.2 0.4 6.7 20.1 8.5 7.3
* All scores calculating the availability of labor are rated from 1 – 5, with 5 symbolizing a better availability of labor and the score of 1 as worse.
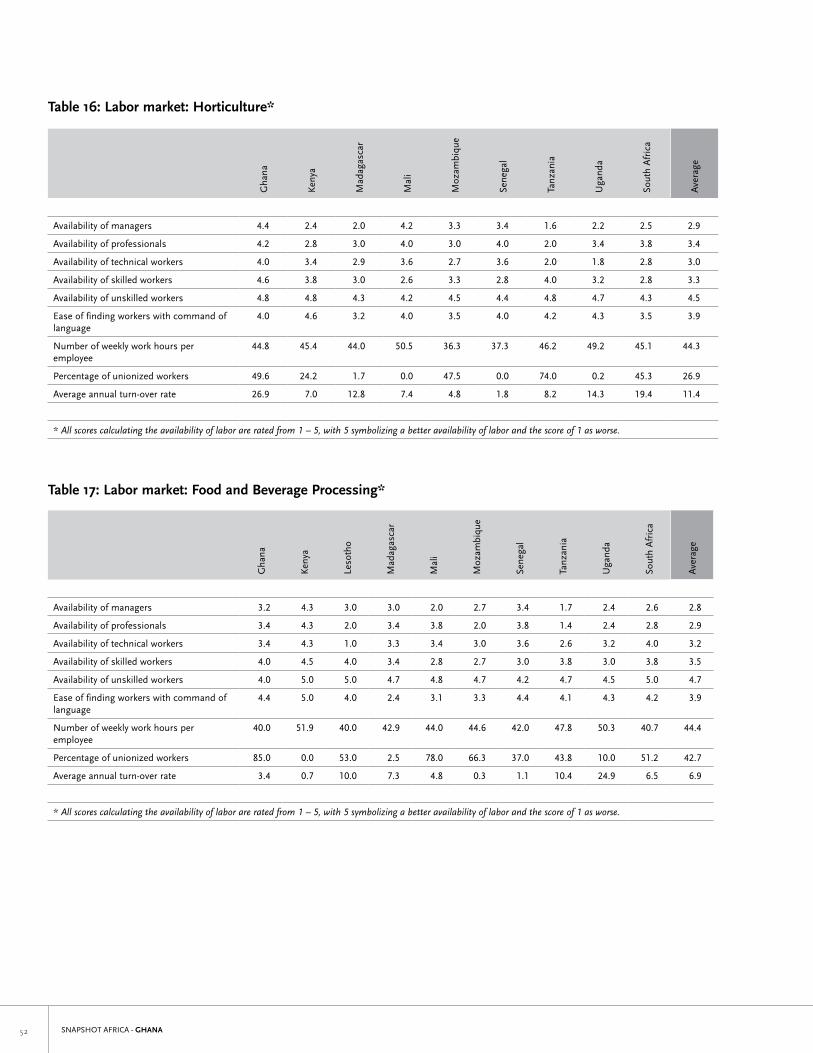
SNAPSHOT AFRICA - GHANA��
Table 17: Labor market: Food and Beverage Processing*
Gha
na
Ken
ya
leso
tho
Mad
agas
car
Mal
i
Moz
ambi
que
Sene
gal
Tanz
ania
Uga
nda
Sout
h A
fric
a
Ave
rage
Availability of managers 3.2 4.3 3.0 3.0 2.0 2.7 3.4 1.7 2.4 2.6 2.8
Availability of professionals 3.4 4.3 2.0 3.4 3.8 2.0 3.8 1.4 2.4 2.8 2.9
Availability of technical workers 3.4 4.3 1.0 3.3 3.4 3.0 3.6 2.6 3.2 4.0 3.2
Availability of skilled workers 4.0 4.5 4.0 3.4 2.8 2.7 3.0 3.8 3.0 3.8 3.5
Availability of unskilled workers 4.0 5.0 5.0 4.7 4.8 4.7 4.2 4.7 4.5 5.0 4.7
Ease of finding workers with command of language
4.4 5.0 4.0 2.4 3.1 3.3 4.4 4.1 4.3 4.2 3.9
Number of weekly work hours per employee
40.0 51.9 40.0 42.9 44.0 44.6 42.0 47.8 50.3 40.7 44.4
Percentage of unionized workers 85.0 0.0 53.0 2.5 78.0 66.3 37.0 43.8 10.0 51.2 42.7
Average annual turn-over rate 3.4 0.7 10.0 7.3 4.8 0.3 1.1 10.4 24.9 6.5 6.9
* All scores calculating the availability of labor are rated from 1 – 5, with 5 symbolizing a better availability of labor and the score of 1 as worse.
Table 16: Labor market: Horticulture*
Gha
na
Ken
ya
Mad
agas
car
Mal
i
Moz
ambi
que
Sene
gal
Tanz
ania
Uga
nda
Sout
h A
fric
a
Ave
rage
Availability of managers 4.4 2.4 2.0 4.2 3.3 3.4 1.6 2.2 2.5 2.9
Availability of professionals 4.2 2.8 3.0 4.0 3.0 4.0 2.0 3.4 3.8 3.4
Availability of technical workers 4.0 3.4 2.9 3.6 2.7 3.6 2.0 1.8 2.8 3.0
Availability of skilled workers 4.6 3.8 3.0 2.6 3.3 2.8 4.0 3.2 2.8 3.3
Availability of unskilled workers 4.8 4.8 4.3 4.2 4.5 4.4 4.8 4.7 4.3 4.5
Ease of finding workers with command of language
4.0 4.6 3.2 4.0 3.5 4.0 4.2 4.3 3.5 3.9
Number of weekly work hours per employee
44.8 45.4 44.0 50.5 36.3 37.3 46.2 49.2 45.1 44.3
Percentage of unionized workers 49.6 24.2 1.7 0.0 47.5 0.0 74.0 0.2 45.3 26.9
Average annual turn-over rate 26.9 7.0 12.8 7.4 4.8 1.8 8.2 14.3 19.4 11.4
* All scores calculating the availability of labor are rated from 1 – 5, with 5 symbolizing a better availability of labor and the score of 1 as worse.
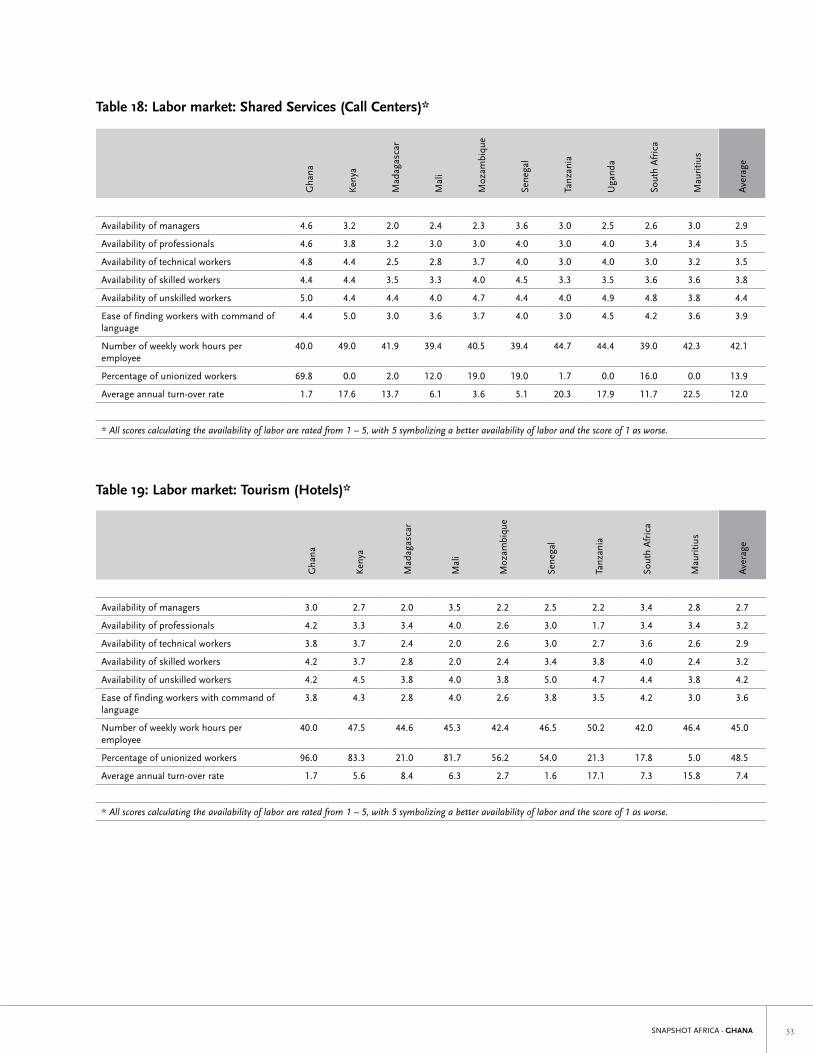
SNAPSHOT AFRICA - GHANA ��
Table 18: Labor market: Shared Services (Call Centers)*
Gha
na
Ken
ya
Mad
agas
car
Mal
i
Moz
ambi
que
Sene
gal
Tanz
ania
Uga
nda
Sout
h A
fric
a
Mau
ritiu
s
Ave
rage
Availability of managers 4.6 3.2 2.0 2.4 2.3 3.6 3.0 2.5 2.6 3.0 2.9
Availability of professionals 4.6 3.8 3.2 3.0 3.0 4.0 3.0 4.0 3.4 3.4 3.5
Availability of technical workers 4.8 4.4 2.5 2.8 3.7 4.0 3.0 4.0 3.0 3.2 3.5
Availability of skilled workers 4.4 4.4 3.5 3.3 4.0 4.5 3.3 3.5 3.6 3.6 3.8
Availability of unskilled workers 5.0 4.4 4.4 4.0 4.7 4.4 4.0 4.9 4.8 3.8 4.4
Ease of finding workers with command of language
4.4 5.0 3.0 3.6 3.7 4.0 3.0 4.5 4.2 3.6 3.9
Number of weekly work hours per employee
40.0 49.0 41.9 39.4 40.5 39.4 44.7 44.4 39.0 42.3 42.1
Percentage of unionized workers 69.8 0.0 2.0 12.0 19.0 19.0 1.7 0.0 16.0 0.0 13.9
Average annual turn-over rate 1.7 17.6 13.7 6.1 3.6 5.1 20.3 17.9 11.7 22.5 12.0
* All scores calculating the availability of labor are rated from 1 – 5, with 5 symbolizing a better availability of labor and the score of 1 as worse.
Table 19: Labor market: Tourism (Hotels)*
Gha
na
Ken
ya
Mad
agas
car
Mal
i
Moz
ambi
que
Sene
gal
Tanz
ania
Sout
h A
fric
a
Mau
ritiu
s
Ave
rage
Availability of managers 3.0 2.7 2.0 3.5 2.2 2.5 2.2 3.4 2.8 2.7
Availability of professionals 4.2 3.3 3.4 4.0 2.6 3.0 1.7 3.4 3.4 3.2
Availability of technical workers 3.8 3.7 2.4 2.0 2.6 3.0 2.7 3.6 2.6 2.9
Availability of skilled workers 4.2 3.7 2.8 2.0 2.4 3.4 3.8 4.0 2.4 3.2
Availability of unskilled workers 4.2 4.5 3.8 4.0 3.8 5.0 4.7 4.4 3.8 4.2
Ease of finding workers with command of language
3.8 4.3 2.8 4.0 2.6 3.8 3.5 4.2 3.0 3.6
Number of weekly work hours per employee
40.0 47.5 44.6 45.3 42.4 46.5 50.2 42.0 46.4 45.0
Percentage of unionized workers 96.0 83.3 21.0 81.7 56.2 54.0 21.3 17.8 5.0 48.5
Average annual turn-over rate 1.7 5.6 8.4 6.3 2.7 1.6 17.1 7.3 15.8 7.4
* All scores calculating the availability of labor are rated from 1 – 5, with 5 symbolizing a better availability of labor and the score of 1 as worse.
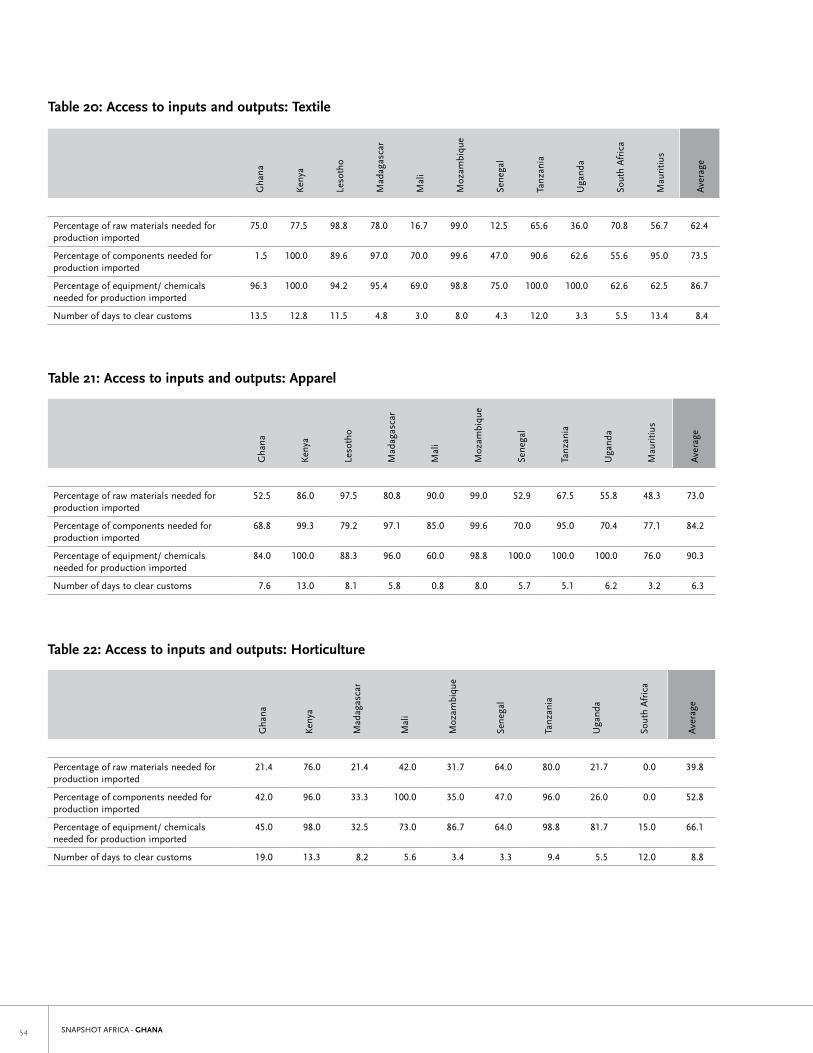
SNAPSHOT AFRICA - GHANA��
Table 21: Access to inputs and outputs: Apparel
Gha
na
Ken
ya
leso
tho
Mad
agas
car
Mal
i
Moz
ambi
que
Sene
gal
Tanz
ania
Uga
nda
Mau
ritiu
s
Ave
rage
Percentage of raw materials needed for production imported
52.5 86.0 97.5 80.8 90.0 99.0 52.9 67.5 55.8 48.3 73.0
Percentage of components needed for production imported
68.8 99.3 79.2 97.1 85.0 99.6 70.0 95.0 70.4 77.1 84.2
Percentage of equipment/ chemicals needed for production imported
84.0 100.0 88.3 96.0 60.0 98.8 100.0 100.0 100.0 76.0 90.3
Number of days to clear customs 7.6 13.0 8.1 5.8 0.8 8.0 5.7 5.1 6.2 3.2 6.3
Table 20: Access to inputs and outputs: Textile
Gha
na
Ken
ya
leso
tho
Mad
agas
car
Mal
i
Moz
ambi
que
Sene
gal
Tanz
ania
Uga
nda
Sout
h A
fric
a
Mau
ritiu
s
Ave
rage
Percentage of raw materials needed for production imported
75.0 77.5 98.8 78.0 16.7 99.0 12.5 65.6 36.0 70.8 56.7 62.4
Percentage of components needed for production imported
1.5 100.0 89.6 97.0 70.0 99.6 47.0 90.6 62.6 55.6 95.0 73.5
Percentage of equipment/ chemicals needed for production imported
96.3 100.0 94.2 95.4 69.0 98.8 75.0 100.0 100.0 62.6 62.5 86.7
Number of days to clear customs 13.5 12.8 11.5 4.8 3.0 8.0 4.3 12.0 3.3 5.5 13.4 8.4
Table 22: Access to inputs and outputs: Horticulture
Gha
na
Ken
ya
Mad
agas
car
Mal
i
Moz
ambi
que
Sene
gal
Tanz
ania
Uga
nda
Sout
h A
fric
a
Ave
rage
Percentage of raw materials needed for production imported
21.4 76.0 21.4 42.0 31.7 64.0 80.0 21.7 0.0 39.8
Percentage of components needed for production imported
42.0 96.0 33.3 100.0 35.0 47.0 96.0 26.0 0.0 52.8
Percentage of equipment/ chemicals needed for production imported
45.0 98.0 32.5 73.0 86.7 64.0 98.8 81.7 15.0 66.1
Number of days to clear customs 19.0 13.3 8.2 5.6 3.4 3.3 9.4 5.5 12.0 8.8
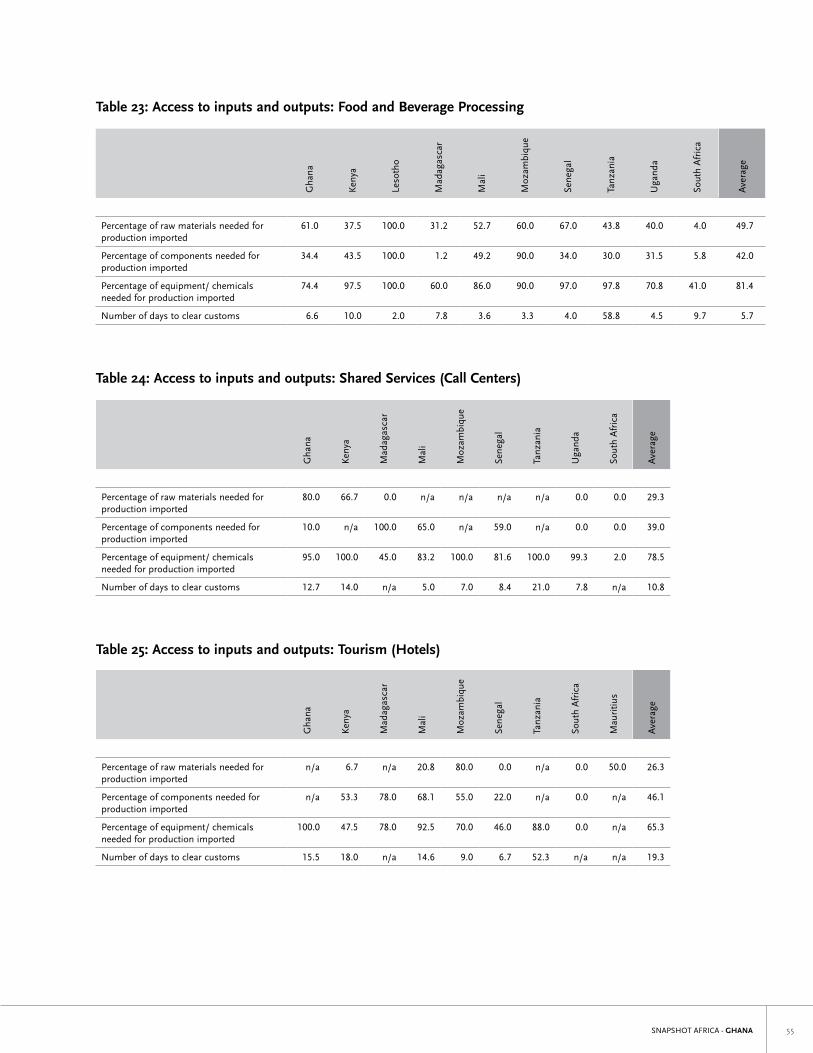
SNAPSHOT AFRICA - GHANA ��
Table 23: Access to inputs and outputs: Food and Beverage Processing
Gha
na
Ken
ya
leso
tho
Mad
agas
car
Mal
i
Moz
ambi
que
Sene
gal
Tanz
ania
Uga
nda
Sout
h A
fric
a
Ave
rage
Percentage of raw materials needed for production imported
61.0 37.5 100.0 31.2 52.7 60.0 67.0 43.8 40.0 4.0 49.7
Percentage of components needed for production imported
34.4 43.5 100.0 1.2 49.2 90.0 34.0 30.0 31.5 5.8 42.0
Percentage of equipment/ chemicals needed for production imported
74.4 97.5 100.0 60.0 86.0 90.0 97.0 97.8 70.8 41.0 81.4
Number of days to clear customs 6.6 10.0 2.0 7.8 3.6 3.3 4.0 58.8 4.5 9.7 5.7
Table 24: Access to inputs and outputs: Shared Services (Call Centers)
Gha
na
Ken
ya
Mad
agas
car
Mal
i
Moz
ambi
que
Sene
gal
Tanz
ania
Uga
nda
Sout
h A
fric
a
Ave
rage
Percentage of raw materials needed for production imported
80.0 66.7 0.0 n/a n/a n/a n/a 0.0 0.0 29.3
Percentage of components needed for production imported
10.0 n/a 100.0 65.0 n/a 59.0 n/a 0.0 0.0 39.0
Percentage of equipment/ chemicals needed for production imported
95.0 100.0 45.0 83.2 100.0 81.6 100.0 99.3 2.0 78.5
Number of days to clear customs 12.7 14.0 n/a 5.0 7.0 8.4 21.0 7.8 n/a 10.8
Table 25: Access to inputs and outputs: Tourism (Hotels)
Gha
na
Ken
ya
Mad
agas
car
Mal
i
Moz
ambi
que
Sene
gal
Tanz
ania
Sout
h A
fric
a
Mau
ritiu
s
Ave
rage
Percentage of raw materials needed for production imported
n/a 6.7 n/a 20.8 80.0 0.0 n/a 0.0 50.0 26.3
Percentage of components needed for production imported
n/a 53.3 78.0 68.1 55.0 22.0 n/a 0.0 n/a 46.1
Percentage of equipment/ chemicals needed for production imported
100.0 47.5 78.0 92.5 70.0 46.0 88.0 0.0 n/a 65.3
Number of days to clear customs 15.5 18.0 n/a 14.6 9.0 6.7 52.3 n/a n/a 19.3
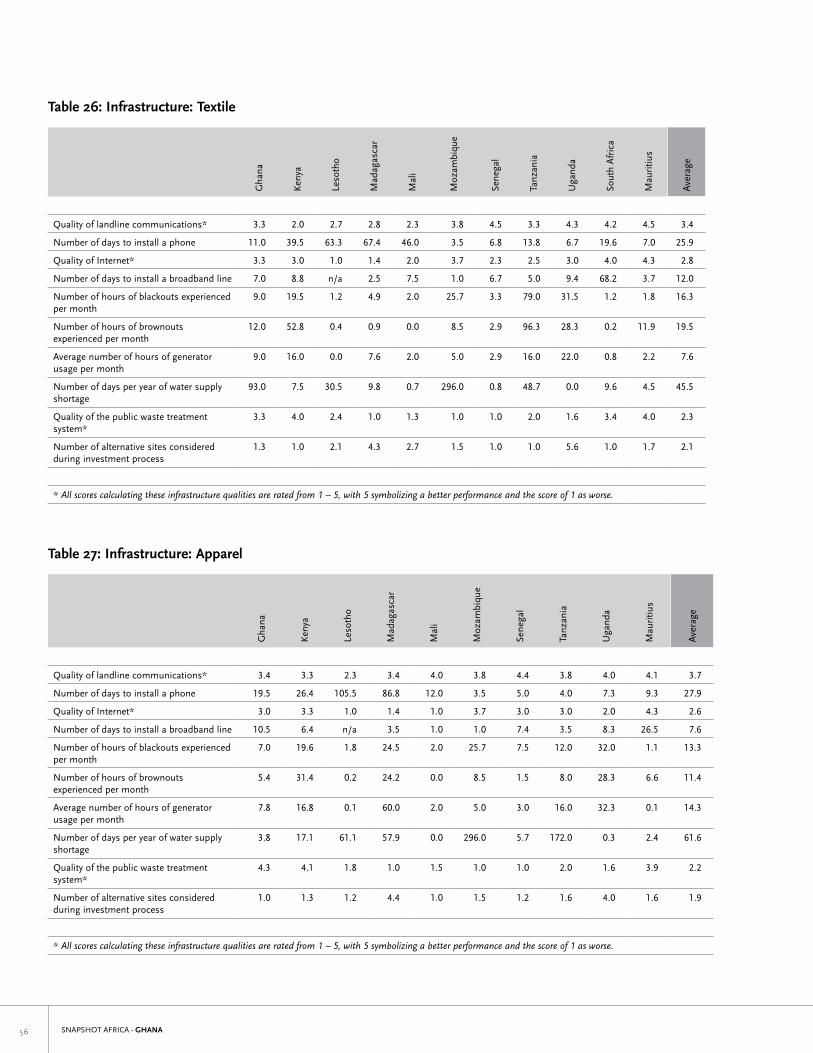
SNAPSHOT AFRICA - GHANA��
Table 26: Infrastructure: Textile
Gha
na
Ken
ya
leso
tho
Mad
agas
car
Mal
i
Moz
ambi
que
Sene
gal
Tanz
ania
Uga
nda
Sout
h A
fric
a
Mau
ritiu
s
Ave
rage
Quality of landline communications* 3.3 2.0 2.7 2.8 2.3 3.8 4.5 3.3 4.3 4.2 4.5 3.4
Number of days to install a phone 11.0 39.5 63.3 67.4 46.0 3.5 6.8 13.8 6.7 19.6 7.0 25.9
Quality of Internet* 3.3 3.0 1.0 1.4 2.0 3.7 2.3 2.5 3.0 4.0 4.3 2.8
Number of days to install a broadband line 7.0 8.8 n/a 2.5 7.5 1.0 6.7 5.0 9.4 68.2 3.7 12.0
Number of hours of blackouts experienced per month
9.0 19.5 1.2 4.9 2.0 25.7 3.3 79.0 31.5 1.2 1.8 16.3
Number of hours of brownouts experienced per month
12.0 52.8 0.4 0.9 0.0 8.5 2.9 96.3 28.3 0.2 11.9 19.5
Average number of hours of generator usage per month
9.0 16.0 0.0 7.6 2.0 5.0 2.9 16.0 22.0 0.8 2.2 7.6
Number of days per year of water supply shortage
93.0 7.5 30.5 9.8 0.7 296.0 0.8 48.7 0.0 9.6 4.5 45.5
Quality of the public waste treatment system*
3.3 4.0 2.4 1.0 1.3 1.0 1.0 2.0 1.6 3.4 4.0 2.3
Number of alternative sites considered during investment process
1.3 1.0 2.1 4.3 2.7 1.5 1.0 1.0 5.6 1.0 1.7 2.1
* All scores calculating these infrastructure qualities are rated from 1 – 5, with 5 symbolizing a better performance and the score of 1 as worse.
Table 27: Infrastructure: Apparel
Gha
na
Ken
ya
leso
tho
Mad
agas
car
Mal
i
Moz
ambi
que
Sene
gal
Tanz
ania
Uga
nda
Mau
ritiu
s
Ave
rage
Quality of landline communications* 3.4 3.3 2.3 3.4 4.0 3.8 4.4 3.8 4.0 4.1 3.7
Number of days to install a phone 19.5 26.4 105.5 86.8 12.0 3.5 5.0 4.0 7.3 9.3 27.9
Quality of Internet* 3.0 3.3 1.0 1.4 1.0 3.7 3.0 3.0 2.0 4.3 2.6
Number of days to install a broadband line 10.5 6.4 n/a 3.5 1.0 1.0 7.4 3.5 8.3 26.5 7.6
Number of hours of blackouts experienced per month
7.0 19.6 1.8 24.5 2.0 25.7 7.5 12.0 32.0 1.1 13.3
Number of hours of brownouts experienced per month
5.4 31.4 0.2 24.2 0.0 8.5 1.5 8.0 28.3 6.6 11.4
Average number of hours of generator usage per month
7.8 16.8 0.1 60.0 2.0 5.0 3.0 16.0 32.3 0.1 14.3
Number of days per year of water supply shortage
3.8 17.1 61.1 57.9 0.0 296.0 5.7 172.0 0.3 2.4 61.6
Quality of the public waste treatment system*
4.3 4.1 1.8 1.0 1.5 1.0 1.0 2.0 1.6 3.9 2.2
Number of alternative sites considered during investment process
1.0 1.3 1.2 4.4 1.0 1.5 1.2 1.6 4.0 1.6 1.9
* All scores calculating these infrastructure qualities are rated from 1 – 5, with 5 symbolizing a better performance and the score of 1 as worse.
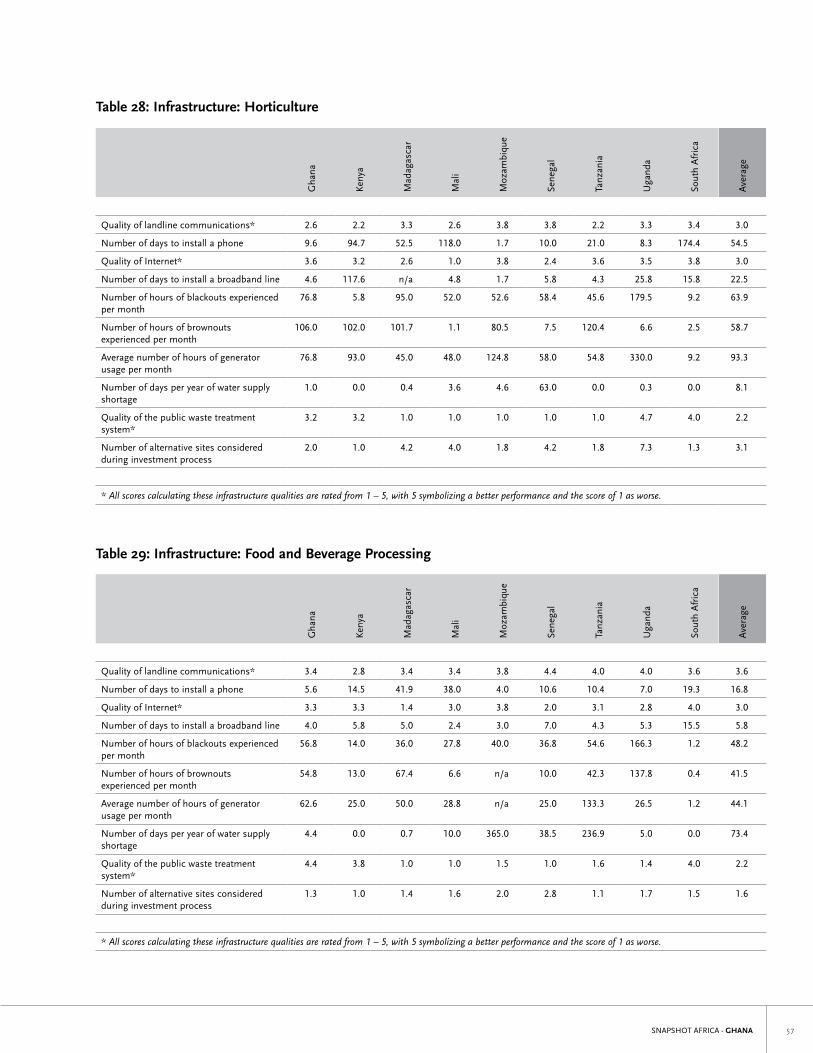
SNAPSHOT AFRICA - GHANA ��
Table 28: Infrastructure: Horticulture
Gha
na
Ken
ya
Mad
agas
car
Mal
i
Moz
ambi
que
Sene
gal
Tanz
ania
Uga
nda
Sout
h A
fric
a
Ave
rage
Quality of landline communications* 2.6 2.2 3.3 2.6 3.8 3.8 2.2 3.3 3.4 3.0
Number of days to install a phone 9.6 94.7 52.5 118.0 1.7 10.0 21.0 8.3 174.4 54.5
Quality of Internet* 3.6 3.2 2.6 1.0 3.8 2.4 3.6 3.5 3.8 3.0
Number of days to install a broadband line 4.6 117.6 n/a 4.8 1.7 5.8 4.3 25.8 15.8 22.5
Number of hours of blackouts experienced per month
76.8 5.8 95.0 52.0 52.6 58.4 45.6 179.5 9.2 63.9
Number of hours of brownouts experienced per month
106.0 102.0 101.7 1.1 80.5 7.5 120.4 6.6 2.5 58.7
Average number of hours of generator usage per month
76.8 93.0 45.0 48.0 124.8 58.0 54.8 330.0 9.2 93.3
Number of days per year of water supply shortage
1.0 0.0 0.4 3.6 4.6 63.0 0.0 0.3 0.0 8.1
Quality of the public waste treatment system*
3.2 3.2 1.0 1.0 1.0 1.0 1.0 4.7 4.0 2.2
Number of alternative sites considered during investment process
2.0 1.0 4.2 4.0 1.8 4.2 1.8 7.3 1.3 3.1
* All scores calculating these infrastructure qualities are rated from 1 – 5, with 5 symbolizing a better performance and the score of 1 as worse.
Table 29: Infrastructure: Food and Beverage Processing
Gha
na
Ken
ya
Mad
agas
car
Mal
i
Moz
ambi
que
Sene
gal
Tanz
ania
Uga
nda
Sout
h A
fric
a
Ave
rage
Quality of landline communications* 3.4 2.8 3.4 3.4 3.8 4.4 4.0 4.0 3.6 3.6
Number of days to install a phone 5.6 14.5 41.9 38.0 4.0 10.6 10.4 7.0 19.3 16.8
Quality of Internet* 3.3 3.3 1.4 3.0 3.8 2.0 3.1 2.8 4.0 3.0
Number of days to install a broadband line 4.0 5.8 5.0 2.4 3.0 7.0 4.3 5.3 15.5 5.8
Number of hours of blackouts experienced per month
56.8 14.0 36.0 27.8 40.0 36.8 54.6 166.3 1.2 48.2
Number of hours of brownouts experienced per month
54.8 13.0 67.4 6.6 n/a 10.0 42.3 137.8 0.4 41.5
Average number of hours of generator usage per month
62.6 25.0 50.0 28.8 n/a 25.0 133.3 26.5 1.2 44.1
Number of days per year of water supply shortage
4.4 0.0 0.7 10.0 365.0 38.5 236.9 5.0 0.0 73.4
Quality of the public waste treatment system*
4.4 3.8 1.0 1.0 1.5 1.0 1.6 1.4 4.0 2.2
Number of alternative sites considered during investment process
1.3 1.0 1.4 1.6 2.0 2.8 1.1 1.7 1.5 1.6
* All scores calculating these infrastructure qualities are rated from 1 – 5, with 5 symbolizing a better performance and the score of 1 as worse.
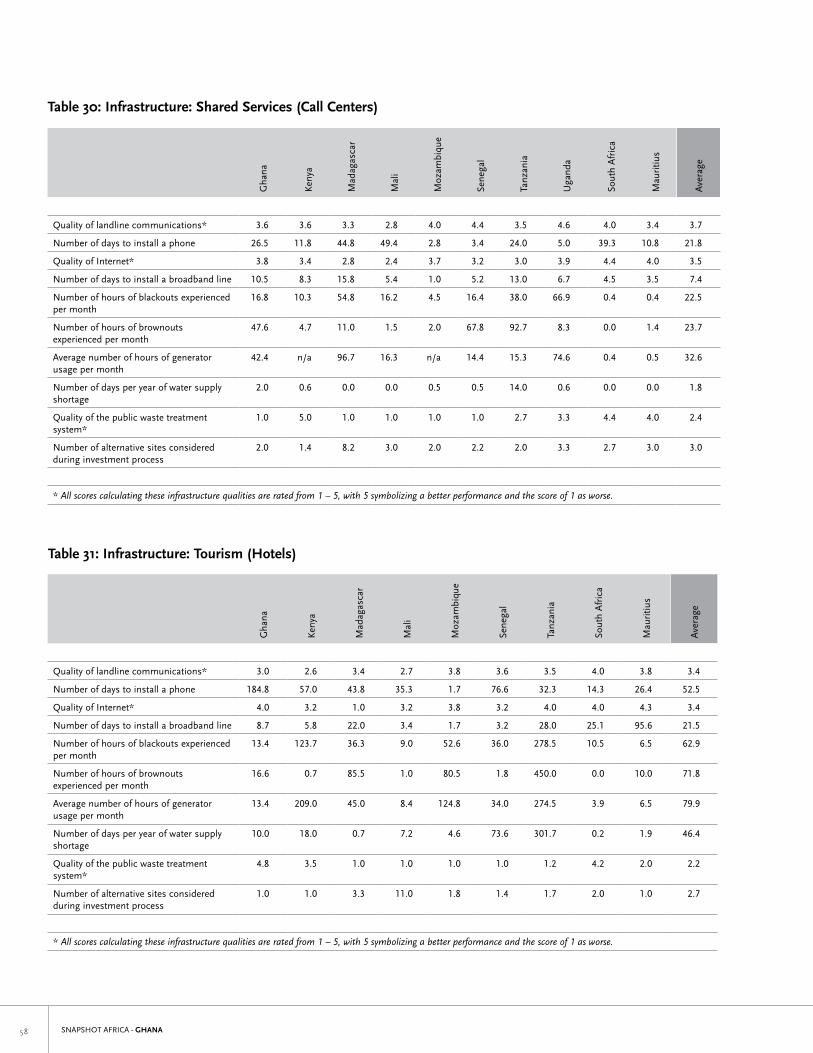
SNAPSHOT AFRICA - GHANA��
Table 30: Infrastructure: Shared Services (Call Centers)
Gha
na
Ken
ya
Mad
agas
car
Mal
i
Moz
ambi
que
Sene
gal
Tanz
ania
Uga
nda
Sout
h A
fric
a
Mau
ritiu
s
Ave
rage
Quality of landline communications* 3.6 3.6 3.3 2.8 4.0 4.4 3.5 4.6 4.0 3.4 3.7
Number of days to install a phone 26.5 11.8 44.8 49.4 2.8 3.4 24.0 5.0 39.3 10.8 21.8
Quality of Internet* 3.8 3.4 2.8 2.4 3.7 3.2 3.0 3.9 4.4 4.0 3.5
Number of days to install a broadband line 10.5 8.3 15.8 5.4 1.0 5.2 13.0 6.7 4.5 3.5 7.4
Number of hours of blackouts experienced per month
16.8 10.3 54.8 16.2 4.5 16.4 38.0 66.9 0.4 0.4 22.5
Number of hours of brownouts experienced per month
47.6 4.7 11.0 1.5 2.0 67.8 92.7 8.3 0.0 1.4 23.7
Average number of hours of generator usage per month
42.4 n/a 96.7 16.3 n/a 14.4 15.3 74.6 0.4 0.5 32.6
Number of days per year of water supply shortage
2.0 0.6 0.0 0.0 0.5 0.5 14.0 0.6 0.0 0.0 1.8
Quality of the public waste treatment system*
1.0 5.0 1.0 1.0 1.0 1.0 2.7 3.3 4.4 4.0 2.4
Number of alternative sites considered during investment process
2.0 1.4 8.2 3.0 2.0 2.2 2.0 3.3 2.7 3.0 3.0
* All scores calculating these infrastructure qualities are rated from 1 – 5, with 5 symbolizing a better performance and the score of 1 as worse.
Table 31: Infrastructure: Tourism (Hotels)
Gha
na
Ken
ya
Mad
agas
car
Mal
i
Moz
ambi
que
Sene
gal
Tanz
ania
Sout
h A
fric
a
Mau
ritiu
s
Ave
rage
Quality of landline communications* 3.0 2.6 3.4 2.7 3.8 3.6 3.5 4.0 3.8 3.4
Number of days to install a phone 184.8 57.0 43.8 35.3 1.7 76.6 32.3 14.3 26.4 52.5
Quality of Internet* 4.0 3.2 1.0 3.2 3.8 3.2 4.0 4.0 4.3 3.4
Number of days to install a broadband line 8.7 5.8 22.0 3.4 1.7 3.2 28.0 25.1 95.6 21.5
Number of hours of blackouts experienced per month
13.4 123.7 36.3 9.0 52.6 36.0 278.5 10.5 6.5 62.9
Number of hours of brownouts experienced per month
16.6 0.7 85.5 1.0 80.5 1.8 450.0 0.0 10.0 71.8
Average number of hours of generator usage per month
13.4 209.0 45.0 8.4 124.8 34.0 274.5 3.9 6.5 79.9
Number of days per year of water supply shortage
10.0 18.0 0.7 7.2 4.6 73.6 301.7 0.2 1.9 46.4
Quality of the public waste treatment system*
4.8 3.5 1.0 1.0 1.0 1.0 1.2 4.2 2.0 2.2
Number of alternative sites considered during investment process
1.0 1.0 3.3 11.0 1.8 1.4 1.7 2.0 1.0 2.7
* All scores calculating these infrastructure qualities are rated from 1 – 5, with 5 symbolizing a better performance and the score of 1 as worse.
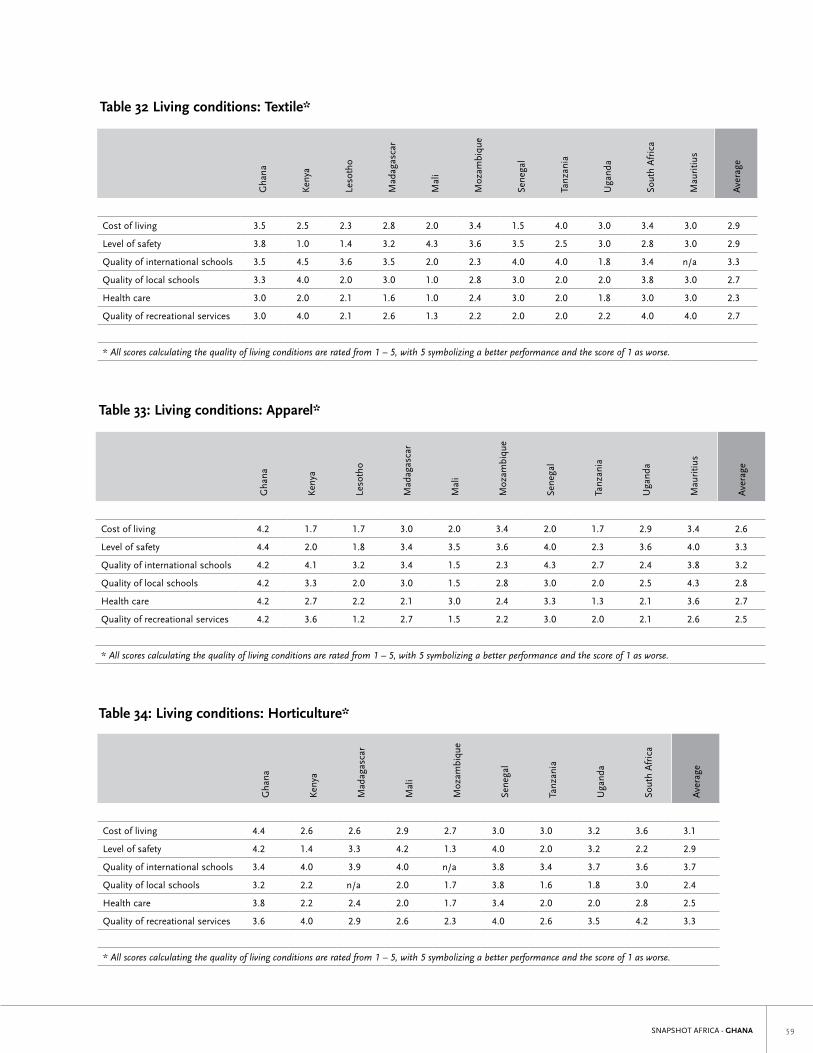
SNAPSHOT AFRICA - GHANA ��
Table 32 Living conditions: Textile*
Gha
na
Ken
ya
leso
tho
Mad
agas
car
Mal
i
Moz
ambi
que
Sene
gal
Tanz
ania
Uga
nda
Sout
h A
fric
a
Mau
ritiu
s
Ave
rage
Cost of living 3.5 2.5 2.3 2.8 2.0 3.4 1.5 4.0 3.0 3.4 3.0 2.9
level of safety 3.8 1.0 1.4 3.2 4.3 3.6 3.5 2.5 3.0 2.8 3.0 2.9
Quality of international schools 3.5 4.5 3.6 3.5 2.0 2.3 4.0 4.0 1.8 3.4 n/a 3.3
Quality of local schools 3.3 4.0 2.0 3.0 1.0 2.8 3.0 2.0 2.0 3.8 3.0 2.7
Health care 3.0 2.0 2.1 1.6 1.0 2.4 3.0 2.0 1.8 3.0 3.0 2.3
Quality of recreational services 3.0 4.0 2.1 2.6 1.3 2.2 2.0 2.0 2.2 4.0 4.0 2.7
* All scores calculating the quality of living conditions are rated from 1 – 5, with 5 symbolizing a better performance and the score of 1 as worse.
Table 33: Living conditions: Apparel*
Gha
na
Ken
ya
leso
tho
Mad
agas
car
Mal
i
Moz
ambi
que
Sene
gal
Tanz
ania
Uga
nda
Mau
ritiu
s
Ave
rage
Cost of living 4.2 1.7 1.7 3.0 2.0 3.4 2.0 1.7 2.9 3.4 2.6
level of safety 4.4 2.0 1.8 3.4 3.5 3.6 4.0 2.3 3.6 4.0 3.3
Quality of international schools 4.2 4.1 3.2 3.4 1.5 2.3 4.3 2.7 2.4 3.8 3.2
Quality of local schools 4.2 3.3 2.0 3.0 1.5 2.8 3.0 2.0 2.5 4.3 2.8
Health care 4.2 2.7 2.2 2.1 3.0 2.4 3.3 1.3 2.1 3.6 2.7
Quality of recreational services 4.2 3.6 1.2 2.7 1.5 2.2 3.0 2.0 2.1 2.6 2.5
* All scores calculating the quality of living conditions are rated from 1 – 5, with 5 symbolizing a better performance and the score of 1 as worse.
Table 34: Living conditions: Horticulture*
Gha
na
Ken
ya
Mad
agas
car
Mal
i
Moz
ambi
que
Sene
gal
Tanz
ania
Uga
nda
Sout
h A
fric
a
Ave
rage
Cost of living 4.4 2.6 2.6 2.9 2.7 3.0 3.0 3.2 3.6 3.1
level of safety 4.2 1.4 3.3 4.2 1.3 4.0 2.0 3.2 2.2 2.9
Quality of international schools 3.4 4.0 3.9 4.0 n/a 3.8 3.4 3.7 3.6 3.7
Quality of local schools 3.2 2.2 n/a 2.0 1.7 3.8 1.6 1.8 3.0 2.4
Health care 3.8 2.2 2.4 2.0 1.7 3.4 2.0 2.0 2.8 2.5
Quality of recreational services 3.6 4.0 2.9 2.6 2.3 4.0 2.6 3.5 4.2 3.3
* All scores calculating the quality of living conditions are rated from 1 – 5, with 5 symbolizing a better performance and the score of 1 as worse.
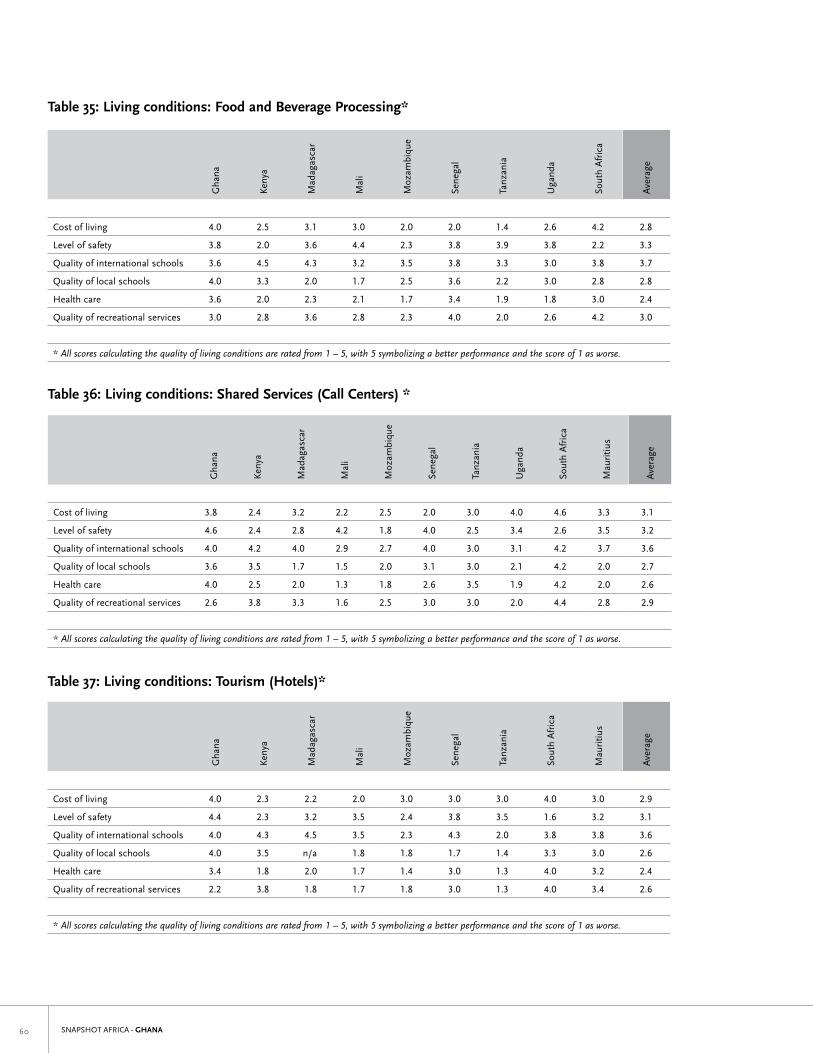
SNAPSHOT AFRICA - GHANA�0
Table 35: Living conditions: Food and Beverage Processing*
Gha
na
Ken
ya
Mad
agas
car
Mal
i
Moz
ambi
que
Sene
gal
Tanz
ania
Uga
nda
Sout
h A
fric
a
Ave
rage
Cost of living 4.0 2.5 3.1 3.0 2.0 2.0 1.4 2.6 4.2 2.8
level of safety 3.8 2.0 3.6 4.4 2.3 3.8 3.9 3.8 2.2 3.3
Quality of international schools 3.6 4.5 4.3 3.2 3.5 3.8 3.3 3.0 3.8 3.7
Quality of local schools 4.0 3.3 2.0 1.7 2.5 3.6 2.2 3.0 2.8 2.8
Health care 3.6 2.0 2.3 2.1 1.7 3.4 1.9 1.8 3.0 2.4
Quality of recreational services 3.0 2.8 3.6 2.8 2.3 4.0 2.0 2.6 4.2 3.0
* All scores calculating the quality of living conditions are rated from 1 – 5, with 5 symbolizing a better performance and the score of 1 as worse.
Table 36: Living conditions: Shared Services (Call Centers) *
Gha
na
Ken
ya
Mad
agas
car
Mal
i
Moz
ambi
que
Sene
gal
Tanz
ania
Uga
nda
Sout
h A
fric
a
Mau
ritiu
s
Ave
rage
Cost of living 3.8 2.4 3.2 2.2 2.5 2.0 3.0 4.0 4.6 3.3 3.1
level of safety 4.6 2.4 2.8 4.2 1.8 4.0 2.5 3.4 2.6 3.5 3.2
Quality of international schools 4.0 4.2 4.0 2.9 2.7 4.0 3.0 3.1 4.2 3.7 3.6
Quality of local schools 3.6 3.5 1.7 1.5 2.0 3.1 3.0 2.1 4.2 2.0 2.7
Health care 4.0 2.5 2.0 1.3 1.8 2.6 3.5 1.9 4.2 2.0 2.6
Quality of recreational services 2.6 3.8 3.3 1.6 2.5 3.0 3.0 2.0 4.4 2.8 2.9
* All scores calculating the quality of living conditions are rated from 1 – 5, with 5 symbolizing a better performance and the score of 1 as worse.
Table 37: Living conditions: Tourism (Hotels)*
Gha
na
Ken
ya
Mad
agas
car
Mal
i
Moz
ambi
que
Sene
gal
Tanz
ania
Sout
h A
fric
a
Mau
ritiu
s
Ave
rage
Cost of living 4.0 2.3 2.2 2.0 3.0 3.0 3.0 4.0 3.0 2.9
level of safety 4.4 2.3 3.2 3.5 2.4 3.8 3.5 1.6 3.2 3.1
Quality of international schools 4.0 4.3 4.5 3.5 2.3 4.3 2.0 3.8 3.8 3.6
Quality of local schools 4.0 3.5 n/a 1.8 1.8 1.7 1.4 3.3 3.0 2.6
Health care 3.4 1.8 2.0 1.7 1.4 3.0 1.3 4.0 3.2 2.4
Quality of recreational services 2.2 3.8 1.8 1.7 1.8 3.0 1.3 4.0 3.4 2.6
* All scores calculating the quality of living conditions are rated from 1 – 5, with 5 symbolizing a better performance and the score of 1 as worse.
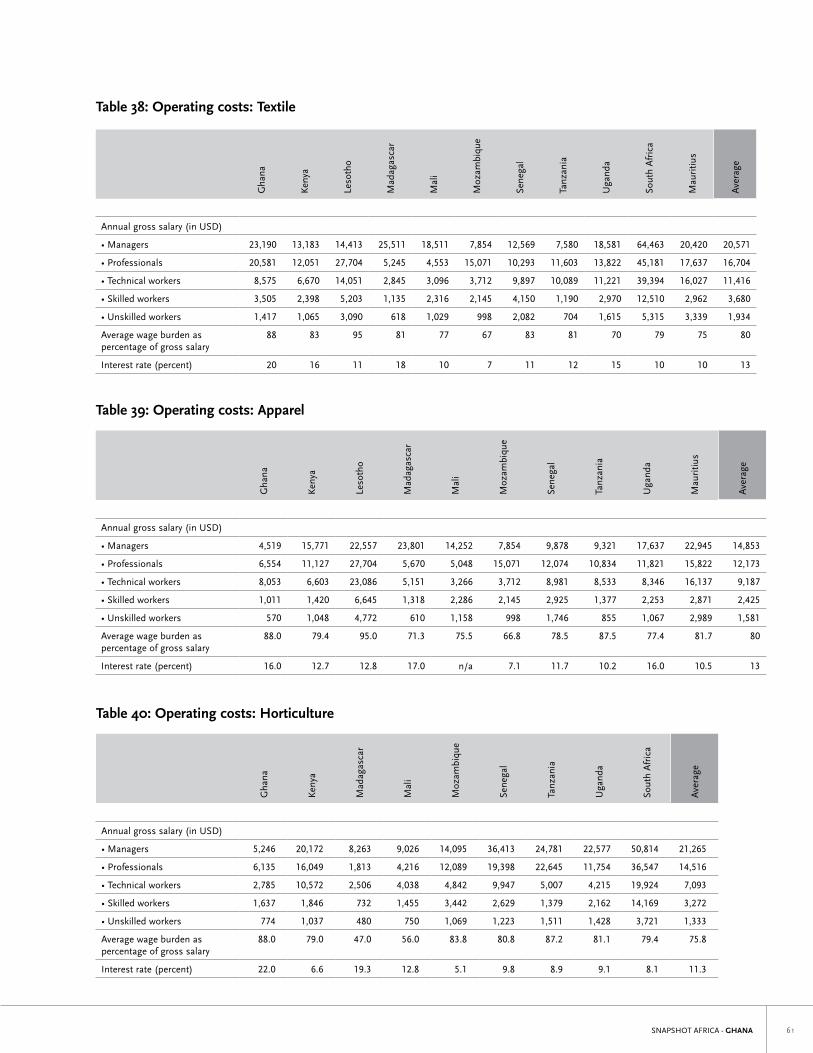
SNAPSHOT AFRICA - GHANA ��
Table 38: Operating costs: Textile
Gha
na
Ken
ya
leso
tho
Mad
agas
car
Mal
i
Moz
ambi
que
Sene
gal
Tanz
ania
Uga
nda
Sout
h A
fric
a
Mau
ritiu
s
Ave
rage
Annual gross salary (in USD)
• Managers 23,190 13,183 14,413 25,511 18,511 7,854 12,569 7,580 18,581 64,463 20,420 20,571
• Professionals 20,581 12,051 27,704 5,245 4,553 15,071 10,293 11,603 13,822 45,181 17,637 16,704
• Technical workers 8,575 6,670 14,051 2,845 3,096 3,712 9,897 10,089 11,221 39,394 16,027 11,416
• Skilled workers 3,505 2,398 5,203 1,135 2,316 2,145 4,150 1,190 2,970 12,510 2,962 3,680
• Unskilled workers 1,417 1,065 3,090 618 1,029 998 2,082 704 1,615 5,315 3,339 1,934
Average wage burden as percentage of gross salary
88 83 95 81 77 67 83 81 70 79 75 80
Interest rate (percent) 20 16 11 18 10 7 11 12 15 10 10 13
Table 39: Operating costs: Apparel
Gha
na
Ken
ya
leso
tho
Mad
agas
car
Mal
i
Moz
ambi
que
Sene
gal
Tanz
ania
Uga
nda
Mau
ritiu
s
Ave
rage
Annual gross salary (in USD)
• Managers 4,519 15,771 22,557 23,801 14,252 7,854 9,878 9,321 17,637 22,945 14,853
• Professionals 6,554 11,127 27,704 5,670 5,048 15,071 12,074 10,834 11,821 15,822 12,173
• Technical workers 8,053 6,603 23,086 5,151 3,266 3,712 8,981 8,533 8,346 16,137 9,187
• Skilled workers 1,011 1,420 6,645 1,318 2,286 2,145 2,925 1,377 2,253 2,871 2,425
• Unskilled workers 570 1,048 4,772 610 1,158 998 1,746 855 1,067 2,989 1,581
Average wage burden as percentage of gross salary
88.0 79.4 95.0 71.3 75.5 66.8 78.5 87.5 77.4 81.7 80
Interest rate (percent) 16.0 12.7 12.8 17.0 n/a 7.1 11.7 10.2 16.0 10.5 13
Table 40: Operating costs: Horticulture
Gha
na
Ken
ya
Mad
agas
car
Mal
i
Moz
ambi
que
Sene
gal
Tanz
ania
Uga
nda
Sout
h A
fric
a
Ave
rage
Annual gross salary (in USD)
• Managers 5,246 20,172 8,263 9,026 14,095 36,413 24,781 22,577 50,814 21,265
• Professionals 6,135 16,049 1,813 4,216 12,089 19,398 22,645 11,754 36,547 14,516
• Technical workers 2,785 10,572 2,506 4,038 4,842 9,947 5,007 4,215 19,924 7,093
• Skilled workers 1,637 1,846 732 1,455 3,442 2,629 1,379 2,162 14,169 3,272
• Unskilled workers 774 1,037 480 750 1,069 1,223 1,511 1,428 3,721 1,333
Average wage burden as percentage of gross salary
88.0 79.0 47.0 56.0 83.8 80.8 87.2 81.1 79.4 75.8
Interest rate (percent) 22.0 6.6 19.3 12.8 5.1 9.8 8.9 9.1 8.1 11.3
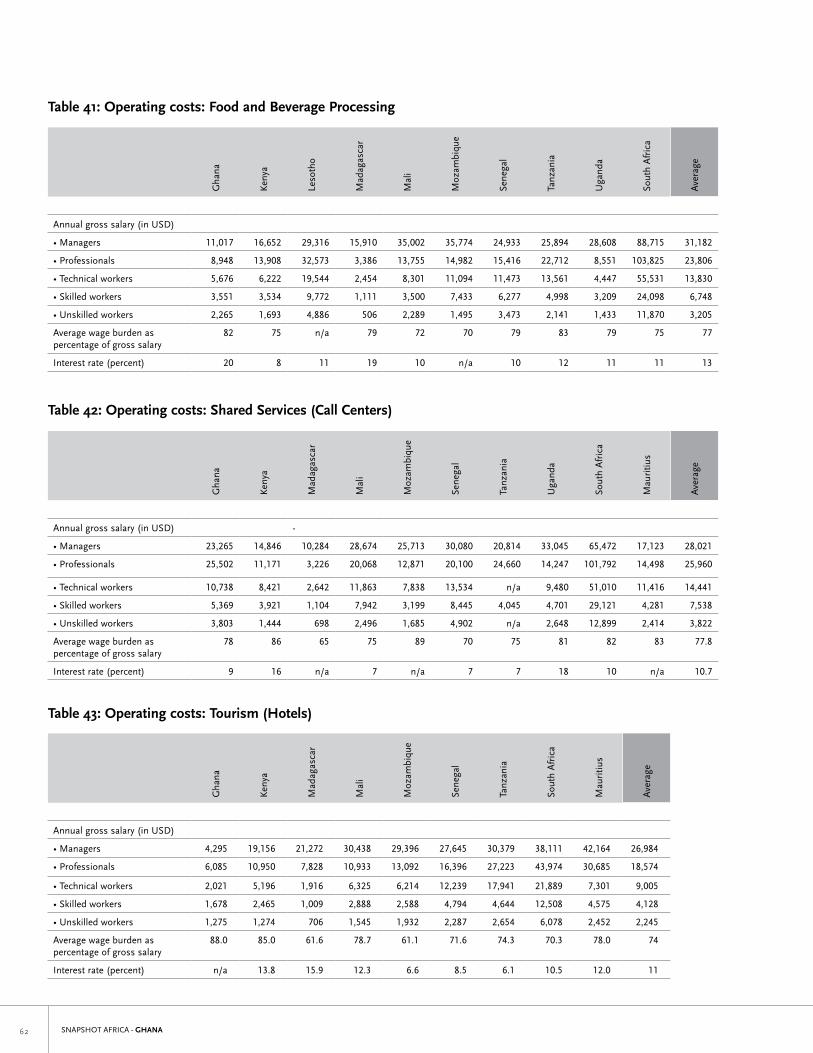
SNAPSHOT AFRICA - GHANA��
Table 41: Operating costs: Food and Beverage Processing
Gha
na
Ken
ya
leso
tho
Mad
agas
car
Mal
i
Moz
ambi
que
Sene
gal
Tanz
ania
Uga
nda
Sout
h A
fric
a
Ave
rage
Annual gross salary (in USD)
• Managers 11,017 16,652 29,316 15,910 35,002 35,774 24,933 25,894 28,608 88,715 31,182
• Professionals 8,948 13,908 32,573 3,386 13,755 14,982 15,416 22,712 8,551 103,825 23,806
• Technical workers 5,676 6,222 19,544 2,454 8,301 11,094 11,473 13,561 4,447 55,531 13,830
• Skilled workers 3,551 3,534 9,772 1,111 3,500 7,433 6,277 4,998 3,209 24,098 6,748
• Unskilled workers 2,265 1,693 4,886 506 2,289 1,495 3,473 2,141 1,433 11,870 3,205
Average wage burden as percentage of gross salary
82 75 n/a 79 72 70 79 83 79 75 77
Interest rate (percent) 20 8 11 19 10 n/a 10 12 11 11 13
Table 42: Operating costs: Shared Services (Call Centers)
Gha
na
Ken
ya
Mad
agas
car
Mal
i
Moz
ambi
que
Sene
gal
Tanz
ania
Uga
nda
Sout
h A
fric
a
Mau
ritiu
s
Ave
rage
Annual gross salary (in USD) -
• Managers 23,265 14,846 10,284 28,674 25,713 30,080 20,814 33,045 65,472 17,123 28,021
• Professionals 25,502 11,171 3,226 20,068 12,871 20,100 24,660 14,247 101,792 14,498 25,960
• Technical workers 10,738 8,421 2,642 11,863 7,838 13,534 n/a 9,480 51,010 11,416 14,441
• Skilled workers 5,369 3,921 1,104 7,942 3,199 8,445 4,045 4,701 29,121 4,281 7,538
• Unskilled workers 3,803 1,444 698 2,496 1,685 4,902 n/a 2,648 12,899 2,414 3,822
Average wage burden as percentage of gross salary
78 86 65 75 89 70 75 81 82 83 77.8
Interest rate (percent) 9 16 n/a 7 n/a 7 7 18 10 n/a 10.7
Table 43: Operating costs: Tourism (Hotels)
Gha
na
Ken
ya
Mad
agas
car
Mal
i
Moz
ambi
que
Sene
gal
Tanz
ania
Sout
h A
fric
a
Mau
ritiu
s
Ave
rage
Annual gross salary (in USD)
• Managers 4,295 19,156 21,272 30,438 29,396 27,645 30,379 38,111 42,164 26,984
• Professionals 6,085 10,950 7,828 10,933 13,092 16,396 27,223 43,974 30,685 18,574
• Technical workers 2,021 5,196 1,916 6,325 6,214 12,239 17,941 21,889 7,301 9,005
• Skilled workers 1,678 2,465 1,009 2,888 2,588 4,794 4,644 12,508 4,575 4,128
• Unskilled workers 1,275 1,274 706 1,545 1,932 2,287 2,654 6,078 2,452 2,245
Average wage burden as percentage of gross salary
88.0 85.0 61.6 78.7 61.1 71.6 74.3 70.3 78.0 74
Interest rate (percent) n/a 13.8 15.9 12.3 6.6 8.5 6.1 10.5 12.0 11
SNAPSHOT AFRICA - GHANA ��
Appendix IV: The Ghana Investment Promotion Centre
The Ghana Investment Promotion Centre (GIPC) is a government agency, re-established under the Ghana Investment Promotion Centre Act, 1994 (Act 478), with the objectives of encouraging and promoting investment in the Ghanaian economy and co-ordination and monitoring of all investment activities under Act 478. Its primary work is focused on enhancing Ghana’s pro-business climate, stimulating foreign and local investment, providing information on business oppor-tunities and sources of investment capital, identifying investment opportunities, organizing promotional activities, and serving as a one-stop liaison between investors and government agencies. GIPC is admin-istered by an eight-member board of directors, the majority of whom are from the private sector. The man-agement team, comprising the Chief Executive, Mrs. Ruth Nyakotey, (Acting) and five Divisional Directors are responsible for the day-to-day administration of the Centre. The GIPC is a government agency responding to the Ministry of Ministry of Trade, Industry, Private Sector and the Presidents Special Initiative, with direct links to the President of Ghana.
(Source: GIPC , UNCTAD)
The Ghana Investment Promotion Centre (GIPC)PSC Building P.O. Box M.193 Accra, Ghana Tel: +220.4.377.377 Fax: +220.4.377.379 www.gipc.org.gh [email protected]
SNAPSHOT AFRICA - GHANA
www.miga.org