smoothness assessment of corneal stromal surfaces
TRANSCRIPT

LABORATORY SCIENCE
Smoothness asse
ssment of cornealstromal surfacesAnca Marian, PhD, Ossama Nada, MD, FRCS(G), PhD, Francois L�egar�e, PhD, Jean Meunier, PhD,Francois Vidal, PhD, S�ebastien Roy, PhD, Isabelle Brunette, MD, FRCSC, Santiago Costantino, PhD
Q
P
118
2012 Aublished
PURPOSE: To assess the accuracy of the scanning electron microscopy (SEM) and present alter-native approaches to quantify surface roughness based on numerical analysis.
SETTING: Department of Ophthalmology, Maisonneuve-Rosemont Hospital, University of Montreal,Montreal, Quebec, Canada.
DESIGN: Experimental study.
METHODS: Lamellar stromal cuts were performed on human corneas using a femtosecond laser ora microkeratome. The photodisrupted stromal surfaces were processed for SEM, and images wereacquired at �1000 magnification. First, images were evaluated by independent observers. Second,images were analyzed based on first-order and second-order statistics of gray-level intensities.Third, 3-dimensional (3-D) surface reconstructions were generated from pairs of SEM imagesacquired at 2 angles.
RESULTS: Results show that traditional assessment of roughness based on evaluating SEM imagesby independent observers can be replaced by computer-image texture analysis; an algorithm wasdeveloped to avoid subjective and time-consuming observations. The 3-D reconstructions allowedadditional characterization of surface properties that was not possible with SEM images alone.Significant fluctuations in surface height were lost, although they could be retrieved using 3-Dreconstructions.
CONCLUSIONS: Image texture analysis allowed objective and repeatable assessment of stromalsurface roughness; however, full assessments of surface-height fluctuations required 3-Dreconstruction. These complementary methodologies offer a more comprehensive assessmentof corneal surface roughness in clinical applications.
Financial Disclosure: No author has a financial or proprietary interest in any material or methodmentioned.
J Cataract Refract Surg 2013; 39:118–127 Q 2012 ASCRS and ESCRS
Supplemental material available at www.jcrsjournal.org.
Whether performedwith a laser or mechanically usinga blunt dissector, a blade, or amicrokeratome, lamellardissection of the cornea has become routine practicefor corneal surgeons worldwide. The 20 330 lamellarcorneal transplants reported in 2010 by the Eye BankAssociation of America1 and the 700 000 laser in situkeratomileusis surgeries performed every year in theUnited States2 illustrate well the wide acceptance ofthis practice. Surface smoothness appears to be oneof the most important parameters in assessing thequality of a lamellar stromal cut. A smooth surface isbelieved to ensure a more uniform interface, withless scarring, improved light transmission, greater
SCRS and ESCRS
by Elsevier Inc.
contrast sensitivity, less optical aberrations, and over-all better vision.3–7
Scanning electron microscopy (SEM) images arecommonly used to assess the smoothness of a corneallamellar cut generated using a new surgical techniqueor new laser parameters. Most frequently, the degreeof roughness of SEM images is determined subjec-tively by 1 or more observers,8–11 sometimes using asa reference a series of 4 or more standard images12,13
or assigning scores based on the dissected surfacecharacteristics.14–18 In this context, numerical SEMimage analysis would bring an advantage in terms ofaccuracy, reproducibility, and speed of evaluating
0886-3350/$ - see front matter
http://dx.doi.org/10.1016/j.jcrs.2012.08.050
119LABORATORY SCIENCE: SMOOTHNESS OF CORNEAL STROMAL SURFACES
the quality of stromal cuts and optimizing new tech-nologies involving corneal dissections.
An interesting first objective approach used thestandard deviation (SD) of the gray levels in SEM im-ages as a quantitative estimation of corneal-surfaceroughness.8,19,20 However, a drawback of this ap-proach is that gray levels in SEM images reflect theamount of secondary electrons detected and not theheight of the surface. The amount of secondary elec-trons emitted in all directions by a homogeneouslymetal-coated SEM corneal sample largely dependson the angle subtended between the electron beamand the local sample surface and, as a first approxima-tion, the signal is inversely proportional to the cosineof such angle.21 Therefore, gray-level contrast is an in-dication of a change in height (i.e., local slope) ratherthan the height itself. Hence, the texture of a cornealimage is correlated with the surface roughness, evenif a roughness coefficient, in terms of surface height,cannot be simply calculated from single SEM images.
First-order and second-order statistics on gray levelsof SEM images can provide quantitative informationon surface roughness. In first-order statistics, eachpixel contained in the image is regarded individually.Mean values and SDs are calculated using the graylevels associatedwith each pixel and are used as imagedescriptors. Second-order statistics go a step further;pairs of pixels with a specified relative distance andangle are compared to characterize the texture of theimage. Second-order statistics basically provide infor-mation about the presence of different intensity pat-terns and their distribution inside the image.22
Submitted: January 18, 2012.Final revision submitted: August 10, 2012.Accepted: August 12, 2012.
From theMaisonneuve-RosemontHospital ResearchCenter (Marian,Nada, Brunette, Costantino), theDepartment ofMathematics andSta-tistics (Meunier, Roy), University of Montreal, and the Department ofOphthalmology (Meunier, Brunette, Costantino), University ofMontreal,Montreal, Quebec, and the Institut National de la RechercheScientifique–�Energie, Mat�eriaux et T�el�ecommunications (Marian,L�egar�e, Vidal), Varennes, Quebec, Canada.
Supported by the Canadian Institutes of Health Research, the FRSQResearch in Vision Network, the Canadian National Institute for theBlind, and the Fond de Recherche en Ophtalmologie de l’Universit�ede Montr�eal.
Christophe Chabanier and Miguel Chagnon provided technicalsupport.
Corresponding author: Santiago Costantino, PhD, Department ofOphthalmology, Maisonneuve-Rosemont Hospital, 5415 boulevardde L’Assomption, Montreal, Quebec, H1T 2M4 Canada. E-mail:[email protected].
J CATARACT REFRACT SURG -
The goal of this study was to improve the analysisof SEM images to obtain a quick and objectiveclassification of corneal roughness. We first presentmethodologies based on numerical texture analysesof SEM images to obtain such information. Thisapproach provides objectivity and repeatability,avoiding intraobserver and interobserver variabilityassociated with human perception of roughness.Second, we show how 3-dimensional (3-D) reconstruc-tions of the corneal surface from stereo SEM imagescan be performed to quantify surface roughness.A comprehensive study of these techniques and theircorrelation with traditional subjective observations isalso presented.
MATERIALS AND METHODS
Corneal Sample Preparation
Human globes unsuitable for transplantation were ob-tained from the local eye bank (Banque d'Yeux du Qu�ebec,Montreal, Quebec, Canada) within 24 hours afterdeath and preserved at 4�C in a humid chamber for a maxi-mum of 48 hours. Corneas were mechanically deepithelial-ized, and a stromal lamellar dissection was performed witha femtosecond laser (n Z 22 samples) or a microkeratome(n Z 12 samples).
For the laser lamellar cuts, globes were placed in a holderwith an 18.0mmdiameter round opening and pressurized at18 mm Hg by injecting saline into the vitreous. An applana-tion suction ring was applied to the anterior surface of thecornea, and saline solution was pipetted to maintain humid-ity of the surface. A femtosecond laser (Visumax, Carl ZeissMeditec AG)was used to perform an 8.0mmdiameter lamel-lar cut at an intended depth of 220 mm from the anterior sur-face; the cut had a superior hinge. The flap was then excisedand the corneoscleral button dissected and fixed in 10%formaldehyde.
For microkeratome lamellar cuts, the corneoscleral but-tons were dissected and mounted on an artificial chamber(ALTK/DSAEK CBm microkeratome system, Moria). A300 mm footplate was used to cut a free cap. First-use andsecond-use blades were used to obtain a wider range of sur-face quality. After the cut, corneas were unmounted andfixed in 10% formaldehyde.
Scanning Electron Microscopy Images
A quarter of each corneoscleral button was processed forSEM. Tissues were rinsed, dehydrated in ascending concen-trations of ethanol (25%, 50%, 75%, and 100%), infiltratedwith 3 changes of hexamethyldisilazane, and dried over-night. Samples were then coated with a 20 nm layer ofgold by vacuum resistive thermal evaporation.
The stromal bed of each specimen was examined usinga scanning electron microscope (Jeol JSM-6300F, Jeol Ltd.)at 5 kV. Samples were placed on an xyz translation stage,which allowed tilt with respect to the beam axis. Different re-gions were visualized on each sample using a �1000 magni-fication and 15.0 mm working distance. This magnificationwas chosen to match that in previous studies in whichSEM images were used to judge corneal surface
VOL 39, JANUARY 2013
120 LABORATORY SCIENCE: SMOOTHNESS OF CORNEAL STROMAL SURFACES
quality.8,12,20,23 All SEM images had a 100 nm/pixel scaleand were saved in an 8-bit format.
Stereoscopic pairs of SEM images were then acquired for3-D reconstruction of the corneal surfaces. Two images ofthe same region captured from 2 opposite angles were ac-quired by tilting the sample �3 degrees and C3 degreeswith respect to the electron beam axis.
Surface Roughness Grading Based on HumanPerception
A set of 17 SEM images representing a wide range ofcorneal-surface-roughness levels were presented to 60observers who agreed to respond and would provide sta-tistically significant data. From these answers, the onesthat contained logical mistakes (eg, omission or repeti-tions) were discarded, yielding 52 responses for theanalysis.
The 17 images were selected from a larger set, regardlessof whether they were obtained from the same samples, andconsidering that the goal was to have a large variety interms of roughness for testing purposes rather than classi-fying these particular samples. Micrographs were assem-bled randomly in a single picture, which allowed anensemble view of all samples (Supplement A, available athttp://jcrsjournal.org). The observers were asked to sortthe images according to perceived levels of surface rough-ness, from the roughest to the smoothest. These observa-tions were treated as votes. Voters assigned to imagesa relative roughness rank, and each image received52 votes. For each cornea, the average position assignedby voters was calculated and a consensus ranking wascomputed by sorting the mean value of the voted position.Observers were blinded to the conditions under which the
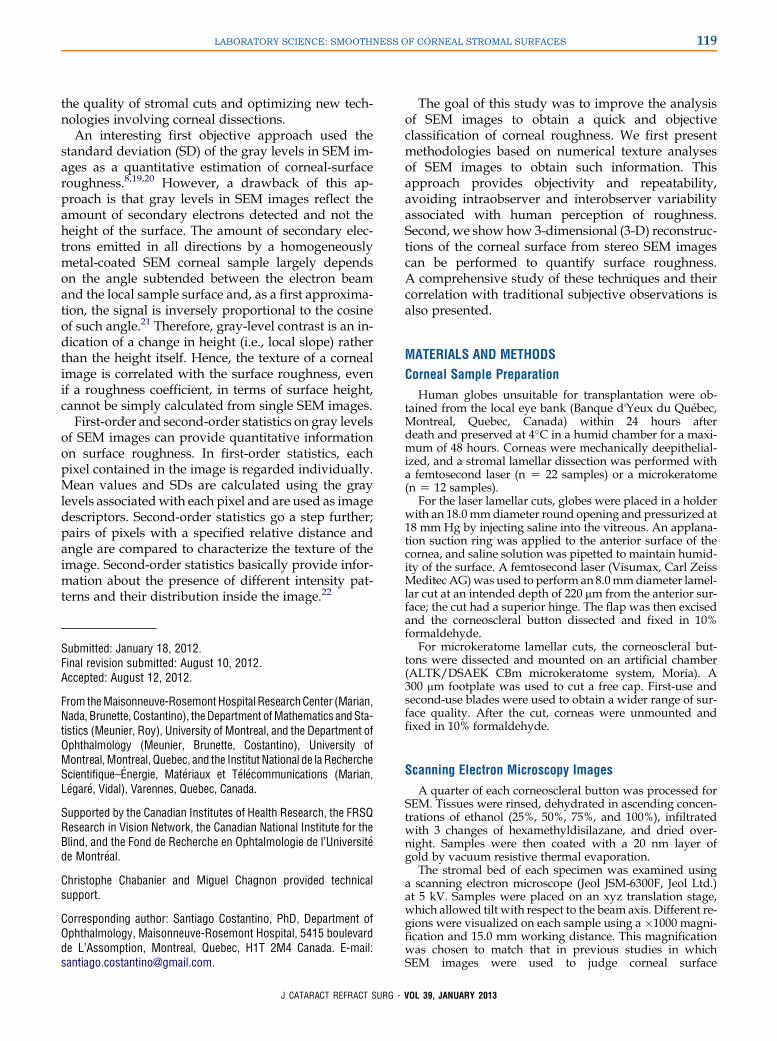
Figure 1.Corneal dissection images. Six of the 17 SEM images provided to tThese representative images illustrate the range of surface roughness presintermediate samples (middle column), and 2 smooth samples (right columntallic coatings and variation in the electron-gun intensity between batches,Nevertheless, these background variations did not affect the image statist
J CATARACT REFRACT SURG -
corneas were processed. Figure 1 shows 6 images represen-tative of the surface roughness range observed in themontage.
Numerical Analysis of 2-Dimensional ScanningElectron Microscopy Images
The quantitative analysis of first-order (single-pixel) andsecond-order (pairs of pixels) statistics of pixel intensitieswas implemented to classify the SEM images using Matlabsoftware (Mathworks, Inc.). First-order statistics consistedof calculating the SD of the gray-level intensites of eachSEM image. For second-order statistics, the method wasbased on the calculation of the gray-level co-occurrence ma-trix (GLCM) proposed by Haralick et al.22 The GLCM de-scribes intensity spatial distribution of the pixels in animage and is obtained by calculating how often differentcombinations of pixel-pair intensities are found for a givendistance (d) and direction between pixels. To build theGLCM, all possible pixel-pair intensity combinations (i, j)distant by d in the image are considered. The total numberof these combinations is determined by the number of graylevels of the image, and the total number of pixel pairs sep-arated by d (called further GLCM distance) in a set directionare counted for each (i, j). Each particular direction and dis-tance d determines a unique GLCM, which is typically nor-malized to express probability.
Among the 14 parameters initially proposed by Haralicket al.,22 contrast was chosen and analyzed as a descriptorof roughness in this study as follows:
ContrastZXN�1
i;j
ði� jÞ2 pði; jÞ
he 52 independent observers for assessing corneal surface roughness.ent in the montage of 17. Shown are 2 rough samples (left column), 2). The differences in image background are due to differences in me-despite constant contrast and brightness settings of the microscope.ics used in this study or the 3-D reconstruction.
VOL 39, JANUARY 2013
121LABORATORY SCIENCE: SMOOTHNESS OF CORNEAL STROMAL SURFACES
where p(i, j) is the GLCM component for intensity pair (i, j).Images were converted to 128 intensity levels and for eachdistance, ranging from 1 to 800 pixels (0.1 to 80 mm), the con-trast values obtained for 0 degrees, 45 degrees, 90 degrees,and 135 degrees were averaged.
First, the SD of the gray levels for each of the 17 SEMimages as well as the Haralick texture contrast were calcu-lated. The GLCMs were computed for each image, and thecontrast was plotted as a function of the GLCM distance.Second, whether human perception of roughness wascorrelated with first-order and second-order statistics wastested.
SurfaceRoughnessGradingBased on 3-DimensionalReconstructions
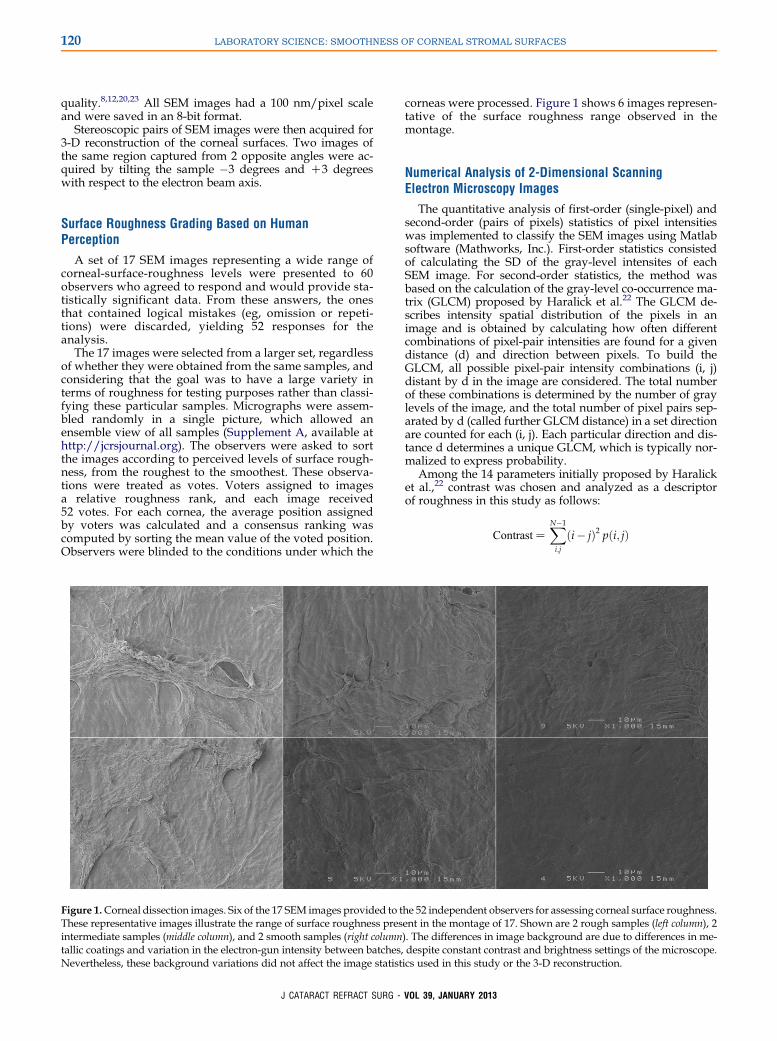
Figure 2. Human perception of surface roughness of corneal sur-faces. All SEM images were obtained with identical microscope set-tings. Dispersion of the subjective ranking. Each of the 52 observersranked all 17 images, from the roughest to the smoothest. The centralmark of the boxes identifies themedian. The length of the boxes is theinterquartile range (IQR). Values more than 3 IQRs from the end ofa box are labeled as outliers (C). The consensus ranking representsthe mean of all 52 votes positions by the observers to each of the 17images sorted in ascending order. Very rough images (bottom of theranking) and very smooth images (top of the ranking) showed a lowdispersion of votes, while images with intermediate roughnessshowed significant variations.
Three-dimensional reconstructions were performed forthe 17 samples. A custom algorithm developed using Math-ematica (Wolfram Research, Inc.) was used to calculate the3-D height map of each surface using stereo pairs of SEMimages.24 This was an extension of a previous work25 inwhich the strict constraints on sample positioning (manualalignment of the eucentric points, tilt axis, and preciseknowledge of tilt angles and working distance) were allevi-ated by automatically finding an average depth planethrough the sample.
For that purpose, a set of similar points was automaticallyidentified in the stereo images and the coordinates of thesematching points were extracted. These correspondencesyielded a linear transformation T, which modeled geometri-cally the tilt movement of the microscope stage. By register-ing the stereo images with the transformation T, a referenceplane for the subsequent measurement of heights wasobtained.
When comparing the registered stereo images, becausethe original sample was not planar, any depth deviation(from the reference plane) showed up as a residual dis-placement (or disparity) of any corresponding pair ofpixels. To ease computation, the images were also rotatedto make these displacements horizontal to establisha dense stereo matching step with an appropriate algo-rithm.26 The resulting horizontal disparity map (i.e., thedifferences between the horizontal coordinates of thematching points in the stereo images) was finally con-verted into heights according to the acquisition parame-ters of tilt angle, magnification, and working distance.Missing or hidden pixels were estimated by interpolation.A full elevation map was computed for all samples. A cal-ibration test was performed using as reference samplea holographic replica grating (13.33 mm step and 4.63 mmheight), and the reconstructed surface was comparedwith manufacturer specifications. This calibration alsoprovided precise information about the size of the pixelin the SEM images.
Statistical Analysis
The Pearson correlation coefficient (r) was calculated tostudy the association between roughness values obtainedwith the 3 objective methods. The Spearman rank correla-tion coefficient (r) was used to study the association be-tween the ranking obtained with the different objectivemethods and subjective methods. A P value less than 0.05was considered statistically significant. The analyses were
J CATARACT REFRACT SURG -
performed using SPSS software (version 19, SPSS, Inc.)and Matlab software.
RESULTS
Human Perception of Roughness
The boxplot in Figure 2 shows the distribution of theobservers' votes. The size of the boxes represents theinterquartile range and reflects the dispersion of votes,which is lower at the extremes of the ranking andmuch larger in the intermediate positions, indicatingbetter agreement between observers at the extremesof the ranking.
Numerical Analysis of Scanning ElectronMicroscopy Images
Table 1 shows the results of the SD and texture con-trast calculations. A high value of these parameters isgenerally associated with a high roughness of thesample.
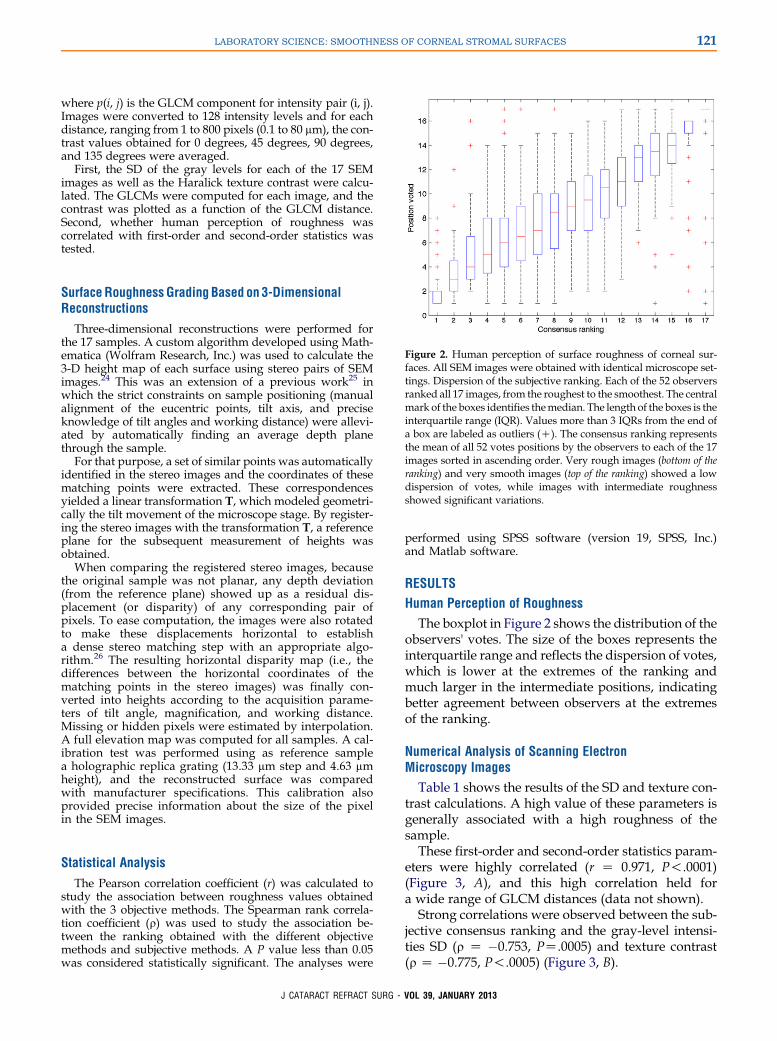
These first-order and second-order statistics param-eters were highly correlated (r Z 0.971, P!.0001)(Figure 3, A), and this high correlation held fora wide range of GLCM distances (data not shown).
Strong correlations were observed between the sub-jective consensus ranking and the gray-level intensi-ties SD (r Z �0.753, PZ.0005) and texture contrast(r Z �0.775, P!.0005) (Figure 3, B).
VOL 39, JANUARY 2013
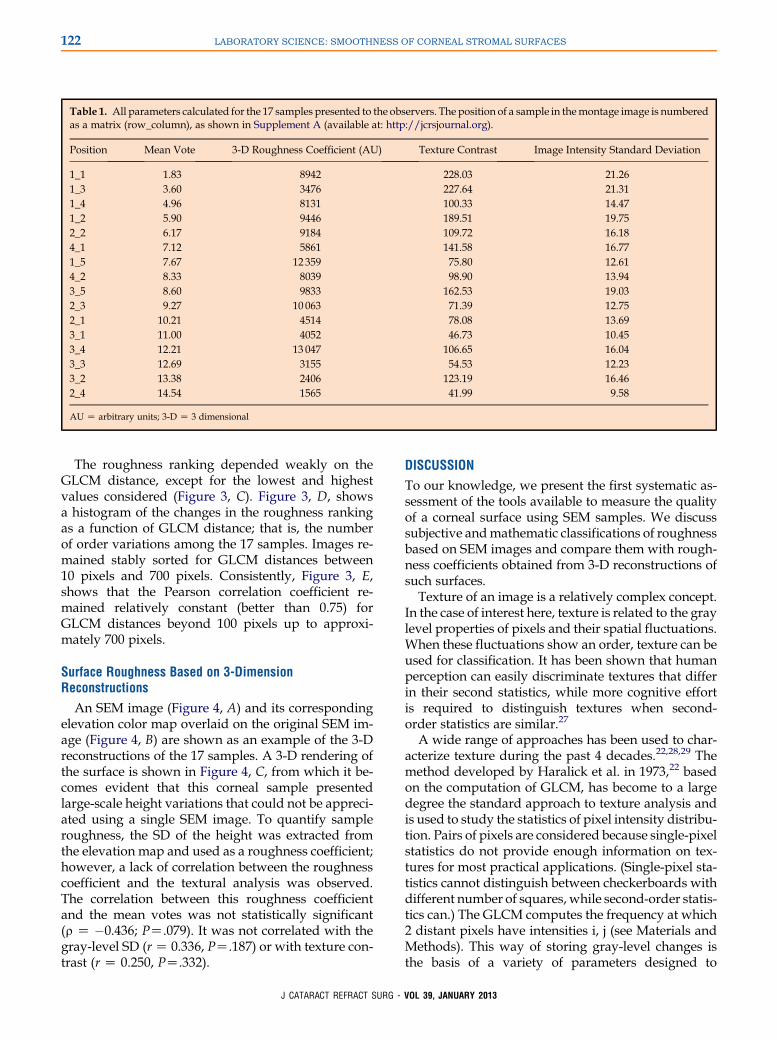
Table 1. All parameters calculated for the 17 samples presented to the observers. The position of a sample in themontage image is numberedas a matrix (row_column), as shown in Supplement A (available at: http://jcrsjournal.org).
Position Mean Vote 3-D Roughness Coefficient (AU) Texture Contrast Image Intensity Standard Deviation
1_1 1.83 8942 228.03 21.261_3 3.60 3476 227.64 21.311_4 4.96 8131 100.33 14.471_2 5.90 9446 189.51 19.752_2 6.17 9184 109.72 16.184_1 7.12 5861 141.58 16.771_5 7.67 12 359 75.80 12.614_2 8.33 8039 98.90 13.943_5 8.60 9833 162.53 19.032_3 9.27 10 063 71.39 12.752_1 10.21 4514 78.08 13.693_1 11.00 4052 46.73 10.453_4 12.21 13 047 106.65 16.043_3 12.69 3155 54.53 12.233_2 13.38 2406 123.19 16.462_4 14.54 1565 41.99 9.58
AU Z arbitrary units; 3-D Z 3 dimensional
122 LABORATORY SCIENCE: SMOOTHNESS OF CORNEAL STROMAL SURFACES
The roughness ranking depended weakly on theGLCM distance, except for the lowest and highestvalues considered (Figure 3, C). Figure 3, D, showsa histogram of the changes in the roughness rankingas a function of GLCM distance; that is, the numberof order variations among the 17 samples. Images re-mained stably sorted for GLCM distances between10 pixels and 700 pixels. Consistently, Figure 3, E,shows that the Pearson correlation coefficient re-mained relatively constant (better than 0.75) forGLCM distances beyond 100 pixels up to approxi-mately 700 pixels.
Surface Roughness Based on 3-DimensionReconstructions
An SEM image (Figure 4, A) and its correspondingelevation color map overlaid on the original SEM im-age (Figure 4, B) are shown as an example of the 3-Dreconstructions of the 17 samples. A 3-D rendering ofthe surface is shown in Figure 4, C, from which it be-comes evident that this corneal sample presentedlarge-scale height variations that could not be appreci-ated using a single SEM image. To quantify sampleroughness, the SD of the height was extracted fromthe elevation map and used as a roughness coefficient;however, a lack of correlation between the roughnesscoefficient and the textural analysis was observed.The correlation between this roughness coefficientand the mean votes was not statistically significant(r Z �0.436; PZ.079). It was not correlated with thegray-level SD (rZ 0.336, PZ.187) or with texture con-trast (r Z 0.250, PZ.332).
J CATARACT REFRACT SURG -
DISCUSSION
To our knowledge, we present the first systematic as-sessment of the tools available to measure the qualityof a corneal surface using SEM samples. We discusssubjective andmathematic classifications of roughnessbased on SEM images and compare them with rough-ness coefficients obtained from 3-D reconstructions ofsuch surfaces.
Texture of an image is a relatively complex concept.In the case of interest here, texture is related to the graylevel properties of pixels and their spatial fluctuations.When these fluctuations show an order, texture can beused for classification. It has been shown that humanperception can easily discriminate textures that differin their second statistics, while more cognitive effortis required to distinguish textures when second-order statistics are similar.27
A wide range of approaches has been used to char-acterize texture during the past 4 decades.22,28,29 Themethod developed by Haralick et al. in 1973,22 basedon the computation of GLCM, has become to a largedegree the standard approach to texture analysis andis used to study the statistics of pixel intensity distribu-tion. Pairs of pixels are considered because single-pixelstatistics do not provide enough information on tex-tures for most practical applications. (Single-pixel sta-tistics cannot distinguish between checkerboards withdifferent number of squares, while second-order statis-tics can.) The GLCM computes the frequency at which2 distant pixels have intensities i, j (see Materials andMethods). This way of storing gray-level changes isthe basis of a variety of parameters designed to
VOL 39, JANUARY 2013
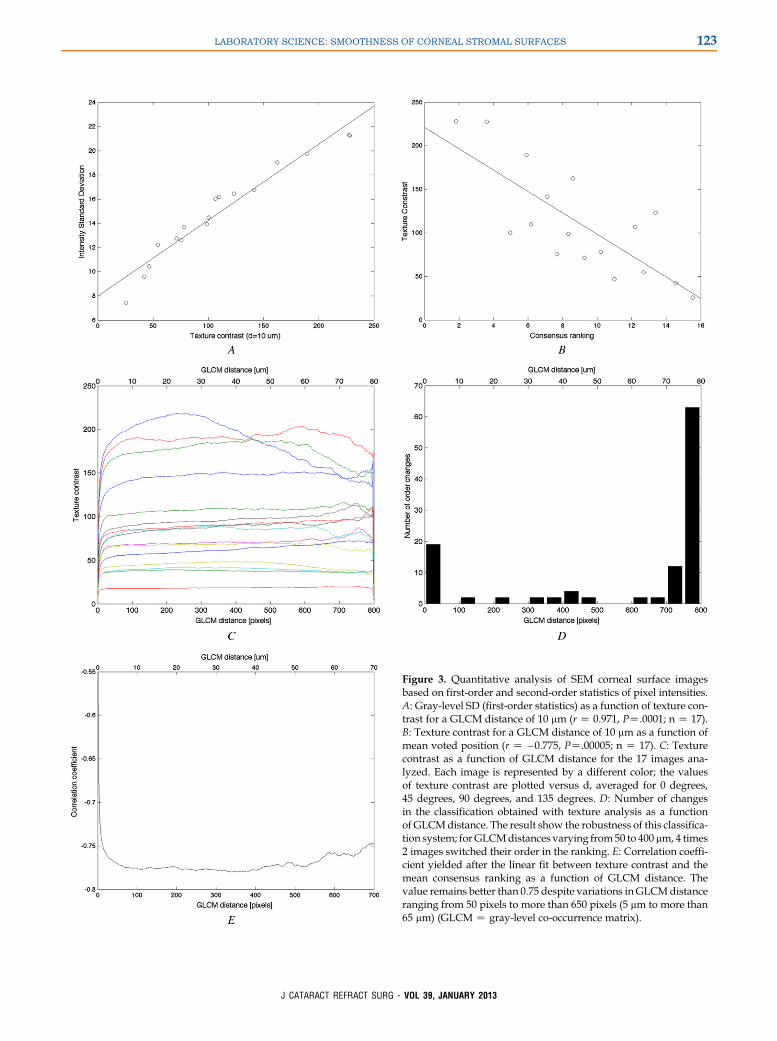
Figure 3. Quantitative analysis of SEM corneal surface imagesbased on first-order and second-order statistics of pixel intensities.A: Gray-level SD (first-order statistics) as a function of texture con-trast for a GLCM distance of 10 mm (r Z 0.971, PZ.0001; n Z 17).B: Texture contrast for a GLCM distance of 10 mm as a function ofmean voted position (r Z �0.775, PZ.00005; n Z 17). C: Texturecontrast as a function of GLCM distance for the 17 images ana-lyzed. Each image is represented by a different color; the valuesof texture contrast are plotted versus d, averaged for 0 degrees,45 degrees, 90 degrees, and 135 degrees. D: Number of changesin the classification obtained with texture analysis as a functionof GLCMdistance. The result show the robustness of this classifica-tion system; for GLCMdistances varying from50 to 400 mm, 4 times2 images switched their order in the ranking. E: Correlation coeffi-cient yielded after the linear fit between texture contrast and themean consensus ranking as a function of GLCM distance. Thevalue remains better than 0.75 despite variations in GLCMdistanceranging from 50 pixels to more than 650 pixels (5 mm to more than65 mm) (GLCM Z gray-level co-occurrence matrix).
123LABORATORY SCIENCE: SMOOTHNESS OF CORNEAL STROMAL SURFACES
J CATARACT REFRACT SURG - VOL 39, JANUARY 2013
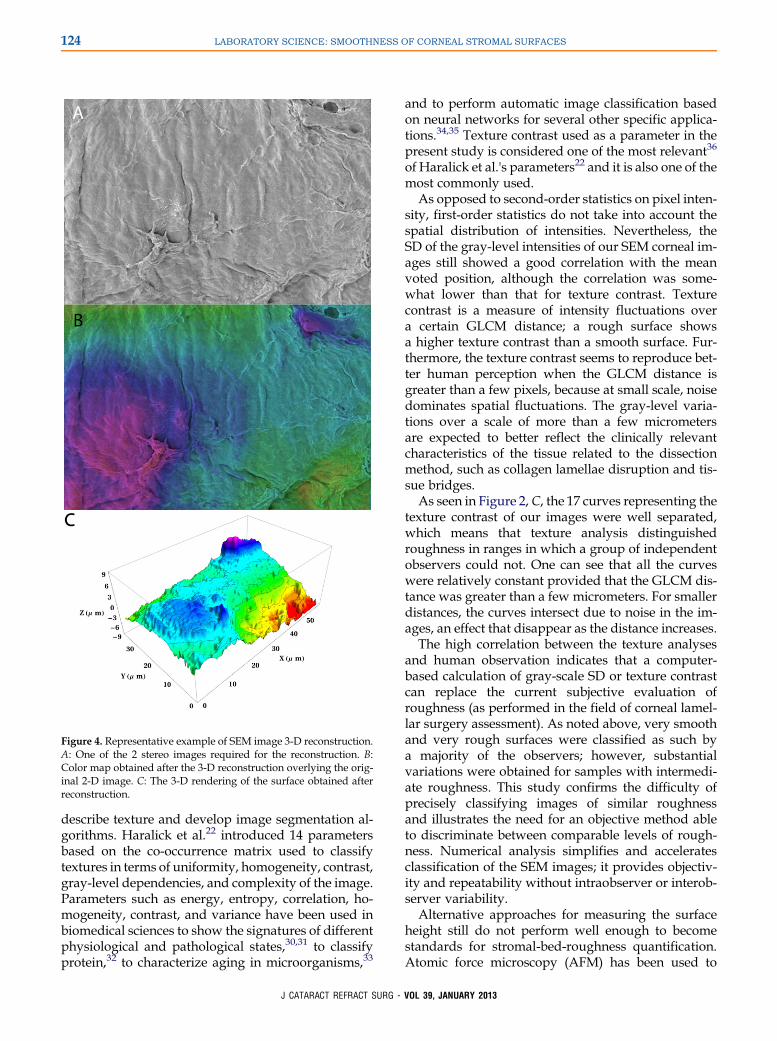
Figure 4. Representative example of SEM image 3-D reconstruction.A: One of the 2 stereo images required for the reconstruction. B:Color map obtained after the 3-D reconstruction overlying the orig-inal 2-D image. C: The 3-D rendering of the surface obtained afterreconstruction.
124 LABORATORY SCIENCE: SMOOTHNESS OF CORNEAL STROMAL SURFACES
describe texture and develop image segmentation al-gorithms. Haralick et al.22 introduced 14 parametersbased on the co-occurrence matrix used to classifytextures in terms of uniformity, homogeneity, contrast,gray-level dependencies, and complexity of the image.Parameters such as energy, entropy, correlation, ho-mogeneity, contrast, and variance have been used inbiomedical sciences to show the signatures of differentphysiological and pathological states,30,31 to classifyprotein,32 to characterize aging in microorganisms,33
J CATARACT REFRACT SURG -
and to perform automatic image classification basedon neural networks for several other specific applica-tions.34,35 Texture contrast used as a parameter in thepresent study is considered one of the most relevant36
of Haralick et al.'s parameters22 and it is also one of themost commonly used.
As opposed to second-order statistics on pixel inten-sity, first-order statistics do not take into account thespatial distribution of intensities. Nevertheless, theSD of the gray-level intensities of our SEM corneal im-ages still showed a good correlation with the meanvoted position, although the correlation was some-what lower than that for texture contrast. Texturecontrast is a measure of intensity fluctuations overa certain GLCM distance; a rough surface showsa higher texture contrast than a smooth surface. Fur-thermore, the texture contrast seems to reproduce bet-ter human perception when the GLCM distance isgreater than a few pixels, because at small scale, noisedominates spatial fluctuations. The gray-level varia-tions over a scale of more than a few micrometersare expected to better reflect the clinically relevantcharacteristics of the tissue related to the dissectionmethod, such as collagen lamellae disruption and tis-sue bridges.
As seen in Figure 2, C, the 17 curves representing thetexture contrast of our images were well separated,which means that texture analysis distinguishedroughness in ranges in which a group of independentobservers could not. One can see that all the curveswere relatively constant provided that the GLCM dis-tance was greater than a few micrometers. For smallerdistances, the curves intersect due to noise in the im-ages, an effect that disappear as the distance increases.
The high correlation between the texture analysesand human observation indicates that a computer-based calculation of gray-scale SD or texture contrastcan replace the current subjective evaluation ofroughness (as performed in the field of corneal lamel-lar surgery assessment). As noted above, very smoothand very rough surfaces were classified as such bya majority of the observers; however, substantialvariations were obtained for samples with intermedi-ate roughness. This study confirms the difficulty ofprecisely classifying images of similar roughnessand illustrates the need for an objective method ableto discriminate between comparable levels of rough-ness. Numerical analysis simplifies and acceleratesclassification of the SEM images; it provides objectiv-ity and repeatability without intraobserver or interob-server variability.
Alternative approaches for measuring the surfaceheight still do not perform well enough to becomestandards for stromal-bed-roughness quantification.Atomic force microscopy (AFM) has been used to
VOL 39, JANUARY 2013

125LABORATORY SCIENCE: SMOOTHNESS OF CORNEAL STROMAL SURFACES
probe elevations in corneal surfaces with nanometeraccuracy.37–40 This technology does not require samplepreparation; however, the tradeoff for high-accuracymeasurements of elevation is the lower field of viewobtained using this imaging modality. Areas of ap-proximately 100 mm2 � 100 mm2 can be scanned, pro-vided the elevations on the surface do not surpass5 mm. These parameters make AFM a useful tool toprobe local roughness with very high accuracy inrelatively flat regions; however, AFM remains inade-quate for global estimations of the quality of stromalsurfaces generally featuring awide range of elevations.Conversely, optical coherence tomography (OCT) canimage large corneal surfaces, but with insufficient res-olution. Research-laboratory OCT configurations candetermine the height of a surface with submicrometricresolution in the axial direction41,42; however, the reso-lution in the perpendicular direction is usually limitedto several micrometers.43,44 Fine details that are impor-tant for assessing surface quality, such as stromal fibrilsandtissuebridges,whichare typicallysmaller than10mm,cannot be resolved with this technique.
When an SEM image is acquired, the atoms of thesample surface interact with the high-energy electronsof a scanning beam. Low-energy secondary electronsresulting from inelastic scattering are collected by a de-tector, and the signal is displayed as a 2-dimensional(2-D) intensity distribution map. Usually, the electronbeam enters the sample perpendicular to the sampleholder surface and secondary electrons are collectedby a detector oriented at a certain angle.
Gray levels in SEM images are determined by theamount of secondary electrons collected by the detec-tor. The image contrast depends on a series of vari-ables that are not exclusively related to thetopography of the surface. Although the narrow elec-tron beam allows a very large depth of focus, varia-tions in the angle subtended by the sample and thebeam induce changes in the number of secondary elec-trons collected. Because of this angular dependence ofthe signal, small structures and cracks become evidentwhile small gradients in the height of the sample arebarely visible.
The roughness coefficient in the 3-D images was cal-culated as the SD of the height extracted from the ele-vation map; however, poor or no correlations werefound when these coefficients were compared withtexture analysis and human observation. This showsthat the real topography of the surfaces was not thesame as that perceived from standard SEM images.
The 3-D reconstructions did not reproduce thefine details visible in SEM images. These detailswere too small compared to the resolution of the recon-structions or, in most cases, did not correspond to sig-nificant changes in height. The stereo reconstruction
J CATARACT REFRACT SURG -
algorithms require that when observed from 2 differ-ent angles, the features in the sample become dis-placed and the magnitude of this displacement isused to assign a surface elevation. Hence, a large frac-tion of the details that can be visually noted in 2-DSEM images correspond to changes in height too shal-low to be detected by the 3-D reconstruction at thismagnification.
There are 2main types of errors in the reconstructionof 3-D height maps. One is local and induced by pointmatching errors during the dense stereo-matchingstep. These errors showup as noise added to the heightmaps that could be reduced by low-pass filtering or bytuning the stereo-matching parameters (eg, cost func-tion of the Hirschmuller algorithm26). The secondtype is global and induced by errors in tilting of thespecimen. The deviation between the actual tiltingand the intended tilting results in a scaling of theheight map that is proportional to the angular differ-ence; thus, the 3-D relief is fully preserved. Any othermisplacement of the specimen (eg, alignment of theeucentric points) does not affect the height map be-cause transformation T will account for them.
On the other hand, standard SEM images did notdiscriminate the wide change in height documentedby the 3-D reconstructions. This is explained by thefact that the long working distance of SEM is suchthat large changes in surface elevation (tens of mi-crometers) still appear in focus. Although these largefluctuations in elevation are strikingly revealed in3-D reconstructions, in the 2-D images they appearto be masked by small fractures and gaps. Thus,the lack of correlation between roughness coeffi-cients computed from 3-D reconstructions with alter-native methods is not surprising. These coefficientsare dominated by large changes in elevation thatcannot be detected in 2-D SEM as major gray-levelchanges.
Stereo-imaging and 3-D reconstruction proceduresare more time consuming than standard 2-D SEM,both at the experimental and processing levels. Also,open-source robust algorithms for 3-D reconstructionsare not user friendly for standard vision science re-search groups. Our software is open source and avail-able on request.
Elevations on the order of tens of micrometers mayarise from the shrinkage and other modifications thatoccur during the sample processing for SEM andmight complicate the assessment of the qualityobtained by the laser or the microkeratome. This dis-advantage of using SEM images can sometimes beoverlooked, and other techniques such as environmen-tal SEM or AFM, in which no preimaging sample pro-cessing is required, could be envisaged for moreprecise quantitative description of the surface quality.
VOL 39, JANUARY 2013
126 LABORATORY SCIENCE: SMOOTHNESS OF CORNEAL STROMAL SURFACES
That gray levels in 2-D images correspond to theslope rather than the height of the sample surfacehas an impact on the interpretation of SEM images,and our study sheds light on this issue. The simple ob-servation of corneal-surface SEM images does not cor-relate with roughness following a classic definition;that is, in terms of the SD of the surface elevation. Nev-ertheless, corneal surgeons typically assess the spatialdistribution of these irregularities on the surface,which we show can be quantified by simple textureanalysis algorithms and have clinically been shownto correlate with vision outcome.
In summary, we have shown that an automatedcomputation can provide the results that can be ob-tained by asking independent observers to assess theroughness of corneal surfaces. This computer-basedcalculation is objective, quantitative, much faster,and robust. In addition, we found that some 3-D infor-mation is lost when single standard SEM images areconsidered and that 3-D reconstructions provide com-plementary surface information. Large fluctuations insurface height that could be discovered and quantifiedusing 3-D reconstructions can be of much higher am-plitude than the ones that can be visually perceivedin standard 2-D images and sometimes dominate thecalculation of the roughness coefficient.
WHAT WAS KNOWN
� The standard method to evaluate the quality of lamellardissections is to grade SEM images in term of roughnessby independent observers. There is a lack of quantitativemethods based on the SEM image analysis allowing anobjective roughness assessment.
� Gray levels in SEM images do not reflect the height of thesurface; thus, color fluctuations cannot be correctly inter-preted by visual inspection only.
WHAT THIS PAPER ADDS
� A new quantitative method to assess stromal surfaceroughness based on the analysis of standard SEM imageswas developed. The method is fast, automatic, and unbi-ased, and the results are in agreement with the estima-tions obtained by visual inspection.
� For the first time, we performed 3-D reconstructions usingpairs of SEM images of such surfaces to obtain heightmaps that provide complementary information. We foundthat major surface fluctuations are not shown by the stan-dard 2-D analysis and that both approaches should becombined for a thorough characterization.
J CATARACT REFRACT SURG -
REFERENCES1. Eye Bank Association of America. 2009 Eye Banking Statistical
Report. Washington DC, Eye Bank Association of America,
2010; 1–17
2. American Academy of Ophthalmology. Eye Health Statistics at
a Glance. Am Academy Ophthalmol 2009. Available at: http://
www.aao.org/newsroom/press_kit/upload/Eye-Health-Statistics-
June-2009.pdf. Accessed August 20, 2012
3. G€uell JL, Velasco F, Roberts C, Sisquella MT, Mahmoud A.
Corneal flap thickness and topography changes induced by
flap creation during laser in situ keratomileusis. J Cataract
Refract Surg 2005; 31:115–119
4. Huang D, Arif M. Spot size and quality of scanning laser correc-
tion of higher-order wavefront aberrations. J Cataract Refract
Surg 2002; 28:407–416
5. Lim T, Yang S, Kim MJ, Tchah H. Comparison of the IntraLase
femtosecond laser and mechanical microkeratome for laser in
situ keratomileusis. Am J Ophthalmol 2006; 141:833–839
6. Tran DB, Sarayba MA, Bor Z, Garufis C, Duh Y-J, Soltes CR,
Juhasz T, Kurtz RM. Randomized prospective clinical study
comparing induced aberrations with IntraLase and Hansatome
flap creation in fellow eyes; potential impact on wavefront-
guided laser in situ keratomileusis. J Cataract Refract Surg
2005; 31:97–105
7. Vinciguerra P, Azzolini M, Airaghi P, Radice P, De Molfetta V.
Effect of decreasing surface and interface irregularities after
photorefractive keratectomy and laser in situ keratomileusis on
optical and functional outcomes. J Refract Surg 1998; 14:
S199–S203
8. Sarayba MA, Ignacio TS, Binder PS, Tran DB. Comparative
study of stromal bed quality by usingmechanical, IntraLase fem-
tosecond laser 15- and 30-kHz microkeratomes. Cornea 2007;
26:446–451
9. SaraybaMA,Maguen E, Salz J, Rabinowitz Y, Ignacio TS. Fem-
tosecond laser keratome creation of partial thickness donor cor-
neal buttons for lamellar keratoplasty. J Refract Surg 2007;
23:58–65
10. Nuzzo V, Aptel F, Savoldelli M, Plamann K, Peyrot D,
Deloison F, Donate D, Legeais J-M. Histologic and ultrastruc-
tural characterization of corneal femtosecond laser trephination.
Cornea 2009; 28:908–913
11. Jones YJ, Goins KM, Sutphin JE, Mullins R, Skeie JM. Compar-
ison of the femtosecond laser (IntraLase) versus manual micro-
keratome (Moria ALTK) in dissection of the donor in endothelial
keratoplasty; initial study in eye bank eyes. Cornea 2008; 27:
88–93
12. Cheng YYY, Kang SJ, Grossniklaus HE, Pels E, Duimel HJQ,
Frederik PM, Hendrikse F, Nuijts RMMA. Histologic evaluation
of human posterior lamellar discs for femtosecond laser Desce-
met’s stripping endothelial keratoplasty. Cornea 2009; 28:73–79
13. Sanka RK, Loft ES, Randleman JB. Effect of varying microkera-
tome parameters on laser in situ keratomileusis interface sur-
faces. J Cataract Refract Surg 2010; 36:493–496
14. Wilhelm FW, Giessmann T, Hanschke R, Duncker GI,
Wilhelm LH. Cut edges and surface characteristics produced
by different microkeratomes. J Refract Surg 2000; 16:690–700
15. Kunert KS, BlumM,Duncker GI, SietmannR, Heichel J. Surface
quality of human corneal lenticules after femtosecond laser sur-
gery for myopia comparing different laser parameters. Graefes
Arch Clin Exp Ophthalmol 2011; 249:1417–1424
16. Heichel J, Blum M, Duncker GIW, Sietmann R, Kunert KS. Sur-
face quality of porcine corneal lenticules after femtosecond len-
ticule extraction. Ophthalmic Res 2011; 46:107–112
VOL 39, JANUARY 2013
127LABORATORY SCIENCE: SMOOTHNESS OF CORNEAL STROMAL SURFACES
17. Mehta JS, Parthasarthy A, Por Y-M, Cajucom-Uy H,
Beuerman RW, Tan D. Femtosecond laser-assisted endothelial
keratoplasty; a laboratory model. Cornea 2008; 27:706–712
18. Hammer T, Hanschke R, W€orner I, Wilhelm FW. Evaluation of
four microkeratome models: quality and reproducibility of cut
edge and cut surface as determined by scanning electron
microscopy. J Refract Surg 2005; 21:454–462
19. Srinivasan S, Holmyard D. Corneal stromal bed quality obtained
with mechanical microkeratome and femtosecond laser [letter].
Cornea 2008; 27:746; reply by T Ignacio, 746�747
20. Sarayba MA, Ignacio TS, Tran DB, Binder PS. A 60 kHz Intra-
Lase femtosecond laser creates a smoother LASIK stromal
bed surface compared to a Zyoptix XP mechanical micro-
keratome in human donor eyes. J Refract Surg 2007; 23:
331–337
21. LaudateT. Imagingguidelines for scanningelectronmicroscopy.
AdvancedMaterials &Processes 2003; 161(7):23–25. Available
at: http://www.google.com/url?saZt&rctZj&qZimaging%
20guidelines%20for%20scanning%20electron%20microscopy&
sourceZweb&cdZ1&vedZ0CGEQFjAA&urlZhttp%3A%2F%
2Fwww.jeolusa.com%2FDesktopModules%2FBring2mind%
2FDMX%2FDownload.aspx%3FEntryId%3D614%26PortalId%
3D2%26DownloadMethod%3Dattachment&eiZagQyUO32EIa
69gS6iICwBg&usgZAFQjCNEhQkxcOWe986DJ01ltBoOctMm
9uw. Accessed August 20, 2012
22. Haralick RM, ShanmugamK, Dinstein I. Textural features for im-
age classification. IEEE Trans Systems Man Cybernetics 1973;
SMC-3:610–621.Availableat: http://dceanalysis.bigr.nl/Haralick
73-Textural%20features%20for%20image%20classification.
pdf. Accessed August 20, 2012
23. Behrens A, Seitz B, Langenbucher A, Kus MM, Rummelt C,
K€uchle M. Evaluation of corneal flap dimensions and cut quality
using a manually guided microkeratome. J Refract Surg 1999;
15:118–123; errata, 400
24. Roy S, Meunier J, Marian AM, Nada O, L�egar�e F, Vidal F,
Brunette I, Costantino S. Automatic 3D reconstruction of
quasi-planar stereo SEM images. Montreal, Quebec, Canada,
Universit�e de Montr�eal, D�epartement d’Informatique et de Re-
cherche Op�erationnelle, 2011; Technical Report number 1361
25. Ponz E, Ladaga JL, Bonetto RD. Measuring surface topography
with scanning electron microscopy. I. EZElmage: a program to
obtain 3D surface data. Microsc Microanal 2006; 12:170–177
26. Hirschm€ullerH.Accurateandefficient stereoprocessingbysemi-
global matching andmutual information. IEEEComputer Society
Conference on Computer Vision and Pattern Recognition 2005;
807�814. Available at: http://www.dlr.de/rm/en/PortalData/3/
Resources/papers/modeler/cvpr05hh.pdf. Accessed August 20,
2012
27. Julesz B. A theory of preattentive texture discrimination based
on first-order statistics of textons. Biol Cybern 1981; 41:131–138
28. Weszka JS, Dyer CR, Rosenfeld A. Comparative-study of tex-
ture measures for terrain classification. IEEE Trans Syst Man
Cybern 1976; SMC-6:269–285
29. Troy EB, Deutsch ES, Rosenfel A. Gray-level manipulation ex-
periments for texture analysis. IEEE Trans Syst Man Cybern
1973; SMC-3:91–98
30. Nielsen B, Albregtsen F, Danielsen HE. Statistical nuclear tex-
ture analysis in cancer research: a review of methods and appli-
cations. Crit Rev Oncog 2008; 14:89–164
J CATARACT REFRACT SURG -
31. KassnerA, Thornhill RE.Textureanalysis: a reviewof neurologic
MR imaging applications. Am J Neuroradiol 2010; 31:809–816
32. Nanni L, Shi J-Y, BrahnamS, Lumini A. Protein classification us-
ing texture descriptors extracted from the protein backbone im-
age. J Theor Biol 2010; 264:1024–1032
33. Shamir L, Wolkow CA, Goldberg IG. Quantitative measurement
of aging using image texture entropy. Bioinformatics 2009;
25:3060–3063. Available at: http://bioinformatics.oxford
journals.org/content/25/23/3060.full.pdf. Accessed August 20,
2012
34. Chebira A, Barbotin Y, Jackson C, Merryman T, Srinivasa G,
Murphy RF, Kova�cevi�c J. A multiresolution approach to auto-
mated classification of protein subcellular location images. BMC
Bioinformatics 2007; 8:210. Available at: http://www.ncbi.nlm.
nih.gov/pmc/articles/PMC1933440/pdf/1471-2105-8-210.pdf.
Accessed August 20, 2012
35. Hamilton NA, Pantelic RS, Hanson K, Teasdale RD. Fast auto-
mated cell phenotype image classification. BMC Bioinformatics
2007; 8:110. Available at: http://www.biomedcentral.com/
content/pdf/1471-2105-8-110.pdf. Accessed August 20, 2012
36. Baraldi A, Parmiggiani F. An investigation of the textural charac-
teristics associated with gray-level cooccurrence matrix statisti-
cal parameters. IEEE Trans Geosci Remote Sens 1995; 33:
293–304
37. N�ogr�adi A, Hopp B, R�ev�esz K, Szab�o G, Bor Z, Kolozsvari L.
Atomic force microscopic study of the human cornea following
excimer laser keratectomy. Exp Eye Res 2000; 70:363–368
38. Lydataki S, Lesniewska E, Tsilimbaris MK, Panagopoulou S, Le
Grimellec C, Pallikaris IG. Excimer laser ablated cornea
observedbyatomic forcemicroscopy.SingleMol 2002;3:141–147
39. Lombardo M, De Santo MP, Lombardo G, Barberi R, Serrao S.
Atomic force microscopy analysis of normal and photoablated
porcine corneas. J Biomech 2006; 39:2719–2724. Available
at: http://www.visioeng.it/documents/AFMJBiomechanics.pdf.
Accessed August 20, 2012
40. Lombardo M, De Santo MP, Lombardo G, Lomoriello DS,
Desiderio G, Ducoli P, Barberi R, Serrao S. Surface quality of
femtosecond dissected posterior human corneal stroma investi-
gated with atomic forcemicroscopy. Cornea 2012May 29 [Epub
ahead of print]
41. Costantino S, Mart�ınez OE, Torga JR. Wide band interferometry
for thickness measurement. Opt Express 2003; 11:952–957.
Available at: http://www.lec.df.uba.ar/administrator/components/
com_jresearch/files/publications/costantino_2003.pdf. Accessed
August 20, 2012
42. Singh K, Dion C, Costantino S,Wajszilber M, Lesk MR, Ozaki T.
Development of a novel instrument to measure the pulsatile
movement of ocular tissues. Exp Eye Res 2010; 91:63–68
43. Wagenblast PC, Ko TH, Fujimoto JG, Kaertner FX, Morgner U.
Ultrahigh-resolution optical coherence tomography with a di-
ode-pumped broadband Cr3C:LiCAF laser. Opt Express
2004; 12:3257–3263. Available at: http://www.opticsinfobase.
org/oe/abstract.cfm?uriZoe-12-14-3257. Accessed August
20, 2012
44. Drexler W, K€artner FX, Pitris C, Boppart SA, Li XD, Ippen EP,
Fujimoto JG. In vivo ultrahigh-resolution optical coherence to-
mography. Opt Lett 1999; 24:1221–1223. Available at: http://
www.uta.edu/rfmems/N_041101/Reference/85.pdf. Accessed
August 20, 2012
VOL 39, JANUARY 2013