smart remoteness and world-class non-motorised transport in alice springs
TRANSCRIPT
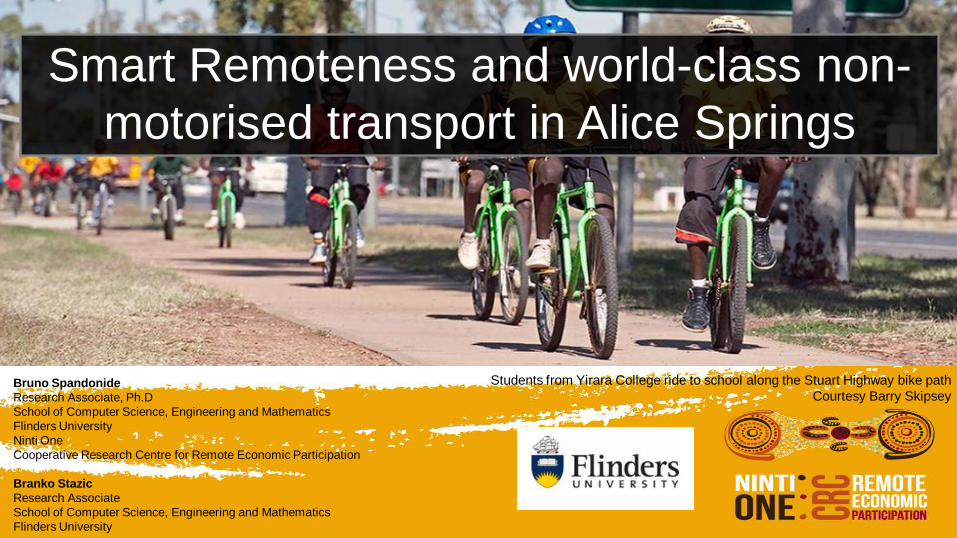
Smart Remoteness and world-class non-motorised transport in Alice Springs
Bruno Spandonide Research Associate, Ph.D School of Computer Science, Engineering and Mathematics Flinders University Ninti One Cooperative Research Centre for Remote Economic Participation Branko Stazic Research Associate School of Computer Science, Engineering and Mathematics Flinders University
Students from Yirara College ride to school along the Stuart Highway bike path Courtesy Barry Skipsey
Transport Research in the Remote Australia 2
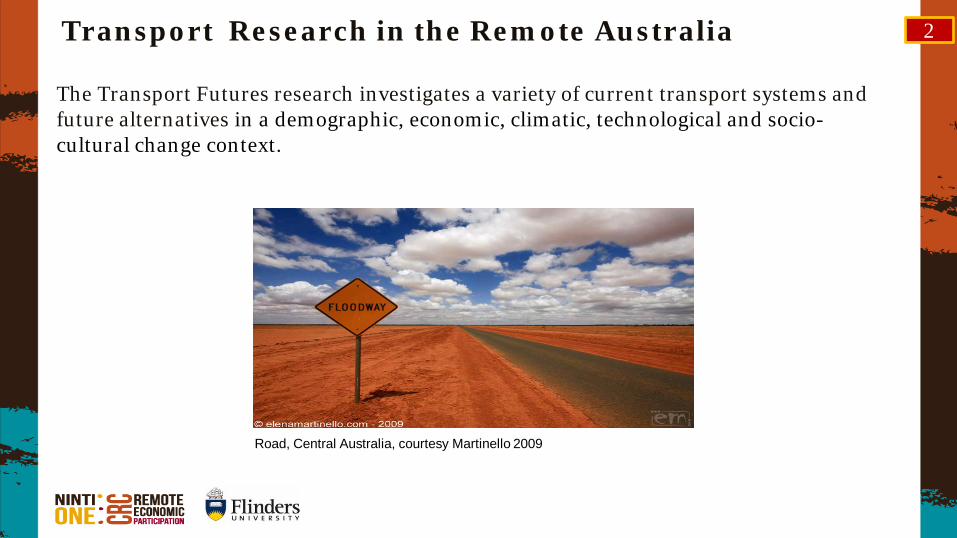
The Transport Futures research investigates a variety of current transport systems and future alternatives in a demographic, economic, climatic, technological and socio-cultural change context.
Road, Central Australia, courtesy Martinello 2009

Relevance of non-motorised transport in Central Australia
A number of obvious barriers to non-motorised transports exist in Central Australia:
• geographic isolation,
• very high average mean temperatures (particularly in Summer) and
• a relatively small CBD.
Is the red dirt compatible with
modern non-motorised transports?
3
Stephen Codrington. (2005) Alice Springs ridge, Planet Geography 3rd Edition
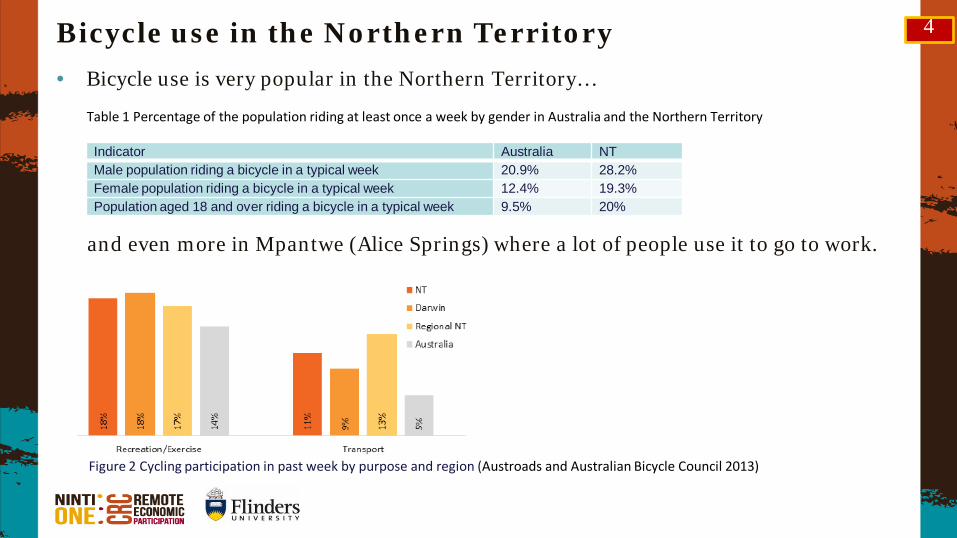
Bicycle use in the Northern Territory • Bicycle use is very popular in the Northern Territory…
and even more in Mpantwe (Alice Springs) where a lot of people use it to go to work.
4
Indicator Australia NT Male population riding a bicycle in a typical week 20.9% 28.2% Female population riding a bicycle in a typical week 12.4% 19.3% Population aged 18 and over riding a bicycle in a typical week 9.5% 20%
Table 1 Percentage of the population riding at least once a week by gender in Australia and the Northern Territory
Figure 2 Cycling participation in past week by purpose and region (Austroads and Australian Bicycle Council 2013)
5
Domestically high, internationally low
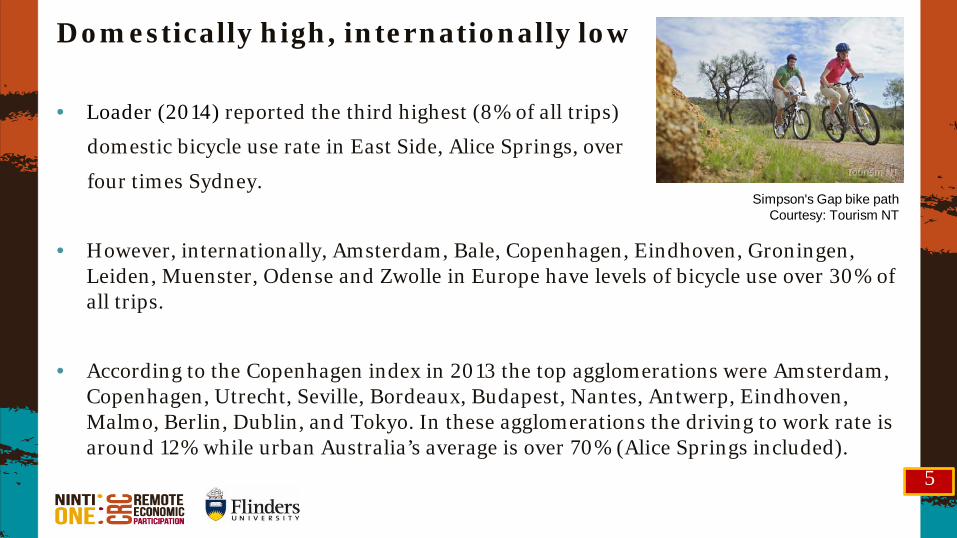
• Loader (2014) reported the third highest (8% of all trips)
domestic bicycle use rate in East Side, Alice Springs, over
four times Sydney.
• However, internationally, Amsterdam, Bale, Copenhagen, Eindhoven, Groningen, Leiden, Muenster, Odense and Zwolle in Europe have levels of bicycle use over 30% of all trips.
• According to the Copenhagen index in 2013 the top agglomerations were Amsterdam, Copenhagen, Utrecht, Seville, Bordeaux, Budapest, Nantes, Antwerp, Eindhoven, Malmo, Berlin, Dublin, and Tokyo. In these agglomerations the driving to work rate is around 12% while urban Australia’s average is over 70% (Alice Springs included).
Simpson's Gap bike path Courtesy: Tourism NT
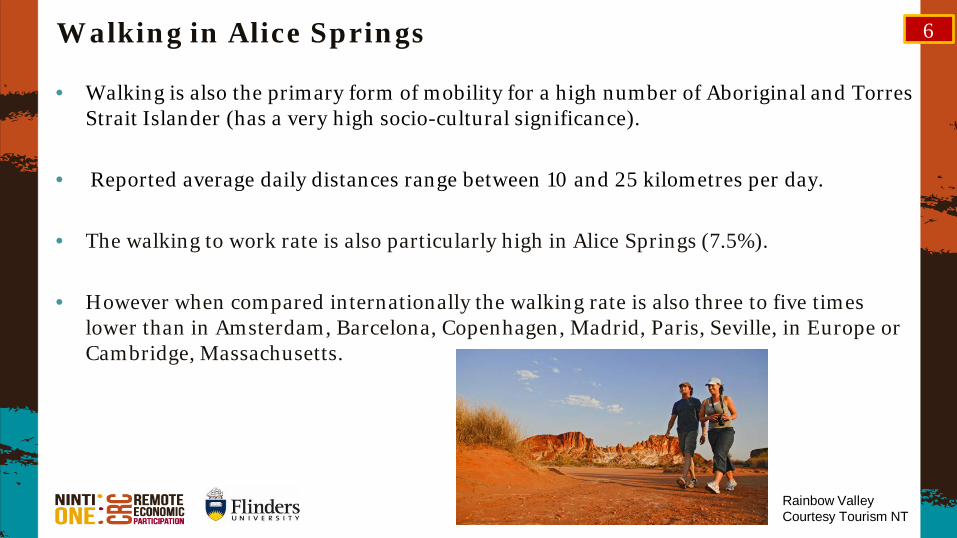
Walking in Alice Springs • Walking is also the primary form of mobility for a high number of Aboriginal and Torres
Strait Islander (has a very high socio-cultural significance).
• Reported average daily distances range between 10 and 25 kilometres per day.
• The walking to work rate is also particularly high in Alice Springs (7.5%).
• However when compared internationally the walking rate is also three to five times lower than in Amsterdam, Barcelona, Copenhagen, Madrid, Paris, Seville, in Europe or Cambridge, Massachusetts.
6
Rainbow Valley Courtesy Tourism NT

Non-motorised transport rating
7
Using the Copenhagen index for evaluating non-motorised transports Alice Springs rated average. High rating Average rating Low Rating
Advocacy Infrastructures (network) Modal share increase
Culture Modal share Share programmes
Facilities Social acceptance Traffic calming
Gender split Urban planning
Infrastructures (path) Perception of safety (crossings)
Perception of safety (path)
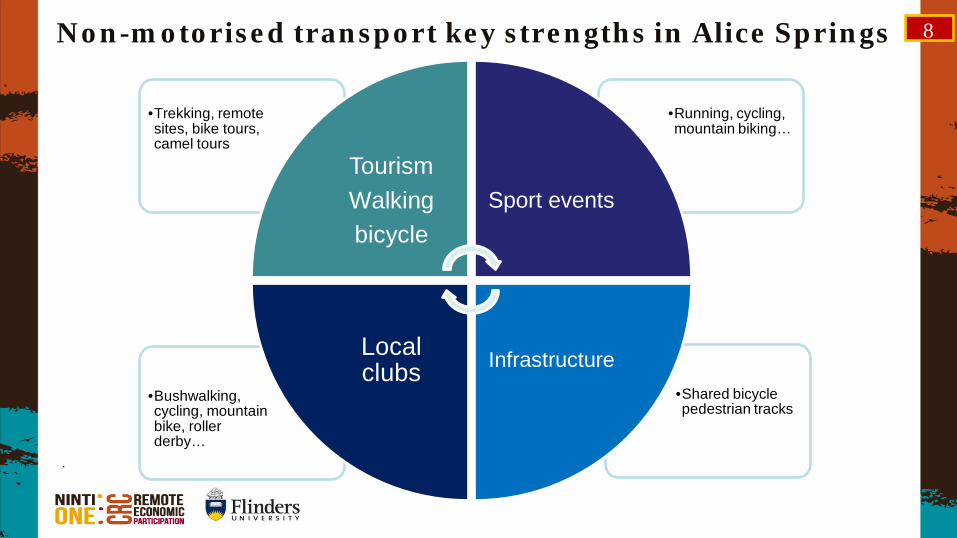
Non-motorised transport key strengths in Alice Springs
8
.
•Shared bicycle pedestrian tracks
•Bushwalking, cycling, mountain bike, roller derby…
•Running, cycling, mountain biking…
•Trekking, remote sites, bike tours, camel tours
Tourism Walking bicycle
Sport events
Infrastructure Local clubs
9
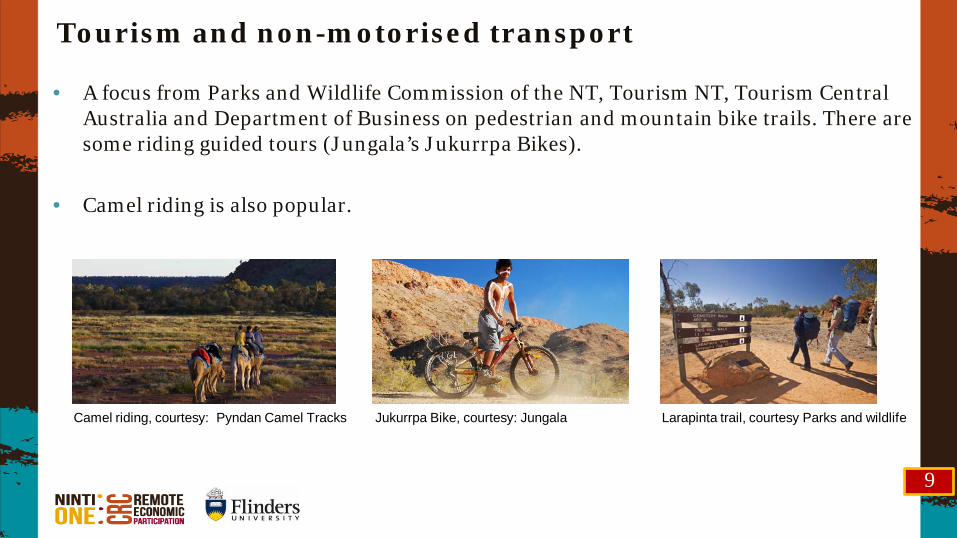
Tourism and non-motorised transport • A focus from Parks and Wildlife Commission of the NT, Tourism NT, Tourism Central
Australia and Department of Business on pedestrian and mountain bike trails. There are some riding guided tours (Jungala’s Jukurrpa Bikes).
• Camel riding is also popular.
Jukurrpa Bike, courtesy: Jungala Camel riding, courtesy: Pyndan Camel Tracks Larapinta trail, courtesy Parks and wildlife
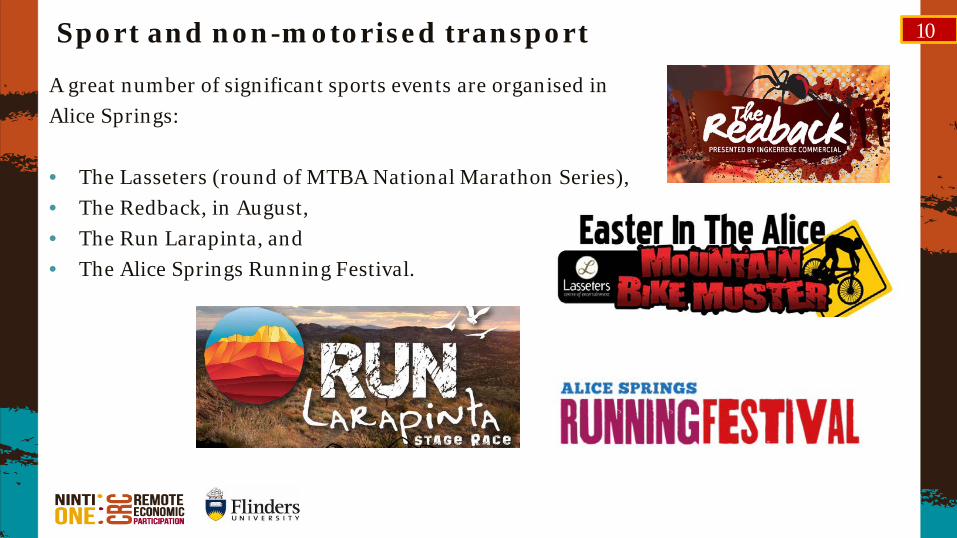
Sport and non-motorised transport 10 A great number of significant sports events are organised in Alice Springs: • The Lasseters (round of MTBA National Marathon Series), • The Redback, in August, • The Run Larapinta, and • The Alice Springs Running Festival.
Local advocacy groups of non-motorised transport
11
• Local clubs and shops play an important role in supporting the use of recreational non-motorised activities such as bushwalking, running, road cycling and mountain biking. There is a bicycle film festival.
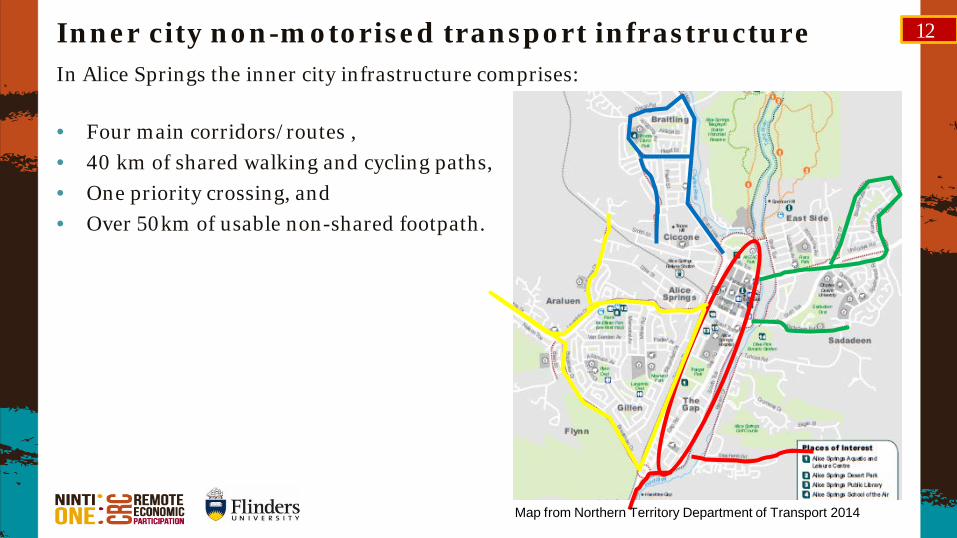
Inner city non-motorised transport infrastructure 12
In Alice Springs the inner city infrastructure comprises:
• Four main corridors/routes , • 40 km of shared walking and cycling paths, • One priority crossing, and • Over 50km of usable non-shared footpath.
Map from Northern Territory Department of Transport 2014
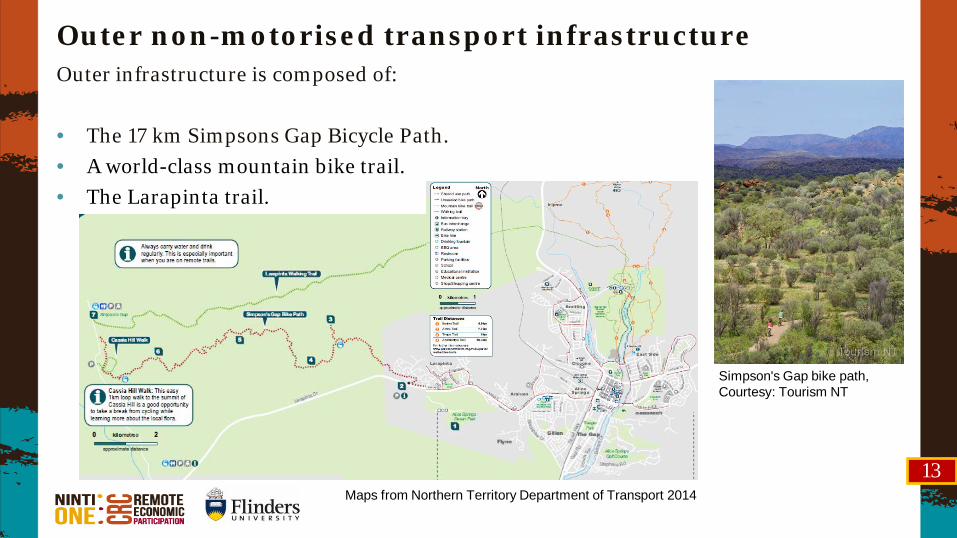
Outer non-motorised transport infrastructure
13
Outer infrastructure is composed of: • The 17 km Simpsons Gap Bicycle Path. • A world-class mountain bike trail. • The Larapinta trail.
Maps from Northern Territory Department of Transport 2014
Simpson's Gap bike path, Courtesy: Tourism NT

Network’s strengths
14
• Paths are located on particularly flat terrain, and the majority of residents live within 5km of the central activity district (McClean and McHenry 2014)
• Best-in-class characteristics such as a 1.6 m width. • The network has 40 times less the density of Copenhagen, however the same level
of infrastructure density per inhabitant. • There issome good parking infrastructures in some public areas.
Ross Park Primary School, Alice Springs, Bikestorage bicycle shelter Courtesy: Bikestorage
Shared footpath, courtesy: MPH Carpentry

Network’s weaknesses
15
• Limited intersections. • Dangerous crossings. • Limited priority crossing.
Map from Northern Territory Department of Transport 2014
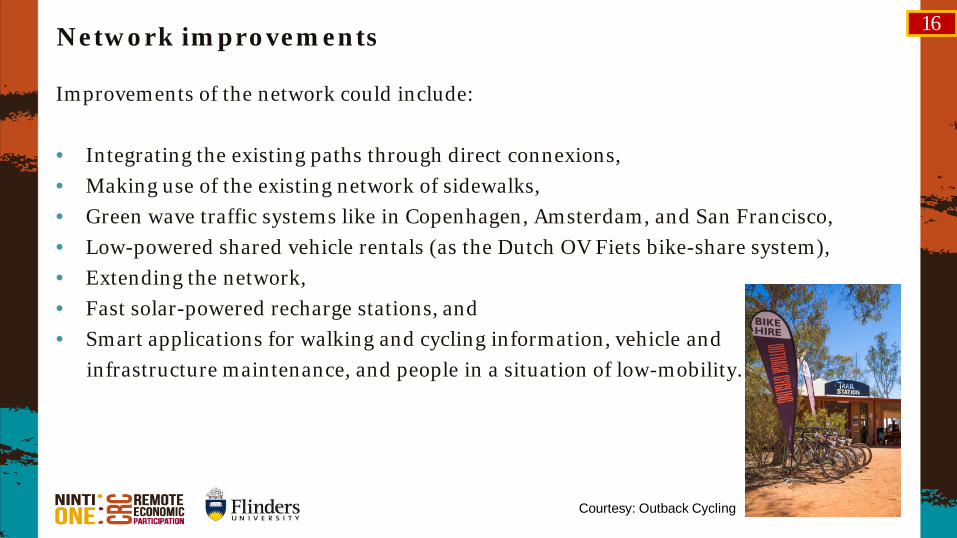
Network improvements
Improvements of the network could include:
• Integrating the existing paths through direct connexions, • Making use of the existing network of sidewalks, • Green wave traffic systems like in Copenhagen, Amsterdam, and San Francisco, • Low-powered shared vehicle rentals (as the Dutch OV Fiets bike-share system), • Extending the network, • Fast solar-powered recharge stations, and • Smart applications for walking and cycling information, vehicle and infrastructure maintenance, and people in a situation of low-mobility.
16
Courtesy: Outback Cycling
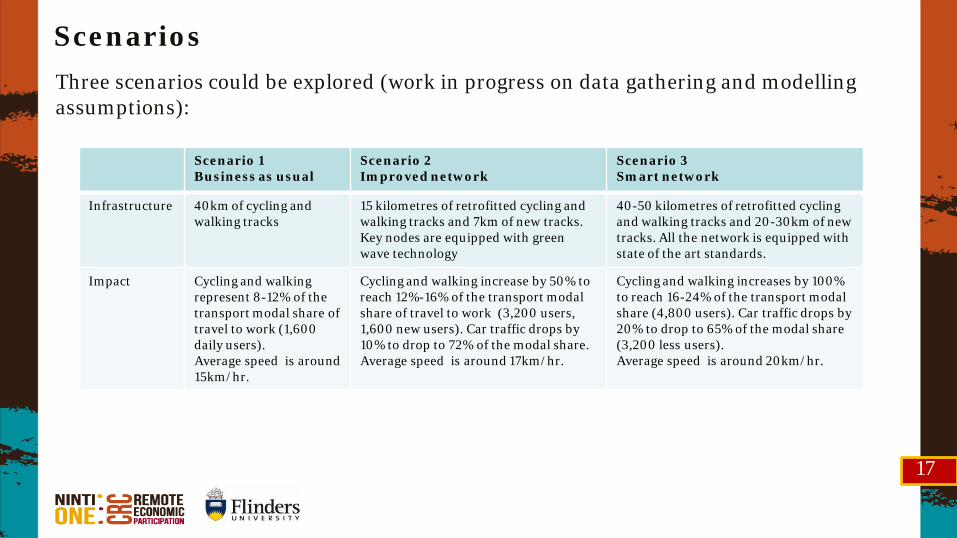
Scenarios Three scenarios could be explored (work in progress on data gathering and modelling assumptions):
17
Scenario 1 Business as usual
Scenario 2 Improved network
Scenario 3 Smart network
Infrastructure 40km of cycling and walking tracks
15 kilometres of retrofitted cycling and walking tracks and 7km of new tracks. Key nodes are equipped with green wave technology
40-50 kilometres of retrofitted cycling and walking tracks and 20-30km of new tracks. All the network is equipped with state of the art standards.
Impact Cycling and walking represent 8-12% of the transport modal share of travel to work (1,600 daily users). Average speed is around 15km/hr.
Cycling and walking increase by 50% to reach 12%-16% of the transport modal share of travel to work (3,200 users, 1,600 new users). Car traffic drops by 10% to drop to 72% of the modal share. Average speed is around 17km/hr.
Cycling and walking increases by 100% to reach 16-24% of the transport modal share (4,800 users). Car traffic drops by 20% to drop to 65% of the modal share (3,200 less users). Average speed is around 20km/hr.
Simulation Under a range of initial conservative assumptions, the traffic corresponding to the three scenarios is able to be computed in a video simulation. • Alice Springs Bike traffic Scenario 1 • https://www.thinglink.com/scene/677847330778513409
18

Economic feasibility and Cost Benefit ratios
As an preliminary indicative exercise Cost benefit ratios (CBR) are anticipated to compare particularly well: The improved network scenario gives a CBR of 3.35. The smart network scenario gives a CBR of 3.975. Factors such as the strengths of the current network and the existing non-motorised transport culture explain why the potential for improvement is so strong.
19

Acknowledgements This research is conducted by Flinders University, Ninti One and the Cooperative Research Centre for Remote Economic Participation.
20
For further information: Transport Futures Report CW017 http://www.crc-rep.com.au/resource/CW017_TransportCostsInRemoteCommunities.pdf Spandonide B. 2014. Transport systems in remote Australia: Transport costs in remote communities. CRC-REP Working Paper CW0017. Ninti One Limited. Alice Springs.
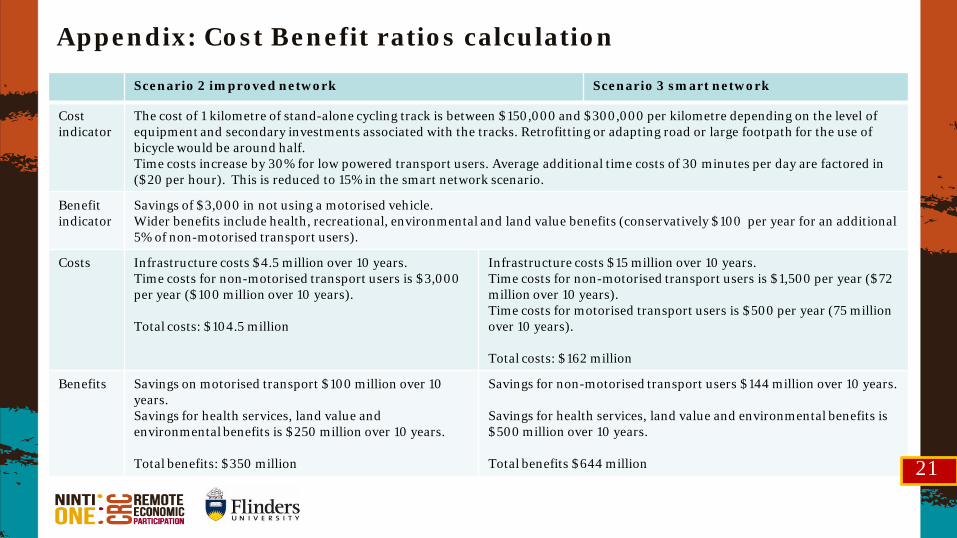
Appendix: Cost Benefit ratios calculation
Scenario 2 improved network Scenario 3 smart network
Cost indicator
The cost of 1 kilometre of stand-alone cycling track is between $150,000 and $300,000 per kilometre depending on the level of equipment and secondary investments associated with the tracks. Retrofitting or adapting road or large footpath for the use of bicycle would be around half. Time costs increase by 30% for low powered transport users. Average additional time costs of 30 minutes per day are factored in ($20 per hour). This is reduced to 15% in the smart network scenario.
Benefit indicator
Savings of $3,000 in not using a motorised vehicle. Wider benefits include health, recreational, environmental and land value benefits (conservatively $100 per year for an additional 5% of non-motorised transport users).
Costs Infrastructure costs $4.5 million over 10 years. Time costs for non-motorised transport users is $3,000 per year ($100 million over 10 years). Total costs: $104.5 million
Infrastructure costs $15 million over 10 years. Time costs for non-motorised transport users is $1,500 per year ($72 million over 10 years). Time costs for motorised transport users is $500 per year (75 million over 10 years). Total costs: $162 million
Benefits Savings on motorised transport $100 million over 10 years. Savings for health services, land value and environmental benefits is $250 million over 10 years. Total benefits: $350 million
Savings for non-motorised transport users $144 million over 10 years. Savings for health services, land value and environmental benefits is $500 million over 10 years. Total benefits $644 million 21