smart option for planning for retirement, now at bealelee.com
TRANSCRIPT

©2012 Brookstone Capital Management, LLC. All rights reserved. 1172012

Where do you think
we‟re headed?History Shows that the market typically
moves in cycles. In the past 105 years, there
have been three bull markets and three bear
markets. The chart shows that we may have
entered a bear market.
Value of the Dow Jones Industrial Average for 105 Years (1906-2011)
Bull
Bear
18 Years
5 Years25 Years
11 Years
17 Years
17 Years
1906-1924 1925-
1929
1930-1954 1955-1965 1966-1982 1983-1999 2000-?

What do investors want?
Not to lose money
Hope to get or stay rich
Banish fear of being poor
Leave money to kids and or spend money in retirement

How will you get there?
Adding new managers that will enhance your current mix of investments and
supplement them during an economic cycle when
traditional investments do not work.
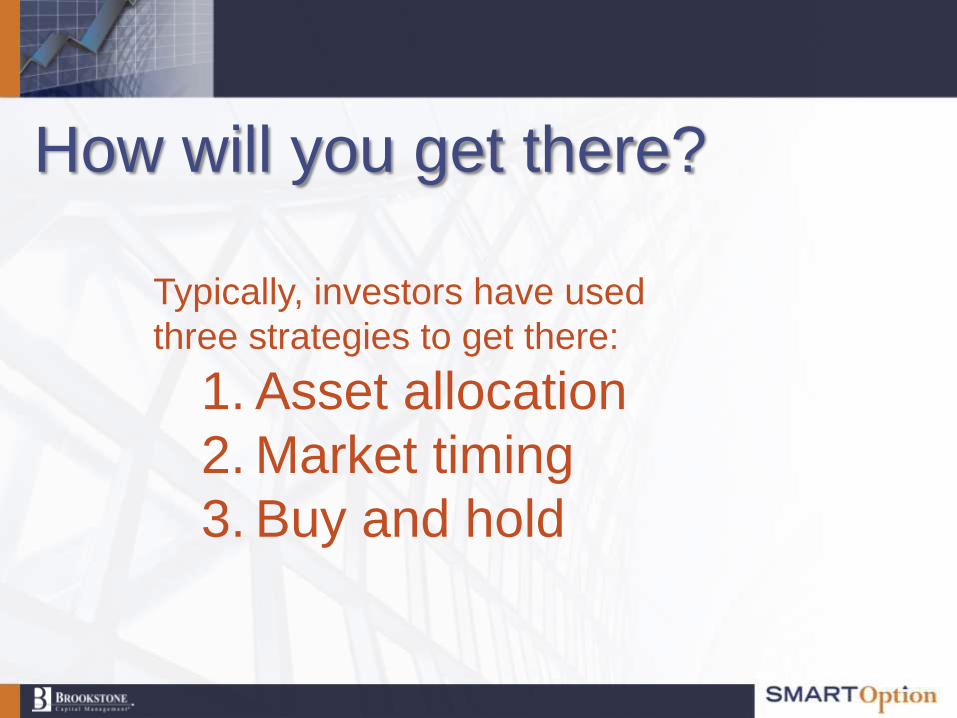
How will you get there?
Typically, investors have used
three strategies to get there:
1. Asset allocation
2. Market timing
3. Buy and hold

Diversification works…Asset Class Examples Using Vanguard Mutual Funds
Timeline goes from top of the Tech Bubble through the bear market of
2000-2002 and recovery to the peak in October 2007
S&P500
Pacific Index
REIT Index
Small Cap
Total Bond Index
European Index
Emerging Markets

until it doesn‟t…
S&P500
Pacific Index
REIT Index
Small Cap
Total Bond Index
European Index
Emerging Markets
Asset Class Examples Using Vanguard Mutual FundsAfter October 2007, equities marched in relative unison.
Bonds offered the only significant diversification.
SMARToption

Find Non-Correlated AssetsCorrelation Sphere
Traditional
investment assets
correlate to “1” in
this area
Hedged Equity

Market timing• The idea is to move money to
bonds and cash when the market
is going to go down
OR• Tactically move between asset
classes during different cycles in
the economy
• Timing the market involves calling
it right twice, not just once, and
that's nearly impossible

Market timing
• Most investors tend to let the competing
emotions of fear and greed dictate their
investment decisions
• This leads to the tendency to invest after a
significant increase in prices and sell during
down periods, the opposite of buying low and
selling high.

Market timing
• This phenomenon has been widely
documented, included in a 2003 Dalbar
Study*
• It shows that the average investor
stayed invested in equity funds for less
than 3 years, buying when stocks went
up and selling when the going got tough
*2003 Dalbar, Inc., “Quantitative Analysis of Investment Behavior”.

Market timing
The end result was that investors earned an
average of 2.57% from 1984 to 2003, a
hair below inflation of 3.14%, and far short
of the 12.2% annual gain on the S&P 500
for the same period

Market timingThe record on professionals timing the market is just as
abysmal.
• The Hulbert Financial Digest* has tracked what would have
happened if every year an investor put his money into the
prior year‟s top performing market timing newsletter.
• Over 21 years the result would have been an annualized
loss of 31.4 percent a year.
• In the real world, that‟s equivalent to investing $10,000 in
January 1981 and finding that all you have left at the end of
2002 is $2.32.
*Mark Hulbert, Hulbert Financial Digest, http://www.fundadvice.com/FEhtml/PsychHurdles/0304b.html

Market timing
The Bottom Line: It is very difficult to
time the market successfully!

Buy and Hold Investors
American Airlines1980 to January 12, 2012
$4.44
$8
$13.62$20.87
$36.13
$2.34
$37.05
$0.32

Buy and Hold Investors
Eastman Kodak1962 to January 12, 2012
1972
$66
1987
$68
1996
$80
2009
$2.96
1/2012
$0.52

Buy and Hold Investors
Microsoft2000 to January 12, 2012
April 3, 2000
$32.53 January 23, 2012
$25.70

Buy and Hold Investors
If you bought and held a 60/40
portfolio* (stocks/bonds),
what it would have done…
e.g. 2008
30%
OR
If you bought the S&P 500
in 2000 and held it through
2011
You would be about even
*Lipper Diversified Growth and Income Index

Are there other financial
tools I can use to protect
and grow wealth?

THE STRIKING PRICE | SATURDAY, JANUARY 8, 2011
By STEVEN M. SEARS
Using options to manage the risk of a downturn
may be a good idea.
How to Collar a Black Swan
“…pension funds and other institutional
investors …can no longer rely solely on
macro-economic analysis to adjust portfolios.
They have to be cognizant of tail risk and risk
management on an ongoing basis. The idea
of tail risk, essentially that the unexpected will
happen from time to time, is one of the key
traits of the modern stock market”.

Joann Hill, ProShares Head of Investment Strategies (2010 IMN Superbowl of Indexing keynote presentation).
“alternative strategies that include options add value to a
portfolio and outperform traditional strategies in risk
reduction”
What are other Institutional
investors saying?
“portfolio managers that do not use options can not
adequately protect against market risk”.
James E. Keohane, Healthcare of Ontario Pension Plan Senior Vice-President (2010 IMN Superbowl of Indexing presentation).

How Options Work

Options are:Contracts to either BUY or SELL a specific
investment at a specific price
The purchase price of an option is called the
PREMIUM – you pay for
this if you exercise your
option or not.

Options:The contracts establish a specific price called the
STRIKE PRICE at which the contract may be
exercised
OPTIONS have a shelf life –
Also called an expiration date,
which is the latest date you can
“exercise” you option or close out your position

There are two types of
Options
CALLS and PUTS

CALL = BuyThe purchase of a call option gives the owner the
right but not the obligation to BUY 100 shares of the
underlying security at the STRIKE price on or before
the expiration date.
The buyer has the right but not the obligation
to BUY the shares.
The seller of the option does have the obligation
to sell the shares to the buyer.

PUT = SellConversely, the purchase of a put option
gives the owner the right but not the
obligation to SELL 100 shares of the
underlying security at the STRIKE
price at anytime before the expiration
date.
In this case the seller of the put is required to
buy the security at the strike price at the
buyer‟s request.

Buyers of options
Including both puts and calls spend money.
They pay the premium.
Including both puts and calls collect money.
They collect the premium.
Seller of options

3 Ways SMARToption Uses Options
1. Buy long-term puts
2. Sell short-term covered calls
3. Sell short-term puts

PUT OptionsPut options are usually purchased as protection
against falling stock prices. You pay the premium
upfront so that if the underlying stock falls below
the strike price, your potential loss is limited.
This protective put works like an insurance policy.
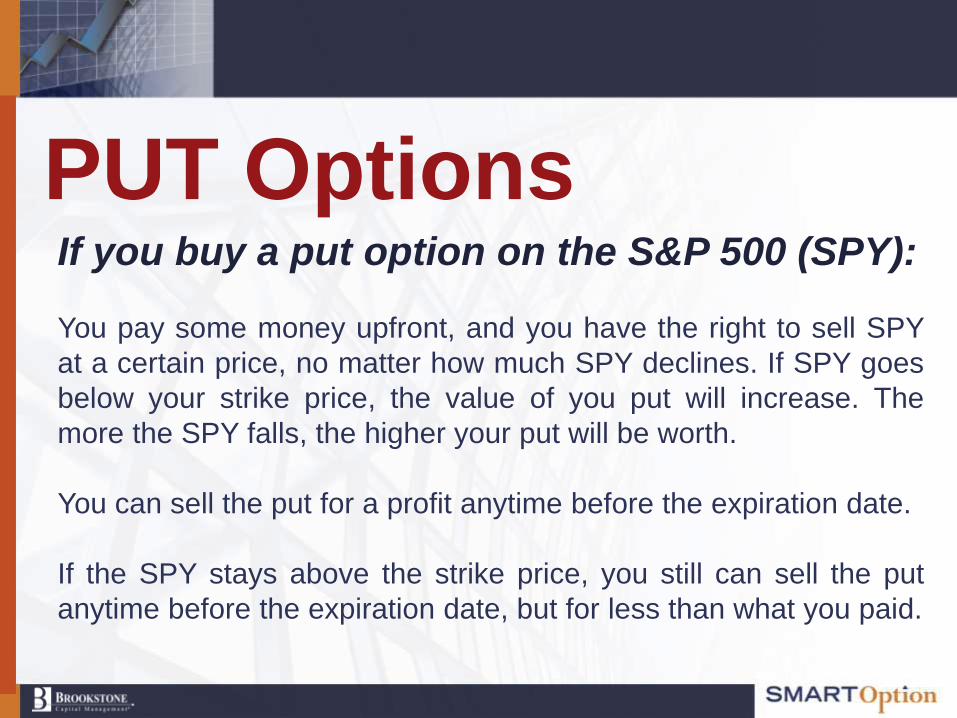
PUT OptionsIf you buy a put option on the S&P 500 (SPY):
You pay some money upfront, and you have the right to sell SPY
at a certain price, no matter how much SPY declines. If SPY goes
below your strike price, the value of you put will increase. The
more the SPY falls, the higher your put will be worth.
You can sell the put for a profit anytime before the expiration date.
If the SPY stays above the strike price, you still can sell the put
anytime before the expiration date, but for less than what you paid.
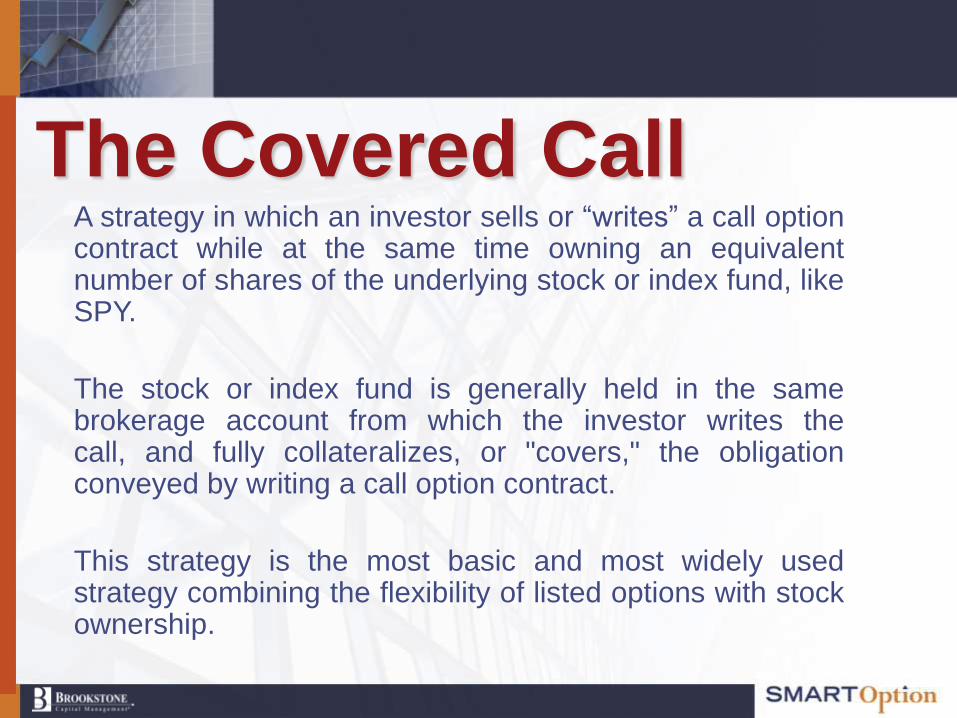
The Covered Call A strategy in which an investor sells or “writes” a call optioncontract while at the same time owning an equivalentnumber of shares of the underlying stock or index fund, likeSPY.
The stock or index fund is generally held in the samebrokerage account from which the investor writes thecall, and fully collateralizes, or "covers," the obligationconveyed by writing a call option contract.
This strategy is the most basic and most widely usedstrategy combining the flexibility of listed options with stockownership.

The Covered Call • If you sell a covered call on the SPY, you collect
some money upfront, and you have the obligationto deliver your shares of SPY if it hits the strikeprice.
• If SPY stays below the strike price, you get to keepthe premium you collected.
• If SPY approaches the strike price, instead ofwaiting for your shares of SPY to be “called away”you can buy the calls back and close the position.

PUT OptionsIf you sell a put option on the SPY:You collect the premium immediately adding cash to you
account, and you have the obligation to buy shares of SPY if
it hits the strike price.
If SPY stays above the strike price, you get to keep the
premium you collected
If SPY approaches the strike price, instead of being forced to
buy SPY at that price, you can buy the puts back and close
out the position.

Are options risky?

Not any more risky than buying astock is risky.
It‟s the investment strategy that cansignificantly lower risks, not the optionsthemselves.
When correctly applied and activelymanaged they can be tailored for specificpurposes and market conditions.
Are options risky?

When incorrectly applied or leftunmanaged, these strategies can exposeinvestors to unacceptable losses.
In the past when these strategies failed, theymade headlines in the news.
Options ended up with the blameinstead of the investment strategy.
Are options risky?

► OCC is a participant in every options transaction,serving as the intermediary between buyers andsellers.
► You do not deal with any person on the other sideof the transaction, you are dealing with the OCC
► OCC issues, guarantees and clears all option tradesplaced on the U.S. options exchanges.
► Ensures that all of the rules involved in the salestransactions will be followed and that each side willperform as promised.
The Options Clearing
Corporation (OCC)

The use of exchange-listed
options has been growing
at a phenomenal rate.
*2010 Options Industry Council Benchmark Study
In the last ten years trading
volume has increased by
nearly 500%, with more than
3.8 billion contracts traded in
2010.*
500
%

1.Generate income
2.Hedging
3.Diversification
4.Locking in profits
Why should you have options
in your portfolio?

How SMARToption works

A two-pronged approach that
mathematically minimizes large losses in
your portfolio
Hedged Equity Strategy
+ Proprietary Monthly
Trading Strategy
How SMARToption works

SMARToption
Basket IEquity + Hedge/Downside
Protection
Basket IIMonthly Options Trading

Consists of:
• S&P 500 exchange traded fund
• a put option to minimize risk
The option portion of Basket I is specifically designed to limit a portfolio‟s
exposure to falling markets. The option component is an investment
similar to an insurance policy on your house. The deductible for this
policy (amount you pay for protection) is specifically chosen to limit (not
eliminate) losses.
Basket I
If Market is Put is
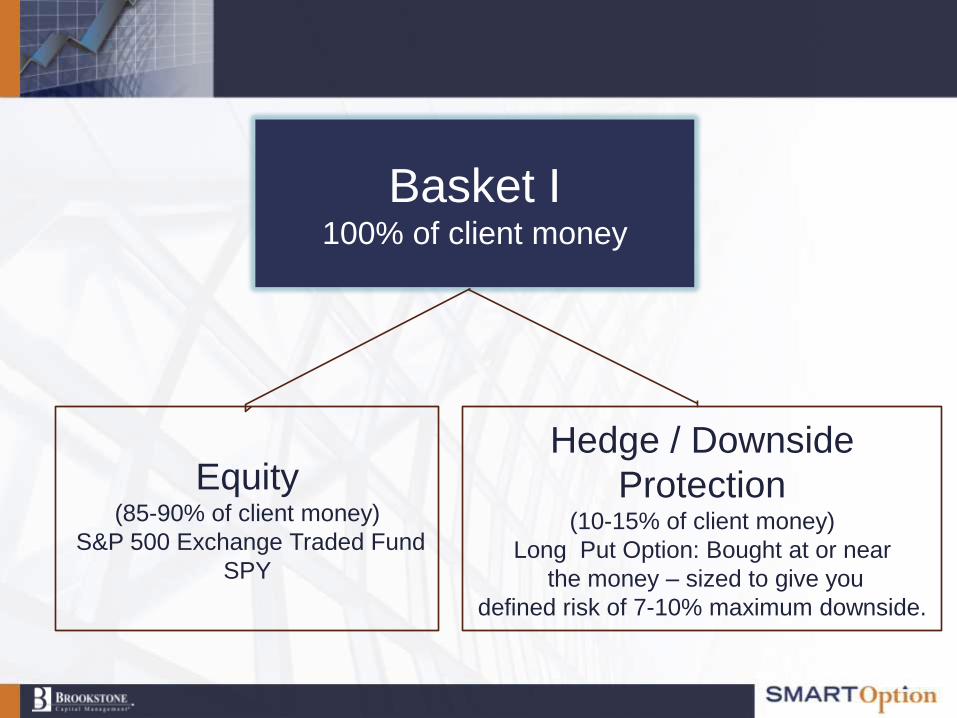
Basket I100% of client money
Hedge / Downside
Protection(10-15% of client money)
Long Put Option: Bought at or near
the money – sized to give you
defined risk of 7-10% maximum downside.
Equity(85-90% of client money)
S&P 500 Exchange Traded Fund
SPY

By investing in a broad-based index fund such as SPY, it
automatically reduces company/ sector risk through
diversification across multiple companies and even markets
(e.g.US/International).
Buying and holding the index ETF also eliminates futile
attempts in market timing and/or predicting future values of
individual stocks.
This strategy is possible because protection from significant
declines does not come from prophesy but from the Basket I
hedge.
Basket I

Basket IIWe sell out of the money
Puts and Calls against our positions in
Basket I
(Brings cash into the account)
1. Sell Put on SPY 2. Sell Call on SPY
When puts and calls are sold, they generate
premium or „income‟ that is added to your account.
This independent income generating component of
the strategy generates income to the account in all
market conditions.
Basket II

This income also helps to offset the cost of the hedge used
in Basket I. It incorporates multiple specified adjustment and
liquidation points to minimize risk and maximize the
frequency and size of monthly returns.
These adjustment and liquidation points were extensively
back-tested and then proven through implementation over
the past 14 years.
Basket II has been quantitatively designed in type, size, &
frequency to provide market-neutral returns.
Basket II

Basket II – Selling out of the money
Puts and Calls against our positions in Basket I1. Sell a put
2. Sell a call
1. Put strike
price
2. Call strike
priceS&P 500 current
market price
Sweet spot over the
market. Take profits on
both the put and call if
market remains within
sweet spot
If the market moves down
toward put strike, we have
a stop order to buy back
the put here
If the market moves up
toward call strike, we
have a stop order to
buy back the call here
Put in the $ Call in the $

Basket II
Adjustments
Original Put
strike price
Original Call
closed for
profit
S&P 500
original price
Sweet spot over the
market moves with
the market
If the market moves down
toward put strike, we have
adjustment points that
enable us to stay in the
trade and increase the
probability of success to
over 80%
If the market moves
down toward put
strike, we will take
profits on the original
call and sell a new
call which brings in
more premium
S&P 500
new price
New Call

Basket I - 100% of a client‟s portfolio is invested in Basket I. 85-90% is
invested in SPY equity shares and 10-15% is invested in a hedge through a
long-term option on SPY.
SMARToption‟s – 2 components

Basket II is an independent income generating component
of the strategy which has been quantitatively designed in
type, size, & frequency to provide market-neutral returns.*
*Based on past performance

The proof is in the
performance.

The Key to SMARToption‟s Success
Bull
Bear
UpsideCapture has
averaged 70% of
the S&P 500
returns in bull
markets
Downside Capture
has averaged 5% of the
S&P 500 returns in bear
markets
100%
-100%
70%
-5%

SMARToption captures substantial
upside in bull marketsand minimizes losses
in bear markets!
Market CyclesSMARToption vs S&P 500*
SMARToption* S&P 500
Bull 1 49.23% 71.17%
Bear 1 24.41% -37.61%
Bull 2 53.61% 82.85%
Bear 2 -3.60% -37.00%
Bull 3 44.50% 48.97%
Important Notes: All investments involve the risk of potential investment losses as well as the potential for investment gains. Prior performance is no guarantee of future results and there can be
no assurance, and clients should not assume, that future performance will be comparable to past performance.
*Since inception, 1997, gross of fees
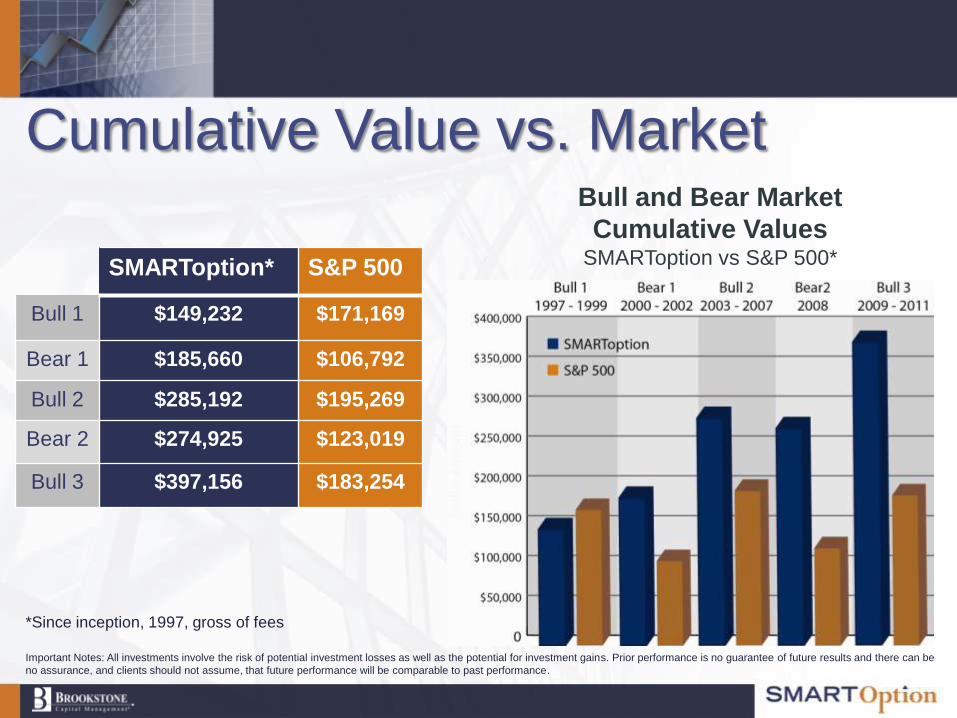
Cumulative Value vs. MarketBull and Bear Market
Cumulative ValuesSMARToption vs S&P 500*SMARToption* S&P 500
Bull 1 $149,232 $171,169
Bear 1 $185,660 $106,792
Bull 2 $285,192 $195,269
Bear 2 $274,925 $123,019
Bull 3 $397,156 $183,254
Important Notes: All investments involve the risk of potential investment losses as well as the potential for investment gains. Prior performance is no guarantee of future results and there can be
no assurance, and clients should not assume, that future performance will be comparable to past performance.
*Since inception, 1997, gross of fees

The Key to SMARToption‟s SuccessDown Years for the S&P 500*
From 2000-
2002, hedging
protected the
downside and
actually provided a
profit!
In 2008, when S&P
500 lost 37%, we
were down only
3.6% before fees!
Prevent large losses!
8.42%
-9.10%
12.97%
-11.89%
12.22%
-22.10%
-3.6%
-37.00%
Important Notes: All investments involve the risk of potential investment losses as well as the potential for investment gains. Prior performance is no guarantee of future results and there can be
no assurance, and clients should not assume, that future performance will be comparable to past performance.
*Since inception, 1997, gross of fees

Reduces Risk
Increases Returns Risk vs. Return1997- 2011
Risk – Standard Deviation
An
nu
ali
zed
Retu
rn
Important Notes: All investments involve the risk of potential investment losses as well as the potential for investment gains. Prior performance is no guarantee of future results and there can be
no assurance, and clients should not assume, that future performance will be comparable to past performance.

Client in SMARToption
since 1997
Aggregate Growth vs. Indices*1997 – 2011
4.5
4.0
3.5
3.0
2.5
2.0
1.5
1.012/97 12/99 12/01 12/03 12/05 12/07 12/09
SMARToption
S&P 500
Important Notes: All investments involve the risk of potential investment losses as well as the potential for investment gains. Prior performance is no guarantee of future results and there can be
no assurance, and clients should not assume, that future performance will be comparable to past performance.
*Net of fees

If you are in the market and not
hedged when the market drops
40%, it’s a lifestyle change!
Take the Good with the bad

Client in SMARToption
since 2003Aggregate Growth vs. Indices*
2003 – 20112.6
2.4
2.2
2.0
1.8
1.6
1.4
1.2
1.0
SMARToption
S&P 500
1/04 1/05 1/06 1/07 1/08 1/09 1/10 1/11
Important Notes: All investments involve the risk of potential investment losses as well as the potential for investment gains. Prior performance is no guarantee of future results and there can be
no assurance, and clients should not assume, that future performance will be comparable to past performance.
*Net of fees

The proof is in the performanceSMARToption vs S&P 500
Cumulative Returns 1997 – 2011
SMARToption (Gross of Fees)
S&P 500
297%
83%
Important Notes: All investments involve the risk of potential investment losses as well as the potential for investment gains. Prior performance is no guarantee of future results and there can be
no assurance, and clients should not assume, that future performance will be comparable to past performance.

The proof is in the performance
SMARToption (Gross of Fees)
S&P 500
$183,254
$397,156
Growth of $100,000
Cumulative Returns 1997 – 2011
Important Notes: All investments involve the risk of potential investment losses as well as the potential for investment gains. Prior performance is no guarantee of future results and there can be
no assurance, and clients should not assume, that future performance will be comparable to past performance.

GIPS®

In the past, investors had great difficulty obtaining meaningful
comparisons of accurate investment performance data.
Making apples-to-apples comparisons of investment
performance was problematic,
and the existence of country-specific
guidelines for performance presentation
further complicated matters.
Are a big deal!

There was a need for a practitioner-driven set of ethical
principles and a standardized, industry-wide approach to
calculating and reporting investment results.
The foundation for the GIPS standards
was first established in 1987.
To develop one globally accepted
set of standards, the GIPS
committee began work in 1995 to get
them formally endorsed
Are a big deal!
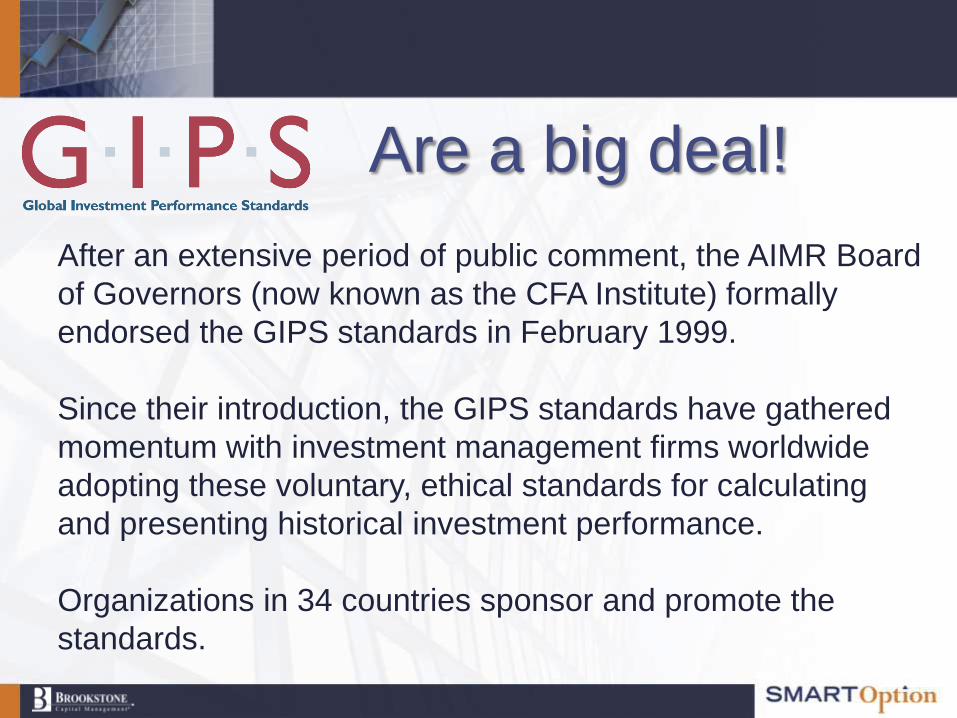
After an extensive period of public comment, the AIMR Board
of Governors (now known as the CFA Institute) formally
endorsed the GIPS standards in February 1999.
Since their introduction, the GIPS standards have gathered
momentum with investment management firms worldwide
adopting these voluntary, ethical standards for calculating
and presenting historical investment performance.
Organizations in 34 countries sponsor and promote the
standards.
Are a big deal!

• GIPS compliant firms voluntarily go beyond legal reporting
requirements to demonstrate a commitment to open,
honest, and ethical practices.
• To claim compliance, an investment firm must demonstrate
adherence to comprehensive and rigorous rules governing
input data, calculation methodology, composite
construction, disclosures, and presentation and reporting.
• GIPS compliant firms must have their data audited and
verified by a qualified third party firm.
Are a big deal!

Investments that adhere to GIPS® should assure
investors that the firms’ investment performance
is complete and fairly presented.
Are a big deal!

Fees

Fees
How can we do this?
SMARToption will have a SET FEE SCHEDULE!
Fees will be deducted quarterly for a total of 2.25% annually.
The FEE SCHEDULE is not-negotiable and cannot be altered.
You will not see any other fees taken out of your account
NO transaction fees
NO ticket charges
NO trading costs

Wrap fee structure
A wrap fee structure is where both:
● Asset management fees for advisory services
● Transaction fees for execution services
are wrapped into a single fee charged to the client.
In a Wrap Fee arrangement, a client’s costs are the
same regardless of the number of transactions in an
account.

Total Expense Structure
The underlying vehicle is an S&P 500 ETF,
which has a very low expense ratio of
0.0945%.
TOTAL ANNUAL FEE: 2.25% + 0.0945 = 2.3445%
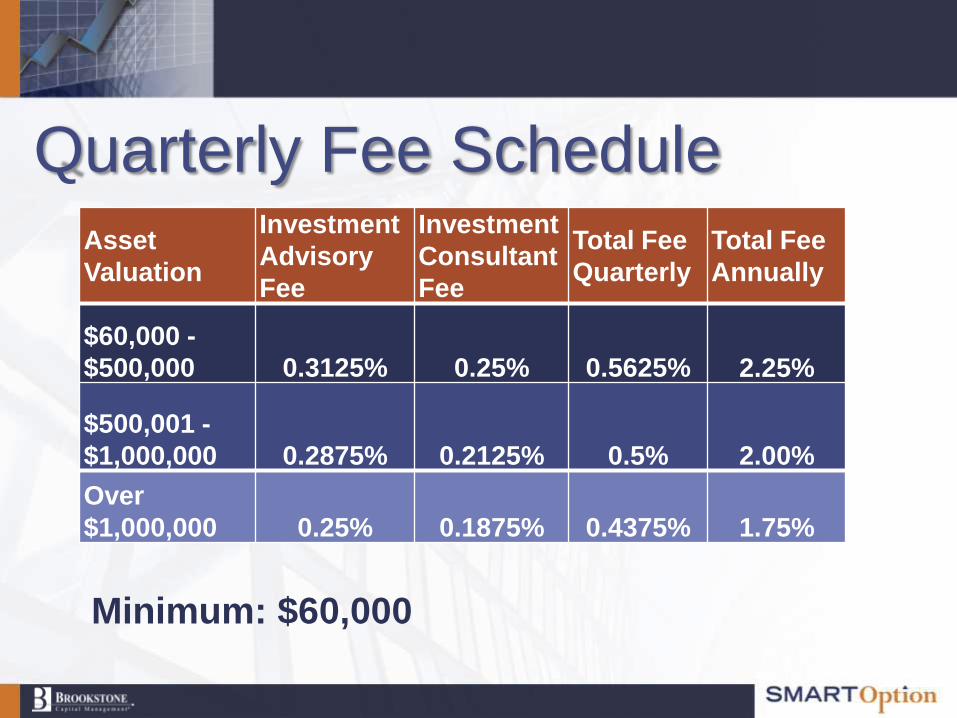
Quarterly Fee Schedule
Asset
Valuation
Investment
Advisory
Fee
Investment
Consultant
Fee
Total Fee
Quarterly
Total Fee
Annually
$60,000 -
$500,000 0.3125% 0.25% 0.5625% 2.25%
$500,001 -
$1,000,000 0.2875% 0.2125% 0.5% 2.00%
Over
$1,000,000 0.25% 0.1875% 0.4375% 1.75%
Minimum: $60,000

It‟s all about transparency
► With fee-based money management youknow what you are paying for upfront.
► Your advisor’s interest is in-line with yours.The better your investments performs thehigher the fee they will receive.
► When compared to other fee structures forcomparable products, this fee schedule isquite reasonable.

Expense Ratios► According to the Investment Company Institute (ICI) the average
expense ratio for a mutual fund that is actively managed is 1.45%.
► This includes fees paid to the manager of the fund, administrative
costs, marketing and distribution services.
► The expense ratio is not deducted from your account, rather the
investment return you receive is already net of the fees.
► Plus on top of that you will also pay your advisor a fee. Typically
1%-2%.
► Assuming 1.5% (advisory fee) + 1.45% (average expense ratio
mutual fund) this brings the total cost of owning a mutual fund to
about 3.0%, not to mention trading and transaction fees that may
apply!

This Putnam Fund has an expense ratio of
1.58%
+ 1.50% Management fee + Other transaction costs $$$

► The underlying holdings in the account consist of an
ETF (SPY) and options (puts and calls), all of which
are highly-traded, marketable securities.
Therefore, the strategy is 100% liquid at all times as
we could simply sell these securities if needed at any
time.
► To optimize the strategy, we would strongly
discourage you from taking funds out of the
SMARToption Model, so that you can receive the full
benefit of the model‟s performance.
Liquidity

► SMARToption is positioned as the core “growth”
strategy and so short-term liquidity should be
addressed elsewhere in your financial plan.
Liquidity

Technology

Technology AdvantageOne of the most sophisticated and highest performing
strategies in the industry, SMARToption requires advanced
technology to be able to implement across thousands of
accounts.
►We have developed a proprietary electronic system which
facilitates implementation, monitoring, and adjustment of the
strategy.
►By specifically designing our interface consistent with our
strategy, we have dramatically simplified implementation and
management activities such as trading, new account
investment, reporting, etc.

OperationsTrading Systems
● Broker-Specific Trading and Order Management Systems
● Proprietary/Custom Trader Software
Monitoring/Coverage
● Continuous oversight /monitoring during trading hours
● Multiple traders monitoring positions and executions (redundancy)
● Automated email/phone notifications on market price, adjustment &
liquidation points
Back Office/Reporting
● Captools (GIPS® Compliant) performance software

Industry Recognition

SMARToption‟s
Recognition and Awards
5 Star Rated for
3 Years
2008-2009-2010

SMARToption‟s
Recognition and Awards
#1Market-Neutral
Manager
For 1 and 5 Years**August 22, 2011

SMARToption‟s
Recognition and Awards
3, 5, 7 and 10 YearsTop 1% of Large Cap Money Managers
for Returns* *As of 2010

SMARToption‟s
Recognition and Awards
3, 5, 7 and 10 YearsTop 1% of Large Cap Money Managers
for Low Risk* *As of 2010

SMARToption‟s
Recognition and Awards
3 Years(among the top 10 performers in its peer group of
several thousand large cap money managers as
maintained by Informa Investment Solutions)
PSN TOP Gun

GIPS® compliant (verified through end of 2010)
demonstrated returns over 14 years.
SMARToption‟s
Recognition and Awards
In bull, bear and flat market conditions

Performance
is GIPS®
Verified

Core Equity
SMARToption as a Core
HoldingSatellite
Positions (such
as Real
Estate, Commo
dities, Bonds, E
merging
Markets etc.)
SMARToption

SMARToption as a Large
Cap Holding
SMARToption

SMARToption as an
Alternative Holding
SMARToption

Performance results are presented in U.S. dollars and are gross-of-actual-fees and trading expensesand reflect the reinvestment of dividends and capital gains. Actual fees may vary based on, amongother factors, account size and custodial relationship. No current or prospective client should assumefuture performance of any specific investment strategy will be profitable or equal to pastperformance levels. All investment strategies have the potential for profit or loss. Changes ininvestment strategies, contributions or withdrawals may cause the performance results of yourportfolio to differ materially from the reported composite performance. Different types ofinvestments involve varying degrees of risk, and there can be no assurance that any specificinvestment will either be suitable or profitable for a client's investment portfolio. Historicalperformance results for market indices and/or categories generally do not reflect the deduction oftransaction and/or custodial charges or the deduction of an investment-management fee, theincurrence of which would have the effect of decreasing historical performance results. Economicfactors, market conditions, and investment strategies will affect the performance of any portfolio andthere are no assurances that it will match or outperform any particular benchmark. Swan WealthAdvisors, “the Firm”, claims compliance with the Global Investment Performance Standards (GIPS®).To receive a complete list and description of the firm’s composites and/or a presentation that adheresto the GIPS® standards, please contact the Firm at the address listed.
©2012 Brookstone Capital Management, LLC. All rights reserved.