smarcb1 ini1 genetic inactivation is responsible for...
TRANSCRIPT

1
SMARCB1/INI1 genetic inactivation is responsible for tumorigenic properties of epithelioid
sarcoma cell line VAESBJ
Monica Brenca1, Sabrina Rossi2, Erica Lorenzetto1, Elena Piccinin1, Sara Piccinin1, Francesca
Maria Rossi3, Alberto Giuliano1, Angelo Paolo Dei Tos2, Roberta Maestro1*, Piergiorgio
Modena1*.
Authors’ affiliation: 1Experimental Oncology 1, 3Clinical and Experimental Onco-Hematology
Unit, Centro di Riferimento Oncologico, Aviano, Italy; 2Department of Pathology, Treviso
Regional Hospital, Italy.
* Senior co-authorship.
Correspondence: Piergiorgio Modena, Unit of Experimental Oncology 1, Centro di Riferimento
Oncologico, via F. Gallini 2, 33081 Aviano (PN), Italy. E-mail: [email protected]
Running title: SMARCB1 in VAESBJ cell line
Keywords: sarcoma; SMARCB1; INI1; epithelioid sarcoma; malignant rhabdoid tumor; VAESBJ
Conflict of interest statement: No conflicts to disclose with regard to the manuscript submitted.
Financial support: This work was supported by the Italian Ministry of Research and Health to R.
Maestro (MIUR-Fondo per gli Investimenti della Ricerca di Base; Ricerca Finalizzata, 5X1000
funding), the Italian Association for Cancer Research to P. Modena (AIRC).
Acronyms: ES= epithelioid sarcoma; MRT= malignant rhabdoid tumor; MLPA= Multiplex
ligation-dependent probe amplification; SRB= Sulphorhodamine B. ATCC= American Tissue
Culture Collection database.
on February 15, 2019. © 2013 American Association for Cancer Research. mct.aacrjournals.org Downloaded from
Author manuscripts have been peer reviewed and accepted for publication but have not yet been edited. Author Manuscript Published OnlineFirst on April 10, 2013; DOI: 10.1158/1535-7163.MCT-13-0005

2
ABSTRACT
Epithelioid sarcoma (ES) is a rare soft tissue neoplasm that usually arises in the distal extremities
of young adults. ES presents a high rate of recurrences and metastases and frequently poses
diagnostic dilemmas. We previously reported loss of tumor suppressor SMARCB1 protein
expression and SMARCB1 gene deletion in the majority of ES cases. Unfortunately, no appropriate
pre-clinical models of such genetic alteration in ES are available. In the present report we identified
lack of SMARCB1 protein due to a homozygous deletion of exon 1 and upstream regulatory region
in epithelioid sarcoma cell line VAESBJ. Restoration of SMARCB1 expression significantly
affected VAESBJ cell proliferation, anchorage-independent growth and cell migration properties,
thus supporting the causative role of SMARCB1 loss in ES pathogenesis. We investigated the
translational relevance of this genetic background in ES and demonstrated that SMARCB1 ectopic
expression significantly augmented VAESBJ sensitivity to gamma irradiation and acted
synergistically with Flavopiridol treatment. In VAESBJ, both activated ERBB1/EGFR and
HGFR/MET impinged on AKT and ERK phosphorylation. We demonstrated a synergistic effect of
combined inhibition of these two receptor tyrosine kinases using selective small molecule inhibitors
on cell proliferation. These observations provide definitive support to the role of SMARCB1
inactivation in the pathogenesis of epithelioid sarcoma and disclose novel clues to therapeutic
approaches tailored to SMARCB1-negative ES.
on February 15, 2019. © 2013 American Association for Cancer Research. mct.aacrjournals.org Downloaded from
Author manuscripts have been peer reviewed and accepted for publication but have not yet been edited. Author Manuscript Published OnlineFirst on April 10, 2013; DOI: 10.1158/1535-7163.MCT-13-0005
3
INTRODUCTION
Epithelioid sarcoma (ES, International Classification of Diseases for Oncology code number
8804/3) is a rare mesenchymal neoplasm that displays variable epithelioid morphology, presents a
high rate of recurrences and metastases and frequently poses diagnostic dilemmas (1). It usually
affects young adults and arises in the distal extremities (classic-type ES) or, more rarely, in
proximal sites of the trunk (proximal-type ES). Proximal-type ES is more frequently associated
with epithelioid or rhabdoid morphology and higher mitotic activity (2).
The SMARCB1 gene located at 22q11 chromosomal region encodes for an invariant subunit of
SWI/SNF chromatin remodeling complex and has been reported to act as a tumor suppressor gene
in infantile malignant rhabdoid tumor (MRT) (3, 4), a highly aggressive neoplasm affecting renal or
extra-renal soft tissue and cerebral tissue in pediatric patients. Previously published studies indicate
that SMARCB1/INI1 gene is involved in the control of genomic stability and in the regulation of
cell cycle progression (5). SMARCB1 stimulates the p16/Rb tumor suppressor pathway by
activation of CDKN2A and inhibition of Cdk/CyclinD (6). As a result, in MRT cell lines it has been
demonstrated that SMARCB1 loss is associated with responsiveness to Cdk/Cyclin inhibitors, such
as 4-HPR (7) and Flavopiridol (8). In addition, the in vivo spontaneous tumorigenesis in
SMARCB1+/- knock-out mice is increased by TP53 null genetic background (9) and is prevented by
CCND1 ablation (10), further supporting the interaction with crucial molecules controlling cell
cycle progression.
We first reported evidence of SMARCB1 inactivation in ES (11), an event frequently associated
with homozygous gene deletions (12). The relevance of SMARCB1 in ES pathogenesis was then
supported by other reports of subtle intragenic mutations, including small deletions and point
mutations (13, 14). Subsequent studies reported the occurrence of SMARCB1 protein and/or genetic
alterations in ES ranging from 60% to 93% (12-16). Although these differences may be attributable
to the different molecular approaches undertaken to assess SMARCB1 inactivation, the lack of
appropriate preclinical models for this enigmatic sarcoma subtype has so far prevented the
assessment of the causal role in ES pathogenesis.
Here we provide evidence that the epithelioid sarcoma cell line VAESBJ carry a homozygous
SMARCB1 deletion and that in this cell line SMARCB1 actually acts as a tumor suppressor.
Moreover, we provide evidence that SMARCB1 inactivation results in hyperactivation of
ERBB1/EGFR and HGFR/MET pathways, thus disclosing novel avenues for the treatment of ES
patients.
on February 15, 2019. © 2013 American Association for Cancer Research. mct.aacrjournals.org Downloaded from
Author manuscripts have been peer reviewed and accepted for publication but have not yet been edited. Author Manuscript Published OnlineFirst on April 10, 2013; DOI: 10.1158/1535-7163.MCT-13-0005

4
MATERIALS AND METHODS
Cancer cell lines. VAESBJ was purchased from Interlab Cell Line Collection, Genova (Italy)
and the other cell lines were from ATCC. Sarcoma subtypes represented were osteosarcoma
(CRL1543/HOS; MG63), rhabdomyosarcoma (CRL7862/Hs729.T, CRL7726/T174,
CRL7763/TE381.T), epithelioid sarcoma (VAESBJ, ATCC number CRL-2138), fibrosarcoma
(HTB152/Hs913.T; MES-SA), leiomyosarcoma (HTB88/SK-LMS-1), renal rhabdoid sarcoma
(G401) and renal leiomyoblastoma (G402). Hek293 and IMR90 are immortalized non-cancer cell
lines originally derived from human embryonic kidney and fibroblasts, respectively. Cells were
grown in RPMI 1640 supplemented with 10% heat-inactivated FBS, in a humidified incubator at
37°C and 5% CO2. Cell lines were authenticated regularly by microsatellite DNA fingerprinting. In
order to establish the G402 and VAESBJ xenograft, 5x10⁶ cells were injected subcutaneously in the
flank of nude mice. After three weeks, the tumor was removed, formalin-fixed and processed as
reported for immunohistochemistry analysis. For infection experiments, viral supernatants were
prepared using pBabe-SMARCB1 (a kind gift by BE Weissman) and pBabe-control vectors using
standard calcium-phosphate trasfection method in LynxA cells (17). Supernatants were used for
infection with polybrene 4 ug/ul by centrifugation at 1600 rpm for 1 h and over-night incubation at
32°C. Medium was then replaced and 48h later puromycin selection was started for 4 days. Bulk
cell population was used in all experiments after 24h recovery from antibiotic selection. For
transfection experiments, cells were transfected using the Dharmafect Transfection Reagent
(Thermo Scientific) according to the instructions of the manufacturer and CCND1 was silenced in
VAESBJ cell line using CCND1 siRNA (s229 Ambion) and compared with off-target control
siRNA (AM4611 Ambion). Cells were collected at different time-points post-transfection and
screened for CCND1 expression by Western Blot and qPCR analysis. In in-vivo experiments, 106
cells from pBabe-SMARCB1 and pBabe-control infected VAESBJ cells from three independent
infection experiments were subcutaneously injected in the flank of nude mice. Tumor growth was
monitored over time and calculated using the formula 1/2(r3). Once mice were sacrificed, tumors
were explanted, weighted and photographed. Animal experimentation was approved by Institutional
IRB and performed according to National laws.
Protein expression. For Western blot analysis, protein lysates were prepared in RIPA buffer
(Sigma), forty micrograms of cell lysate were loaded on 4-15% gradient PAGE gels (Biorad) and
electro-blotted onto polyvinylidene difluoride membranes (Amersham Biosciences). Subsequently,
membranes were incubated 1 hour at room temperature in a solution of TBST [10 mmol/L Tris-HCl
(pH 8.0), 0.15 mol/L NaCl, and 0.05% Tween 20] supplemented with 5% nonfat dry milk. For
on February 15, 2019. © 2013 American Association for Cancer Research. mct.aacrjournals.org Downloaded from
Author manuscripts have been peer reviewed and accepted for publication but have not yet been edited. Author Manuscript Published OnlineFirst on April 10, 2013; DOI: 10.1158/1535-7163.MCT-13-0005
5
immunodetection, the anti-BAF47/SNF5 antibody (BD Transduction Laboratories) was used
diluted 1:250. After overnight incubation at 4°C with the primary antibody, membranes were
washed in TBST, followed by AlexaFluor680– or IRDye800CW-conjugated goat-antimouse or
goat-antirabbit antibodies (from Invitrogen and Li-Cor, respectively). Odyssey infrared imaging
system (Li-Cor) was used for detection. Protein loading equivalence was assessed using an anti-
Gapdh antibody (Sigma). Additional antibodies used are: TP53 (DO-1 1:1000, Santa Cruz), CCND1
(DCS-6 1:500, Santa Cruz), CDKN2A/p16 (C-20 1:1000, Santa Cruz), CDKN1A/p21 (H-164
1:500, Santa Cruz), PARP (1:1000, Cell Signaling), CASP3 (1:1000, Cell Signaling), CASP7
(1:1000, Cell Signaling), P(Tyr1068)-EGFR (1:1000, Cell Signaling), EGFR (1:1000, Cell
Signaling), P(Ser473)-AKT (1:1000, Cell Signaling), AKT (1:1000, Cell Signaling), P-ERK1/2
(1:1000, Cell Signaling), ERK1/2 (1:1000, Cell Signaling), P(Tyr1003)-MET (1:1000, Cell
Signaling), MET (1:1000, Santa Cruz), Vinculin (1:10000 Santa Cruz). Immunophenotyping with
CD34, cytokeratins, epithelial membrane antigen and CD31 antibodies was performed for uniform
pathologic re-examination of xenograft tumors. Protein expression of SMARCB1 was investigated
by immunohistochemistry using anti-BAF47/SNF5 antibody 1:100 (BD Transduction
Laboratories). Endogenous peroxidise was blocked with 0.3% hydrogen peroxide in methanol for
30 minutes. For antigen retrieval the slides were immersed in citrate buffer solution 5 mM ph 6 and
heated in autoclave at 95°C for 15 minutes. Immunohistochemistry analysis was done using Ultra
vision detection system (LabVision). Expression of phosphorylated receptor kinases was detected
using the RTK Proteome Profiler Array kit (R&DSystems). The procedures were done according to
the manufacturer’s protocol using 300 ug of protein lysate per array and signals generated by HRP-
conjugated secondary antibody were visualized and quantified with Chemidoc imaging system
(Biorad).
Real-time PCR. SMARCB1 mRNA expression was analyzed by quantitative real-time PCR.
Total RNA was extracted using Trizol reagent (Ambion) and 1 μg RNA was retro-transcribed using
Superscript II reverse transcriptase (Gibco) with random primers. Ten nanograms of cDNA were
used as template in 20 μl PCR reactions with 1x TaqMan Universal PCR master mix (Applera).
Relative quantification of gene expression was performed in triplicate using TaqMan
AssaysonDemand on a ABI Prism 7900HT Sequence Detection System (Applera) by comparative
Ct method, using the HPRT gene (HPRT PDAR, 4326321E) as endogenous reference control and
293 cell line as calibrator. SMARCB1 assay used was Hs00268260_m1, encompassing exons 4-5.
Mutational analysis. Mutational analysis was performed by exon amplification and sequencing
as previously described (11). For Multiplex ligation-dependent probe amplification (MLPA), tumor
DNA (100 ng) was subjected to DNA copy number analysis using MLPA kits P258-B1, P294-A1
on February 15, 2019. © 2013 American Association for Cancer Research. mct.aacrjournals.org Downloaded from
Author manuscripts have been peer reviewed and accepted for publication but have not yet been edited. Author Manuscript Published OnlineFirst on April 10, 2013; DOI: 10.1158/1535-7163.MCT-13-0005

6
and P171 (MRC-Holland), following manufacturer instructions and together with normal DNA
samples and cancer cell lines with known SMARCB1 gene copy number alterations as controls.
Fragment separation was performed on an ABI3130xl genetic analyzer (Applera). Raw data peak
pattern evaluation was performed using GeneMapper software (Applera) and Coffalyser software
was used for data analysis (MRC-Holland). Homozygous deletion of VAESBJ and G402 cell lines
was verified by MLPA and delimited and cloned by STS deletion mapping using PCR primer pairs
available upon request.
Cell proliferation assay. Cells were plated in multiwell plates and cell proliferation was assessed
at different time points by either Trypan blue cell counting or with Sulphorhodamine B staining
(18). For SRB staining, cells (5x10³) were grown in 96-well plates for 72 hours, fixed using cold
50% TCA for 1 hour at 4°C, then were stained using Sulphorhodamine B (Sigma) 0.4% in 1%
acetic acid. Tris-Base 10 mM was used for solubilization. The absorbance of protein biomass, that
is proportional to the cell number, was read at 550 nm. Time zero plates were fixed after over-night
cell adhesion and served for background subtraction and calculation of relative absorbance values
as described (18). Drugs used were Flavopiridol (Sigma), Fenretinide (Sigma), PHA665752
HGFR/MET inhibitor (Santa Cruz) and 324674 EGFR inhibitor (Calbiochem). Drugs were
resuspended in DMSO or ethanol (in case of Fenretinide) and added 24 hours post- plating at the
indicated concentrations. Cells were fixed 72 hours later. No treatment, DMSO or ethanol vector
control served as calibrator sample. Combination index of drug combinations was calculated with
CompuSyn software (Combosyn Inc.).
Anchorage-independent growth. Cells (105) were resuspended in 0.35% agar complete medium
and seeded on 0.5% bottom agar medium in 6 cm petri dishes. After two weeks, plates were stained
with iodonitrotetrazolium violet (1mg/ml, Sigma) and clones were counted at the microscope.
β-Galactosidase assay. The β-gal staining was used as a surrogate marker of senescence. Cells
were washed once in PBS (pH 7.2), fixed with 0.5% glutaraldehyde for 15 minutes and washed in
PBS (pH 7.2) supplemented with 1 mM MgCL2. Cells were stained with senescence-associated β-
gal (SA-β-Gal) stain solution [1mg/ml 5-bromo-4-chloro-3-indolyl-β-D-galactopyranoside, 0.12
mM K3Fe(CN)6, 0.12 mM K4Fe(CN)6, 1mM MgCl2 in PBS (pH 6)] and incubated over night at
37°C and 5% CO2. The β-Gal positive cells in twenty microscope fields were counted under bright
field on a Olympus IX70 microscope and representative photographs were taken.
Migration assay. Transwell permeable supports, 6.5mm diameter inserts, 8.0 um pore size,
polycarbonate membrane (Corning Inc.) were used to perform migration assay. Cells (105) in 1%
fetal bovine serum containing Dulbecco’s modified Eagle’s medium were seeded in the upper
chamber. The lower chamber of the transwell was filled with 600 µl of culture medium containing
on February 15, 2019. © 2013 American Association for Cancer Research. mct.aacrjournals.org Downloaded from
Author manuscripts have been peer reviewed and accepted for publication but have not yet been edited. Author Manuscript Published OnlineFirst on April 10, 2013; DOI: 10.1158/1535-7163.MCT-13-0005

7
10% fetal bovine serum. Cells were incubated at 37°C for 16 h. The transwells were then removed
from the 24-well plates and stained with 0.1% Crystal Violet in 25% methanol. Non-migrated cells
were scraped off the top of the transwell with a cotton swab. Migrated cells were quantified by
eluting crystal violet with 1% SDS and reading the absorbance at 550 nm. In parallel, equal
amounts of cells were plated in a 96 well plate, incubated at 37°C for 16 h, stained with crystal
violet as described and the absorbance values obtained from transwell elution were normalized over
absorbance values of the 96-well plate to obtain the percentage of migrated cells in relation to the
different proliferation capacity between SMARCB1 expressing and control cells.
Cell Cycle Analysis. Guava cell cycle instrument (Millipore) was used to perform cell cycle
analysis. SMARCB1 re-expressing and control cells were plated in p60 tissue culture dish. At
different time points post-plating cells were harvested and fixed in ethanol 70%. Ethanol was
eliminated by centrifugation, cells were washed in PBS 1X, centrifugated and stained with Guava
Cell Cycle Reagent, incubated for 40 minutes, shielded from light and the data were acquired on the
Guava instrument.
Bromodeoxyuridine (BrdU) Assay. BrdU Flow Kit (BD pharmingen) was used to quantify cells
that were actively synthesizing DNA. Cells were pulsed with 2 hours of BrdU incorporation washed
and released for additional 2 hours in complete medium. Cells were permeabilized and processed
according to the manufacturer’s instructions. Stained cells were analyzed with flow cytometer
(Beckman Coulter).
Caspase 3/7 Assay. Caspase 3/7 Activity was assessed using Caspase-Glo 3/7 assay (Promega).
Cells were irradiated in suspension using a Gammacell 1000 Elite biologic irradiator (Nordion Inc),
plated in 96 white-walled plates and analyzed after 48h. Caspase 3/7 GLO Reagent was added to
each well and gently mixed for 1 minute. The luminescence of each sample was measured with a
plate-reading luminometer 30 minutes after staining. As a control, all samples analyzed were plated
also in a 96 multiwell and stained with SRB, as indicated above. To take into account the different
proliferation between SMARCB1-expressing and control cells the measured Caspase-Glo 3/7 assay
luminescence was normalized over SRB absorbance values.
Clonogenic Assay. Cells (103) were plated in 6 cm culture dishes and incubated for 10 days in a
humidified incubator at 37°C and 5% CO2. Plates were stained with 0.1% Crystal Violet in 25%
methanol, cells were photographed and then eluted with 1% SDS. An equal amount of initial cells
was immediately fixed and corresponding absorbance readings were used to normalize for
variations in cell seeding among experimental conditions.
Cell death evaluation. Cells (2x10⁵) were irradiated in suspension and plated in 6-well plates.
After 48h of treatment cells were harvested, washed in PBS 1X and stained with Annexin V-FITC
on February 15, 2019. © 2013 American Association for Cancer Research. mct.aacrjournals.org Downloaded from
Author manuscripts have been peer reviewed and accepted for publication but have not yet been edited. Author Manuscript Published OnlineFirst on April 10, 2013; DOI: 10.1158/1535-7163.MCT-13-0005

8
(Clontech; 20µg/ml) and 7 amino Actinomycin D (BD Pharmingen). Following incubation at room
temperature for 15 minutes in the dark, cells were analyzed with FACScan flow cytometer.
Statistics. Comparisons between two classes have been performed by two-sample unpaired t-test.
Comparisons between three or more classes have been performed by repeated-measures one-way
analysis of variance (Anova). Two classes’ comparisons with multiple measurement points have
been performed by two-way Anova. The GI50 values were calculated by non-linear regression
curve fit of dose versus response based on Hill equation. All statistical analyses were carried out
using Prism 5 software (GraphPad Inc.). At least three independent biological replicate experiments
were performed and average±SD of these replicates were considered. P-values < 0.05 were
considered statistically significant.
on February 15, 2019. © 2013 American Association for Cancer Research. mct.aacrjournals.org Downloaded from
Author manuscripts have been peer reviewed and accepted for publication but have not yet been edited. Author Manuscript Published OnlineFirst on April 10, 2013; DOI: 10.1158/1535-7163.MCT-13-0005

9
RESULTS
SMARCB1 protein expression in sarcoma cell lines. Western blot analysis of a panel of
commercially available sarcoma cell lines revealed that, in addition to previously reported rhabdoid
sarcoma cell lines, the VAESBJ and G402 cell lines displayed a dramatic reduction of SMARCB1
protein expression (Figure 1A and Supplemental Figure 1A). To ascertain the histology of these
cells lines, subcutaneous xenograft tumors were established in nude mice. Morphology (Figure 1B)
and immunophenotype (CD34 and EMA positive, SMARCB1 negative, Figure 1C-E) of VAESBJ
xenografts were coherent with an origin of this cell line from a ES, as originally described (19). On
the contrary, morphology, immunophenotype analysis of the G402 xenografts (CD34 and
SMARCB1 negative, SMA and EMA positive, Supplemental Figure 1B-E) as well as available
clinical data (a kidney cancer in an infant 6 months-old patient), suggest that G402 originated from
a misclassified renal malignant rhabdoid tumor, rather than from a leiomyoblastoma as listed in
ATCC.
SMARCB1 is homozygously deleted in VAESBJ and G402 sarcoma cell lines. Exon
amplification and MLPA analysis indicated that VAESBJ and G402 lost the chromosome region
encompassing SMARCB1 exon 1 and exon 3, respectively (Figure 2A and Supplemental Figure 1F-
G). In particular, PCR-based chromosomal walking allowed the identification of an 8.4 kb
homozygous deletion encompassing the genomic region from MMP11 exon 3 to SMARCB1 exon 1
in VAESBJ (Supplemental Figure 2A-B). Primer pairs flanking the region of deletion allowed
cloning and sequencing of the breakpoint in VAESBJ (Figure 2B). Interestingly, high-resolution
SNP array-based copy number analysis of this cell line performed by the Sanger Centre
(http://www.sanger.ac.uk/cgi-bin/genetics/CGP/cghviewer/CghHome.cgi) failed to identify the
presence of such a homozygous deletion (Supplemental Figure 2C-D), thus supporting the subtle
nature of such genetic alteration. Moreover, real-time PCR analysis using primers encompassing
exons 4-5 (Figure 2C) evidenced that the mRNA expression of SMARCB1 in VAESBJ was
significantly impaired compared to control 293T cells, consistent with lack of exon 1/upstream
regulatory regions and indicating that no aberrant MMP11-SMARCB1 fusion transcript was
significantly expressed as a result of this deletion. Real-time PCR analysis revealed a highly
reduced expression also in G402, consistent with nonsense-mediated mRNA decay, as predicted by
the formation of a premature stop codon due to exon 3 deletion. Additional MLPA analysis of
VAESBJ cells revealed concurrent homozygous deletion of CDKN2A and CDKN2B loci encoding
p16, p14 and p15 proteins (Figure 2D).
on February 15, 2019. © 2013 American Association for Cancer Research. mct.aacrjournals.org Downloaded from
Author manuscripts have been peer reviewed and accepted for publication but have not yet been edited. Author Manuscript Published OnlineFirst on April 10, 2013; DOI: 10.1158/1535-7163.MCT-13-0005

1
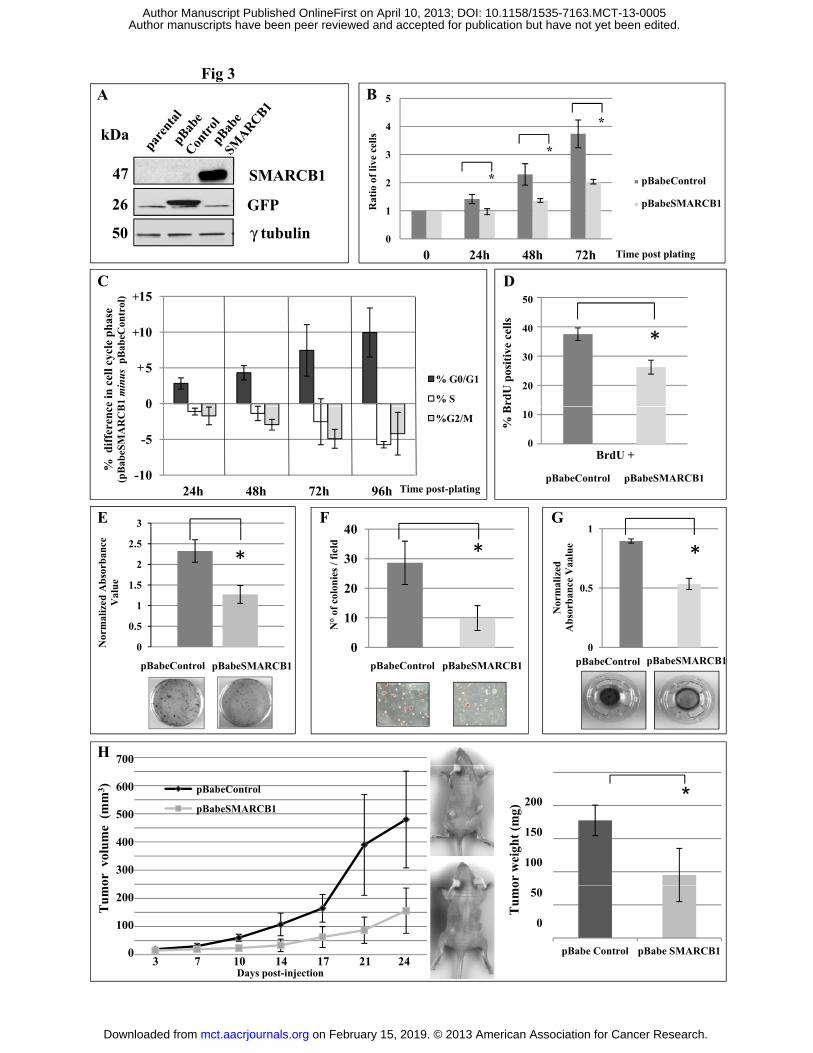
SMARCB1 loss sustains VAESBJ tumorigenic properties. In order to establish the relevance of
SMARCB1 inactivation in VAESBJ cell line, we reintroduced SMARCB1 via retroviral infection
(Figure 3A). After virus infection, cells were selected and the bulk cell population was analyzed for
cell proliferation, cell cycle distribution, senescence, anchorage-independent growth and cell
migration. For comparison, selected experiments were performed in parallel in G401 malignant
rhabdoid tumor cell line (Supplemental Figure 3), which was previously reported to be affected by
SMARCB1 restoration (7, 8, 20).
Ectopic SMARCB1 expression significantly reduced cell proliferation without affecting the extent of
spontaneous cell death, as assessed by trypan blue staining (p= 0.019, 0.014 and 0.004 at 24h, 48h
and 72 h respectively, two-way Anova p< 0.001 for global trend, Figure 3B). The observed
reduction in cell proliferation correlated with a reduction of cells in S and G2/M-phases and an
increase in the G0/G1-phase, as assessed by flow citometry (Figure 3C). Concordantly, BrdU
incorporation and clonogenic potential were reduced in SMARCB1 engineered cells (p= 0.025,
Figure 3D and p= 0.001, Figure 3E respectively). Also anchorage-independent growth was reduced
in SMARCB1 re-expressing VAESBJ cells (p= 0.019, Figure 3F), in part likely as a result of
impaired proliferation. Different from the rhabdoid cell line G401, the ectopic expression of
SMARCB1 in VAESBJ failed to result in the induction of premature senescence, as determined by
SA--gal staining (Supplemental Figure 3). Moreover, similar to what was described for rhabdoid
cell lines (21), SMARCB1 re-expression significantly reduced VAESBJ cell migration, as assayed
by transwell chamber assay (p< 0.001, Figure 3G and Supplemental Figure 3). Concordant with the
observed reduction of anchorage-independent growth, also in-vivo tumorigenesis was significantly
reduced and tumors grown were significantly smaller in SMARCB1 re-expressing VAESBJ cells
(p< 0.0001 and p= 0.036 respectively, Figure 3H).
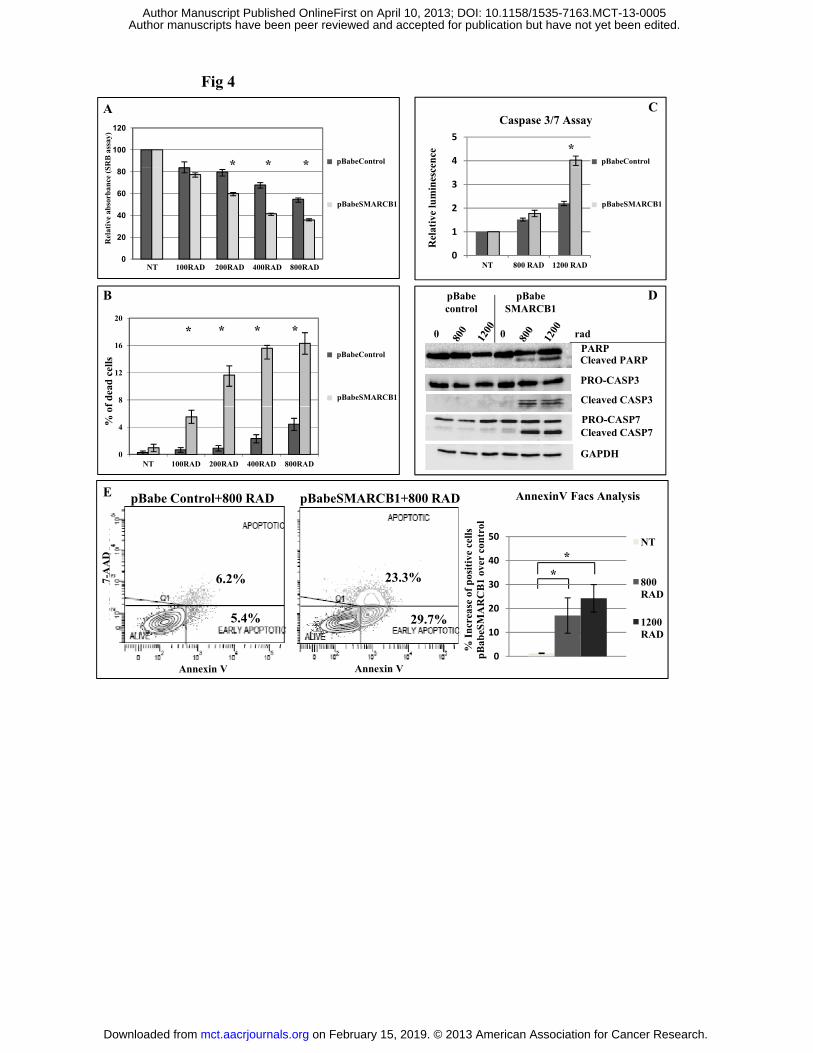
SMARCB1 restoration sensitizes VAESBJ cell line to irradiation. The SWI/SNF chromatin
remodelling complex and SMARCB1 itself have been reported to influence the response to DNA
damage (22). We here demonstrate that SMARCB1 re-expression increased sensitivity to gamma
irradiation in VAESBJ cell line. Reduced cell viability (p= 0.039, 0.045, 0.02 at 200, 400 and 800
rad respectively, two-way Anova p= 0.085, Figure 4A) and increased cell death (p= 0.001, 0.013,
0.002, 0.02 at 100, 200, 400 and 800 rad respectively, two-way Anova p= 0.008, Figure 4B) were
associated with increased of Caspase 3/7 activity (p= 0.014 at 1200 rad, Figure 4C) and caspase-
mediated protein cleavage (Figure 4D). The enhanced SMARCB1-mediated sensitization to
on February 15, 2019. © 2013 American Association for Cancer Research. mct.aacrjournals.org Downloaded from
Author manuscripts have been peer reviewed and accepted for publication but have not yet been edited. Author Manuscript Published OnlineFirst on April 10, 2013; DOI: 10.1158/1535-7163.MCT-13-0005

1
irradiation was also confirmed by Annexin V/7-AAD staining (p= 0.022 and p= 0.002, untreated
versus 800 rad and 1200 rad–treated cells respectively, Figure 4E).
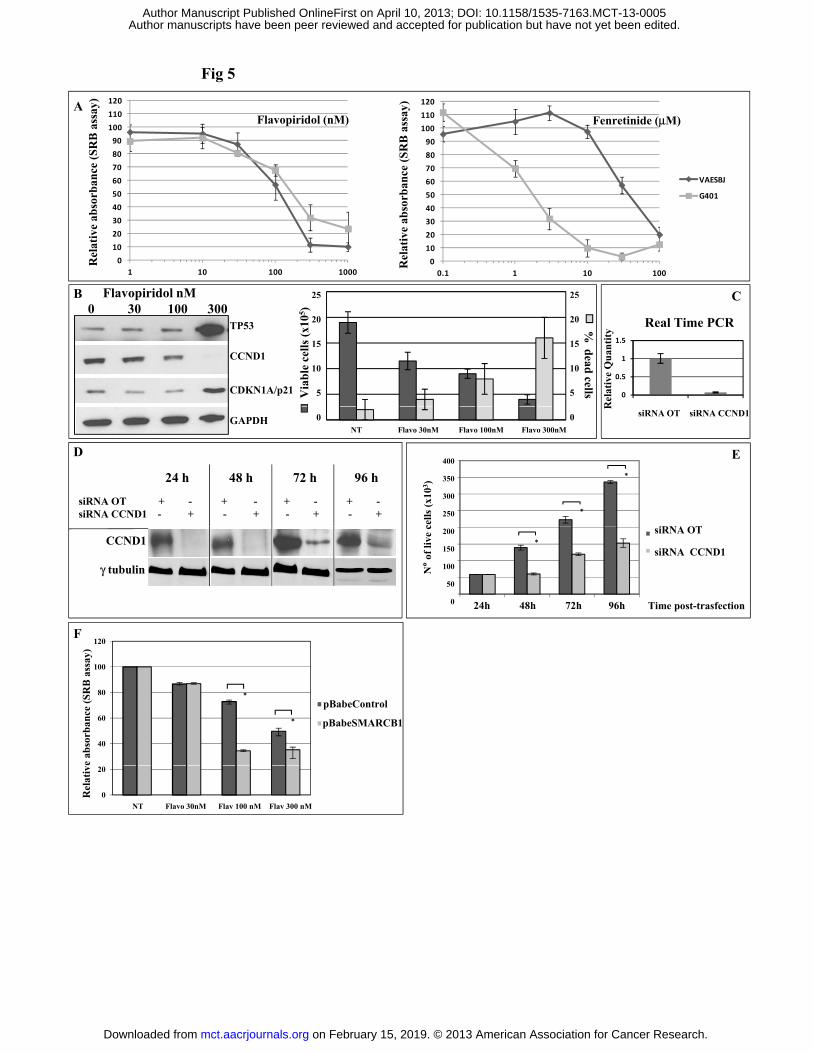
VAESBJ cell line is susceptible to Flavopiridol inhibition and to concurrent inhibition of
activated ERBB1/EGFR and HGFR/MET oncogenic pathways. We exploited VAESBJ ES cell
model to investigate the response to pharmacologic treatments that proved promising in pre-clinical
models of MRT. Fenretinide (7) and Flavopiridol (8) are reported to act as effective CDKs/cyclins
inhibitors in the cellular context of rhabdoid tumor cell lines. We compared the citotoxicity profile
of these two drugs in VAESBJ and control G401 cancer cell lines (Figure 5A). While the sensitivity
to Flavopiridol was similar for the two cell lines (G401 50% growth inhibition - GI50= 160 nM;
VAESBJ GI50= 118 nM), VAESBJ displayed a lower sensitivity to Fenretinide compared to G401
(GI50= 45 M and GI50= 1.2 M, respectively). This suggests that SMARCB1 inactivation plays a
minor role in Fenretinide sensitivity. Furthermore, Flavopiridol efficiently downmodulated CCND1
and upregulated both p53 and p21 (Figure 5B, left), consistent with a significant reduction of cell
proliferation and increased cell death (one-way Anova p< 0.001 and p= 0.008, respectively; figure
5B, right). Indeed, the siRNA-mediated silencing of CCND1 (Figure 5C-D) potently inhibited cell
proliferation (Figure 5E, p= 0.006), as did Flavopiridol. Finally, Flavopiridol effect was
significantly potentiated upon SMARCB1 restoration (p< 0.001 and p= 0.012 at 100nM and 300nM,
respectively; Figure 5F), suggesting the presence of a synergistic effect.
To gain insights on the oncogenic pathways underlying VAESBJ tumorigenic phenotype that can
be exploited for targeted therapeutic interventions, we performed phospho-protein array analyses.
These assays identified significant expression of activated/phosphorylated ERBB1/EGFR and
HGFR/MET (Figure 6A), that in turn impinge on AKT and ERK phosphorylation (Figure 6B).
Pharmacological inhibition of HGFR/MET with PHA665752 resulted in impaired cell motility and
correlated with reduced FAK kinase phosphorylation/activation (Figure 6E), while the combined
inhibition of both ERBB1/EGFR and HGFR/MET using selective small molecule inhibitors
Calbiochem 324674 and PHA665752, respectively, displayed a synergistic effect on proliferation
reduction compared to single agent treatment (Figure 6C-D). Notably, western blot and
immunohistochemistry analysis of epithelioid sarcoma tumor samples showed that multiple cases
presented ERBB1/EGFR and/or HGFR/MET overexpression and activation (Figure 6F).
on February 15, 2019. © 2013 American Association for Cancer Research. mct.aacrjournals.org Downloaded from
Author manuscripts have been peer reviewed and accepted for publication but have not yet been edited. Author Manuscript Published OnlineFirst on April 10, 2013; DOI: 10.1158/1535-7163.MCT-13-0005

1
DISCUSSION
We here demonstrate that SMARCB1 loss plays a crucial role in the tumorigenic phenotype of
VAESBJ cell line, thus providing definitive evidence of the causative role of SMARCB1 loss in ES
pathogenesis. SMARCB1 is a core subunit of the mammalian SWI/SNF ATP-dependent chromatin
remodelling multi-subunit complexes. By epigenetically affecting histone-DNA contacts and
nucleosome remodelling, the SWI/SNF complexes regulate a broad range of cellular pathways (23,
24). Loss of SMARCB1 has been demonstrated to occur at high frequency in MRT and ES.
Accordingly, genetic inactivation of SMARCB1 tumour suppressor gene has been documented in
several MRT-derived cell lines. Instead, occasional reports of SMARCB1 mutations in cell lines of
other tumor types, such as rhabdomyosarcoma (eg A204 line (25)) and Wilms’ tumor (eg G401 line
(26)), have been subsequently invalidated by re-evaluation of such cell lines as misclassified
malignant rhabdoid tumors (27, 28). To our opinion, this is also the case of G402 cell line,
originally indicated as a leiomyoblastoma, that we demonstrate to carry an exon 3 SMARCB1
deletion. Morphologic and immunophenotypic characterization of this cell line, together with the
available clinical data regarding an infant renal tumor (ATCC, www.atcc.org), allowed us to
establish that also G402 is bone-fine a MRT cell line. On the contrary, morphology and
immunophenotype of the VAESBJ xenograft (including CD34 positive staining) as well as
available clinical data on the tumor of origin, reporting a paraspinal sarcoma in a patient aged 42
(19), support the diagnosis of ES.
We provide evidence that VAESBJ carry a homozygous deletion of SMARCB1 involving exon 1.
This result indicates that VAESBJ represents a unique model to investigate the role of SMARCB1
inactivation in the context of ES. Since in MRTs cells, SMARCB1 tumour suppressor activity has
been shown to impinge on cell proliferation (29, 30), apoptosis (31), senescence (20, 27) and cell
motility (21), we investigated these phenotypes in SMARCB1-deleted VAESBJ epithelioid sarcoma
cell line. Here we provide evidence that SMARCB1 restoration in this cell line affects cell
proliferation, enhances the sensitivity to genotoxic stress and reduces cell migration. Notably,
different from what was reported for MRT cell models, restoration of SMARCB1 in VAESBJ
expression failed to result in premature senescence. In MRTs cells such a response relied on p16
activation (20). The fact that VAESBJ cells carry homozygous deletion of CDKN2A/p16 locus may
account for the attenuation of the senescent phenotype in this cell line.
We exploited VAESBJ ES cell model to gain insight into activated oncogenic pathways and
response to targeted as well as conventional genotoxic treatments. We here provide evidence that
VAESBJ cells display activation of both the receptor tyrosine kinase ERBB1/EGFR and
HGFR/MET. Recently, a role for EGFR activation has been proposed in epithelioid sarcoma (32).
on February 15, 2019. © 2013 American Association for Cancer Research. mct.aacrjournals.org Downloaded from
Author manuscripts have been peer reviewed and accepted for publication but have not yet been edited. Author Manuscript Published OnlineFirst on April 10, 2013; DOI: 10.1158/1535-7163.MCT-13-0005

1
Although VAESBJ does not carry EGFR mutation, it displayed sustained, EGFR-independent,
phospho-AKT activation and showed limited response to EGFR inhibition (32). We found that the
HGFR/MET pathway cooperates with EGFR in sustaining AKT and ERK phosphorylation.
Concordantly, combined inhibition of ERBB1/EGFR and HGFR/MET pathways resulted in
enhanced and synergic growth suppression. Thus, our observations provide an explanation for the
incomplete response of VAESBJ cell line to EGFR inhibition (32).
Similar to MRTs cell lines (7, 10), Flavopiridol treatment in VAESBJ induced both CCND1
protein downmodulation and cell cycle arrest. Unexpectedly, we observed a synergistic effect on
cell cycle block with combined Flavopiridol treatment and SMARCB1 ectopic re-expression,
indicating that Flavopiridol affects cell proliferation and viability through pathways at least in part
independent of SMARCB1 tumor suppressor.
The cancer genome of pediatric MRTs is extraordinarily stable and the only recurrent alteration
reported so far is SMARCB1 inactivation (33), demonstrating that in specific cellular contexts
unique genetic alterations are sufficient to sustain tumorigenesis. In contrast, epithelioid sarcoma
(11, 34) and VAESBJ ES model system (35) (see also http://www.sanger.ac.uk/cgi-
bin/genetics/CGP/cghviewer/CghHome.cgi), despite the shared feature of recurrent SMARCB1
inactivation, demonstrate a much more unstable genome, thus suggesting that in the adult setting
the cancer-initiating cell of epithelioid sarcoma requires the overriding of multiple pathways,
including the one involved in the control of genome integrity.
The p16/CCND1/CDK4/RB/E2F pathway inactivation has been initially reported as the
prominent downstream effect of SMARCB1 inactivation in MRTs (20, 30, 36). However, more
recently, engineered mouse models demonstrated that SMARCB1 haploinsufficiency cooperates
with both RB and TP53 haploinsufficiency to increase penetrance and reduce latency of tumor onset
(9, 22, 37) and in-vitro studies showed that SMARCB1 inactivation globally affects the epigenetic
status of the cancer genome (38, 39). We observed that VAESBJ cells retain a wild-type TP53 but
carry a homozygous deletion of CDKN2A locus, thus displaying impaired p16/RB and p14/TP53
responses. Overall, these data suggest that SMARCB1 collaborates with the inactivation of both
TP53 and RB signals to promote tumorigenesis by, at least in part, independent pathways.
A previous report described the involvement of SMARCB1 in the modulation of DNA repair
after UV irradiation (40). We here demonstrate that indeed SMARCB1 inactivation is responsible
for resistance to gamma irradiation and its restoration significantly augments the apoptotic response
to irradiation-induced DNA damage.
In conclusion, we provide the first characterization of a cell model of epithelioid sarcoma
carrying genetic inactivation of SMARCB1 by homozygous gene deletion. Our observations provide
on February 15, 2019. © 2013 American Association for Cancer Research. mct.aacrjournals.org Downloaded from
Author manuscripts have been peer reviewed and accepted for publication but have not yet been edited. Author Manuscript Published OnlineFirst on April 10, 2013; DOI: 10.1158/1535-7163.MCT-13-0005

1
definitive support to the role of SMARCB1 inactivation in the pathogenesis of epithelioid sarcoma
and disclose novel clues to therapeutic approaches tailored to SMARCB1-negative ES.
Acknowledgements
The pBabe-INI1 construct was a kind gift from Dr Bernard E. Weissman (University of North
Carolina, Chapel Hill, NC). We thank Dr Francesca Rossi, Core facility of flow citometry, Centro
di Riferimento Oncologico di Aviano, Italy for assistance in flow citometry analyses. This work
was supported by the Italian Ministry of Research and Health (MIUR-Fondo per gli Investimenti
della Ricerca di Base; Ricerca Finalizzata, 5X1000 funding), the Italian Association for Cancer
Research (AIRC).
on February 15, 2019. © 2013 American Association for Cancer Research. mct.aacrjournals.org Downloaded from
Author manuscripts have been peer reviewed and accepted for publication but have not yet been edited. Author Manuscript Published OnlineFirst on April 10, 2013; DOI: 10.1158/1535-7163.MCT-13-0005
1
REFERENCES 1. Fletcher CCD, Unni KK, Mertens F, editors. Pathology and genetics of tumors of soft tissue and bone.
Lyon: Iarc Press; 2002.
2. Dei Tos AP, Wagner AJ, Modena P, Comandone A, Leyvraz S. Epithelioid soft tissue tumors. Semin Oncol 2009;36:347-57.
3. Versteege I, Sevenet N, Lange J, Rousseau-Merck MF, Ambros P, Handgretinger R, et al. Truncating mutations of hSNF5/INI1 in aggressive paediatric cancer. Nature 1998;394:203-6.
4. Biegel JA, Zhou JY, Rorke LB, Stenstrom C, Wainwright LM, Fogelgren B. Germ-line and acquired mutations of INI1 in atypical teratoid and rhabdoid tumors. Cancer Res 1999;59:74-9.
5. Vries RG, Bezrookove V, Zuijderduijn LM, Kia SK, Houweling A, Oruetxebarria I, et al. Cancer-associated mutations in chromatin remodeler hSNF5 promote chromosomal instability by compromising the mitotic checkpoint. Genes Dev 2005;19:665-70.
6. Imbalzano AN, Jones SN. Snf5 tumor suppressor couples chromatin remodeling, checkpoint control, and chromosomal stability. Cancer Cell 2005;7:294-5.
7. Alarcon-Vargas D, Zhang Z, Agarwal B, Challagulla K, Mani S, Kalpana GV. Targeting cyclin D1, a downstream effector of INI1/hSNF5, in rhabdoid tumors. Oncogene 2006;25:722-34.
8. Smith ME, Cimica V, Chinni S, Challagulla K, Mani S, Kalpana GV. Rhabdoid tumor growth is inhibited by flavopiridol. Clin Cancer Res 2008;14:523-32.
9. Isakoff MS, Sansam CG, Tamayo P, Subramanian A, Evans JA, Fillmore CM, et al. Inactivation of the Snf5 tumor suppressor stimulates cell cycle progression and cooperates with p53 loss in oncogenic transformation. Proc Natl Acad Sci U S A 2005;102:17745-50.
10. Tsikitis M, Zhang Z, Edelman W, Zagzag D, Kalpana GV. Genetic ablation of cyclin D1 abrogates genesis of rhabdoid tumors resulting from Ini1 loss. Proc Natl Acad Sci U S A 2005;102:12129-34.
11. Modena P, Lualdi E, Facchinetti F, Galli L, Teixeira MR, Pilotti S, et al. SMARCB1/INI1 tumor suppressor gene is frequently inactivated in epithelioid sarcomas. Cancer Res 2005;65:4012-9.
12. Gasparini P, Facchinetti F, Boeri M, Lorenzetto E, Livio A, Gronchi A, et al. Prognostic determinants in epithelioid sarcoma. Eur J Cancer 2010.
13. Flucke U, Slootweg PJ, Mentzel T, Pauwels P, Hulsebos TJ. Re: Infrequent SMARCB1/INI1 gene alteration in epithelioid sarcoma: A useful tool in distinguishing epithelioid sarcoma from malignant rhabdoid tumor: Direct evidence of mutational inactivation of SMARCB1/INI1 in epithelioid sarcoma. Hum Pathol 2009;40:1361,2; author reply 1362-4.
14. Kohashi K, Izumi T, Oda Y, Yamamoto H, Tamiya S, Taguchi T, et al. Infrequent SMARCB1/INI1 gene alteration in epithelioid sarcoma: A useful tool in distinguishing epithelioid sarcoma from malignant rhabdoid tumor. Hum Pathol 2009;40:349-55.
15. Hornick JL, Dal Cin P, Fletcher CD. Loss of INI1 expression is characteristic of both conventional and proximal-type epithelioid sarcoma. Am J Surg Pathol 2009;33:542-50.
16. Chbani L, Guillou L, Terrier P, Decouvelaere AV, Grégoire F, Terrier-Lacombe MJ, et al. Epithelioid sarcoma: A clinicopathologic and immunohistochemical analysis of 106 cases from the french sarcoma group. Am J Clin Pathol 2009;131:222-7.
17. Hannon GJ, Sun P, Carnero A, Xie LY, Maestro R, Conklin DS, et al. MaRX: An approach to genetics in mammalian cells. Science 1999;283:1129-30.
18. Vichai V, Kirtikara K. Sulforhodamine B colorimetric assay for cytotoxicity screening. Nat Protoc 2006;1:1112-6.
19. Helson C, Melamed M, Braverman S, Traganos F, Preti RA, Helson L. International journal of oncology 1995;7:51-6.
20. Oruetxebarria I, Venturini F, Kekarainen T, Houweling A, Zuijderduijn LM, Mohd-Sarip A, et al. P16INK4a is required for hSNF5 chromatin remodeler-induced cellular senescence in malignant rhabdoid tumor cells. J Biol Chem 2004;279:3807-16.
21. Caramel J, Quignon F, Delattre O. RhoA-dependent regulation of cell migration by the tumor suppressor hSNF5/INI1. Cancer Res 2008;68:6154-61.
on February 15, 2019. © 2013 American Association for Cancer Research. mct.aacrjournals.org Downloaded from
Author manuscripts have been peer reviewed and accepted for publication but have not yet been edited. Author Manuscript Published OnlineFirst on April 10, 2013; DOI: 10.1158/1535-7163.MCT-13-0005

1
22. Klochendler-Yeivin A, Picarsky E, Yaniv M. Increased DNA damage sensitivity and apoptosis in cells lacking the Snf5/Ini1 subunit of the SWI/SNF chromatin remodeling complex. Mol Cell Biol 2006;26:2661-74.
23. Wilson BG, Roberts CW. SWI/SNF nucleosome remodellers and cancer. Nat Rev Cancer 2011;11:481-92.
24. Sansam CG, Roberts CW. Epigenetics and cancer: Altered chromatin remodeling via Snf5 loss leads to aberrant cell cycle regulation. Cell Cycle 2006;5:621-4.
25. DeCristofaro MF, Betz BL, Wang W, Weissman BE. Alteration of hSNF5/INI1/BAF47 detected in rhabdoid cell lines and primary rhabdomyosarcomas but not wilms' tumors. Oncogene 1999;18:7559-65.
26. Dowdy SF, Fasching CL, Araujo D, Lai KM, Livanos E, Weissman BE, et al. Suppression of tumorigenicity in wilms tumor by the p15.5-p14 region of chromosome 11. Science 1991;254:293-5.
27. Chai J, Charboneau AL, Betz BL, Weissman BE. Loss of the hSNF5 gene concomitantly inactivates p21CIP/WAF1 and p16INK4a activity associated with replicative senescence in A204 rhabdoid tumor cells. Cancer Res 2005;65(22):10192-8.
28. Garvin AJ, Re GG, Tarnowski BI, Hazen-Martin DJ, Sens DA. The G401 cell line, utilized for studies of chromosomal changes in wilms' tumor, is derived from a rhabdoid tumor of the kidney. Am J Pathol 1993;142(2):375-80.
29. Zhang ZK, Davies KP, Allen J, Zhu L, Pestell RG, Zagzag D, et al. Cell cycle arrest and repression of cyclin D1 transcription by INI1/hSNF5. Mol Cell Biol 2002;22:5975-88.
30. Betz BL, Strobeck MW, Reisman DN, Knudsen ES, Weissman BE. Re-expression of hSNF5/INI1/BAF47 in pediatric tumor cells leads to G1 arrest associated with induction of p16ink4a and activation of RB. Oncogene 2002;21:5193-203.
31. Ae K, Kobayashi N, Sakuma R, Ogata T, Kuroda H, Kawaguchi N, et al. Chromatin remodeling factor encoded by ini1 induces G1 arrest and apoptosis in ini1-deficient cells. Oncogene 2002;21:3112-20.
32. Xie X, Ghadimi MP, Young ED, Belousov R, Zhu QS, Liu J, et al. Combining EGFR and mTOR blockade for the treatment of epithelioid sarcoma. Clin Cancer Res 2011;17:5901-12.
33. Lee RS, Stewart C, Carter SL, Ambrogio L, Cibulskis K, Sougnez C, et al. A remarkably simple genome underlies highly malignant pediatric rhabdoid cancers. J Clin Invest 2012;122:2983-8.
34. Lualdi E, Modena P, Debiec-Rychter M, Pedeutour F, Teixeira MR, Facchinetti F, et al. Molecular cytogenetic characterization of proximal-type epithelioid sarcoma. Genes Chromosomes Cancer 2004;41:283-90.
35. Sakharpe A, Lahat G, Gulamhusein T, Liu P, Bolshakov S, Nguyen T, et al. Epithelioid sarcoma and unclassified sarcoma with epithelioid features: Clinicopathological variables, molecular markers, and a new experimental model. Oncologist 2011;16:512-22.
36. Versteege I, Medjkane S, Rouillard D, Delattre O. A key role of the hSNF5/INI1 tumour suppressor in the control of the G1-S transition of the cell cycle. Oncogene 2002;21:6403-12.
37. Chai J, Lu X, Godfrey V, Fletcher C, Roberts CW, Van Dyke T, et al. Tumor-specific cooperation of retinoblastoma protein family and Snf5 inactivation. Cancer Res 2007;67:3002-9.
38. Wilson BG, Wang X, Shen X, McKenna ES, Lemieux ME, Cho YJ, et al. Epigenetic antagonism between polycomb and SWI/SNF complexes during oncogenic transformation. Cancer Cell 2010;18:316-28.
39. Wang X, Sansam CG, Thom CS, Metzger D, Evans JA, Nguyen PT, et al. Oncogenesis caused by loss of the SNF5 tumor suppressor is dependent on activity of BRG1, the ATPase of the SWI/SNF chromatin remodeling complex. Cancer Res 2009;69:8094-101.
40. Ray A, Mir SN, Wani G, Zhao Q, Battu A, Zhu Q, et al. Human SNF5/INI1, a component of the human SWI/SNF chromatin remodeling complex, promotes nucleotide excision repair by influencing ATM recruitment and downstream H2AX phosphorylation. Mol Cell Biol 2009;29:6206-19.
on February 15, 2019. © 2013 American Association for Cancer Research. mct.aacrjournals.org Downloaded from
Author manuscripts have been peer reviewed and accepted for publication but have not yet been edited. Author Manuscript Published OnlineFirst on April 10, 2013; DOI: 10.1158/1535-7163.MCT-13-0005

1
FIGURE LEGENDS
Figure 1. SMARCB1 alteration in VAESBJ sarcoma cell line. A, Western blot analysis in a panel
of sarcoma cell lines showing lack of SMARCB1 protein expression in VAESBJ. B Hematoxylin-
eosin and C-E immunophenotype of VAESBJ mouse xenograft tumors, showing C, SMARCB1-
negative, D, CD34-positive and E, EMA-positive tumor cells.
Figure 2. A, SMARCB1 gene dosage analysis by MLPA identified intragenic deletions in
VAESBJ and G402 cell lines. B, Electropherogram obtained from direct sequencing of the PCR
product encompassing the genomic boundaries of SMARCB1 homozygous deletion in VAESBJ cell
line. C, Quantitative mRNA expression analysis of SMARCB1, showing highly reduced expression
in VAESBJ and G402 cell lines compared to SMARCB1 wild-type cell lines. D, Copy-number
analysis of VAESBJ pseudo-triploid cell line by MLPA identifies SMARCB1 and CDKN2A/B
homozygous deletion as the sole genetic abnormalities.
Figure 3. Effects of SMARCB1 restoration in VAESBJ sarcoma cell line. A. Western blot
analysis following restoration of SMARCB1 expression or control GFP gene by ectopic retroviral
infection. B. Cell proliferation assay. The ratio of live cells by trypan blue exclusion is significantly
decreased in SMARCB1 expressing cells compared to control (two-way Anova p< 0.001). C Cell
cycle analysis. The difference of percentage of cells in specific cell cycle phases between
SMARCB1 re-expressing and control cells is reported, indicating that SMARCB1 increases the
percentage of cells in G0/G1 phase of cell cycle while decreasing the percentage of cells in S and
G2/M. D. BrdU incorporation assay, showing significantly reduced DNA synthesis in SMARCB1
re-expressing VAESBJ cells (p=0.025). E. Clonogenic assay. Cristal violet relative absorbance
values is significantly decreased after SMARCB1 re-expression versus control (p< 0.001). F.
Reduced anchorage-independent growth is evident in SMARCB1 expressing cells compared to
control (p= 0.019). G. Migration capability is significantly reduced in SMARCB1 re-expressing cells
compared to control (p<0.001). H. Left, reduced VAESBJ in-vivo tumorigenesis in nude mice upon
SMARCB1 restoration (two-way Anova p< 0.0001). Right, corresponding reduction in weight of
explanted tumors (p= 0.036). All graphs display average ±SD of three independent experiments. *=
p< 0.05 by two-tailed unpaired t-test.
Figure 4. Gamma irradiation treatment in VAESBJ cell line after SMARCB1 restoration. Cell
proliferation reduction (two-way Anova p= 0.085, A) and increased cell death (two-way Anova p=
on February 15, 2019. © 2013 American Association for Cancer Research. mct.aacrjournals.org Downloaded from
Author manuscripts have been peer reviewed and accepted for publication but have not yet been edited. Author Manuscript Published OnlineFirst on April 10, 2013; DOI: 10.1158/1535-7163.MCT-13-0005

1
0.008, B) in SMARCB1 re-expressing cells as assessed by SRB assay and Trypan Blue count,
respectively, following 48h γ irradiation treatment. SMARCB1 restoration increased Caspase 3-7
and PARP activity in VAESBJ cell line treated with high dose of γ radiation, as assessed by
Caspase assay (C) and western blot (D). E, increased apoptosis is evident by AnnexinV/7AAD
staining and subsequent FACS analysis. Graphs display average ±SD of one representative out of
three independent experiments. *= p< 0.05 by two-tailed unpaired t-test.
Figure 5. A. Cell citotoxicity assay of Flavopiridol (left) and Fenretinide (right) treatment in
VAES BJ and G401 cell lines. The average ±SD of three independent experiments is plotted. B.
Western blot analysis of VAESBJ cells treated with increasing doses of Flavopiridol for 48 hours,
showing upregulation of TP53 and CDKN1A/p21 and downregulation of CCND1 proteins.
Concurrent reduction of cell proliferation and increased cell death is evident by trypan blue
exclusion cell counting (one-way Anova p< 0.001 and p= 0.008, respectively). C. Efficient CCND1
mRNA downmodulation by siRNA transfection as assayed by quantitative RT-PCR 24 h post-
trasfection. D. Efficient CCND1 protein silencing by siRNA transfection as assayed by western blot
at different time-points post-trasfection. E. The siRNA CCND1-induced cell proliferation reduction
is evident by trypan blue exclusion assay (two-way Anova p= 0.006). F. Increasing doses of
Flavopiridol differentially reduced cell proliferation in control and SMARCB1 re-expressing
VAESBJ cells. In B-F, graphs display average ±SD of one representative out of three independent
experiments. *= p< 0.05 by two-tailed unpaired t-test.
Figure 6. A, Phospho-protein array analysis of VAESBJ cell line, showing significant expression
of activated/phosphorylated ERBB1/EGFR and HGFR/MET but not other receptor kinases
investigated. B, Western blot analysis of protein expression in VAESBJ cell line, showing that both
activated EGFR and HGFR/MET impinge on AKT and ERK phosphorylation. C, Sulphorodamine-
B cell citotoxicity assay showing dose-response plots of EGFR inhibitor 324674, HGFR/MET
inhibitor PHA665752 and combined treatment with both inhibitors. D, Combination Index (CI) plot
showing synergism (CI<1) of EGFR inhibitor 324674 and HGFR/MET inhibitor PHA665752 at all
doses of combined treatments tested. E, Reduction of migration capability upon treatment with
HGFR/MET inhibitor PHA665752 (* p= 0.012 by two-tailed unpaired t-test). F, Evidence of EGFR
and HGFR/MET expression and activation in epithelioid sarcoma tumor samples by western blot
and immunohistochemistry.
on February 15, 2019. © 2013 American Association for Cancer Research. mct.aacrjournals.org Downloaded from
Author manuscripts have been peer reviewed and accepted for publication but have not yet been edited. Author Manuscript Published OnlineFirst on April 10, 2013; DOI: 10.1158/1535-7163.MCT-13-0005

CR
L77
26
G40
1
293
VA
ES
BJ
IMR
90
HO
S
Hs7
29.T
T17
4
TE
381.
T
MG
63
Hs9
13T
SK
-LM
S-1
ME
S-S
A
mar
ker
A
kDa
Fig 1
C G 2 V I H H T T M H S M m
α- SMARCB1
α- GAPDH
47
37
B C
D E
on February 15, 2019. © 2013 American Association for Cancer Research. mct.aacrjournals.org Downloaded from
Author manuscripts have been peer reviewed and accepted for publication but have not yet been edited. Author Manuscript Published OnlineFirst on April 10, 2013; DOI: 10.1158/1535-7163.MCT-13-0005

VAESBJ
A
Fig 2
G402
B 8435 bp deletion
SMARCB1 intron 1MMP11 intron 2
C
VA
ES
BJ
G40
2
ME
S-S
A
T17
4
293
MG
63
HO
S
1273
99
G10
SM
AR
CB
1 R
NA
exp
ress
ion
1.5
1
0.5
0
-0.5
VAESBJ gene dosage analysisD
LO
Gm
R -1
-1.5
-2
Cop
y n
um
ber
on February 15, 2019. © 2013 American Association for Cancer Research. mct.aacrjournals.org Downloaded from
Author manuscripts have been peer reviewed and accepted for publication but have not yet been edited. Author Manuscript Published OnlineFirst on April 10, 2013; DOI: 10.1158/1535-7163.MCT-13-0005
kDa
A
3
4
5
ive
cell
s
*
*
BFig 3
GFP
SMARCB1
γ tubulin
26
47
50 0
1
2
0 24h 48h 72h
Rat
ioof
li
Time post plating
VAES BJ Pbabe GFP
VAES BJ Pbabe INI
* pBabeControl
pBabeSMARCB1
C D
0
5
10
15
ein
cel
lcyc
lep
has
eB
1 minus
pB
abeC
ontr
ol)
% G0/G1
% S
+
+
+
50
40
30
20
Brd
U p
osit
ive
cell
s
*
-10
-5
0
24h 48h 72h 96h
% d
iffe
renc
(pB
abeS
MA
RC
B
Time post-plating
%G2/M
3E F1
G40
pBabeControl pBabeSMARCB1
10
0
% B
BrdU +
0
0.5
1
1.5
2
2.5
3
Nor
mal
ized
Ab
sorb
ance
Val
ue
*
0
0.5
1
Nor
mal
ized
Ab
sorb
ance
Vaa
lue
0
10
20
30
40
*
N°
of c
olon
ies
/ fie
ld *
0N
pBabeControl pBabeSMARCB1
0pBabeControl pBabeSMARCB1
0pBabeControl pBabeSMARCB1
700H
*
or w
eigh
t (m
g)
200
150
100
or v
olu
me
(mm
3 ) pBabeControl
pBabeSMARCB1
600
500
400
300
pBabe Control pBabe SMARCB1
Tu
mo
50
0
Tu
mo
Days post-injection
200
100
03 7 10 14 17 21 24
on February 15, 2019. © 2013 American Association for Cancer Research. mct.aacrjournals.org Downloaded from
Author manuscripts have been peer reviewed and accepted for publication but have not yet been edited. Author Manuscript Published OnlineFirst on April 10, 2013; DOI: 10.1158/1535-7163.MCT-13-0005
100
120
SR
B a
ssay
)A
4
5
ence
Caspase 3/7 AssayC
**** pBabeControl pBabeControl
Fig 4
0
20
40
60
80
Rel
ativ
e ab
sorb
ance
(S
0
1
2
3
NT 800 RAD 1200 RAD
Rel
ativ
e lu
min
esce
NT 100RAD 200RAD 400RAD 800RAD
pBabeSMARCB1 pBabeSMARCB1
8
12
16
20
f d
ead
cel
ls
B pBabecontrol
pBabeSMARCB1
PRO-CASP3
Cleaved CASP3
PARPCleaved PARP
0 0 rad
D
****
pBabeControl
pBabeSMARCB1
pBabeSMARCB1+800 RADpBabe Control+800 RAD
0
4
NT 100RAD 200RAD 400RAD 800RAD
% o
f
GAPDH
PRO-CASP7Cleaved CASP7
Eol
AnnexinV Facs Analysis
23.3%
29.7%
6.2%
5.4%
**
10
20
30
40
50
% I
ncr
ease
ofp
osit
ive
cell
sab
eSM
AR
CB
1 ov
erco
ntr
o
NT
800 RAD
1200 RAD
7-A
AD
0
%p
B
Annexin V Annexin V
on February 15, 2019. © 2013 American Association for Cancer Research. mct.aacrjournals.org Downloaded from
Author manuscripts have been peer reviewed and accepted for publication but have not yet been edited. Author Manuscript Published OnlineFirst on April 10, 2013; DOI: 10.1158/1535-7163.MCT-13-0005
70
80
90
100
110
120
70
80
90
100
110
120
Flavopiridol (nM) Fenretinide (μM)
e (S
RB
ass
ay)
e (S
RB
ass
ay)A
Fig 5
0
10
20
30
40
50
60
70
1 10 100 10000
10
20
30
40
50
60
70
0.1 1 10 100
VAESBJ
G401
Rel
ativ
e ab
sorb
ance
Rel
ativ
e ab
sorb
ance
% d
ead cellsV
iab
le c
ells
(x1
05 )25
20
15
10
5
25
20
15
10
5 0
0.5
1
1.5
SiRNA OT SiRNARel
ativ
e Q
uan
tity
Real Time PCRTP53
CCND1
CDKN1A/p21
Flavopiridol nM0 30 100 300
B C
200000
250000
300000
350000
400000
cell
s(x
103 )
0NT Flavo 30nM Flavo 100nM Flavo 300nM
0SiRNA OT SiRNA
CCND1
R
siRNA OT + - + - + - + -siRNA CCND1 - + - + - + - +
24 h 48 h 96 h72 h
GAPDH
D
siRNA OT siRNA CCND1
iRNA OT
*
*
E400
350
300
250
120
0
50000
100000
150000
200000
0 24h 48h 72h
N°o
fli
ve c
CCND1
γ tubulin
F
Time post-trasfection
siRNA OT
siRNA CCND1*
200
150
100
50
0 24h 48h 72h 96h
40
60
80
100
e ab
sorb
ance
(SR
B a
ssay
)
pBabeControl
pBabeSMARCB1
*
*
0
20
Rel
ativ
NT Flavo 30nM Flav 100 nM Flav 300 nM
on February 15, 2019. © 2013 American Association for Cancer Research. mct.aacrjournals.org Downloaded from
Author manuscripts have been peer reviewed and accepted for publication but have not yet been edited. Author Manuscript Published OnlineFirst on April 10, 2013; DOI: 10.1158/1535-7163.MCT-13-0005

A p-ERBB1/EGFR
Fig 6
80
90
100
PHA
0 0.04 0.15 0.3 0.6 1.25 2.5 5 HGFR inh. (uM)
assa
y)
HGFRi
C
p-HGFR/MET
B20
30
40
50
60
70
EGFRi
PHA+EGFRi
Rel
ativ
e ab
sorb
ance
(S
RB
a
EGFRi
Combined HGFRi / EGFRi
Serum
EGFPHA665752
(HGFR/Met inh.)324674
(EGFR inh.)
B
p-EGFR
EGFR
− +− − − + − + +− +− − − − + ++
+ ++ − +− − − −
− − − −− − − −+
Drug GI50 (μM) m r
D2
)
0
10
0 0.08 0.3 0.6 1.25 2.5 5 EGFR inh. (uM)10
R
p-ERK1/2
p-HGFR
HGFR
p-AKT
AKT
EGFR inh. Calbiochem 324674 0.30373 0.24649 0.9840HGFR/Met inh. PHA665752 8.93801 0.17865 0.9971EGFR+Met inh. Combined 0.04450 0.24279 0.9746
1.5
1
0.5
omb
inat
ion
In
dex
(C
I)
p ERK1/2
ERK1/2
Vinculin
0
0.2 0.3 0.4 0.5 0.6 0.7 0.8
Co
Fraction affected (Fa)
E1
*
ized
ance
F
ES
1
ES
2
ES
3
ES
4
ES
5
ES
6
ES
7
ES
8
0
0.5
-PHA +PHA
Nor
mal
iA
bso
rba
p EGFR
EGFR
p HGFR
p FAK (Tyr 397)
p -HGFR
HGFR
- + PHA
€
Tubulin γ
HGFR
p FAK (Tyr 397)
p FAK (Tyr 576-577)
FAK
Tubulin γ
p FAK (Tyr 925)
EGFR HGFR
on February 15, 2019. © 2013 American Association for Cancer Research. mct.aacrjournals.org Downloaded from
Author manuscripts have been peer reviewed and accepted for publication but have not yet been edited. Author Manuscript Published OnlineFirst on April 10, 2013; DOI: 10.1158/1535-7163.MCT-13-0005

Published OnlineFirst April 10, 2013.Mol Cancer Ther Monica Brenca, Sabrina Rossi, Erica Lorenzetto, et al. tumorigenic properties of epithelioid sarcoma cell line VAESBJ.SMARCB1/INI1 genetic inactivation is responsible for
Updated version
10.1158/1535-7163.MCT-13-0005doi:
Access the most recent version of this article at:
Material
Supplementary
http://mct.aacrjournals.org/content/suppl/2013/04/09/1535-7163.MCT-13-0005.DC1
Access the most recent supplemental material at:
Manuscript
Authoredited. Author manuscripts have been peer reviewed and accepted for publication but have not yet been
E-mail alerts related to this article or journal.Sign up to receive free email-alerts
Subscriptions
Reprints and
To order reprints of this article or to subscribe to the journal, contact the AACR Publications
Permissions
Rightslink site. Click on "Request Permissions" which will take you to the Copyright Clearance Center's (CCC)
.http://mct.aacrjournals.org/content/early/2013/04/06/1535-7163.MCT-13-0005To request permission to re-use all or part of this article, use this link
on February 15, 2019. © 2013 American Association for Cancer Research. mct.aacrjournals.org Downloaded from
Author manuscripts have been peer reviewed and accepted for publication but have not yet been edited. Author Manuscript Published OnlineFirst on April 10, 2013; DOI: 10.1158/1535-7163.MCT-13-0005