small scale desalination pilots powered by renewable energy sources: case studies
TRANSCRIPT
Small scale desalination pilots powered by renewable energysources: case studies
S. Bouguechaa, B. Hamrounib, M. Dhahbia*aLETM/INRST, BP 95 Hammam-Lif 2050 Tunisia
bLETM/FST, BP 1020 Le belvedere, Tunis, Tunisia emails: [email protected],[email protected], [email protected]
Received 21 February 2005; accepted 21 March 2005
Abstract
In Tunisia, water resources are very limited and have high salinities. Domestic water in rural communities
has TDS reaching 2750 ppm. Inhabitants of these areas are scattered and lack proper infrastructure for the
implementation of conventional desalination plants. However, these regions have an important potential of
renewable energy (RE), especially solar energy where sunshine in southern regions can reach 2500 h per year.
RE can be harnessed to power small-scale desalination plants in order to produce the fresh water necessary to
cover the basic requirements (drinking and cooking). This paper aims to identify the potential of renewable
energies, mainly solar and geothermal. It illustrates the quality of distributed water in rural communities. It
presents several studies that were carried out, including solar multiple effects distillation, reverse osmosis driven
by photovoltaic panels, and lately membrane distillation using a geothermal resource. The experimental results
show technical promise. However, more investigations will need to optimise the operating parameters and
improve economic feasibility.
Keywords: Desalination; Water resources; Renewable energy; Reverse osmosis; Solar still; Membrane distilla-
tion; Tunisia
1. Introduction
Tunisia is located on the southern rim ofthe Mediterranean basin. Like its neighbourcountries, it is confronted by a problem of
fresh water shortage. In fact, it has very lim-ited water resources, aggravated by a largespatial and temporal disparity between south-ern and northern parts, and fluctuations fromyear to year. In the central and Cap Bonareas, large extractions led to a sharp declinein water levels, causing seawater intrusion.
Presented at the Conference on Desalination and the Environment, Santa Margherita, Italy, 22–26 May 2005.
European Desalination Society.
0011-9164/05/$– See front matter � 2005 Elsevier B.V. All rights reserved
*Corresponding author.
Desalination 183 (2005) 151–165
doi:10.1016/j.desal.2005.03.032
Tunisia has mobilized a large proportion ofits water resources (surface and undergroundwaters) using dams, transport aqueducts,small lakes, deep wells and desalinationplants. For big cities and large-scale agglo-meration, the problem of fresh water is currentlyresolved. However, seawater desalination couldsupply future water deficiencies.
In remote rural communities, the problemof potable water remains unsolved. There areabout 1.5 106 inhabitants and the distributedwater volume reaches 19 106 m3 per year, withan average specific consumption estimated at45 l per capita per day, which is considerablylower than the national average (130 l perinhabitant per day). In addition, 8 � 106 m3
of the distributed water has a high salinity,making it unfit for human consumption.
Analysis of the RE map shows the importantpotential siteswhere solar energy and geothermalenergies can provide a solution to cover theenergy needed for desalination. Thus, desalina-tion powered by renewable energy presents asolution to the problem of fresh water shortagein rural dispersed communities, improving inha-bitants’ living conditions and having a positiveimpact on the environment.
The first test imitating the natural cycle ofevaporation-condensation was attempted byN.Chezi in 1742. In 1872, CharlesWilson, a Swed-ish engineer built the first solar distillation stillin Las Salinas, Chile. For more than a century,numerous investigations have been carried outto improve the overall performance of solarstills. The performance of solar stills remainslower than expected. These performancesdepend mainly on design and technical imper-fections [1–5]. Therefore, fresh water produc-tion by solar stills did not exceed 4 kg/m2d.With the aim of overcoming these disadvan-tages, various authors [6–8] have proposed awick multiple effect solar still; Cooper andApple yard suggested a multiple solar distilla-tion still, where the latent heat of steam would
be used to evaporate another quantity of saltwater. Nevertheless, the thickness of textureand the formation of an air gap between theplate and texture substantially limited the per-formance. The Le Goff team [9–11] has devel-oped the DIFICAP distillatory. This device,using a thin texture resolves the problems dueto the thickness of the texture. In addition, thecontact between the plate and the texture isensured by interfacial tension, which is muchgreater than gravitational force
Rodriguez [12] presented a systematicapproach to desalination powered by RE inorder to consider all the alternatives. Amongall the combinations investigated, they con-cluded that RO powered with PV is interest-ing in very specific cases, such remote sunnysites. Hanafi [13] investigated the associationof wind, tidal, geothermal and solar energywith different desalination techniques. Hepresented some guiding limits (monograms)for usage of energy sources and recom-mended wind energy over PV used with RO.Many RO desalination plants powered withPV were manufactured and placed in opera-tion in several places worldwide during thelast three decades. Numerous attempts andexperiments were carried out in attempt tofind suitable coupling procedures betweenRO desalination process and PV or windmillslike RE resources. Keefer [14], with supportfrom the Canadian Government, built twosmall systems in Vancouver, British Colom-bia, that were designed to demonstrate theuse and optimise solar energy input (panelshave a peak rating of 480 W), with batterystorage to produce from 0.5 to 1.0 m3/d.They also involved comparison of differentoperating modes for PV/RO system. In parti-cular, they considered the differences betweendirect connection of the PV/RO system, max-imum power tracking, and included batterystorage. By employing a variable speed, posi-tive displacement pump with energy recovery
152 S. Bouguecha et al. / Desalination 183(2005) 151–165
from the reject brine, they claimed to be ableto reduce life cycle costs by 50% relative toconventional PV/RO systems. A small PVdriven RO pilot was tested in Gran CanariaIsland [15]. The pilot plant, having an averageproduction capacity of 3.2 m3/d of freshwater, is coupled to stand-alone PV systemand storage batteries. The nominal powerconsumption is 2.35 kW.
A. Hanafi [13] concludes that geothermalgroundwater resources, at low enthalpy, arenot expected to play a role in conventionaldesalination technologies (MSF or MED).However, thermal membrane distillation (MD)using a sensible heat, is driven by a solar heatedsource such as plane captors. Hogan [16] stu-died the feasibility of a solar powered desalina-tion plant for domestic drinking water in aridrural regions of Australia. For the domesticsized plant of 50 kg/d the optimum configura-tion appears to be a solar collector area ofaround 3 m2, a membrane area of 1.8 m2 anda total heat exchange are of 0.7 m2. This con-figuration is cost-competitive with RO. Theintegration of different membrane operationsis becoming quite attractive as a way forincreasing the performance of the processes.Andres et al. [17] have coupled a MD moduleto a multiple effect distiller for pure water pro-duction. That study found that the best operat-ing parameters are 85�C for a feed brinetemperature at the evaporator inlet and a cir-culation flow of about 170 kg/h. Under theseconditions, a GOR value of 3.7 and a waterproduction of 16 kg/h may be reached. Theintegration of one membrane module distilleras a second step at the MED outlet permits anincrease of distilled water production by about7.5% and improvement of the energetic effi-ciency by practically 10%. Energetic analysisshows that MD can be driven by a lowenthalpy sources as geothermal groundwater.
In this paper, we present laboratory scaleapparatus for a multiple effect solar still
(MESS), RO powered PV panels (RO-PV), andmembrane distillation using sensible heat ofgeothermal water (MD-GW), and we discussobtained technical and economical results.
2. Quality of distributed water in rural areas
In rural areas there is no drinking waternetwork. The farming population is suppliedthrough public fountains and animal ormechanically drawn travelling cisterns.Water is no treated and cisterns are oftennon-hygienic (corrosion, development of bac-teria). In addition, brackish water can causeirritation of digestive tracts and skin diseases,especially for young children.
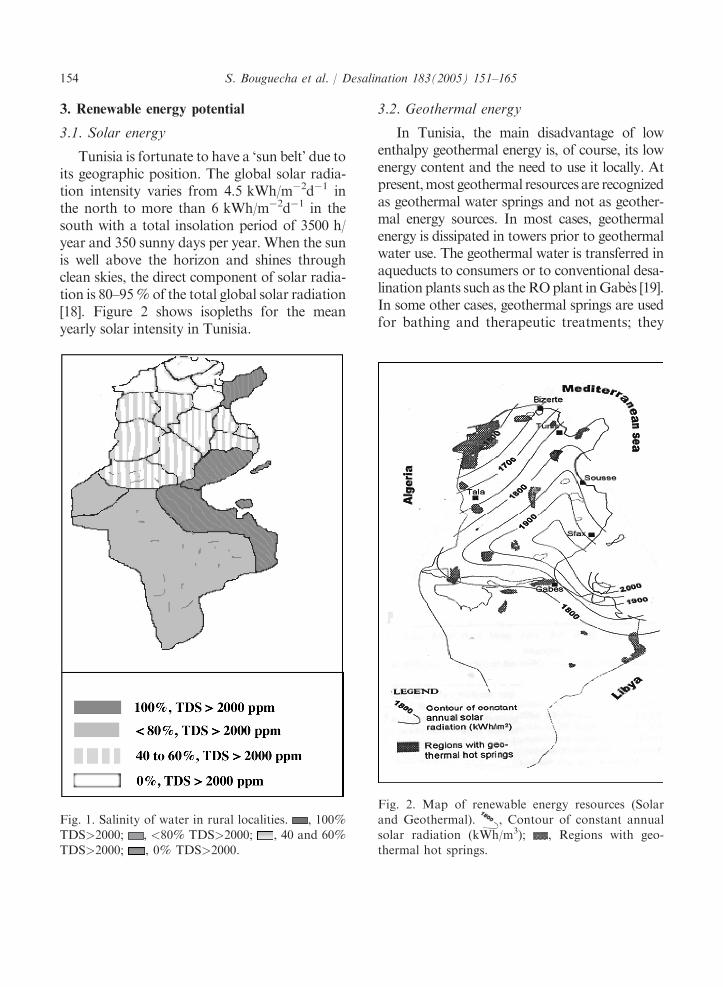
Figure 1 shows the distribution of watersalinity in rural regions. The country dividedinto four regions:� Areas of very high salinities: in the south
eastern regions, the salinities of distributedwater are often above 2500 ppm and thepercentage of water falling within thiscategory is nearly 100%.
� Areas of high salinities: in the extremesouth, and south western, and the Cap-Bon regions, the salinities of distributedwater are between 2000 and 2250 ppm.The percentage of water having salinityabout 2000 ppm is higher in the southwestthan in the extreme southern parts. Theirrespective percentages are 100% and 80%.
� Areas of moderate salinities: in the centralparts of the country, the quality of waterdistributed is acceptable overall. Neverthe-less, the percentage of high salinity in thedistributed water (over 2000 ppm) reached40–60%. Then localities were suppliedwith a bad water quality.
� Areas of low salinities: only north-westernregions benefit from very high waterquality and percentage of water withsalinity exceeding 2000 ppm, is practicallyzero.
S. Bouguecha et al. / Desalination 183(2005) 151–165 153
3. Renewable energy potential
3.1. Solar energy
Tunisia is fortunate to have a ‘sun belt’ due toits geographic position. The global solar radia-tion intensity varies from 4.5 kWh/m�2d�1 inthe north to more than 6 kWh/m�2d�1 in thesouth with a total insolation period of 3500 h/year and 350 sunny days per year. When the sunis well above the horizon and shines throughclean skies, the direct component of solar radia-tion is 80–95% of the total global solar radiation[18]. Figure 2 shows isopleths for the meanyearly solar intensity in Tunisia.
3.2. Geothermal energy
In Tunisia, the main disadvantage of lowenthalpy geothermal energy is, of course, its lowenergy content and the need to use it locally. Atpresent,most geothermal resources are recognizedas geothermal water springs and not as geother-mal energy sources. In most cases, geothermalenergy is dissipated in towers prior to geothermalwater use. The geothermal water is transferred inaqueducts to consumers or to conventional desa-lination plants such as theROplant inGabes [19].In some other cases, geothermal springs are usedfor bathing and therapeutic treatments; they
Fig. 1. Salinity of water in rural localities. , 100%TDS>2000; , <80% TDS>2000; , 40 and 60%TDS>2000; , 0% TDS>2000.
Fig. 2. Map of renewable energy resources (Solar
and Geothermal). , Contour of constant annual
solar radiation (kWh/m3); , Regions with geo-
thermal hot springs.
154 S. Bouguecha et al. / Desalination 183(2005) 151–165
are also used for heating greenhouses. Figure2 shows 5 major geothermal districts [20].These resources can be also found insouthern regions where a lack of fresh wateris acute.
4. Experimental set-ups
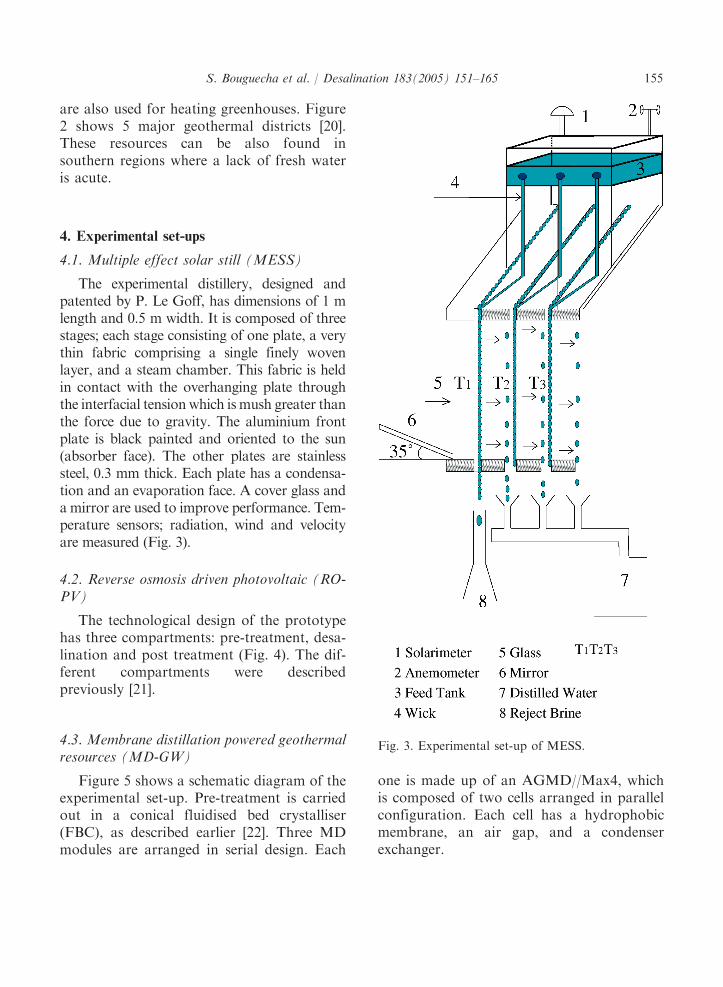
4.1. Multiple effect solar still (MESS)
The experimental distillery, designed andpatented by P. Le Goff, has dimensions of 1 mlength and 0.5 m width. It is composed of threestages; each stage consisting of one plate, a verythin fabric comprising a single finely wovenlayer, and a steam chamber. This fabric is heldin contact with the overhanging plate throughthe interfacial tensionwhich ismush greater thanthe force due to gravity. The aluminium frontplate is black painted and oriented to the sun(absorber face). The other plates are stainlesssteel, 0.3 mm thick. Each plate has a condensa-tion and an evaporation face. A cover glass anda mirror are used to improve performance. Tem-perature sensors; radiation, wind and velocityare measured (Fig. 3).
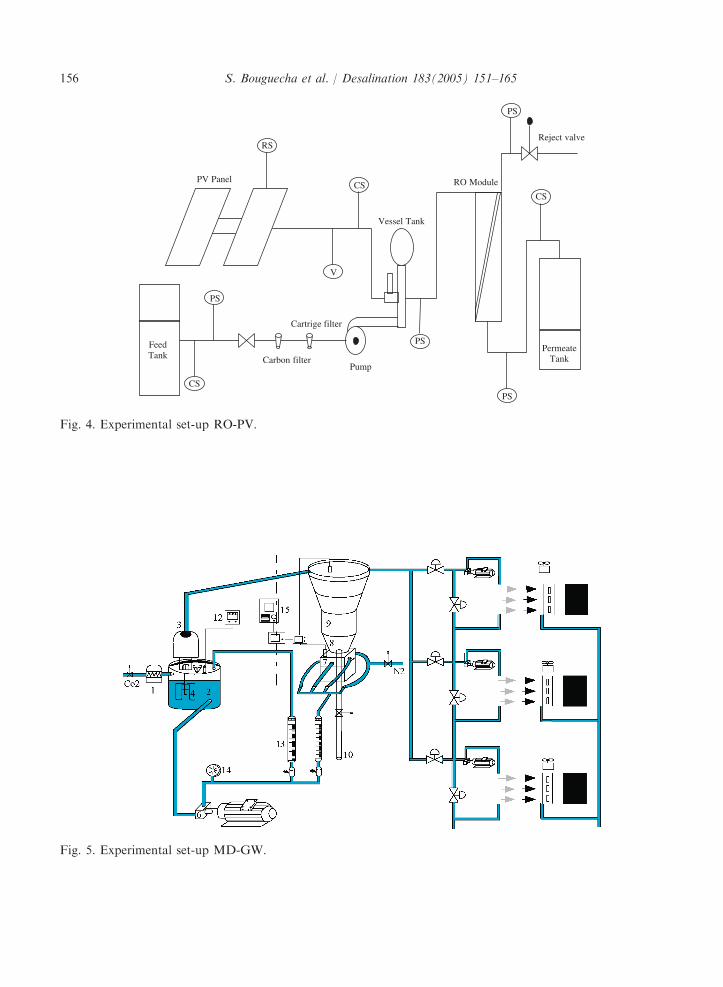
4.2. Reverse osmosis driven photovoltaic (RO-PV)
The technological design of the prototypehas three compartments: pre-treatment, desa-lination and post treatment (Fig. 4). The dif-ferent compartments were describedpreviously [21].
4.3. Membrane distillation powered geothermalresources (MD-GW)
Figure 5 shows a schematic diagram of theexperimental set-up. Pre-treatment is carriedout in a conical fluidised bed crystalliser(FBC), as described earlier [22]. Three MDmodules are arranged in serial design. Each
one is made up of an AGMD//Max4, whichis composed of two cells arranged in parallelconfiguration. Each cell has a hydrophobicmembrane, an air gap, and a condenserexchanger.
Fig. 3. Experimental set-up of MESS.
S. Bouguecha et al. / Desalination 183(2005) 151–165 155
Permeate Tank
Pump
Reject valve
PV Panel RO Module
RS
PS
PS
PS
PS
CS
CS
V
CS
Feed Tank Carbon filter
Cartrige filter
Vessel Tank
Fig. 4. Experimental set-up RO-PV.
Fig. 5. Experimental set-up MD-GW.
156 S. Bouguecha et al. / Desalination 183(2005) 151–165
5. Results and discussion
5.1. Multiple effect solar still
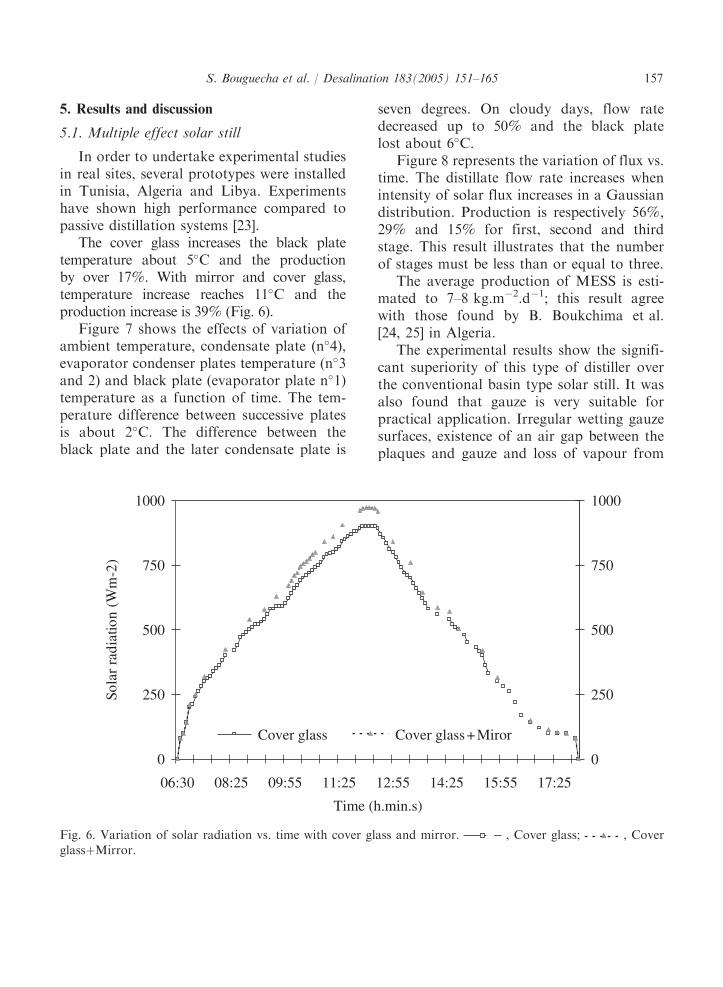
In order to undertake experimental studiesin real sites, several prototypes were installedin Tunisia, Algeria and Libya. Experimentshave shown high performance compared topassive distillation systems [23].
The cover glass increases the black platetemperature about 5�C and the productionby over 17%. With mirror and cover glass,temperature increase reaches 11�C and theproduction increase is 39% (Fig. 6).
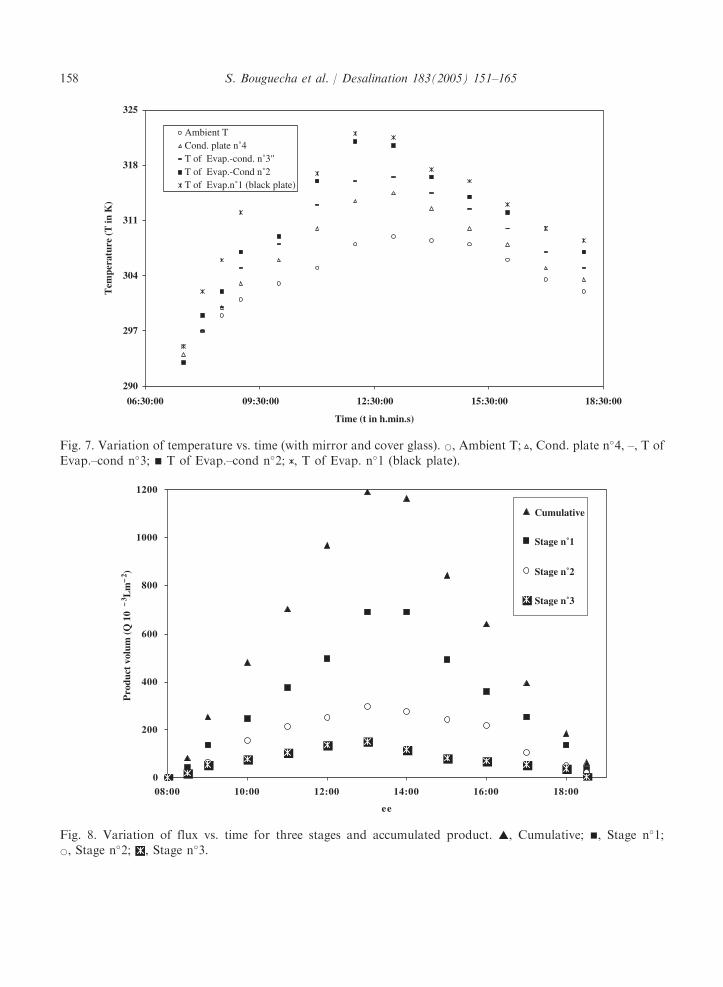
Figure 7 shows the effects of variation ofambient temperature, condensate plate (n�4),evaporator condenser plates temperature (n�3and 2) and black plate (evaporator plate n�1)temperature as a function of time. The tem-perature difference between successive platesis about 2�C. The difference between theblack plate and the later condensate plate is
seven degrees. On cloudy days, flow ratedecreased up to 50% and the black platelost about 6�C.
Figure 8 represents the variation of flux vs.time. The distillate flow rate increases whenintensity of solar flux increases in a Gaussiandistribution. Production is respectively 56%,29% and 15% for first, second and thirdstage. This result illustrates that the numberof stages must be less than or equal to three.
The average production of MESS is esti-mated to 7–8 kg.m�2.d�1; this result agreewith those found by B. Boukchima et al.[24, 25] in Algeria.
The experimental results show the signifi-cant superiority of this type of distiller overthe conventional basin type solar still. It wasalso found that gauze is very suitable forpractical application. Irregular wetting gauzesurfaces, existence of an air gap between theplaques and gauze and loss of vapour from
0
250
500
750
1000
06:30 08:25 09:55 11:25 12:55 14:25 15:55 17:25
Time (h.min.s)
Sola
r ra
diat
ion
(Wm
-2)
0
250
500
750
1000
Cover glass Cover glass + Miror
Fig. 6. Variation of solar radiation vs. time with cover glass and mirror. , Cover glass; , Cover
glassþMirror.
S. Bouguecha et al. / Desalination 183(2005) 151–165 157
0
200
400
600
800
1000
1200
08:00 10:00 12:00 14:00 16:00 18:00
ee
Pro
duct
vol
um (
Q 1
0 –
3 Lm
– 2 )
Cumulative
Stage n˚1
Stage n˚2
Stage n˚3
Fig. 8. Variation of flux vs. time for three stages and accumulated product. ~, Cumulative; &, Stage n�1;*, Stage n�2; , Stage n�3.
290
297
304
311
318
325
06:30:00 09:30:00 12:30:00 15:30:00 18:30:00
Time (t in h.min.s)
Tem
pera
ture
(T in
K)
Ambient TCond. plate n˚4T of Evap.-cond. n˚3"T of Evap.-Cond n˚2T of Evap.n˚1 (black plate)
Fig. 7. Variation of temperature vs. time (with mirror and cover glass). *, Ambient T; , Cond. plate n�4, –, T of
Evap.–cond n�3; & T of Evap.–cond n�2; , T of Evap. n�1 (black plate).
158 S. Bouguecha et al. / Desalination 183(2005) 151–165
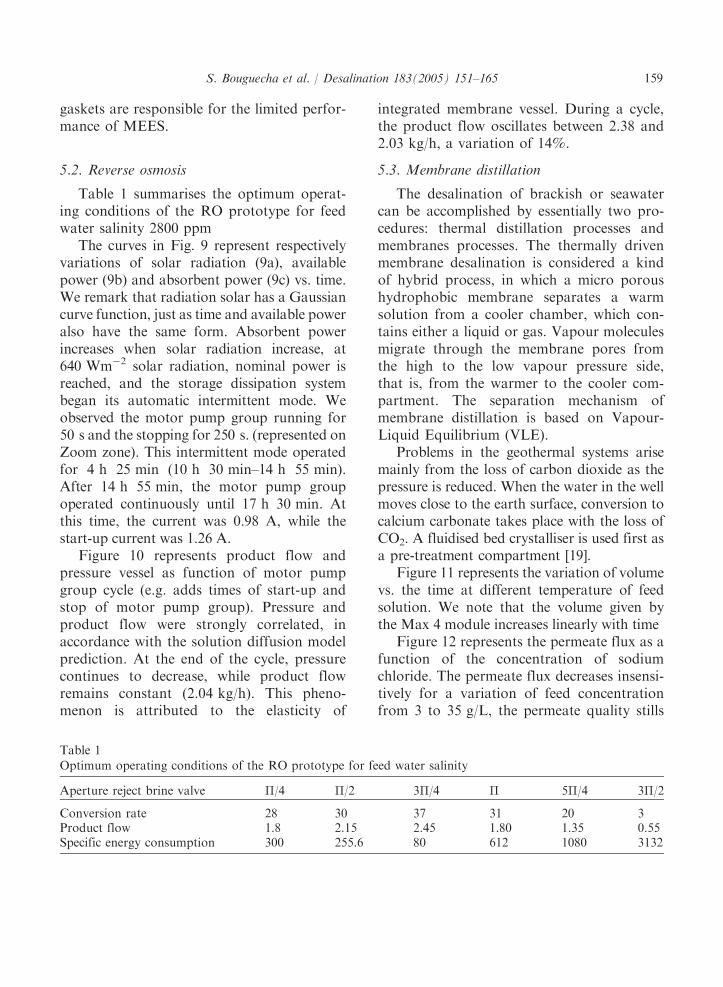
gaskets are responsible for the limited perfor-mance of MEES.
5.2. Reverse osmosis
Table 1 summarises the optimum operat-ing conditions of the RO prototype for feedwater salinity 2800 ppm
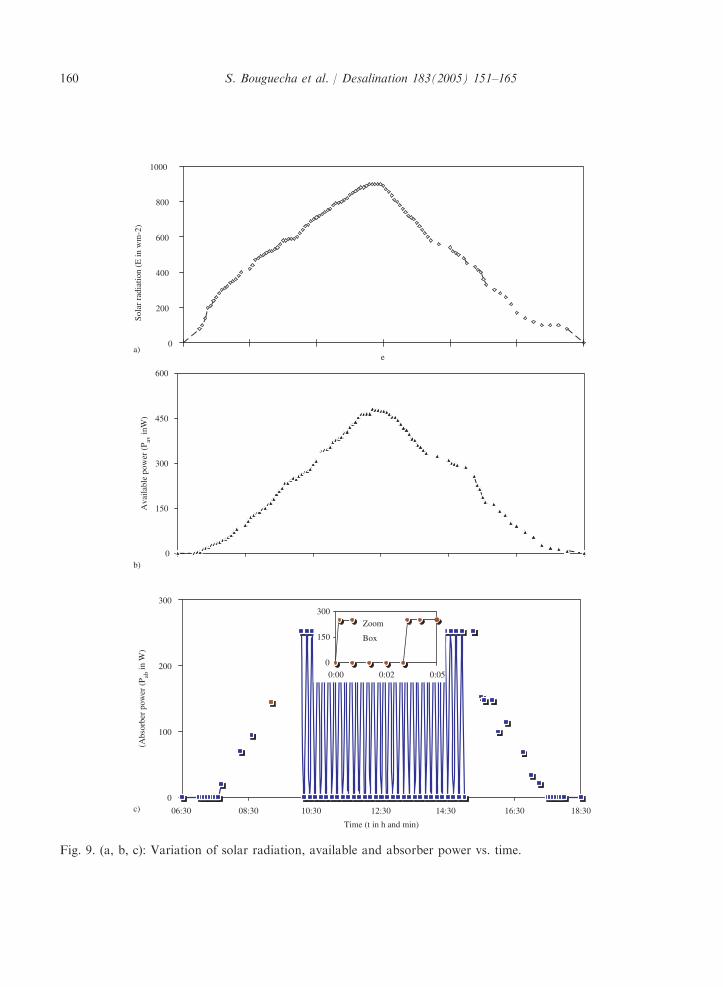
The curves in Fig. 9 represent respectivelyvariations of solar radiation (9a), availablepower (9b) and absorbent power (9c) vs. time.We remark that radiation solar has a Gaussiancurve function, just as time and available poweralso have the same form. Absorbent powerincreases when solar radiation increase, at640 Wm�2 solar radiation, nominal power isreached, and the storage dissipation systembegan its automatic intermittent mode. Weobserved the motor pump group running for50 s and the stopping for 250 s. (represented onZoom zone). This intermittent mode operatedfor 4 h 25 min (10 h 30 min–14 h 55 min).After 14 h 55 min, the motor pump groupoperated continuously until 17 h 30 min. Atthis time, the current was 0.98 A, while thestart-up current was 1.26 A.
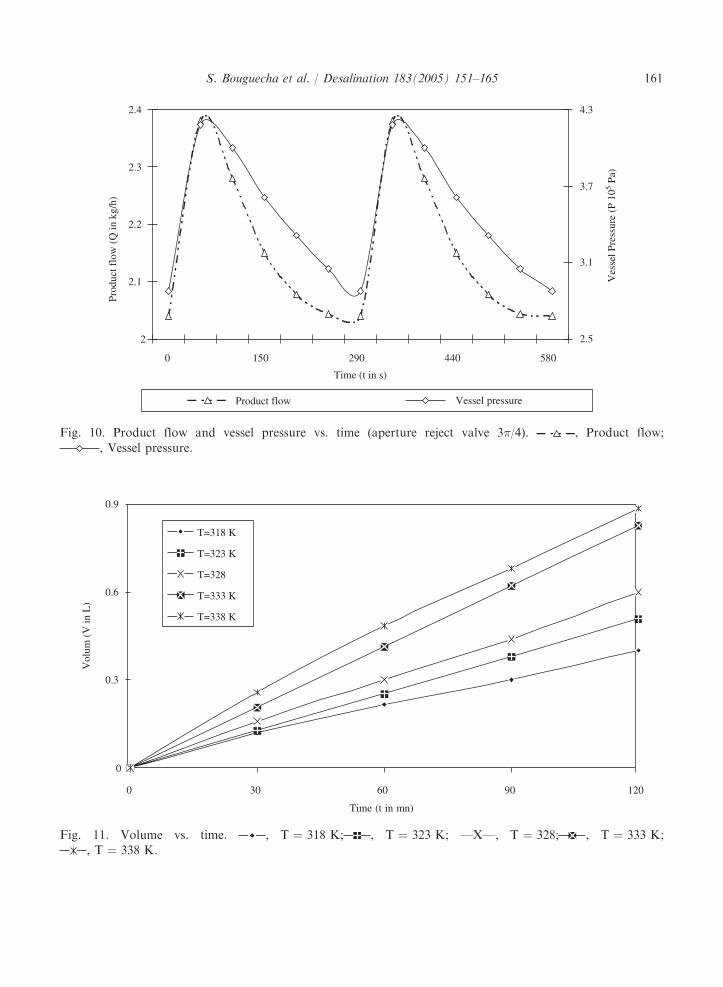
Figure 10 represents product flow andpressure vessel as function of motor pumpgroup cycle (e.g. adds times of start-up andstop of motor pump group). Pressure andproduct flow were strongly correlated, inaccordance with the solution diffusion modelprediction. At the end of the cycle, pressurecontinues to decrease, while product flowremains constant (2.04 kg/h). This pheno-menon is attributed to the elasticity of
integrated membrane vessel. During a cycle,the product flow oscillates between 2.38 and2.03 kg/h, a variation of 14%.
5.3. Membrane distillation
The desalination of brackish or seawatercan be accomplished by essentially two pro-cedures: thermal distillation processes andmembranes processes. The thermally drivenmembrane desalination is considered a kindof hybrid process, in which a micro poroushydrophobic membrane separates a warmsolution from a cooler chamber, which con-tains either a liquid or gas. Vapour moleculesmigrate through the membrane pores fromthe high to the low vapour pressure side,that is, from the warmer to the cooler com-partment. The separation mechanism ofmembrane distillation is based on Vapour-Liquid Equilibrium (VLE).
Problems in the geothermal systems arisemainly from the loss of carbon dioxide as thepressure is reduced. When the water in the wellmoves close to the earth surface, conversion tocalcium carbonate takes place with the loss ofCO2. A fluidised bed crystalliser is used first asa pre-treatment compartment [19].
Figure 11 represents the variation of volumevs. the time at different temperature of feedsolution. We note that the volume given bythe Max 4 module increases linearly with time
Figure 12 represents the permeate flux as afunction of the concentration of sodiumchloride. The permeate flux decreases insensi-tively for a variation of feed concentrationfrom 3 to 35 g/L, the permeate quality stills
Table 1
Optimum operating conditions of the RO prototype for feed water salinity
Aperture reject brine valve �/4 �/2 3�/4 � 5�/4 3�/2
Conversion rate 28 30 37 31 20 3Product flow 1.8 2.15 2.45 1.80 1.35 0.55Specific energy consumption 300 255.6 80 612 1080 3132
S. Bouguecha et al. / Desalination 183(2005) 151–165 159
0
200
400
600
800
1000
a)
b)
c)
e
Sola
r ra
diat
ion
(E in
wm
-2)
0
150
300
450
600
Ava
ilabl
e po
wer
(P av
inW
)
0
100
200
300
06:30 08:30 10:30 12:30 14:30 16:30 18:30
Time (t in h and min)
(Abs
orbe
r po
wer
(P ab
in W
)
0
150
300
0:00 0:02 0:05
Zoom
Box
Fig. 9. (a, b, c): Variation of solar radiation, available and absorber power vs. time.
160 S. Bouguecha et al. / Desalination 183(2005) 151–165
2
2.1
2.2
2.3
2.4
0 150 290 440 580
Prod
uct f
low
(Q
in k
g/h)
2.5
3.1
3.7
4.3
Time (t in s)
Ves
sel P
ress
ure
(P 1
05 Pa)
Product flow Vessel pressure
Fig. 10. Product flow and vessel pressure vs. time (aperture reject valve 3�/4). , Product flow;
, Vessel pressure.
0
0.3
0.6
0.9
0 30 60 90 120
Time (t in mn)
Vol
um (
V in
L)
T=318 K
T=323 K
T=328
T=333 K
T=338 K
Fig. 11. Volume vs. time. , T = 318 K; , T = 323 K; —X—, T = 328; , T = 333 K;, T = 338 K.
S. Bouguecha et al. / Desalination 183(2005) 151–165 161
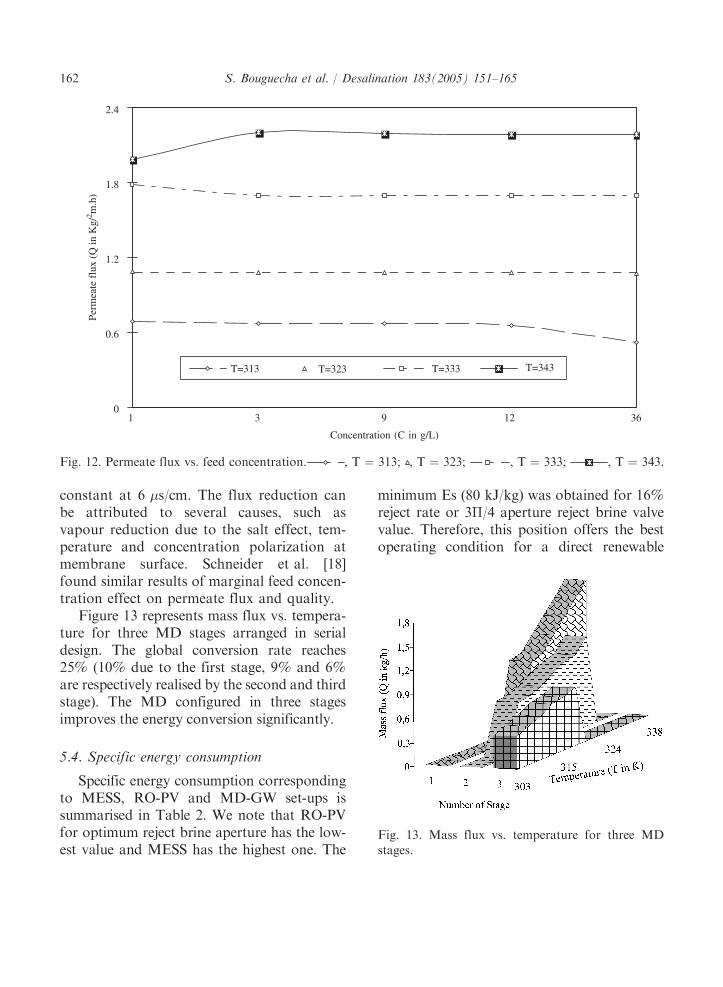
constant at 6 �s/cm. The flux reduction canbe attributed to several causes, such asvapour reduction due to the salt effect, tem-perature and concentration polarization atmembrane surface. Schneider et al. [18]found similar results of marginal feed concen-tration effect on permeate flux and quality.
Figure 13 represents mass flux vs. tempera-ture for three MD stages arranged in serialdesign. The global conversion rate reaches25% (10% due to the first stage, 9% and 6%are respectively realised by the second and thirdstage). The MD configured in three stagesimproves the energy conversion significantly.
5.4. Specific energy consumption
Specific energy consumption correspondingto MESS, RO-PV and MD-GW set-ups issummarised in Table 2. We note that RO-PVfor optimum reject brine aperture has the low-est value and MESS has the highest one. The
minimum Es (80 kJ/kg) was obtained for 16%reject rate or 3�/4 aperture reject brine valvevalue. Therefore, this position offers the bestoperating condition for a direct renewable
0
0.6
1.2
1.8
2.4
1 3 9 12 36
Concentration (C in g/L)
Perm
eate
flu
x (Q
in K
g/2 m
.h)
T=313 T=323 T=333 T=343
Fig. 12. Permeate flux vs. feed concentration. , T = 313; , T = 323; , T = 333; , T = 343.
Fig. 13. Mass flux vs. temperature for three MD
stages.
162 S. Bouguecha et al. / Desalination 183(2005) 151–165
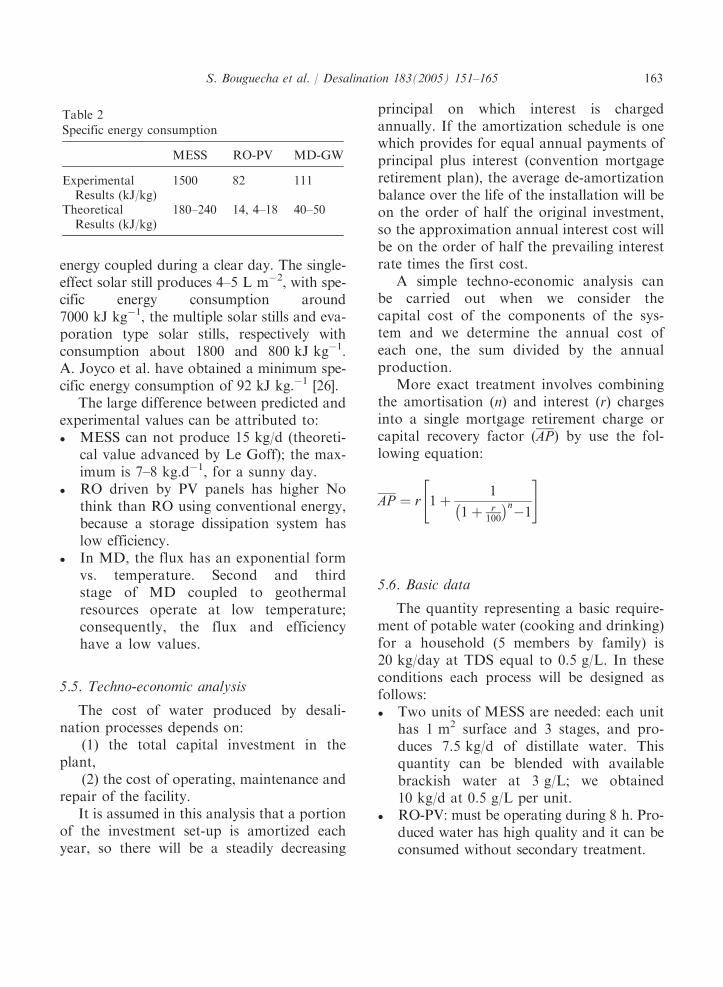
energy coupled during a clear day. The single-effect solar still produces 4–5 L m�2, with spe-cific energy consumption around7000 kJ kg�1, the multiple solar stills and eva-poration type solar stills, respectively withconsumption about 1800 and 800 kJ kg�1.A. Joyco et al. have obtained a minimum spe-cific energy consumption of 92 kJ kg.�1 [26].
The large difference between predicted andexperimental values can be attributed to:� MESS can not produce 15 kg/d (theoreti-
cal value advanced by Le Goff); the max-imum is 7–8 kg.d�1, for a sunny day.
� RO driven by PV panels has higher Nothink than RO using conventional energy,because a storage dissipation system haslow efficiency.
� In MD, the flux has an exponential formvs. temperature. Second and thirdstage of MD coupled to geothermalresources operate at low temperature;consequently, the flux and efficiencyhave a low values.
5.5. Techno-economic analysis
The cost of water produced by desali-nation processes depends on:
(1) the total capital investment in theplant,
(2) the cost of operating, maintenance andrepair of the facility.
It is assumed in this analysis that a portionof the investment set-up is amortized eachyear, so there will be a steadily decreasing
principal on which interest is chargedannually. If the amortization schedule is onewhich provides for equal annual payments ofprincipal plus interest (convention mortgageretirement plan), the average de-amortizationbalance over the life of the installation will beon the order of half the original investment,so the approximation annual interest cost willbe on the order of half the prevailing interestrate times the first cost.
A simple techno-economic analysis canbe carried out when we consider thecapital cost of the components of the sys-tem and we determine the annual cost ofeach one, the sum divided by the annualproduction.
More exact treatment involves combiningthe amortisation (n) and interest (r) chargesinto a single mortgage retirement charge orcapital recovery factor (AP) by use the fol-lowing equation:
AP ¼ r 1þ 1
1þ r100
� �n�1
" #
5.6. Basic data
The quantity representing a basic require-ment of potable water (cooking and drinking)for a household (5 members by family) is20 kg/day at TDS equal to 0.5 g/L. In theseconditions each process will be designed asfollows:� Two units of MESS are needed: each unit
has 1 m2 surface and 3 stages, and pro-duces 7.5 kg/d of distillate water. Thisquantity can be blended with availablebrackish water at 3 g/L; we obtained10 kg/d at 0.5 g/L per unit.
� RO-PV: must be operating during 8 h. Pro-duced water has high quality and it can beconsumed without secondary treatment.
Table 2
Specific energy consumption
MESS RO-PV MD-GW
ExperimentalResults (kJ/kg)
1500 82 111
TheoreticalResults (kJ/kg)
180–240 14, 4–18 40–50
S. Bouguecha et al. / Desalination 183(2005) 151–165 163
� MD-GW must be operating during 10 h, nomodification of the experimental set-up usedis necessary. The prototype produces 17 kg/ddistillate water; an additional volume ofbrackish water at 3 g/L is evaluated to3.6 kg/d, so we obtained 20.6 kg/d at 0.5 g/L.
� The cost of water produced by these var-ious processes have not been reported assuch, but it is estimated that an annualfixed cost of about 17.3% would coverdepreciation, interest, and insurance.
� The load factor is estimated at 330 days/year.� Operating and maintenance cost is esti-
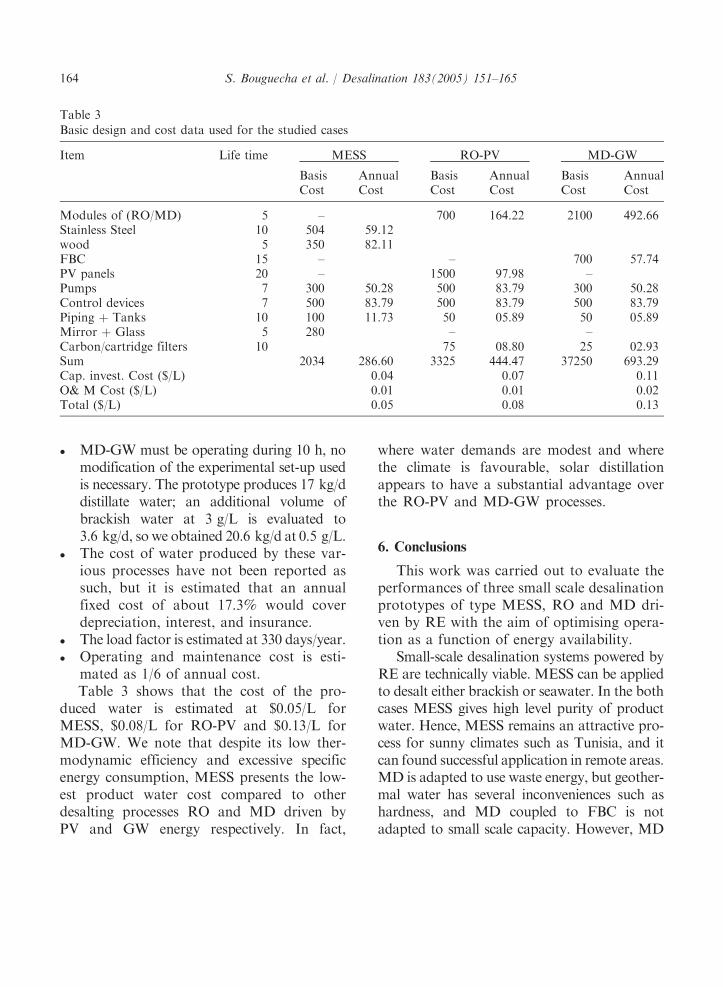
mated as 1/6 of annual cost.Table 3 shows that the cost of the pro-
duced water is estimated at $0.05/L forMESS, $0.08/L for RO-PV and $0.13/L forMD-GW. We note that despite its low ther-modynamic efficiency and excessive specificenergy consumption, MESS presents the low-est product water cost compared to otherdesalting processes RO and MD driven byPV and GW energy respectively. In fact,
where water demands are modest and wherethe climate is favourable, solar distillationappears to have a substantial advantage overthe RO-PV and MD-GW processes.
6. Conclusions
This work was carried out to evaluate theperformances of three small scale desalinationprototypes of type MESS, RO and MD dri-ven by RE with the aim of optimising opera-tion as a function of energy availability.
Small-scale desalination systems powered byRE are technically viable. MESS can be appliedto desalt either brackish or seawater. In the bothcases MESS gives high level purity of productwater. Hence, MESS remains an attractive pro-cess for sunny climates such as Tunisia, and itcan found successful application in remote areas.MD is adapted to use waste energy, but geother-mal water has several inconveniences such ashardness, and MD coupled to FBC is notadapted to small scale capacity. However, MD
Table 3
Basic design and cost data used for the studied cases
Item Life time MESS RO-PV MD-GW
BasisCost
AnnualCost
BasisCost
AnnualCost
BasisCost
AnnualCost
Modules of (RO/MD) 5 – 700 164.22 2100 492.66Stainless Steel 10 504 59.12wood 5 350 82.11FBC 15 – – 700 57.74PV panels 20 – 1500 97.98 –Pumps 7 300 50.28 500 83.79 300 50.28Control devices 7 500 83.79 500 83.79 500 83.79Piping þ Tanks 10 100 11.73 50 05.89 50 05.89Mirror þ Glass 5 280 – –Carbon/cartridge filters 10 75 08.80 25 02.93Sum 2034 286.60 3325 444.47 37250 693.29Cap. invest. Cost ($/L) 0.04 0.07 0.11O& M Cost ($/L) 0.01 0.01 0.02Total ($/L) 0.05 0.08 0.13
164 S. Bouguecha et al. / Desalination 183(2005) 151–165
is a promising process for desalination (highpurity distillate). MD is not significantly limitedby osmotic pressure, so MD can desalt verysaline water, and specific energy consumptionis very low. MD coupled to solar heat collectorspresents an adequate design for small scale desa-lination. Experimental study of RO-PV hasshown that the storage dissipation systemremoves the perturbation due to the fluctuationof solar radiation and is caused by short cloudpassages. Economic feasibility has been demon-strated for MESS, but RO-PV and MD-GWremain expensive solutions.
References
[1] G.N. Tiwari, Y.P. Yadav, P.C. Eames and
B. Norton, Renewable Energy, 5 (1994) 509–516.
[2] A. Joyace, D. Louriers, M. Collares Pereira
and M. Moriera, Renewable Energy, 5 (1994)
517–519.
[3] M. Saghafi, Renewable Energy, 5 (pt III) (1994)
529–531.
[4] R. Khalid AL-Hajri and A. Lulwa Al-Misned,
Renewable Energy, 5 (1994) 524–528.
[5] J.T. Mahdi and B.E. Smith, Renewable Energy,
5 (1994) 520–523.
[6] P.T. Tsilingiris, Renewable Energy, 5 (1994)
1971–1975.
[7] M.S. Sodha, A. Kumar, G.N. Tiwari and
R.C.Tyagi, Solar Energy, 26 (1981) 127–131.
[8] P. Le Goff and M.R. Jeday, Desalination, 82
(1991) 153–163.
[9] G.N. Tiwari, A. Kuperferman and S. Aggarwal,
Desalination, 114 (1997) 3–164.
[10] S. Ben Jabrallah, A. Belghith, A. Jeday and
P. Le Goff, Proceedings of the Cong.
Genie Des Procedes, Djerba, Tome I, 1996,
139–143.
[11] M.M. Misellati, B. Ben Rejeb, A. Zanean and
M. Murad, Proceedings of the Cong. Genie Des
Procedes, Djerba, Tome I, 1996 69–73.
[12] M. Rodriguez-Girones, M. Rodriguez, J. Perez
and J. Veza, Proceedings of the Medical
Conference on Ren. Energy Sources for Water
Production, Santorini, Greece June 1996 173–179.
[13] A. Hanafi, Desalination, 97 (1994) 339–352.
[14] B.G. Keefer, R.D. Hembree and F.C. Scharach,
Desalination, 54 (1985) 89–103.
[15] D. Herold, V. Horstmann, A. Neskakis,
J. Plettner-Marliani, G. Piernavieja and R.
Calero Proceedings of the 6th Arab Inter.
Solar Energy Conference, Muscat Oman, 1998,
299–304.
[16] P.A. Hogan, Sudjito, A.G. Fane and
G.L. Morrison, Desalination, 81 (1991) 81–90.
[17] M.C. de Andres, J. Dria, M. Khayet, L. Pena
and J.I. Mengual, Desalination, 115 (1998)
71–81.
[18] Y. Bahri, Revue tunisienne de l’Energie, 24
(1991) 37–42.
[19] S. Bouguecha and M. Dhahbi, Desalination, 151
(2002) 75–86.
[20] H. Ben Dhia, Les Provinces Geothermiques
en Tunisie: Potentialites geothermiques de la
Tunisie meridionale, These Docteur es Sciences
Naturelles, Universite de Bordeaux, France,
1983.
[21] S. Bouguecha, B. Hamrouni and M. Dhahbi,
Desalination, 168 (2004) 95–100.
[22] S. Bouguecha and M. Dhahbi, Desalination, 152
(2002) 237–244.
[23] A.A. Nias, Master of Sci., FST Universite El-
Manar Tunis, Tunisie, 1999.
[24] B. Bouchekima, B. Gros, R. Ouahes and
M. Diboun, Desalination, 37 (2001) 31–38.
[25] B. Bouchekima, B. Gros, R. Ouahes and
M. Diboun, Desalination, 38 (2001) 147–155.
[26] A. Joyce, D. Loureiro, C. Rodrigues and
S. Castro, Desalination, 137 (2001) 39–44.
S. Bouguecha et al. / Desalination 183(2005) 151–165 165