slides prepared by thomas bishop lecture 6 outsourcing (anti)dumping multinationals midterm review
TRANSCRIPT

Slides prepared by Thomas Bishop
Lecture 6
Outsourcing
(Anti)dumping
Multinationals
Midterm Review

Copyright © 2006 Pearson Addison-Wesley. All rights reserved. 7-2
Outline of the lecture
• Video on outsourcing
• Presentation on outsourcing
• Presentation on antidumping
• Presentation on emerging world multinationals
• Presentation of my research
• Midterm Review

Copyright © 2006 Pearson Addison-Wesley. All rights reserved. 7-3
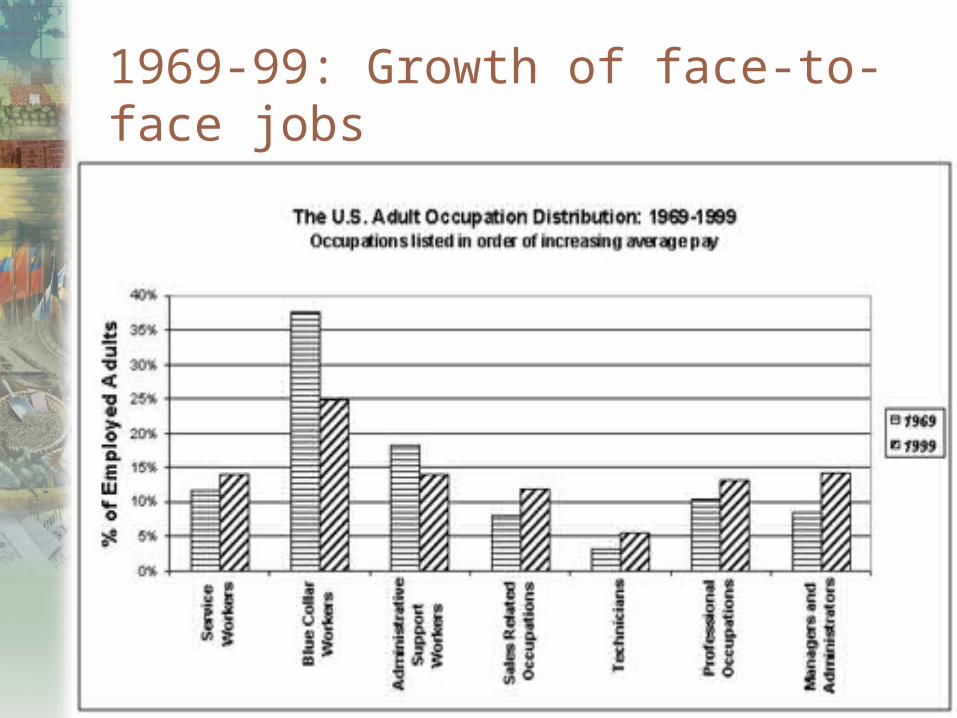
Video on the Job Threat
• Face-to-face jobs can’t be outsourced or replaced by computers
• They can’t be reduced to a series of yes-no questions
• The New Division of Labor by Levy and Murnane
Copyright © 2006 Pearson Addison-Wesley. All rights reserved. 7-4
1969-99: Growth of face-to-face jobs

Copyright © 2006 Pearson Addison-Wesley. All rights reserved. 7-5
Links
• Discussion with the authors
• The Book on googlebooks

Copyright © 2006 Pearson Addison-Wesley. All rights reserved. 7-6
2 key skills related to face-to-face jobs
• Expert thinking
• Complex communication

Copyright © 2006 Pearson Addison-Wesley. All rights reserved. 7-7
Expert thinking
• The ability to solve new problems that cannot be solved by rules
• Doing research and innovating
• Fixing a new problem in a car
• Creating a new dish in a restaurant
Copyright © 2006 Pearson Addison-Wesley. All rights reserved. 7-8
Complex communication
• The ability not only to transmit information, but to convey a particular interpretation of information to others
• Teaching
• Selling
• Negotiation

Copyright © 2006 Pearson Addison-Wesley. All rights reserved. 7-9
Talk on services outsourcing
Copyright © 2006 Pearson Addison-Wesley. All rights reserved. 7-10
Dumping defined: price discrimination
• Dumping is the practice of charging a lower price for exported goods than for goods sold domestically.
• Dumping is an example of price discrimination: the practice of charging different customers different prices.
• Price discrimination and dumping may occur only if imperfect competition exists: firms are able to influence
market prices.
markets are segmented so that goods are not easily bought in one market and resold in another.

Copyright © 2006 Pearson Addison-Wesley. All rights reserved. 7-11
Dumping may be profit maximizing
• Dumping may be a profit maximizing strategy because of differences in foreign and domestic markets.
• One difference is that domestic firms usually have a larger share of the domestic market than they do of foreign markets. Because of less market dominance and more competition in
foreign markets, foreign sales are usually more responsive to price changes than domestic sales.
Domestic firms may be able to charge a high price in the domestic market but must charge a low price on exports if foreign consumers are more responsive to price changes.

Copyright © 2006 Pearson Addison-Wesley. All rights reserved. 7-12
Protectionism and Dumping
• Dumping (as well as price discrimination in domestic markets) is widely regarded as unfair.
• A US firm may appeal to the Commerce Department to investigate if dumping by foreign firms has injured the US firm. The Commerce Department may impose an “anti-dumping
duty”, or tax, as a precaution against possible injury.
This tax equals the difference between the actual and “fair” price of imports, where “fair” means “price the product is normally sold at in the manufacturer's domestic market ”.

Copyright © 2006 Pearson Addison-Wesley. All rights reserved. 7-13
Protectionism and Dumping (cont.)
• Next the International Trade Commission (ITC) determines if injury to the US firm has actually occurred or is likely to occur.
• If the ITC determines that injury has occurred or is likely to occur, the anti-dumping duty remains in place. See http://www.itds.treas.gov/ADD_CVD.htm

Copyright © 2006 Pearson Addison-Wesley. All rights reserved. 7-14
Top Initiators of Antidumping

Copyright © 2006 Pearson Addison-Wesley. All rights reserved. 7-15
Esteban’s talk on antidumping and trade liberalization in Argentina

Copyright © 2006 Pearson Addison-Wesley. All rights reserved. 7-16
Has the use of Antidumping contributed to maintaining a dynamic toward openness in
Argentina?
Esteban Ferro
IBS
Brandeis University
Copyright © 2006 Pearson Addison-Wesley. All rights reserved. 7-17
Main Idea
• Antidumping (AD) as a tool for trade liberalization vs. as a tool for protection. Finger and Nogues (2006)
• Why is this an important topic? Wide surge of AD cases
• What is my objective?
Copyright © 2006 Pearson Addison-Wesley. All rights reserved. 7-18
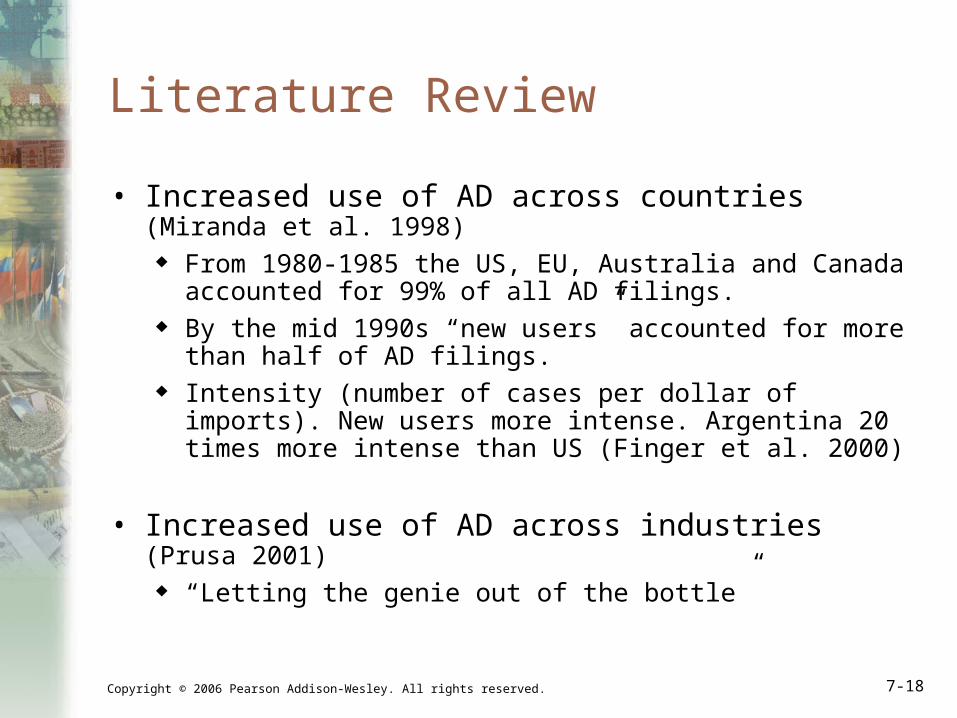
Literature Review
• Increased use of AD across countries (Miranda et al. 1998) From 1980-1985 the US, EU, Australia and Canada
accounted for 99% of all AD filings. By the mid 1990s “new users” accounted for more than half
of AD filings. Intensity (number of cases per dollar of imports). New users
more intense. Argentina 20 times more intense than US (Finger et al. 2000)
• Increased use of AD across industries (Prusa 2001) “Letting the genie out of the bottle”
Copyright © 2006 Pearson Addison-Wesley. All rights reserved. 7-19
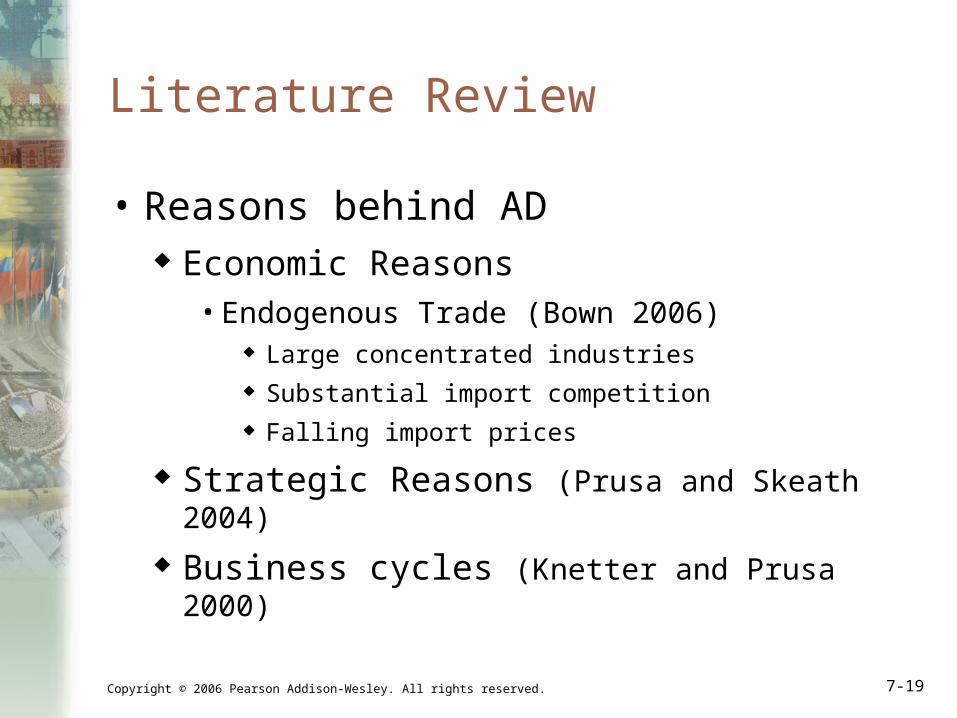
Literature Review
• Reasons behind AD Economic Reasons• Endogenous Trade (Bown 2006)
Large concentrated industries Substantial import competition Falling import prices
Strategic Reasons (Prusa and Skeath 2004)
Business cycles (Knetter and Prusa 2000)

Copyright © 2006 Pearson Addison-Wesley. All rights reserved. 7-20
What I want to test
• Has AD helped Argentina maintain the momentum of trade liberalization?
• In the 1970s and 1980s trade liberalization attempts in Argentina failed and policies were reversed.
• Their latest attempt to liberalize trade (1989) has been sustained even in periods of crisis.

Copyright © 2006 Pearson Addison-Wesley. All rights reserved. 7-21
Argentina’s Trade Liberalization
Figure 3 - GDP growth vs Number of AD cases 1992-2004
-15
-10
-5
0
5
10
15
1990 1992 1994 1996 1998 2000 2002 2004 2006
% c
ha
ng
e in
GD
P
0
5
10
15
20
25
30
35
40
# o
f A
D c
as
es
GDP Growth AD cases

Copyright © 2006 Pearson Addison-Wesley. All rights reserved. 7-22
What I want to test
Figure 5 - Ad-valorem tariffs vs Number of AD cases
0
5
10
15
20
25
30
35
40
45
1985 1987 1989 1991 1993 1995 1997 1999 2001 2003 2005
Ad
Va
lore
m T
ari
ffs
0
5
10
15
20
25
30
35
40
Nu
mb
er
of
AD
ca
se
s
Advalorem Tariffs AD Cases
Copyright © 2006 Pearson Addison-Wesley. All rights reserved. 7-23
Creating a model
• Trade liberalization can only be achieved if countries have the ability to help their import competing industries that are more significantly injured. Need for “special protection” (Bagwell and
Staiger 1990) – short term cooperative remedy.
Copyright © 2006 Pearson Addison-Wesley. All rights reserved. 7-24
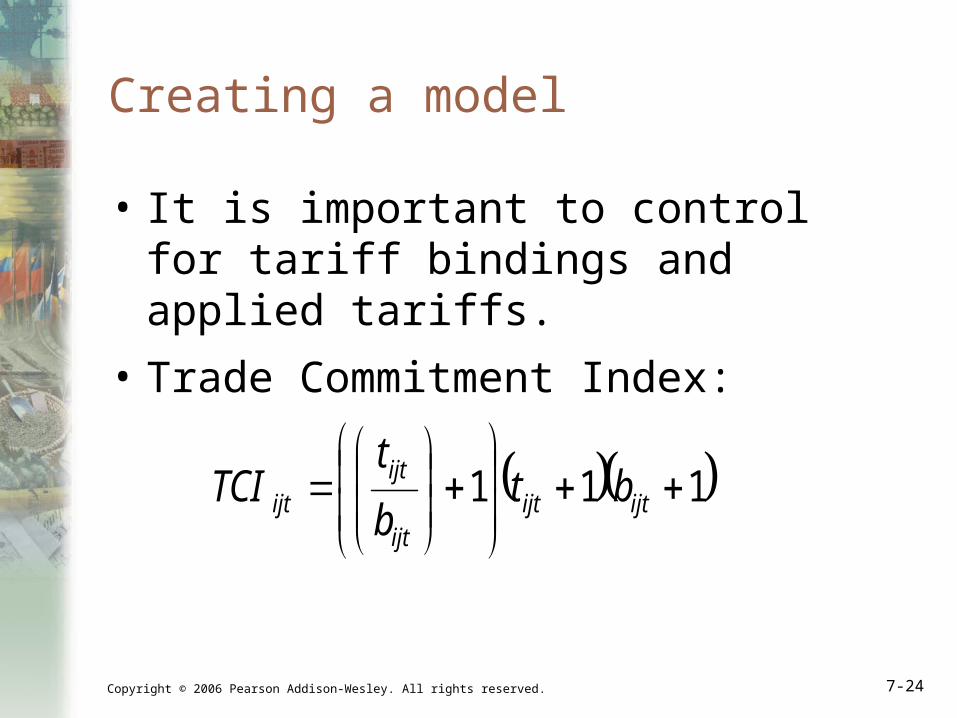
Creating a model
• It is important to control for tariff bindings and applied tariffs.
• Trade Commitment Index:
111
ijtijt
ijt
ijtijt bt
b
tTCI

Copyright © 2006 Pearson Addison-Wesley. All rights reserved. 7-25
Foreign Direct Investment
• Foreign direct investment refers to investment in which firm in one country directly controls or owns a subsidiary in another.
• If a foreign company invests in at least 10% of the stock in a subsidiary, the two firms are typically classified as a multinational corporation. 10% or more of ownership in stock is deemed to be sufficient
for direct control of business operations.
In addition, international borrowing and lending sometimes occurs between a parent company and its subsidiary.

Copyright © 2006 Pearson Addison-Wesley. All rights reserved. 7-26
Multinational Enterprises are different from just FDI flows
• For all MNEs in the world in 2000, foreign affiliates had $21 trillion of financing in place
• But only $6 trillion of that financing was provided by FDI by the multinational enterprises
• Borrowing in the host countries provides a large chunk of financing
Copyright © 2006 Pearson Addison-Wesley. All rights reserved. 7-27
Theory of Multinational Corporations: Location and Internalization
• Why are multinational corporations created and why do they undertake direct foreign investment?
• We rephrase these questions into those dealing with
1. Location: why is a good produced in two countries rather than in one country and then exported to the second country?
2. Internalization: why is production in different locations done by one firm rather that by separate firms?

Copyright © 2006 Pearson Addison-Wesley. All rights reserved. 7-28
Theory of Multinational Corporations: Location
• Why production occurs in separate location is often determined by
the location of necessary factors of production: • mining occurs where minerals are;
• labor intensive production occurs where relatively large pools of labor live.
transportation costs and other barriers to trade may also influence the location of production.
These factors also influence the pattern of trade.

Copyright © 2006 Pearson Addison-Wesley. All rights reserved. 7-29
Theory of Multinations: Internalization, Technology transfers
• Internalization occurs because it is more profitable to conduct transactions and production within a single organization than in separate organizations. Reasons for this include:
1. Technology transfers: transfer of knowledge or another form of technology may be easier within a single organization than through a market transaction between separate organizations.
Patent or property rights may be weak or non-existent. Knowledge may not be easily packaged and sold.
Copyright © 2006 Pearson Addison-Wesley. All rights reserved. 7-30
Vertical Integration
2. Vertical integration involves consolidation of different stages of a production process. Vertical integration would involve consolidation of
one firm that produces a good that is used as an input for another firm.
This may be more efficient than having production operated by separate firms.
For example, having farms and flour mills consolidate into one organization to make flour may be more efficient that have farms and flour mills as separate organizations.
Copyright © 2006 Pearson Addison-Wesley. All rights reserved. 7-31
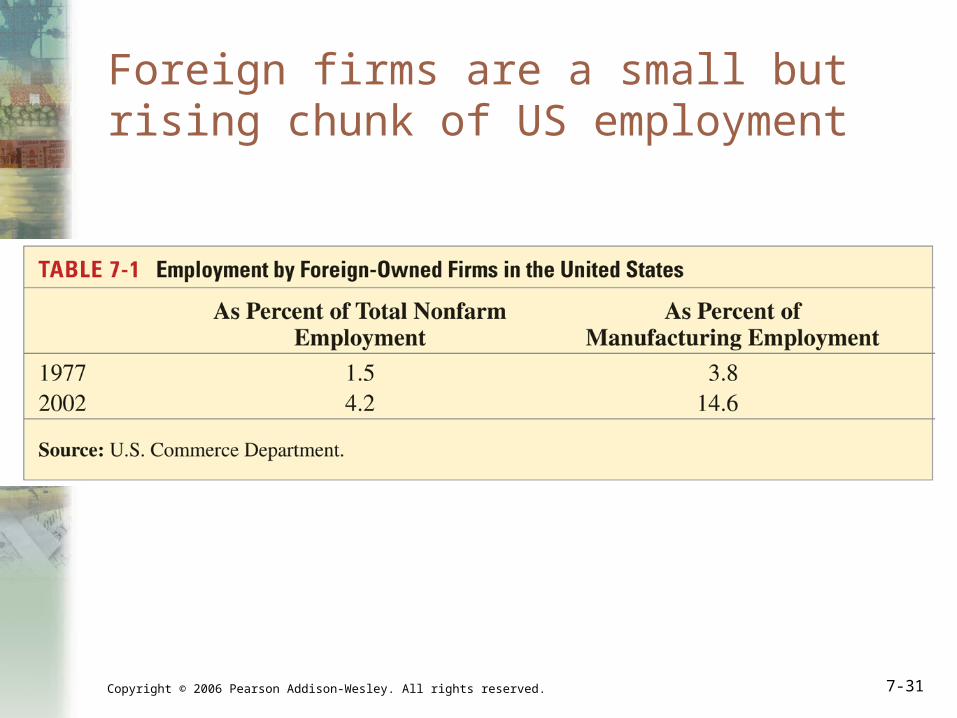
Foreign firms are a small but rising chunk of US employment

Copyright © 2006 Pearson Addison-Wesley. All rights reserved. 7-32
Foreign Direct Investment in the US
Copyright © 2006 Pearson Addison-Wesley. All rights reserved. 7-33
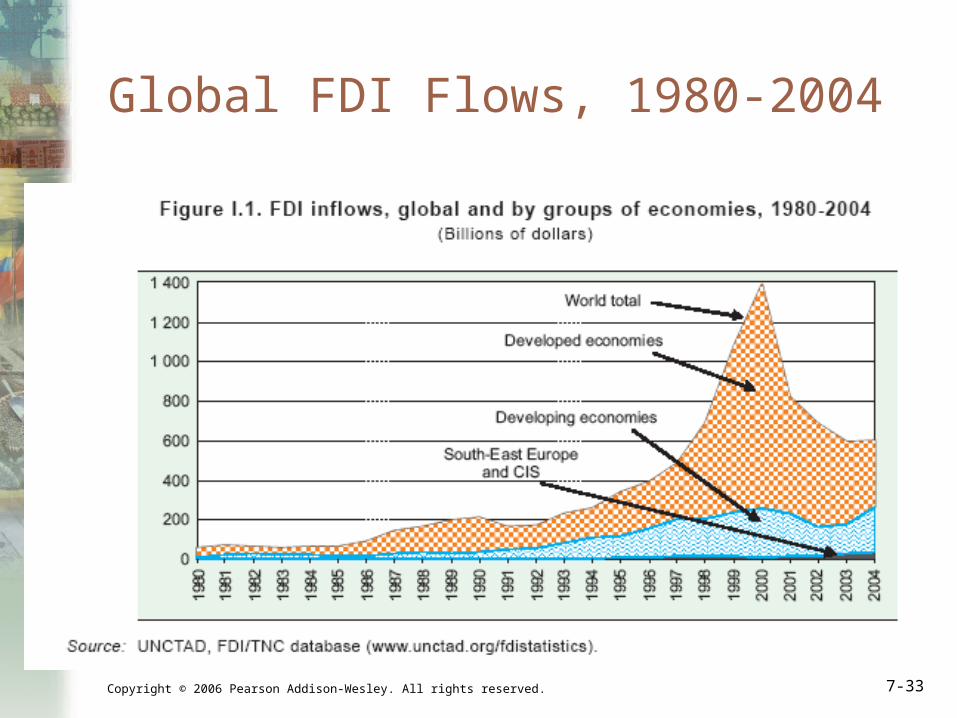
Global FDI Flows, 1980-2004

Copyright © 2006 Pearson Addison-Wesley. All rights reserved. 7-34
Talk on emerging world multinationals

Copyright © 2006 Pearson Addison-Wesley. All rights reserved. 7-35
My Research: Foreign Ownership and Industrial Performance
• Profitability of US Foreign Ventures Majority- vs minority-owned High foreign/domestic sales ratio vs low
• FDI Impact on Host Country Productivity High-tech vs low-tech Capital vs labor productivity

Copyright © 2006 Pearson Addison-Wesley. All rights reserved. 7-36
Main Findings: Profitability, Majority Ownership and Foreign Sales Intensity
• US majority-owned foreign ventures are more profitable than minority-owned
• The profitability gap is largest in sectors where foreign/domestic sales ratio high

Copyright © 2006 Pearson Addison-Wesley. All rights reserved. 7-37
Main Findings: Productivity Spillovers, High-Tech, Capital Productivity
• Impact of FDI on productivity (value added/worker) largest in high-tech
• Impact on capital productivity (value added/capital stock) even higher

Copyright © 2006 Pearson Addison-Wesley. All rights reserved. 7-38
Profitability and Ownership Structureof US Foreign Ventures
Why US Minority Owned JVs Abroad Are
Less Profitable Than Majority Owned
Ben Gomes-Casseres
Mauricio Jenkins
Peter Zámborský
Copyright © 2006 Pearson Addison-Wesley. All rights reserved. 7-39
Low profitability of US JVs abroad
• US manufacturing minority owned JVs abroad earned an average 3% return on assets in 1977-2003
• Majority-owned foreign manufacturing affiliates earned 6.4% ROA
Copyright © 2006 Pearson Addison-Wesley. All rights reserved. 7-40
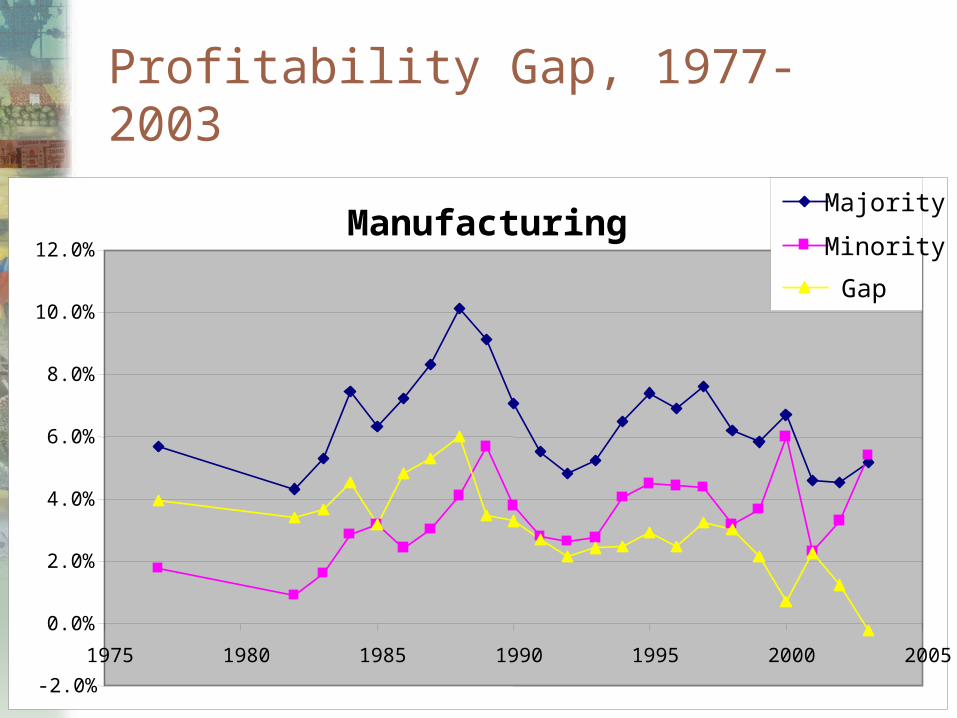
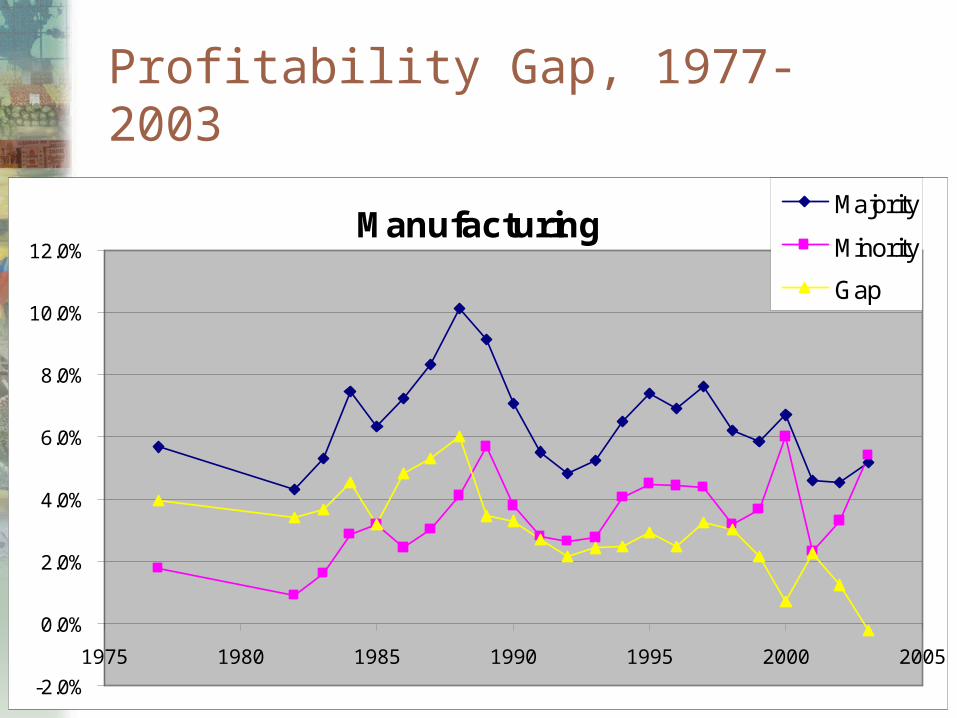
Profitability Gap, 1977-2003
Manufacturing
-2.0%
0.0%
2.0%
4.0%
6.0%
8.0%
10.0%
12.0%
1975 1980 1985 1990 1995 2000 2005
Majority
Minority
Gap

Copyright © 2006 Pearson Addison-Wesley. All rights reserved. 7-41
Possible explanations for gap
We tested for:
• Size
• Age
• Tax rates
• Non-dividend payments
• MNCs’ foreign sales/US sales
Copyright © 2006 Pearson Addison-Wesley. All rights reserved. 7-42
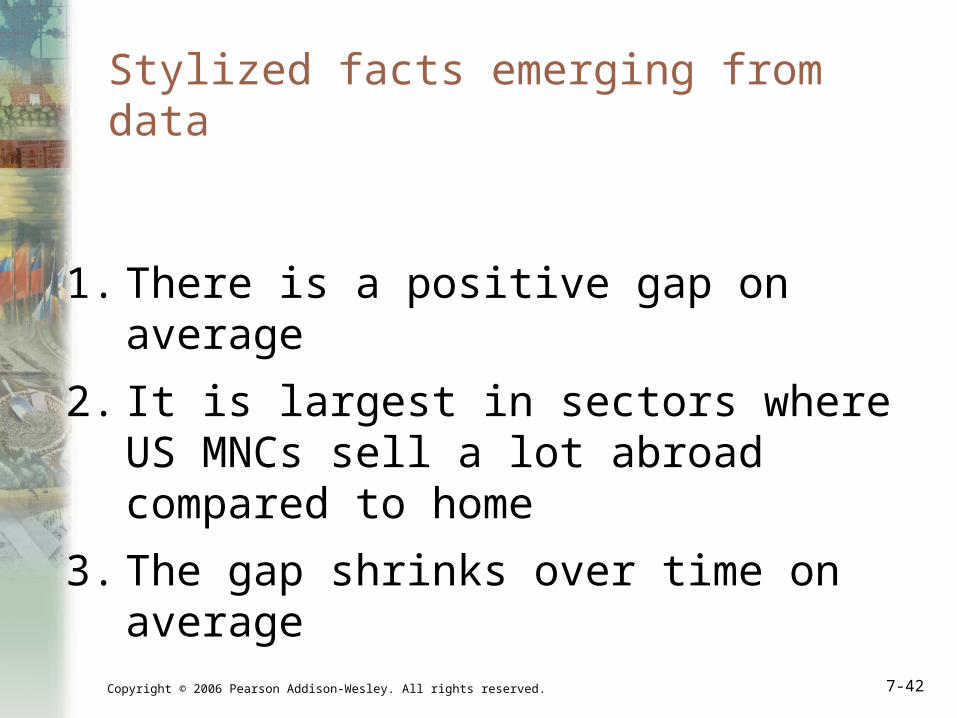
Stylized facts emerging from data
1. There is a positive gap on average
2. It is largest in sectors where US MNCs sell a lot abroad compared to home
3. The gap shrinks over time on average

Copyright © 2006 Pearson Addison-Wesley. All rights reserved. 7-43
Related academic literature
• Desai, Foley and Hines (2004) found sharply declining propensity of US MNEs to form JVs abroad
• They focus on the determinants of ownership structure to explain this

Copyright © 2006 Pearson Addison-Wesley. All rights reserved. 7-44
Declining use of JVs by US MNEs
Share of JVs on Total No. of US Foreign Ventures
0%
20%
40%
60%
80%
100%
1982 1989 1994 1997
Other
JV Share

Copyright © 2006 Pearson Addison-Wesley. All rights reserved. 7-45
Declining use of JVs in China
Share of JVs on FDI flows to China
0.00%
20.00%
40.00%
60.00%
80.00%
100.00%
120.00%
2000 2001 2002 2003 2004
Other
JVs

Copyright © 2006 Pearson Addison-Wesley. All rights reserved. 7-46
Does globalization reduce rationale for international alliances and JVs?
• Globalization reduces trade barriers and communications costs, making international alliances more attractive
• On the other hand, it also increases the return to coordinating operations within multinational firms

Copyright © 2006 Pearson Addison-Wesley. All rights reserved. 7-47
Profitability Gap Defined
• Profitability—Net Income/Net Assets
• Majority-owned ventures,
about 90% of them are 100% owned
• Minority-owned JVs—
All affiliates minus majority-owned
Includes 50-50 JVs, which account for about half of JV affiliates
Copyright © 2006 Pearson Addison-Wesley. All rights reserved. 7-48
Preview of data
• Source: US Bureau of Economic Analysis
• 1977 and 1982-2003
• Non-bank affiliates of non-bank parents
• Industry level, 25 three-digit sectors
• 2 & 1 digit sectors, countries, regions
• Avg. no. of wholly owned foreign ventures in manufacturing: 6,349
• No. of foreign manufacturing JVs: 856
Copyright © 2006 Pearson Addison-Wesley. All rights reserved. 7-49
Profitability Gap, 1977-2003
Manufacturing
-2.0%
0.0%
2.0%
4.0%
6.0%
8.0%
10.0%
12.0%
1975 1980 1985 1990 1995 2000 2005
Majority
Minority
Gap

Copyright © 2006 Pearson Addison-Wesley. All rights reserved. 7-50
Questions about ROA Gap
• Where and when is it positive?
• In which sectors, countries, regions?
• Where and when is it negative?
• Why is it positive/negative?
• Is it shrinking? Growing? Where?

Copyright © 2006 Pearson Addison-Wesley. All rights reserved. 7-51
Top and Bottom 3 Sectors by Gap
Sector (3-digit classification) ROA Gap
Office machines, computers 8.7
Electronic components etc 5.8
Beverages 5.4
Paper and allied products -2.1
Lumber, wood and furniture -3.0
Soap, cleaners and toilet goods -4.9

Copyright © 2006 Pearson Addison-Wesley. All rights reserved. 7-52
SECTOR(3-DIGIT)
ROA MAJ. OWNED
ROA MIN. OWNED
%-POINT ROA GAP
GAP AS % OF MAJ ROA
Office and computing machines 9.7% 1.0% 8.7% 90.0%
Electronic components & accessories 7.4% 1.6% 5.8% 78.3%
Beverages 11.0% 5.7% 5.4% 48.8%
Instruments and related products 7.5% 2.8% 4.7% 63.1%
Radio, TV and telecom equipment 6.3% 2.8% 3.5% 55.7%
Agricultural chemicals 6.1% 2.6% 3.3% 56.9%
Motor vehicles and equipment 4.1% 1.1% 3.1% 74.4%
Drugs 11.4% 8.9% 2.5% 22.2%
Rubber products 5.4% 3.2% 2.2% 40.2%
Fabricated metal products 5.0% 3.1% 1.9% 37.4%
Grain mill and bakery products 7.2% 5.3% 1.9% 26.4%
Construction and mining machinery 2.4% 0.8% 1.7% 68.8%
Stone, clay, nonmetallic mineral goods 5.6% 4.3% 1.4% 24.3%
Industrial chemicals and synthetics 5.4% 4.9% 0.5% 9.3%
Printing and publishing 5.9% 5.9% 0.1% 1.0%
Nonferrous 3.0% 3.0% 0.0% -0.4%
Ferrous 4.4% 4.6% -0.2% -5.1%
Household appliances 4.1% 4.4% -0.3% -6.3%
Miscellaneous plastics products 6.3% 6.9% -0.6% -9.5%
Textile products and apparel 4.2% 5.2% -1.0% -23.4%
Glass products 5.3% 6.5% -1.2% -21.6%
Tobacco products 11.3% 12.9% -1.7% -14.7%
Paper and allied products 4.7% 6.8% -2.1% -44.6%
Lumber, wood, furniture and fixtures 3.3% 6.3% -3.0% -91.7%
Soap, cleaners and toilet goods 7.2% 12.1% -4.9% -68.4%

Copyright © 2006 Pearson Addison-Wesley. All rights reserved. 7-53
Gap positive, falling in most sectors
Office and Computing Machines
-20.00%
-15.00%
-10.00%
-5.00%
0.00%
5.00%
10.00%
15.00%
20.00%
25.00%
30.00%
35.00%
1975 1980 1985 1990 1995 2000 2005
Majority
Minority
% Pt Gap

Copyright © 2006 Pearson Addison-Wesley. All rights reserved. 7-54
But in some stays stable, negative
Soaps and Toiletries
-25.00%
-20.00%
-15.00%
-10.00%
-5.00%
0.00%
5.00%
10.00%
15.00%
20.00%
25.00%
30.00%
1975 1980 1985 1990 1995 2000 2005
Majority
Minority
% Pt Gap
Copyright © 2006 Pearson Addison-Wesley. All rights reserved. 7-55
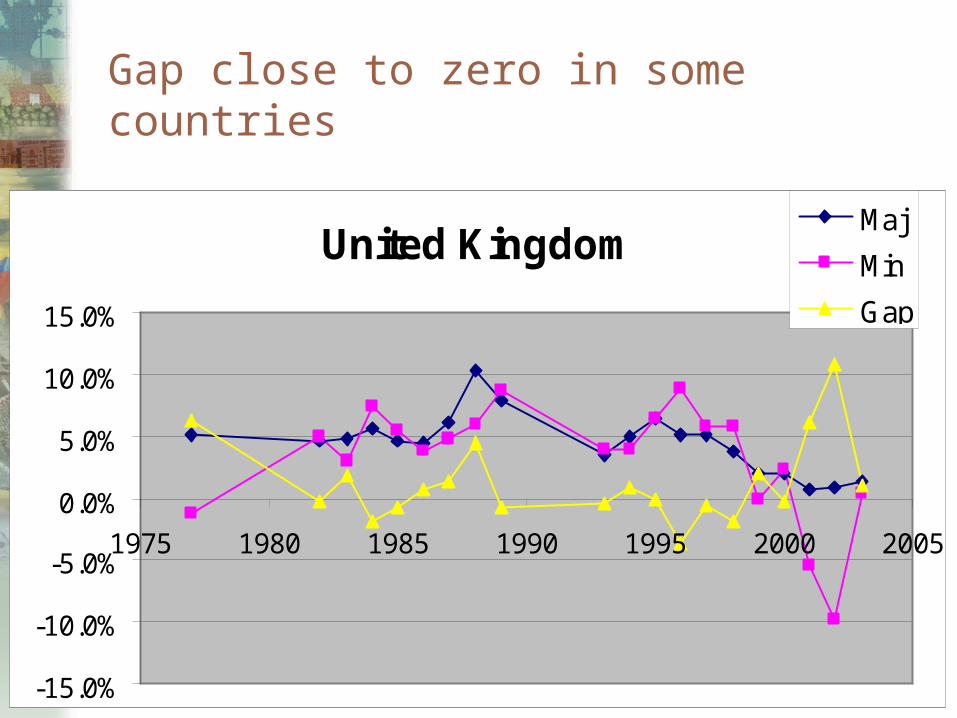
Gap close to zero in some countries
United Kingdom
-15.0%
-10.0%
-5.0%
0.0%
5.0%
10.0%
15.0%
1975 1980 1985 1990 1995 2000 2005
Maj
Min
Gap

Copyright © 2006 Pearson Addison-Wesley. All rights reserved. 7-56
Some regions are closing the gap
Asia and Pacific
-5.0%
0.0%
5.0%
10.0%
15.0%
1975 1980 1985 1990 1995 2000 2005
Maj
Min
Gap

Copyright © 2006 Pearson Addison-Wesley. All rights reserved. 7-57
Theoretical Explanation:Ownership-specific capabilities
• Ownership-specific capabilities of MNE
• Reflect competitive advantage of MNE compared to local rivals abroad
Copyright © 2006 Pearson Addison-Wesley. All rights reserved. 7-58
Determinants of ownership and profitability
• If the ownership-specific capabilities are strong, MNE likely to choose whole ownership, profits high
• If they are weak, MNE likely to seek additional capabilities from local firm, profits likely to be lower
Copyright © 2006 Pearson Addison-Wesley. All rights reserved. 7-59
Measures of ownership-specific capabilities
• Should reflect international competitive advantage of MNE/industry
• Sales of US corporations abroad/Sales of US corporations in the US
• Sales of US firms abroad/Sales of all firms in the US
• Sales data from BEA and Census of US Manufacturers

Copyright © 2006 Pearson Addison-Wesley. All rights reserved. 7-60
Foreign Sales of US Firms/US Sales in their Sector
0% 20% 40% 60% 80% 100%
Office and computing machines
Beverages
Electronic components and accessories
Paper and allied products
Textile products and apparel
Ferrous
Average
1991-00
1983-90

Copyright © 2006 Pearson Addison-Wesley. All rights reserved. 7-61
Sectors with largest gap have largest ratio of foreign/US sales
1983-2000
Industry 3-digit
Avg ROA Gap
US FSales/
US Sales
Office machines, computers 8.6% 89%
Beverages 6.3% 31%
Electronic components 4.6% 34%
Instruments 4.4% 20%
Radio, TV, communications 4.2% 23%
Motor vehicles, equipment 3.9% 57%
Copyright © 2006 Pearson Addison-Wesley. All rights reserved. 7-62
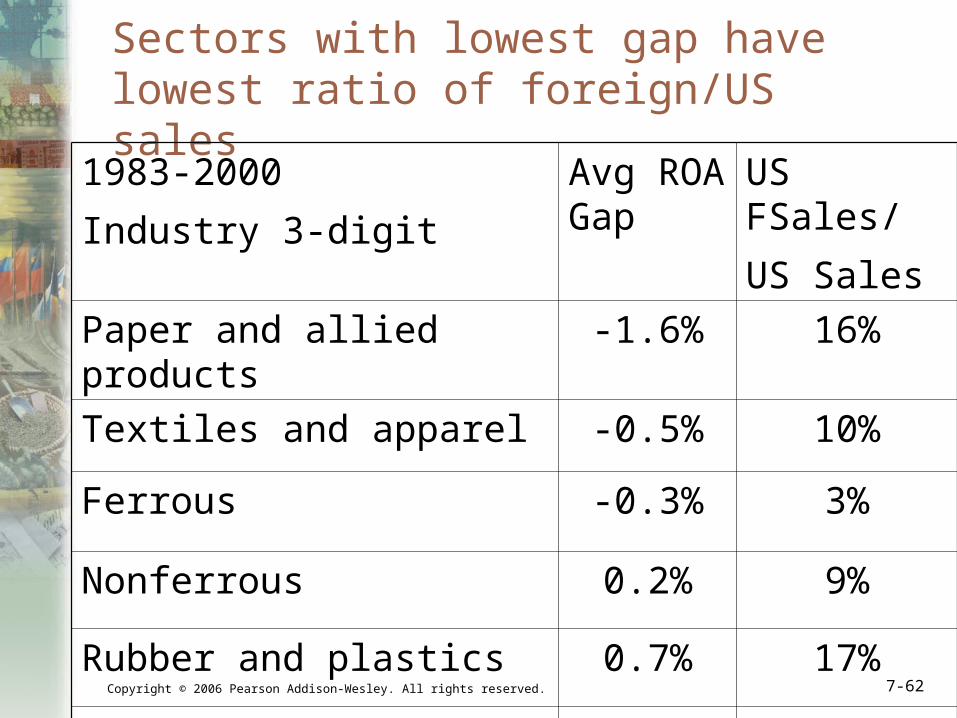
Sectors with lowest gap have lowest ratio of foreign/US sales
1983-2000
Industry 3-digit
Avg ROA Gap
US FSales/
US Sales
Paper and allied products -1.6% 16%
Textiles and apparel -0.5% 10%
Ferrous -0.3% 3%
Nonferrous 0.2% 9%
Rubber and plastics 0.7% 17%
Stone, clay and glass 1.1% 12%

Copyright © 2006 Pearson Addison-Wesley. All rights reserved. 7-63
Midterm
• 2 hours
• 30% of grade for undergrads, 25% for grads
• Section I: Multiple Choice & True/False
• Section II: Essay Questions
• Section III: Case Study

Copyright © 2006 Pearson Addison-Wesley. All rights reserved. 7-64
How to prepare
• Section I: review lecture notes
• Section II: review notes and essay questions in assignments
• Section III: review case study

Copyright © 2006 Pearson Addison-Wesley. All rights reserved. 7-65
Office hours
• Mine: Adams A17 Tue 2-4pm
• Esteban’s: Sever 109 Tue 4-6pm
• Feel free to email us with questions
Copyright © 2006 Pearson Addison-Wesley. All rights reserved. 7-66
Some slides for review
• The gravity model
• World trade patterns
• Ricardo’s theory
• Heckscher-Ohlin
• Stolper-Samuelson
Copyright © 2006 Pearson Addison-Wesley. All rights reserved. 7-67
Slides for review
• Rybczynski Theorem
• Empirical evidence on H-O
• Effects of Economic Growth
• Effects of Import Tariffs and Export Subsidies
Copyright © 2006 Pearson Addison-Wesley. All rights reserved. 7-68
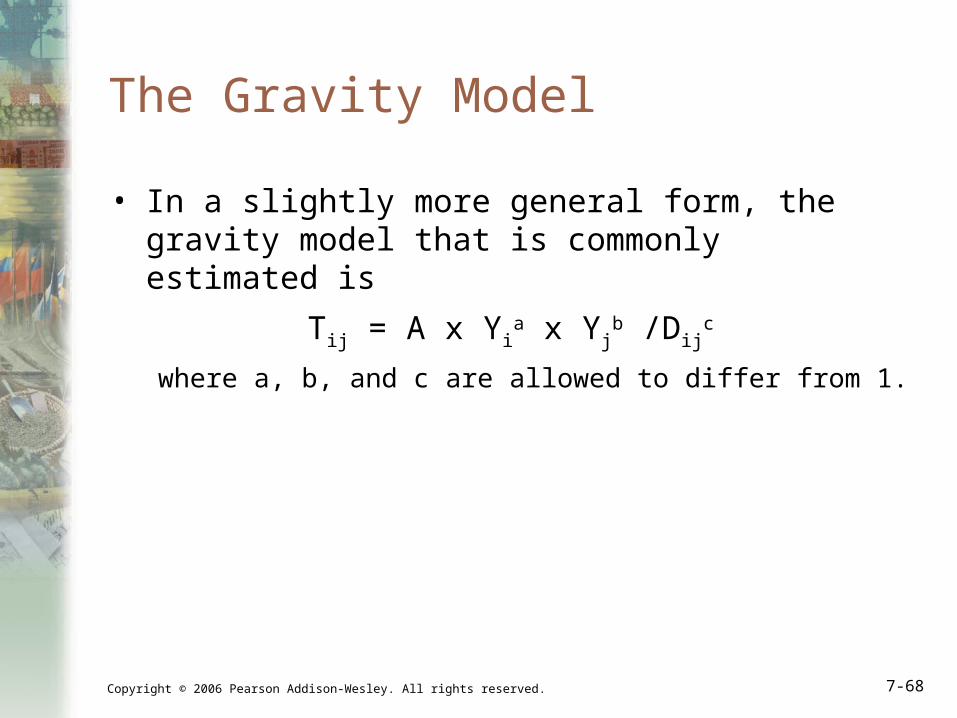
The Gravity Model
• In a slightly more general form, the gravity model that is commonly estimated is
Tij = A x Yia x Yj
b /Dijc
where a, b, and c are allowed to differ from 1.

Copyright © 2006 Pearson Addison-Wesley. All rights reserved. 7-69
Size Matters: The Gravity Model, EU and US
Copyright © 2006 Pearson Addison-Wesley. All rights reserved. 7-70
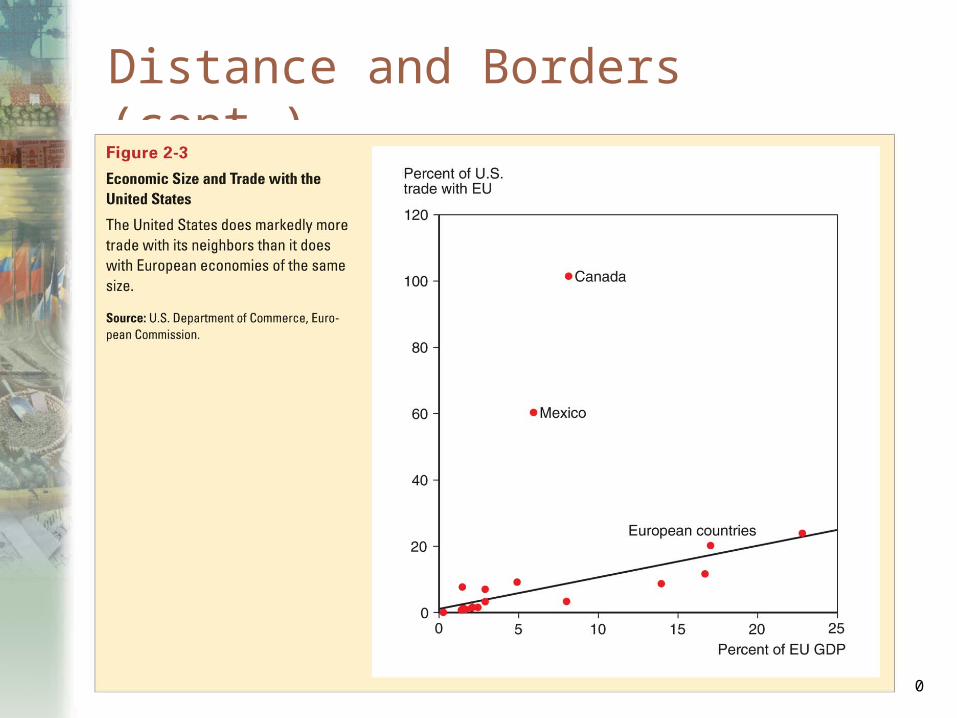
Distance and Borders (cont.)

Copyright © 2006 Pearson Addison-Wesley. All rights reserved. 7-71
UK Trade as % of GDP higher than in US

Copyright © 2006 Pearson Addison-Wesley. All rights reserved. 7-72
Rising Share of Manufactures on US, UK Trade

Copyright © 2006 Pearson Addison-Wesley. All rights reserved. 7-73
Services and commodities are a smaller part of the world trade

Copyright © 2006 Pearson Addison-Wesley. All rights reserved. 7-74
Poorer countries rely less on agriculture
Copyright © 2006 Pearson Addison-Wesley. All rights reserved. 7-75
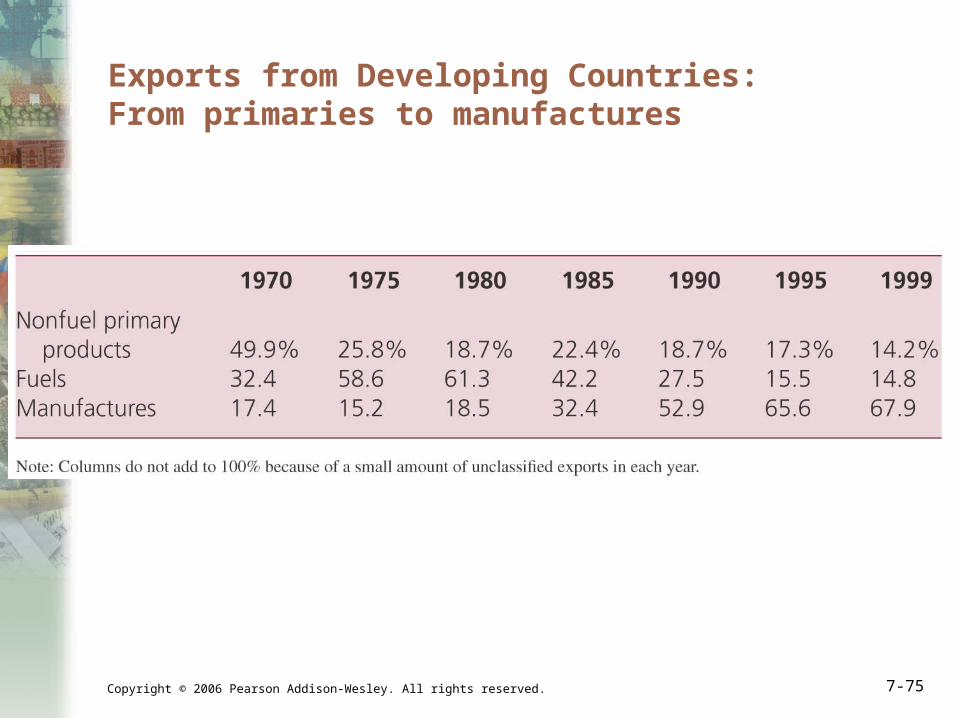
Exports from Developing Countries: From primaries to manufactures

Copyright © 2006 Pearson Addison-Wesley. All rights reserved. 7-76

Copyright © 2006 Pearson Addison-Wesley. All rights reserved. 7-77

Copyright © 2006 Pearson Addison-Wesley. All rights reserved. 7-78

Copyright © 2006 Pearson Addison-Wesley. All rights reserved. 7-79
Ricardian model—labor productivityHeckscher-Ohlin—production factors
• The Ricardian model (chapter 3) stresses that
differences in productivity of labor between countries cause productive differences, leading to gains from trade (Differences in productivity are usually explained by differences in technology).
• The Heckscher-Ohlin model (chapter 4) says differences in production factors (labor, labor skills, physical capital and land) between countries cause productive differences, leading to gains from trade.
Copyright © 2006 Pearson Addison-Wesley. All rights reserved. 7-80
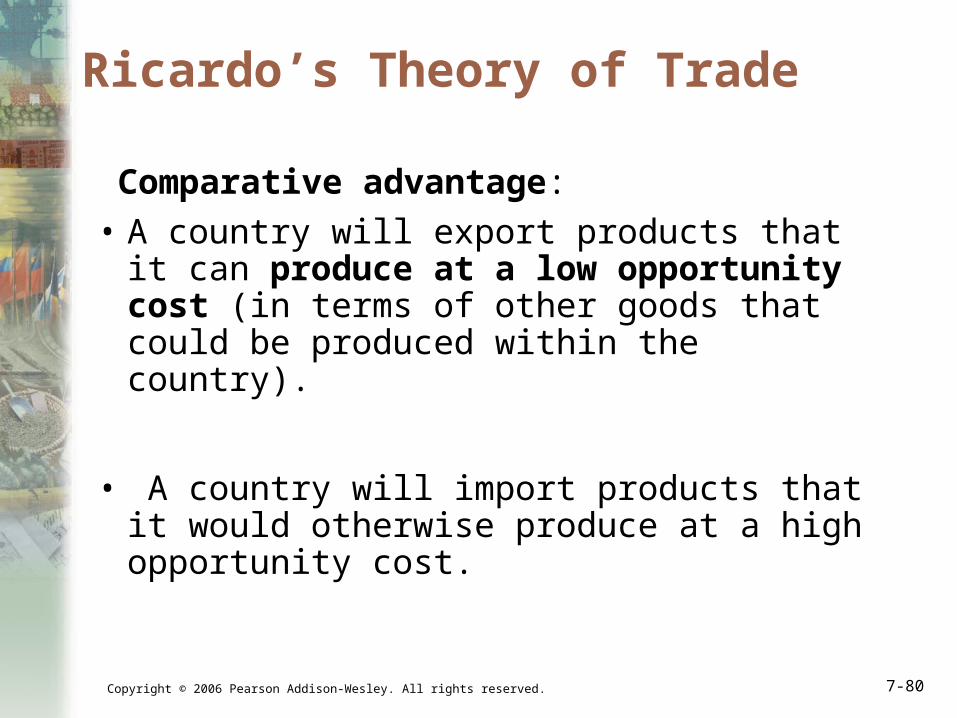
Ricardo’s Theory of Trade
Comparative advantage:
• A country will export products that it can produce at a low opportunity cost (in terms of other goods that could be produced within the country).
• A country will import products that it would otherwise produce at a high opportunity cost.
Copyright © 2006 Pearson Addison-Wesley. All rights reserved. 7-81
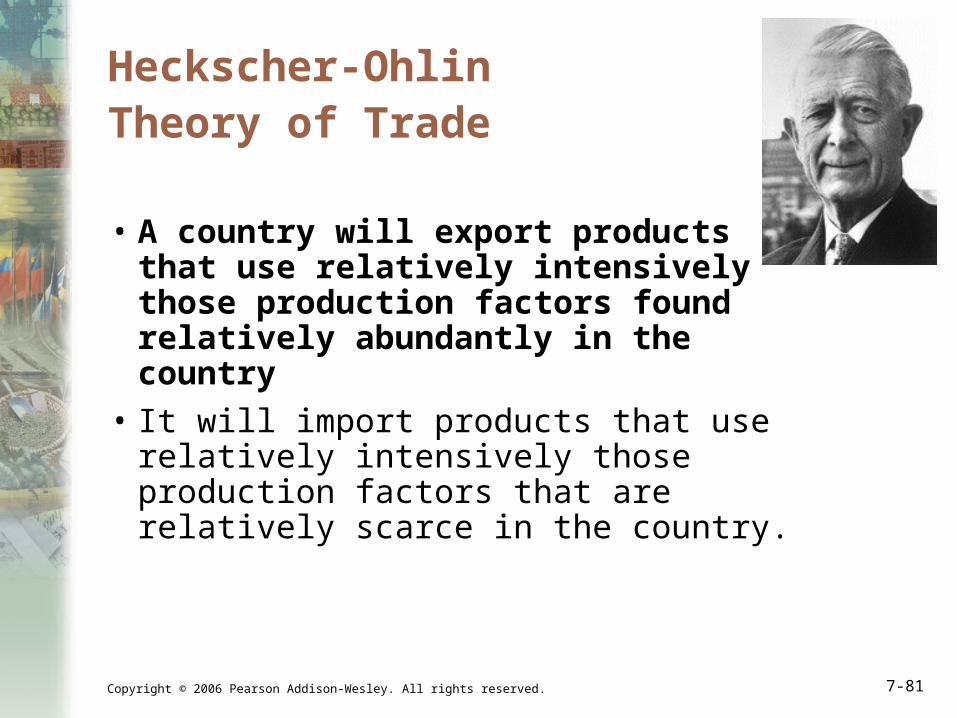
Heckscher-Ohlin Theory of Trade
• A country will export products that use relatively intensively those production factors found relatively abundantly in the country
• It will import products that use relatively intensively those production factors that are relatively scarce in the country.

Copyright © 2006 Pearson Addison-Wesley. All rights reserved. 7-82
Stolper-Samuelson Theorem
• If the relative price of a good increases, then the real wage or rate of return of the factor used intensively in the production of that good increases, while the real wage or rate of return of the other factor decreases.

Copyright © 2006 Pearson Addison-Wesley. All rights reserved. 7-83
Stolper and Samuelson

Copyright © 2006 Pearson Addison-Wesley. All rights reserved. 7-84
S-S theorem in other words
If you make living selling a factor that is more abundant in your country than it is in other countries, you gain from trade (by receiving a higher real income), regardless of what sector you work in or what goods you consume
• Examples are scientists and grain-area landowners in the US

Copyright © 2006 Pearson Addison-Wesley. All rights reserved. 7-85
Rybczynski Theorem
• How do output levels change when the economy’s resources change?
• If we hold output prices constant as a factor of production increases, then the supply of the good that uses this factor intensively increases and the supply of the other good decreases

Copyright © 2006 Pearson Addison-Wesley. All rights reserved. 7-86
If land grows, output of food grows, output of cloth shrinks

Copyright © 2006 Pearson Addison-Wesley. All rights reserved. 7-87
Intuition behind the theorem
• If only land is growing, the extra land is used by the land-intensive industry—food
• Production of food increases
• This requires not only extra land but also some extra labor
• But the amount of labor did not grow (or grew only a little)
• Thus labor will be acquired from cloth sector
• Cloth production thus declines (it has less labor)
Copyright © 2006 Pearson Addison-Wesley. All rights reserved. 7-88
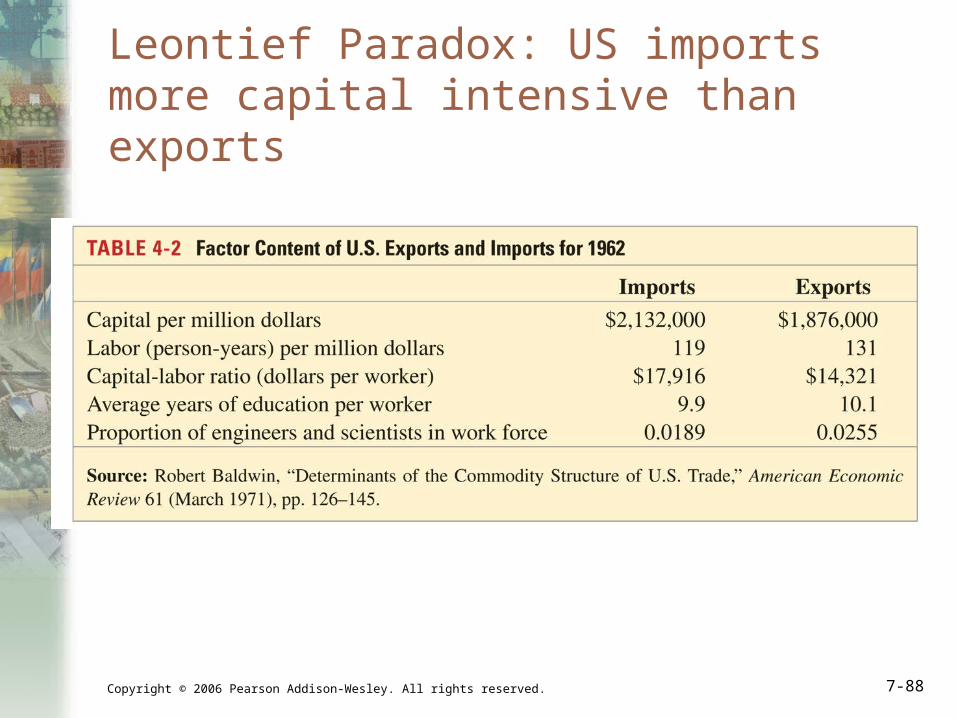
Leontief Paradox: US imports more capital intensive than exports

Copyright © 2006 Pearson Addison-Wesley. All rights reserved. 7-89
Test of H-O on Global Data: Leontief Paradox Alive and Well

Copyright © 2006 Pearson Addison-Wesley. All rights reserved. 7-90
North-South trade more in line with HO
Copyright © 2006 Pearson Addison-Wesley. All rights reserved. 7-91
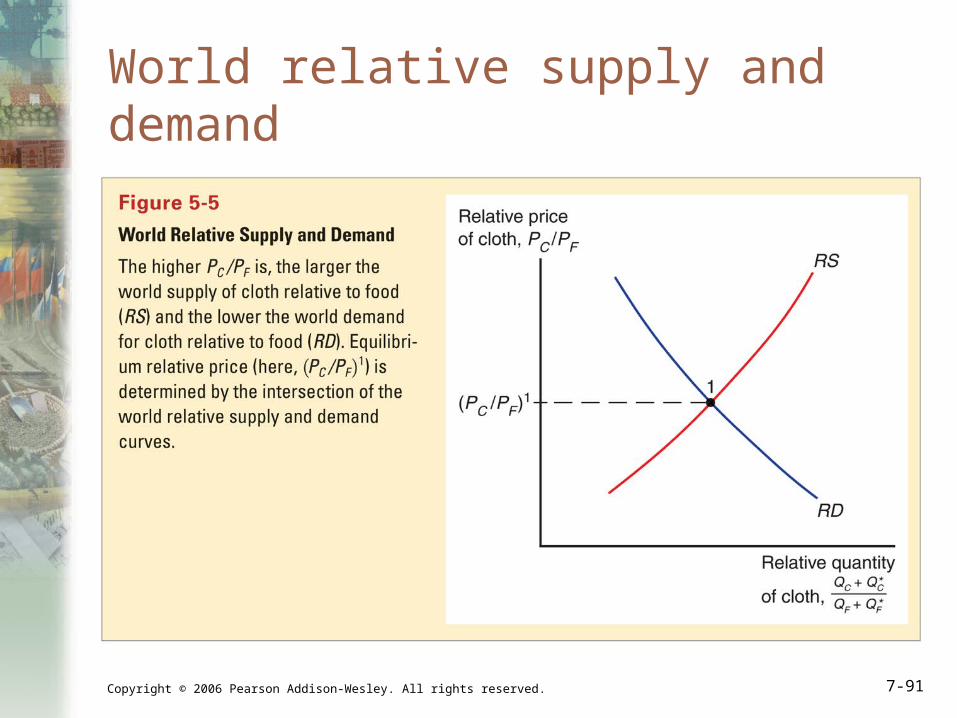
World relative supply and demand

Copyright © 2006 Pearson Addison-Wesley. All rights reserved. 7-92
Growth biased toward cloth shifts RS curve to the right
Copyright © 2006 Pearson Addison-Wesley. All rights reserved. 7-93
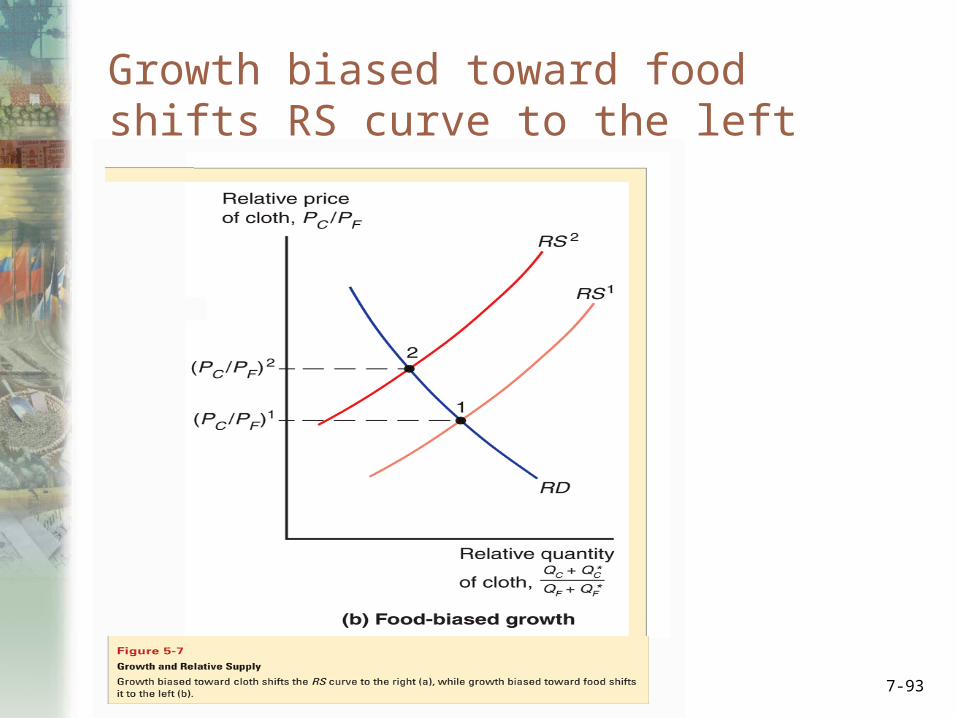
Growth biased toward food shifts RS curve to the left
Copyright © 2006 Pearson Addison-Wesley. All rights reserved. 7-94
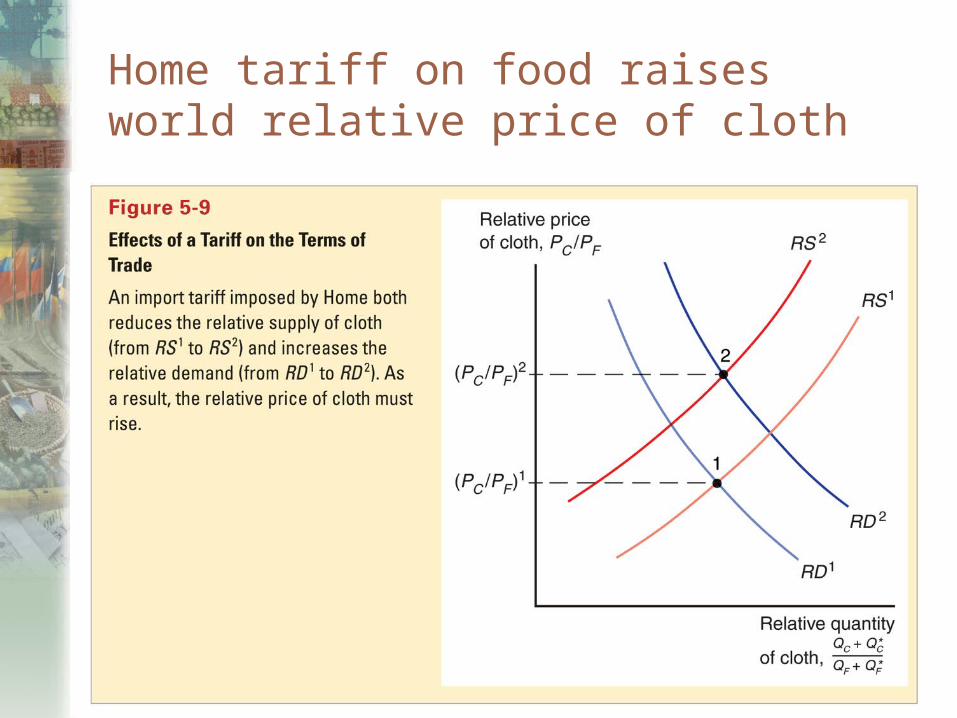
Home tariff on food raises world relative price of cloth

Copyright © 2006 Pearson Addison-Wesley. All rights reserved. 7-95
Export Subsidy Reduces Terms of Trade For the Country That Imposes It
Copyright © 2006 Pearson Addison-Wesley. All rights reserved. 7-96
External and internal economies of scale
• Economies of scale could mean either that larger firms or that a larger industry (e.g., one made of more firms) is more efficient.
• External economies of scale occur when cost per unit of output depends on the size of the industry.
• Internal economies of scale occur when the cost per unit of output depends on the size of a firm.

Copyright © 2006 Pearson Addison-Wesley. All rights reserved. 7-97
Two Types of Gains From Trade
1. Gains from inter-industry trade reflect comparative advantage.
2. Gains from intra-industry trade reflect economies of scale (lower costs) and wider consumer choices.
3. The monopolistic competition model does not predict in which country firms locate, but a comparative advantage in producing the differentiated good will likely cause a country to export more of that good than it imports.

Copyright © 2006 Pearson Addison-Wesley. All rights reserved. 7-98
Factors Affecting Extent of Inter-industry and Intra-industry Trade
4. The relative importance of intra-industry trade depend on how similar countries are. Countries with similar relative amounts
of factors of production are predicted to have intra-industry trade.
Countries with different relative amounts of factors of production are predicted to have inter-industry trade.

Copyright © 2006 Pearson Addison-Wesley. All rights reserved. 7-99
Empirics on Inter-industry and Intra-industry Trade
• About 25% of world trade is intra-industry trade according to standard industrial classifications. Countries with similar relative amounts of skilled
labor, technology and physical capital engage in a large amount of intra-industry trade with the US.
But some industries have more intra-industry trade than others: those industries requiring relatively large amounts of skilled labor, technology and physical capital exhibit intra-industry trade for the US.

Copyright © 2006 Pearson Addison-Wesley. All rights reserved. 7-100
Figure 5.1Intra-Industry Trade Shares

Copyright © 2006 Pearson Addison-Wesley. All rights reserved. 7-101
Inter-industry and Intra-industry Trade (cont.)
Note: an index of 1 means that all trade is intra-industry trade. An index of 0 means that all trade is inter-industry trade.