slag cement concrete- the dutch experience - vegvesen.no compound used to replace portland clinker...
TRANSCRIPT
STATENS VEGVESENS RAPPORTER Nr. 270
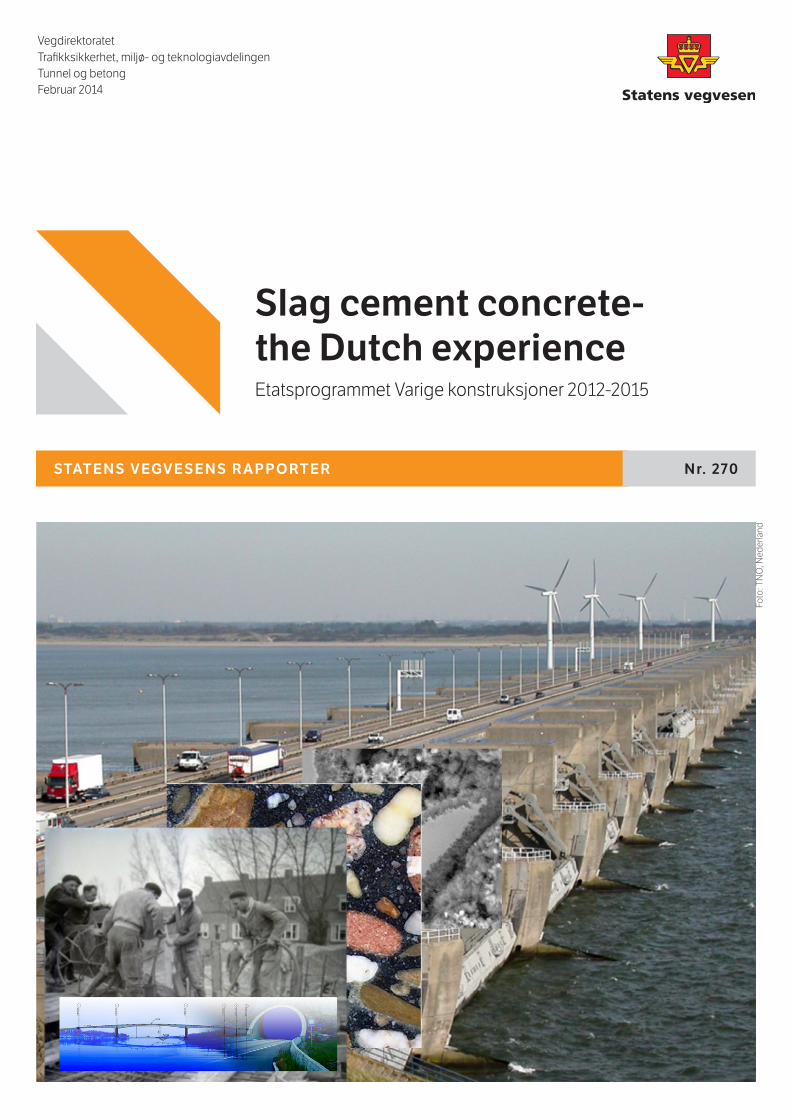
Slag cement concrete-the Dutch experienceEtatsprogrammet Varige konstruksjoner 2012-2015
VegdirektoratetTrafikksikkerhet, miljø- og teknologiavdelingenTunnel og betongFebruar 2014
Foto
: TN
O, N
eder
land
Statens vegvesens rapporter
Bruk av sementer med høyt slagginnhold (CEM III/B i betong
Slaggsement, CEM III/B, bestandighet, klorid-diffusjon, Nederland
Slag cement, CEM III/B, durability, chloride diffusion, the Netherlands
Nederland har nesten 100 års erfaring med bruk av slaggsement med høyt slagginnhold, tilsvarende CEM III/B med 66-80 % slagg iht EN 197-1 (2011), for bruk i infrastruktur inklud-ert marine konstruksjoner. Praktisk erfaring og omfattende laboratorieundersøkelser har gjennom mange tiår vist at betong med slaggsement CEM III/B har betydelig bedre bestandighetsegenskaper enn betong med ren Portlandsement CEM I. Denne rapporten oppsummerer de nederlandske bestan-dighetserfaringene ved bruk av betonger med slaggsement.
The Netherlands have almost a century of experience in the use of ground granulated blast furnace slag (GGBS) cements with high slag content, comparable to current CEM III/B (66-80 % slag) as defined in EN 197-1 (2011) for major infrastructure, including marine concrete. Over decades in practice and in abundant laboratory investigations, CEM III/B concrete has demonstrated consider-ably better performance on durability issues compared to CEM I concrete. This report summarizes the durability performance of slag cement concrete in the Netherlands.
Blast furnace slag cement concrete with high slag content (CEM III/B)
Rob B. Polder, Timo G. Nijland, Mario R. de Rooij
Rob B. Polder, Timo G. Nijland, Mario R. de Rooij
Trafikksikkerhet, miljø- og teknologiavdelin-gen
Traffic Safety, Environment and Technology Department
603246 603246
Nr. 270 No. 270
Synnøve A. Myren/Sølvi Austnes Synnøve A. Myren/Sølvi Austnes
Tunnel og betong Tunnel and concrete
72 72
Februar 2014 February 2014
Tittel Title
AuthorForfatter
Avdeling Department
Prosjektnummer Project number
Rapportnummer Report number
Prosjektleder Project manager
Seksjon Section
Emneord Key words
Sammendrag Summary
Antall sider
Dato
Pages
Date
Nederlandske erfaringer med bestandighet siden 1920-tallet
Experiences with the durability in the Nether-lands since the 1920's
SubtitleUndertittel
Bård Pedersen Bård PedersenGodkjent av Approved by
Norwegian Public Roads AdministrationNPRA reports

Forord
Denne rapporten inngår i en serie rapporter fra etatsprogrammet Varige konstruksjoner. Programmet hører til under Trafikksikkerhet-, miljø- og teknologiavdelingen i Statens vegvesen, Vegdirektoratet, og foregår i perioden 2012-2015. Hensikten med programmet er å legge til rette for at riktige materialer og produkter brukes på riktig måte i Statens vegvesen sine konstruksjoner, med hovedvekt på bruer og tunneler.
Formålet med programmet er å bidra til mer forutsigbarhet i drift- og vedlikeholdsfasen for konstruksjonene. Dette vil igjen føre til lavere kostnader. Programmet vil også bidra til å øke bevisstheten og kunnskapen om materialer og løsninger, både i Statens vegvesen og i bransjen for øvrig.
For å realisere dette formålet skal programmet bidra til at aktuelle håndbøker i Statens vegvesen oppdateres med tanke på riktig bruk av materialer, sørge for økt kunnskap om miljøpåkjenninger og nedbrytningsmekanismer for bruer og tunneler, og gi konkrete forslag til valg av materialer og løsninger for bruer og tunneler.
Varige konstruksjoner består, i tillegg til et overordnet implementeringsprosjekt, av fire prosjekter:
Prosjekt 1: Tilstandsutvikling bruer Prosjekt 2: Tilstandsutvikling tunneler Prosjekt 3: Fremtidens bruer Prosjekt 4: Fremtidens tunneler
Varige konstruksjoner ledes av Synnøve A. Myren. Mer informasjon om prosjektet finnes på vegvesen.no/varigekonstruksjoner
Denne rapporten tilhører Prosjekt 3: Fremtidens bruer som ledes av Sølvi Austnes. Prosjektet skal
bidra til at fremtidige bruer bygges med materialer bedre tilpasset det miljøet konstruksjonene skal
stå i. Prosjektet skal bygge på etablert kunnskap om skadeutvikling og de sårbare punktene som
identifiseres i Prosjekt 1: Tilstandsutvikling bruer, og skal omhandle både materialer, utførelse og
kontroll. Prosjektet skal resultere i at fremtidige bruer oppnår forutsatt levetid med reduserte og mer
forutsigbare drift- og vedlikeholdskostnader.
Technical Sciences Keverling Buismanweg 5 2628 CL Delft P.O. Box 49 2600 AA Delft The Netherlands www.tno.nl T +31 88 866 30 00 F +31 88 866 30 10 [email protected]
TNO report
TNO 2013 R10100
Experience with the durability of blast furnace slag cement concrete with high slag content (CEM III/B) in the Netherlands since the 1920's
Date May 1, 2013 Author(s) Dr. R.B. Polder
Dr. T.G. Nijland Dr.ir. M.R. de Rooij
Copy no 060-DTM-2013-00204 No. of copies Number of pages 72 (incl. appendices) Number of appendices
2
Sponsor Statens Vegvesen, Vegdirektoratet PO Boxs 8142 Dep N-0033 Oslo Noorwegen
Project name STAR Project number 054.02997 All rights reserved. No part of this publication may be reproduced and/or published by print, photoprint, microfilm or any other means without the previous written consent of TNO. In case this report was drafted on instructions, the rights and obligations of contracting parties are subject to either the General Terms and Conditions for commissions to TNO, or the relevant agreement concluded between the contracting parties. Submitting the report for inspection to parties who have a direct interest is permitted. © 2013 TNO
TNO report | TNO 2013 R10100 2 / 71
Summary
The Netherlands have almost a century of experience in the use of ground granulated blast furnace slag (GGBS) cements with high slag content, comparable to current CEM III/B (66-80 % slag) as defined in EN 197-1 (2011) for major infrastructure, including marine concrete. Over decades in practice and in abundant laboratory investigations, CEM III/B concrete has demonstrated considerably better performance on durability issues compared to CEM I concrete. The durability performance of CEM III/B (with about 70% GGBS) concrete in the Netherlands can be summarized as follows: · Chloride penetration is considerably slower and less deep for CEM III/B
compared to CEM I concrete at similar chloride surface contents, as reflected by lower diffusion coefficients.
· Decrease of apparent chloride diffusion coefficients with age is stronger for CEM III/B than for CEM I, with higher electrical resistivity and lower corrosion rate after depassivation for CEM III/B concrete; the latter shows excellent behaviour with respect to reinforcement corrosion.
· CEM III/B hydration is slower than CEM I hydration; sufficiently long wet curing is required.
· Carbonation of CEM III/B concrete is faster (in particular in accelerated laboratory experiments) than CEM I concrete and results in a more open microstructure. In practice, however, carbonation depths are shallow en pose no problem with respect to reinforcement corrosion for cover depths in the usual range for civil engineering structures.
· Freeze-thaw + de-icing salt resistance of CEM III/B concrete is slightly lower than that of CEM I concrete.
· Under Dutch climate conditions, any freeze-thaw + de-icing salt damage of concrete is very small and the performance of CEM III/B and CEM I concrete are considered to be similar with regard to this aspect.
· In some cases, bad curing (resulting in higher carbonation and a more open microstructure of the cover concrete) increases the susceptibility for freeze-thaw + de-icing salt damage of CEM III/B, especially in the form of scaling, at young age.
· Experience in the Netherlands has shown that deleterious ASR does not occur in concretes with either CEM III/B or CEM III/A with over 50 % GGBS, whilst potentially alkali-silica reactive aggregate is used.
TNO report | TNO 2013 R10100 3 / 70
Contents
Summary .................................................................................................................. 2
1 Introduction .............................................................................................................. 5
1.1 Terminology ............................................................................................................... 5
2 History of use of ground granulated blast furnace slag cement in the
Netherlands .............................................................................................................. 7
3 Ground granulated blast furnace slag: a short introduction and some general
observations .......................................................................................................... 11
3.1 Background information on GGBS .......................................................................... 11
3.2 Some general observations ..................................................................................... 13
3.3 Pore solution chemistry ........................................................................................... 15
3.4 Water absorption ..................................................................................................... 16
3.5 Importance of curing ................................................................................................ 18
4 Chloride penetration and corrosion .................................................................... 21
4.1 General .................................................................................................................... 21
4.2 Research on structures and field exposure ............................................................. 21
4.3 Laboratory studies ................................................................................................... 22
4.4 Summary and conclusion ........................................................................................ 34
5 Carbonation ............................................................................................................ 36
5.1 Laboratory experiments ........................................................................................... 36
5.2 Carbonation of GGBS concrete in practice ............................................................. 38
5.3 Conclusion ............................................................................................................... 40
6 Freeze-thaw resistance ......................................................................................... 42
6.1 General observations on field experience in the Netherlands ................................. 42
6.2 Comparative performance of different cements ...................................................... 43
6.3 Other laboratory experiments .................................................................................. 53
6.4 Conclusion ............................................................................................................... 55
7 Alkali-silica reaction (ASR) ................................................................................... 56
7.1 Historic recognition of ASR in the Netherlands ....................................................... 56
7.2 Relationship with cement type ................................................................................. 57
7.3 Conclusion ............................................................................................................... 58
8 Summary of performance of CEM III/B in Dutch concretes .............................. 59
9 References ............................................................................................................. 60
9.1 Standards, recommendations and guidelines ......................................................... 60
9.2 Literature and reports .............................................................................................. 61
9.3 Product information sheets ...................................................................................... 69
10 Signature ................................................................................................................ 70
Appendices
A Composition of common CEM III/B commercially available in the Netherlands

TNO report | TNO 2013 R10100 4 / 70
B Fly ash used in the Netherlands
TNO report | TNO 2013 R10100 5 / 70
1 Introduction
The Norwegian Public Roads Administration (Staten's Vegvesen; NPRA) is currently reviewing the durability performance of concrete mixes in existing bridges and tunnels, and considering the most appropriate concrete mixes for future bridges and tunnels. The research is part of the NPRA's research program Durable
structures. The Netherlands have almost a century experience in the use of ground granulated blast furnace slag (GGBS) cements with high slag content, comparable to current CEM III/B (66-80 % slag) as defined in EN 197-1 (2011) for major infrastructure, including marine concrete (e.g. Heinemann & Nijland 2009, Heinemann 2013). Over decades in practice and in abundant laboratory investigations, CEM III/B concrete has demonstrated considerably better performance on durability issues such as chloride induced reinforcement corrosion (e.g. Bijen 1996, Polder 2012ab) and alkali-silica reaction. The NPRA and TNO have established a cooperation in order to make this Dutch experience and knowledge available for evaluation within the aforementioned context, and identify possible knowledge gaps with regard to durability performance and needs for future research relevant to the aforementioned Norwegian research programme. The current report is a state-of-the-art review of experience with of CEM III/B cement with concrete in the Netherlands, with emphasis on marine structures. First, a brief history of the use of GGBS in cement for concrete in the Netherlands is provided (chapter 2). In chapter 3, a brief introduction to GGBS and some general observations with regard to GGBS cement are given including pore solution chemistry, water absorption) behaviour and curing. Then, experience with regard to chloride induced reinforcement corrosion (chapter 4), carbonation (chapter 5), alkali-silica reaction (ASR, chapter 6) and freeze-thaw resistance (chapter 7) are evaluated in successive chapters. In chapter 8, Dutch experiences are summarized. Some additional information is given in the appendices, including compositions of CEM III/B commercially available in the Netherlands (Appendix A).
1.1 Terminology
The terminology on cements with ground granulated blast furnace slag as supplementary replacing material for Portland clinker is sometimes confusing. In the current report, the following definitions are used: Ground granulated blast furnace slag (GGBS) – Highly amorphous slag derived from the production of iron, not to be confused with steel slags or other slags. Ground granulated blast furnace slag cement – CEM III/A, CEM III/B and CEM III/C according to EN 197-1 (2011) and historic cements considered to be comparable in slag content. In Dutch practice, CEM III/C is not used.

TNO report | TNO 2013 R10100 6 / 70
Slag cement – Any blast furnace slag cement used in present and past with more than 5 % of GGBS, including current CEM II/A-S, CEM II/B-S, CEM III/A, CEM III/B and CEM III/C, but excluding supersulphated cements and alkali activated slag binders. Supplementary cementing material (SCM) – Any hydraulic or puzzolanic inorganic compound used to replace Portland clinker in a cement, contributing to the formation of C-S-H during hydration. These include ground granulated blast furnace slag (GGBS), pulverized fuel ash or fly ash (PFA), silica fume (SF), metakaolin (MK), amongst others.
TNO report | TNO 2013 R10100 7 / 70
2 History of use of ground granulated blast furnace slag cement in the Netherlands
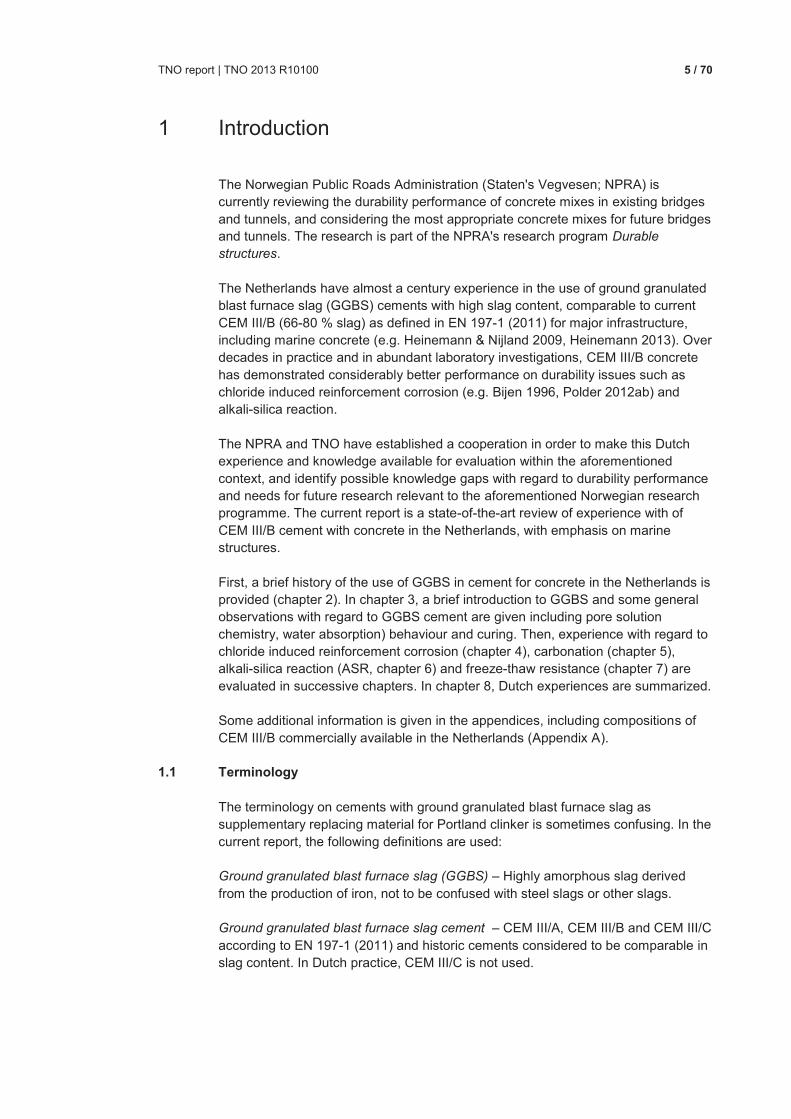
The history of cements used for concrete in the Netherlands is summarized elsewhere (Nijland & Heinemann 2008, Heinemann & Nijland 2009, Heinemann 2013); a brief summary with respect to slag cement is given here. Already during the early 20th century, the (partial) replacement of Portland clinker by ground granulated blast furnace slag (GGBS) was experimented with, resulting in the production of ferroportland (comparable to modern CEM II/B-S) and blast furnace slag cements (comparable to modern CEM III/A and CEM III/B). Originally, the use of GGBS was strongly mistrusted in the Netherlands. Though GGBS-bearing cements were mentioned in the Dutch Reinforced Concrete Regulations of 1918 (Gewapend Beton Voorschriften (GBV) 1918), the use of any slag cement ('slakkencement', comparable to CEM II/B-S) or blast furnace slag cement ('hoogovencement', comparable to CEM III/A and CEM III/B), was explicitly forbidden for reinforced concrete. In Germany, however, blast furnace slag cement had been used for (military) marine structures already before the onset of World War I (Passow 1913), and had obtained treatment equal to ordinary Portland cement in 1917. In the Netherlands, engineers of Rijkswaterstaat (Department of Waterways and Public Works), amongst them the service’s head engineer J.A. Ringers, recognized the potential of blast furnace slag cement and neglected the restriction imposed by the Reinforced Concrete Regulations of 1918 (GBV 1918) (Heerding 1971). The first marine structure in which blast furnace slag cement was used for part of the concrete mixtures was the lock Noordersluis in the North Sea canal at IJmuiden built in the mid-1920's (related in a series of papers in the Dutch professional journal De Ingenieur (The Engineer) by Ringers and colleagues in 1924; Fig. 2.1), based on 'the good experiences, in Germany, with modern
produced blast furnace slag cements in Germany' (Tellegen 1924).GGBS used at Noordersluis, however, was considerably less amorphous than modern GGBS used in the Netherlands (Fig. 2.2).
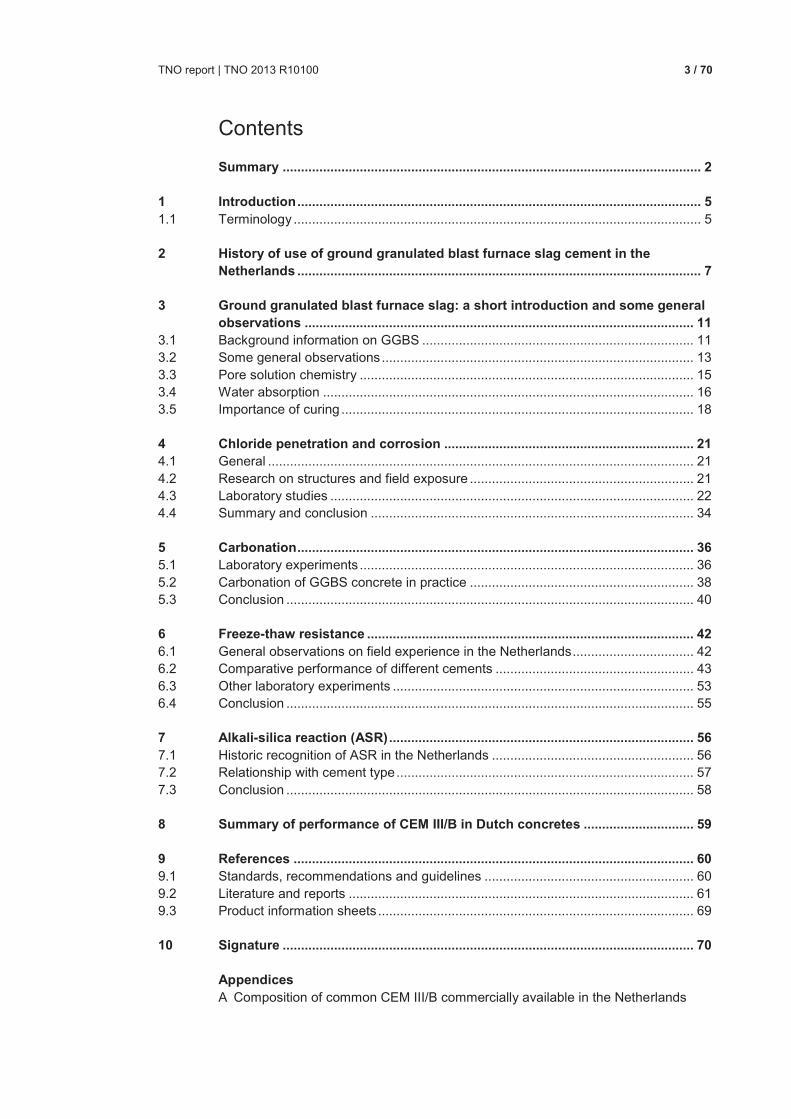
Fig. 1. Construction of the Noordersluis, IJmuiden, including casting of concrete
(From Vissers 1927).
TNO report | TNO 2013 R10100 8 / 70
Fig. 2.2. Microphotographs showing non-reacted GGBS (dark irregular shapes) in
1920s GGBS cement concrete from the lock Noordersluis (sample 96-07, plain polarized light). Note that this early slag was partly crystalline.
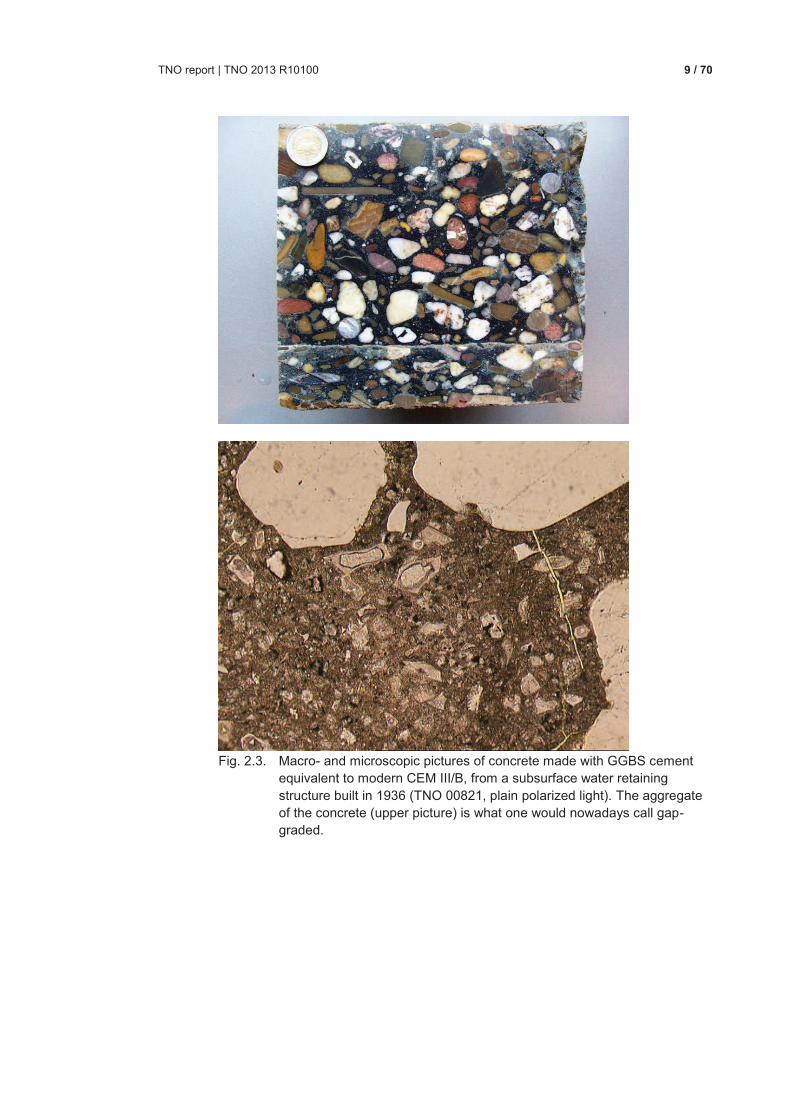
Since the first use in the 1920's, use of GGBS cement for concrete proliferated rapidly in the Netherlands (Fig. 2.4). Unlike the Anglo-Saxon tradition, in which ordinary Portland cement and GGBS are blended, the Netherlands followed the German example of factory produced GGBS cements, in which Portland clinker and Ca-sulphate (anhydrite or hemihydrate) are ground together. In 1931, a joint company, CEMIJ, was established by Dutch Portland cement producer ENCI and the iron making company Hoogovens in IJmuiden (Heerding 1971).Since then, slag quality was designed and controlled for the use in cement. From the 1930s onwards, GGBS used in concrete in the Netherlands is microscopically identical, without any visible crystalline components (which were present in 1920s slag), as illustrated in figure 2.3.
TNO report | TNO 2013 R10100 9 / 70
Fig. 2.3. Macro- and microscopic pictures of concrete made with GGBS cement
equivalent to modern CEM III/B, from a subsurface water retaining structure built in 1936 (TNO 00821, plain polarized light). The aggregate of the concrete (upper picture) is what one would nowadays call gap-graded.
TNO report | TNO 2013 R10100 10 / 70
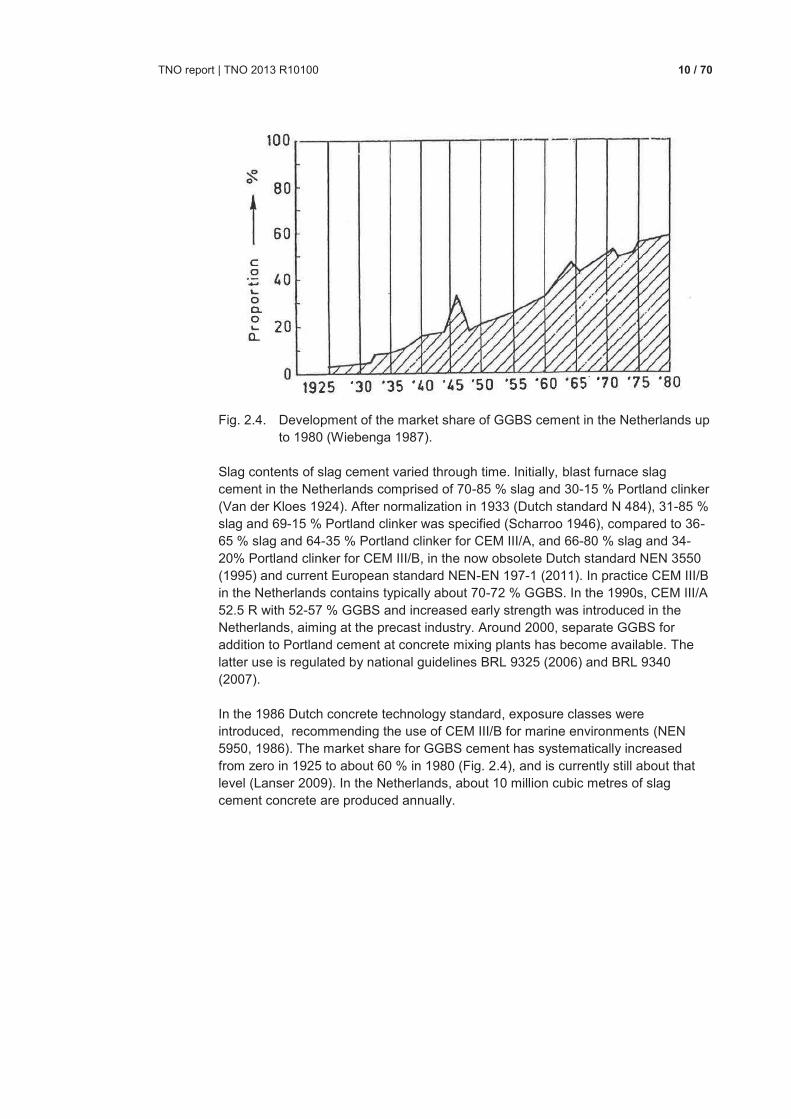
Fig. 2.4. Development of the market share of GGBS cement in the Netherlands up
to 1980 (Wiebenga 1987). Slag contents of slag cement varied through time. Initially, blast furnace slag cement in the Netherlands comprised of 70-85 % slag and 30-15 % Portland clinker (Van der Kloes 1924). After normalization in 1933 (Dutch standard N 484), 31-85 % slag and 69-15 % Portland clinker was specified (Scharroo 1946), compared to 36-65 % slag and 64-35 % Portland clinker for CEM III/A, and 66-80 % slag and 34-20% Portland clinker for CEM III/B, in the now obsolete Dutch standard NEN 3550 (1995) and current European standard NEN-EN 197-1 (2011). In practice CEM III/B in the Netherlands contains typically about 70-72 % GGBS. In the 1990s, CEM III/A 52.5 R with 52-57 % GGBS and increased early strength was introduced in the Netherlands, aiming at the precast industry. Around 2000, separate GGBS for addition to Portland cement at concrete mixing plants has become available. The latter use is regulated by national guidelines BRL 9325 (2006) and BRL 9340 (2007). In the 1986 Dutch concrete technology standard, exposure classes were introduced, recommending the use of CEM III/B for marine environments (NEN 5950, 1986). The market share for GGBS cement has systematically increased from zero in 1925 to about 60 % in 1980 (Fig. 2.4), and is currently still about that level (Lanser 2009). In the Netherlands, about 10 million cubic metres of slag cement concrete are produced annually.
TNO report | TNO 2013 R10100 11 / 70
3 Ground granulated blast furnace slag: a short introduction and some general observations
In this chapter, a short introduction is given with regard to GGBS (§ 3.1). Subsequently, some general observations on CEM III/B are given (§ 3.2), as well as information on the pore solution chemistry of CEM III/B concrete (§ 3.3), water absorption (§ 3.4) and the role of curing (§ 3.5).
3.1 Background information on GGBS
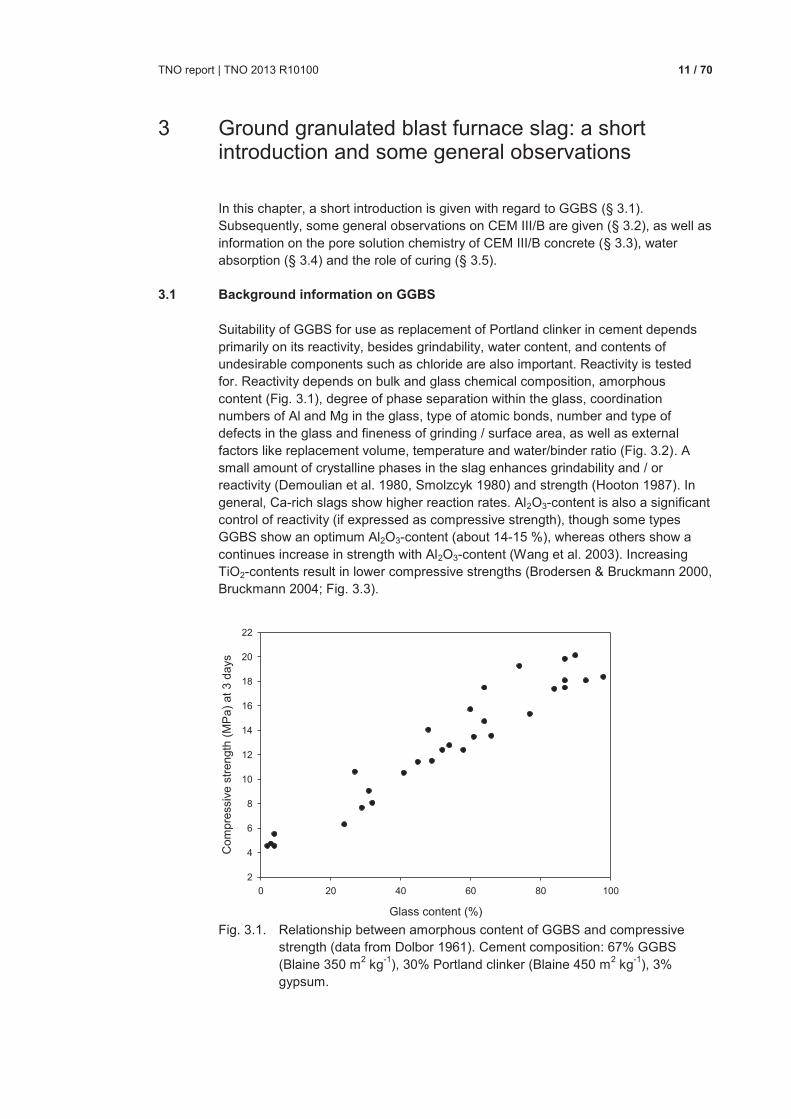
Suitability of GGBS for use as replacement of Portland clinker in cement depends primarily on its reactivity, besides grindability, water content, and contents of undesirable components such as chloride are also important. Reactivity is tested for. Reactivity depends on bulk and glass chemical composition, amorphous content (Fig. 3.1), degree of phase separation within the glass, coordination numbers of Al and Mg in the glass, type of atomic bonds, number and type of defects in the glass and fineness of grinding / surface area, as well as external factors like replacement volume, temperature and water/binder ratio (Fig. 3.2). A small amount of crystalline phases in the slag enhances grindability and / or reactivity (Demoulian et al. 1980, Smolzcyk 1980) and strength (Hooton 1987). In general, Ca-rich slags show higher reaction rates. Al2O3-content is also a significant control of reactivity (if expressed as compressive strength), though some types GGBS show an optimum Al2O3-content (about 14-15 %), whereas others show a continues increase in strength with Al2O3-content (Wang et al. 2003). Increasing TiO2-contents result in lower compressive strengths (Brodersen & Bruckmann 2000, Bruckmann 2004; Fig. 3.3).
Fig. 3.1. Relationship between amorphous content of GGBS and compressive
strength (data from Dolbor 1961). Cement composition: 67% GGBS (Blaine 350 m2 kg-1), 30% Portland clinker (Blaine 450 m2 kg-1), 3% gypsum.
Glass content (%)
0 20 40 60 80 100
Com
pre
ssiv
e s
trength
(M
Pa)
at
3 d
ays
2
4
6
8
10
12
14
16
18
20
22
TNO report | TNO 2013 R10100 12 / 70
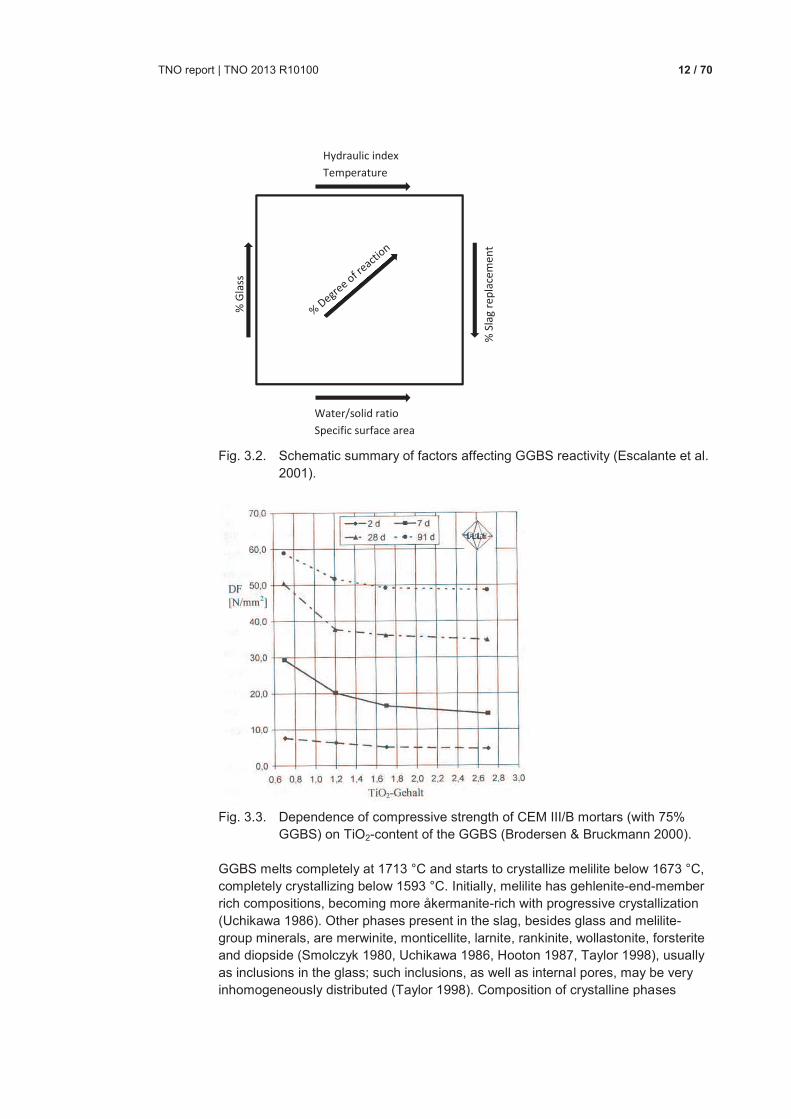
Fig. 3.2. Schematic summary of factors affecting GGBS reactivity (Escalante et al.
2001).
Fig. 3.3. Dependence of compressive strength of CEM III/B mortars (with 75%
GGBS) on TiO2-content of the GGBS (Brodersen & Bruckmann 2000). GGBS melts completely at 1713 °C and starts to crystallize melilite below 1673 °C, completely crystallizing below 1593 °C. Initially, melilite has gehlenite-end-member rich compositions, becoming more åkermanite-rich with progressive crystallization (Uchikawa 1986). Other phases present in the slag, besides glass and melilite-group minerals, are merwinite, monticellite, larnite, rankinite, wollastonite, forsterite and diopside (Smolczyk 1980, Uchikawa 1986, Hooton 1987, Taylor 1998), usually as inclusions in the glass; such inclusions, as well as internal pores, may be very inhomogeneously distributed (Taylor 1998). Composition of crystalline phases
Hydraulic index
Temperature
Water/solid ratio
Specific surface area
% S
lag
re
pla
cem
en
t
% G
lass
TNO report | TNO 2013 R10100 13 / 70
exerts some additional control on slag reactivity: Slags rich in åkermanite are slower to hydrate (Regourd 1980). In spite of over a century of (applied) scientific research, the actual reaction mechanism of GGBS has not been established. GGBS is latent hydraulic, with which alkali, sulfate and Ca(OH)2 activating the slag, but some evidence also suggests a secondary pozzolanic reaction mechanism. Note, with respect to this, that GGBS compositions used in research on reaction mechanisms reported in literature vary considerably. The main hydration products of pure GGBS are C-S-H and hydrotalcite-like phases with variable MgO/Al2O3, with minor hydrogarnet, ettringite and AFm phases (tetracalcium aluminate hydrate, C4AH13 and strätlingite (e.g. Harrison et al. 1987, Barker 1989, Feng et al. 1989, Richardson & Groves 1992, Gollop & Taylor 1996ab, Taylor 1988, Chen & Brouwers 2007). In concretes, GGBS has been used as a binder in three different ways: as replacement of Portland clinker (SCM), in supersulphated cements and alkali-activated slag binders. The first case encompasses cements II/A-S, II/B-S, III/A, III/B and III/C according to European standard EN 197-1 (2011). EN 197-1 (2011) holds the following requirements for GGBS for use in cement: · Amorphous content > 66 % · Total amount of SiO2 + MgO + CaO > 66 % · CaO / (SiO2 + MgO) > 1.0 In practice, amorphous contents well above 90 % are required for high performance GGBS cements. In general, GGBS in Germany has an amorphous content over 95 % (VDZ 1999). The same holds for slag used in the Netherlands investigated by TNO.
3.2 Some general observations
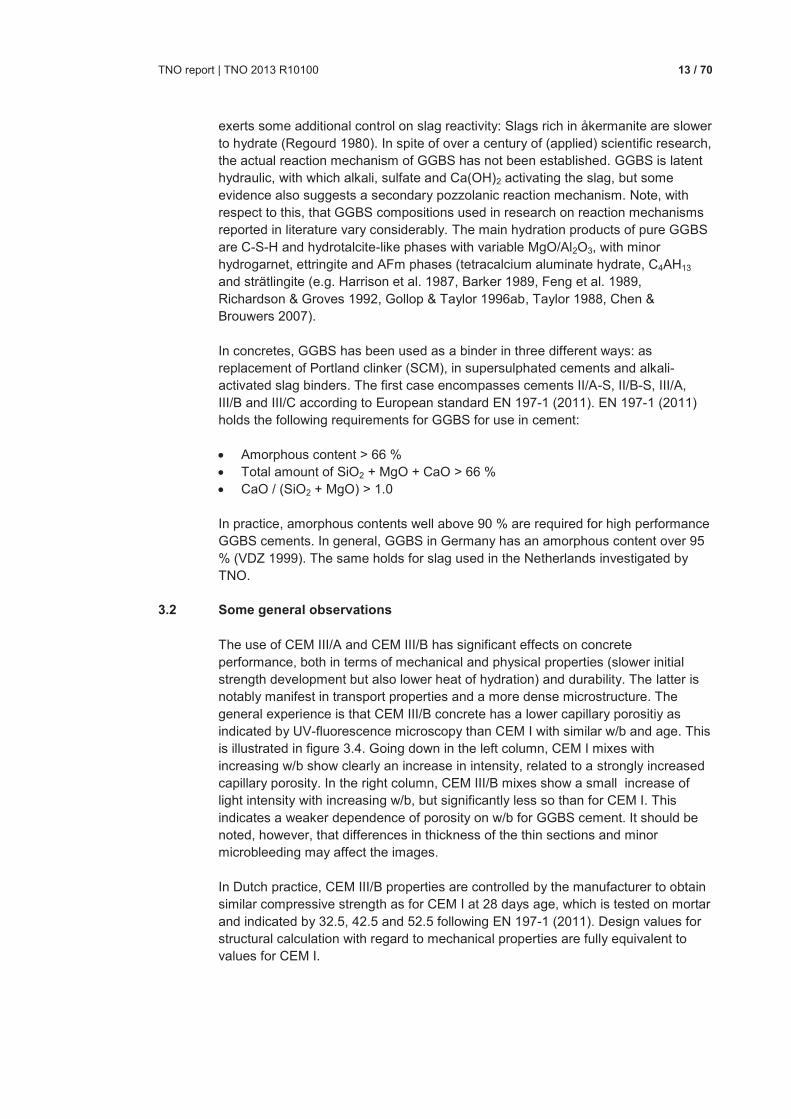
The use of CEM III/A and CEM III/B has significant effects on concrete performance, both in terms of mechanical and physical properties (slower initial strength development but also lower heat of hydration) and durability. The latter is notably manifest in transport properties and a more dense microstructure. The general experience is that CEM III/B concrete has a lower capillary porositiy as indicated by UV-fluorescence microscopy than CEM I with similar w/b and age. This is illustrated in figure 3.4. Going down in the left column, CEM I mixes with increasing w/b show clearly an increase in intensity, related to a strongly increased capillary porosity. In the right column, CEM III/B mixes show a small increase of light intensity with increasing w/b, but significantly less so than for CEM I. This indicates a weaker dependence of porosity on w/b for GGBS cement. It should be noted, however, that differences in thickness of the thin sections and minor microbleeding may affect the images. In Dutch practice, CEM III/B properties are controlled by the manufacturer to obtain similar compressive strength as for CEM I at 28 days age, which is tested on mortar and indicated by 32.5, 42.5 and 52.5 following EN 197-1 (2011). Design values for structural calculation with regard to mechanical properties are fully equivalent to values for CEM I.
TNO report | TNO 2013 R10100 14 / 70
Fig. 3.4. UV-fluorescence microphotographs illustrating the different relationship of
the water/binder ratio with capillary porosity for CEM I 42.5 (left column) and CEM III/B 42.5 N (right column) at 28 days, with w/b increasing from 0.4 at the top via 0.5 in the middle to 0.6 at the bottom.
CEM III/B shows good resistance to sulphate attack (Bakker 1983). Prior to the incorporation of CEM III/B as sulphate resistant cement in European standard EN 197-1 (2011), the use of CEM III/B in exposure classes XA2 and XA3 was already common practice in the Netherlands and specified in the previous version of the Dutch cement standard NEN 3550 (1995, 2006), with the alternative of low C3A CEM I.
TNO report | TNO 2013 R10100 15 / 70
3.3 Pore solution chemistry
The pore solution in CEM III/B concrete is highly alkaline. Literature data on pore solution expression experiments from various sources have been collected in Table 3.1. Table 3.2 reports data on mortar (Polder 1986). Although the precision of the latter experiments may not be as good as for some of those reported in Table 3.1, they form a consistent set of data with all experiments carried out in the same way. Thus this data set allows a good comparison between pore solution in CEM I, 'classical' Dutch CEM III/B (and early Dutch CEM II/B-V) mortar compositions. Chemical compositions of the cements are given in table 3.3. From the data, it can be seen that CEM III/B pore solution has a lower hydroxyl concentration than CEM I and CEM II/B-V mortars, but the pH is over 13 (possibly after one day). The difference may be due to alkali binding in the slag hydration products or simply due to a lower alkali content of the cement. In any case, the pH is high enough to keep Ca(OH)2 precipitated and to protect embedded reinforcing steel. The same holds true for the CEM II/B-V. Table 3.1. Ionic concentration measured in the pore solution extracted from cement
pastes, mortars and concrete made with ordinary Portland cement (OPC) and with additions of blast furnace slag (GGBS). No chloride added. Ca, Cl, SO4 are all very minor components; n.a. = concentration not available. After Bertolini et al. (2004)
Cement w/b Age Sample OH Na K Reference days mmol l-1 OPC 0.45 28 paste 470 130 380 Larbi et al. 1990 OPC 0.5 28 paste 834 271 629 Page & Vennesland 1983 OPC 0.5 192 mortar 251 38 241 Bürchler et al. 1996 OPC1 0.5 84 paste 589 n.a. n.a. Holden 1983 OPC2 0.5 84 paste 479 n.a. n.a. Holden 1983 65% GGBS 0.5 84 paste 355 n.a. n.a. Holden 1983 70% GGBS <0.55 8 yrs concrete 95 89 42 Polder et al. 1995 1 Low C3A content (7.7%). 2 High C3A content (14.3%).
TNO report | TNO 2013 R10100 16 / 70
Table 3.2. Ionic concentration measured in the pore solution extracted from 1:3 cement: sand mortars made with w/b 0.50 and four cement types, between one and 56 days of age; n.d. = not determined; no chloride added. From Polder (1986)
Age Ca Na K OH SO4 Cl pH days mmol l-1 calc
CEM I 32.5 R
1 < 1 38 164 178 43 17 13.25 2 5 173 167 275 0.6 2 13.44 7 10 2541 701 269 < 0.3 24 13.43
28 < 1 90 288 3912 < 0.3 3 13.592 56 n.d. n.d. n.d. n.d. n.d. n.d. n.d.
CEM III/B
1 < 1 50 46 96 13 16 12.98 2 < 1 192 68 148 5 7 13.17 7 < 1 66 64 118 23 8 13.07
28 < 1 61 66 170 15 8 13.23 56 < 1 107 74 135 24 10 13.13
CEM II/B-V
1 13 41 138 155 22 4 13.19 2 7 51 179 257 7 8 13.41 7 < 1 81 225 331 20 2 13.52
28 < 1 75 259 331 18 < 1 13.52 56 < 1 82 155 324 24 < 1 13.51
CEM I SR
1 < 1 32 380 204 31 1 13.31 2 < 1 38 360 275 21 < 1 13.44 7 < 1 41 390 288 33 1 13.46
28 < 1 150 210 347 22 2 13.54 56 n.d. n.d. n.d. n.d. n.d. n.d. n.d.
1 Na and K values have possibly been interchanged. 2 The originally reported value of 891 is possibly a type error and should probably be 391; pH is corrected to the latter value. Table 3.3. Chemical analyses of four cements used in pore solution experiments
reported in table 3.2. From Polder (1986) Cement
CaO Na2O K2O SO3
wt.%
CEM I 32.5 R
63.8 0.28 0.95 3.20 CEM III/B 72-80 % slag 45.0 0.44 0.63 2.63 CEM II/B-V c. 25 % PFA 50.6 0.14 0.49 2.88 CEM I SR Sulfadur1 65.1 0.10 0.48 2.92
1 Very low C3A content (<1%?).
3.4 Water absorption
Water absorption of concrete made with CEM I and CEM III/B was tested in several studies aimed at establishing the effects of hydrophobic treatment. Results reported here focus on non-hydrophobized control specimens at about 17 weeks of age (Polder 1998, Polder et al. 2001).
TNO report | TNO 2013 R10100 17 / 70
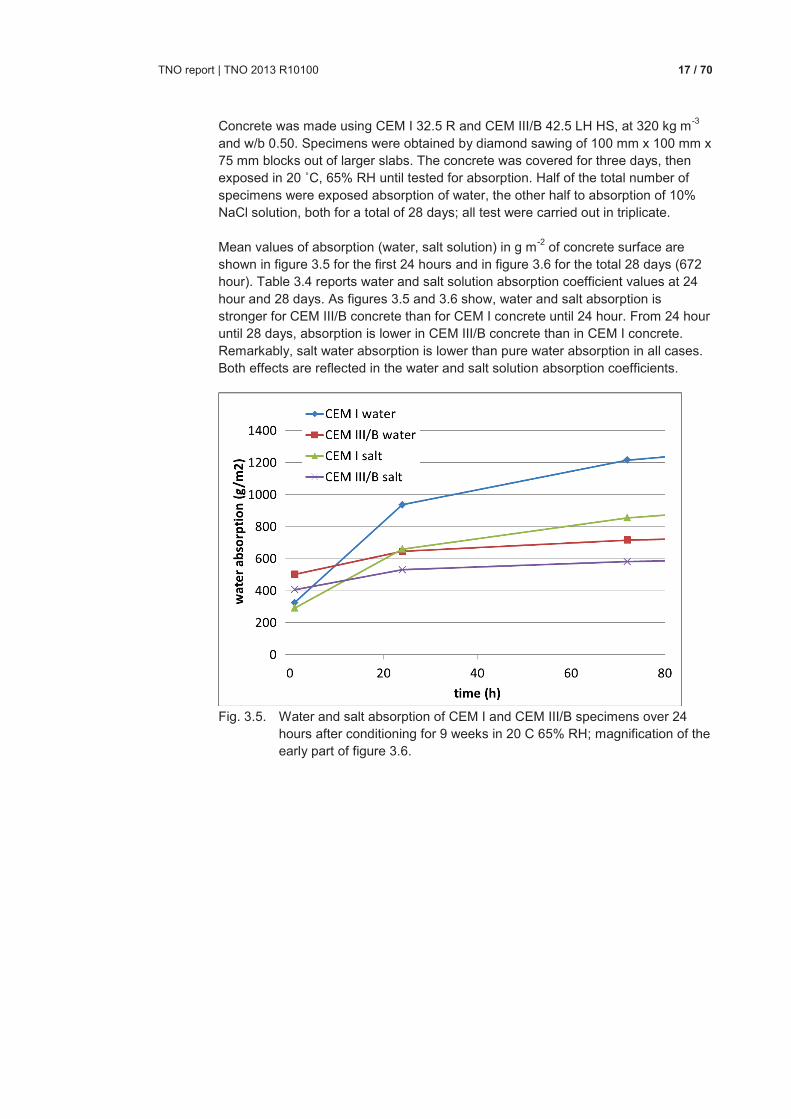
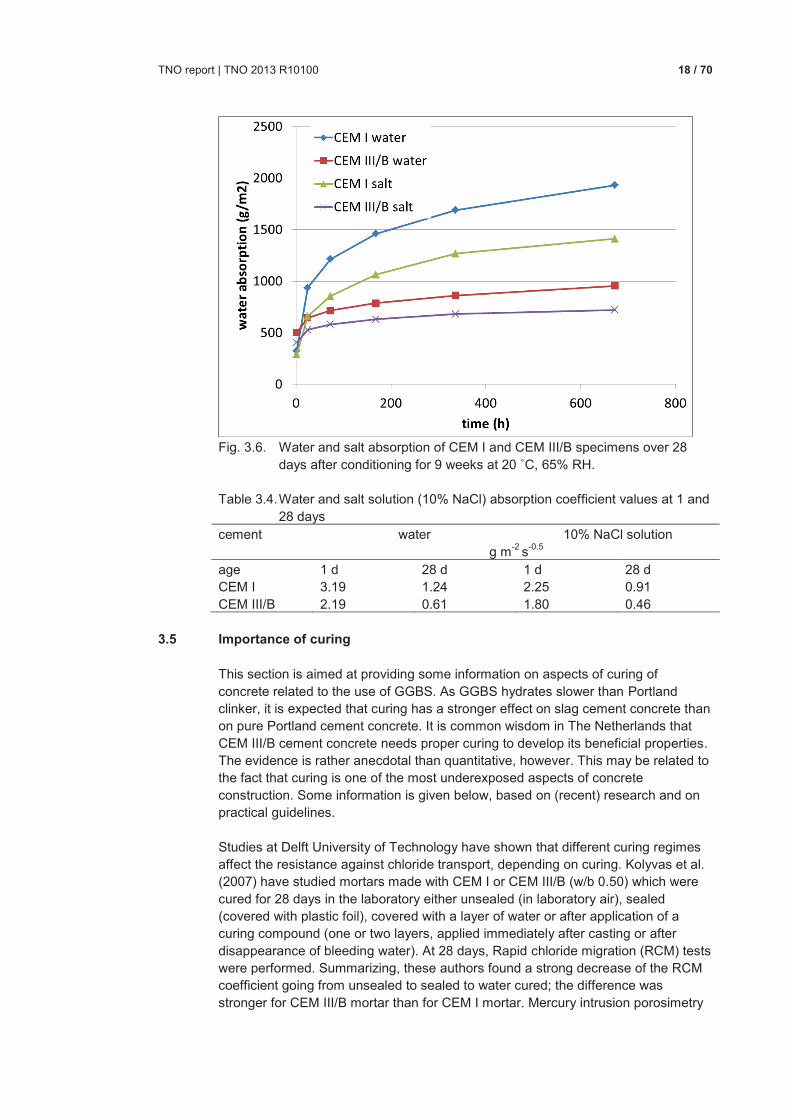
Concrete was made using CEM I 32.5 R and CEM III/B 42.5 LH HS, at 320 kg m-3 and w/b 0.50. Specimens were obtained by diamond sawing of 100 mm x 100 mm x 75 mm blocks out of larger slabs. The concrete was covered for three days, then exposed in 20 ˚C, 65% RH until tested for absorption. Half of the total number of specimens were exposed absorption of water, the other half to absorption of 10% NaCl solution, both for a total of 28 days; all test were carried out in triplicate. Mean values of absorption (water, salt solution) in g m-2 of concrete surface are shown in figure 3.5 for the first 24 hours and in figure 3.6 for the total 28 days (672 hour). Table 3.4 reports water and salt solution absorption coefficient values at 24 hour and 28 days. As figures 3.5 and 3.6 show, water and salt absorption is stronger for CEM III/B concrete than for CEM I concrete until 24 hour. From 24 hour until 28 days, absorption is lower in CEM III/B concrete than in CEM I concrete. Remarkably, salt water absorption is lower than pure water absorption in all cases. Both effects are reflected in the water and salt solution absorption coefficients.
Fig. 3.5. Water and salt absorption of CEM I and CEM III/B specimens over 24
hours after conditioning for 9 weeks in 20 C 65% RH; magnification of the early part of figure 3.6.
TNO report | TNO 2013 R10100 18 / 70
Fig. 3.6. Water and salt absorption of CEM I and CEM III/B specimens over 28
days after conditioning for 9 weeks at 20 ˚C, 65% RH. Table 3.4. Water and salt solution (10% NaCl) absorption coefficient values at 1 and
28 days
cement water 10% NaCl solution g m-2 s-0.5
age 1 d 28 d 1 d 28 d CEM I 3.19 1.24 2.25 0.91 CEM III/B 2.19 0.61 1.80 0.46
3.5 Importance of curing
This section is aimed at providing some information on aspects of curing of concrete related to the use of GGBS. As GGBS hydrates slower than Portland clinker, it is expected that curing has a stronger effect on slag cement concrete than on pure Portland cement concrete. It is common wisdom in The Netherlands that CEM III/B cement concrete needs proper curing to develop its beneficial properties. The evidence is rather anecdotal than quantitative, however. This may be related to the fact that curing is one of the most underexposed aspects of concrete construction. Some information is given below, based on (recent) research and on practical guidelines. Studies at Delft University of Technology have shown that different curing regimes affect the resistance against chloride transport, depending on curing. Kolyvas et al. (2007) have studied mortars made with CEM I or CEM III/B (w/b 0.50) which were cured for 28 days in the laboratory either unsealed (in laboratory air), sealed (covered with plastic foil), covered with a layer of water or after application of a curing compound (one or two layers, applied immediately after casting or after disappearance of bleeding water). At 28 days, Rapid chloride migration (RCM) tests were performed. Summarizing, these authors found a strong decrease of the RCM coefficient going from unsealed to sealed to water cured; the difference was stronger for CEM III/B mortar than for CEM I mortar. Mercury intrusion porosimetry
TNO report | TNO 2013 R10100 19 / 70
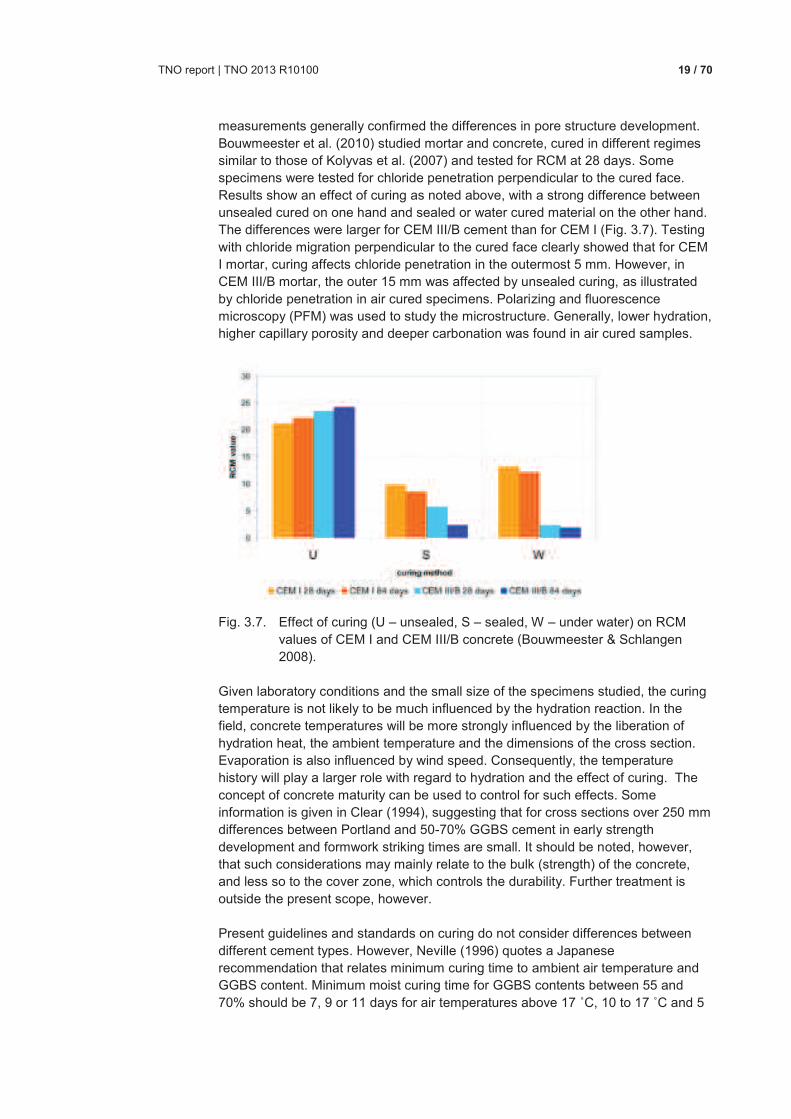
measurements generally confirmed the differences in pore structure development. Bouwmeester et al. (2010) studied mortar and concrete, cured in different regimes similar to those of Kolyvas et al. (2007) and tested for RCM at 28 days. Some specimens were tested for chloride penetration perpendicular to the cured face. Results show an effect of curing as noted above, with a strong difference between unsealed cured on one hand and sealed or water cured material on the other hand. The differences were larger for CEM III/B cement than for CEM I (Fig. 3.7). Testing with chloride migration perpendicular to the cured face clearly showed that for CEM I mortar, curing affects chloride penetration in the outermost 5 mm. However, in CEM III/B mortar, the outer 15 mm was affected by unsealed curing, as illustrated by chloride penetration in air cured specimens. Polarizing and fluorescence microscopy (PFM) was used to study the microstructure. Generally, lower hydration, higher capillary porosity and deeper carbonation was found in air cured samples.
Fig. 3.7. Effect of curing (U – unsealed, S – sealed, W – under water) on RCM
values of CEM I and CEM III/B concrete (Bouwmeester & Schlangen 2008).
Given laboratory conditions and the small size of the specimens studied, the curing temperature is not likely to be much influenced by the hydration reaction. In the field, concrete temperatures will be more strongly influenced by the liberation of hydration heat, the ambient temperature and the dimensions of the cross section. Evaporation is also influenced by wind speed. Consequently, the temperature history will play a larger role with regard to hydration and the effect of curing. The concept of concrete maturity can be used to control for such effects. Some information is given in Clear (1994), suggesting that for cross sections over 250 mm differences between Portland and 50-70% GGBS cement in early strength development and formwork striking times are small. It should be noted, however, that such considerations may mainly relate to the bulk (strength) of the concrete, and less so to the cover zone, which controls the durability. Further treatment is outside the present scope, however. Present guidelines and standards on curing do not consider differences between different cement types. However, Neville (1996) quotes a Japanese recommendation that relates minimum curing time to ambient air temperature and GGBS content. Minimum moist curing time for GGBS contents between 55 and 70% should be 7, 9 or 11 days for air temperatures above 17 ˚C, 10 to 17 ˚C and 5
TNO report | TNO 2013 R10100 20 / 70
to 10 ˚C, respectively. European Standard EN 13670 (2009) specifies four curing classes, with minimum curing periods for three of them, depending on the surface concrete temperature and the rate of concrete strength development. The Dutch Ministry of Infrastructure's Guideline for Design of Civil Engineering Works (ROK 2013) states that top surfaces of bridge decks shall be cured according to class 4, other surfaces to class 3. According to § 8.5 of EN 13670 (2009), curing shall be applied as a function of the development of properties in the surface zone. In curing class 3, curing must be applied until 50% of the specified characteristic 28 day strength is obtained; in class 4 this is 70% of the strength. In Annex F of the standard, this is further detailed according to the rate of strength development and the surface temperature. The rate of strength development is defined by the ratio of the 2 day strength to the 28 day strength. For slow strength development, minimum curing periods may vary between 3.5 and 18 days (class 3) or between 6 and 30 days (class 4) for temperatures ranging from above 25 ˚C down to 5 ˚C. It appears that using 2 day and 28 day strength testing, a rather refined set of curing specifics can be obtained. Again, further treatment is outside the present scope.
TNO report | TNO 2013 R10100 21 / 70
4 Chloride penetration and corrosion
4.1 General
A lot of independent research has been devoted to ground granulated blast furnace slag cement in concrete and its durability over the last 40 years, both in the field and in the laboratory. The current chapter focusses on research in The Netherlands into the performance of GGBS cement (in particular CEM III/B) concrete with respect to chloride penetration and related corrosion properties. This is not intended to play down the importance of pioneering work elsewhere in the laboratory (e.g. Page et al. 1981) and studies based on field exposure (Bamforth 1994, 1997, Bamforth & Chapman-Andrews 1994).
4.2 Research on structures and field exposure
In the 1970s, durability was investigated of a large number of structures in marine environment (Wiebenga 1980, CUR 1981). CEM III/B cement concrete appeared to perform very well, with hardly any visible corrosion in about 50 structures up to 63 years of age. Carbonation was found to be 5 mm or less in the large majority. Five structures were cored and chloride profiles determined. Chloride diffusion coefficients were found to be lower for CEM III/B cement than for CEM I, by a factor of 10 to 16 (Bijen 1996). Exposure for 16 years of concrete prisms submerged in the North Sea showed that CEM III/B had much lower chloride penetration than CEM I concrete (Polder & Larbi 1995). Results from chloride profile analysis and electrical resistivities are reported in Table 4.1. Table 4.1. Chloride diffusion coefficients and surface contents from profile fitting to
prisms submerged for 16 years in the North Sea (Polder & Larbi 1995).
Cement I III/B Note DCl 1012 m2 s-1 1-3 0.3 CEM I: depending
on w/b, curing and age at start of exposure
Cs % by mass of cement 3.5-5 2.5-5 depending on curing and age at start of exposure
Resistivity Ω m 120-155 400-1000 depending on curing and age at start of exposure; CEM I depending on w/b
An overview of durability with slag cement was published including examples of this cement in structures in the Middle East, underpinning its durability (Bijen 1996). In depth investigation in the early 2000s of six marine structures of up to 40 years age showed that chloride penetration was consistently slow in CEM III/B structures (Polder & De Rooij 2005). An overview of results from chloride penetration profile
TNO report | TNO 2013 R10100 22 / 70
obtained by fitting the error function solution of Fick’s second law of diffusion is
given in table 4.2. When comparing the performance of two types of CEM I concrete to the CEM III/B concretes given in table 4.2, the following should be noted: The precast elements (slabs and beams) made with CEM I had been made with very high quality concrete, expressed by very high strengths, most probably by using (for then and The Netherlands) very low w/b values. The in situ cast CEM III/B deck concrete in the same structure, on the other hand, was probably made using much lower quality concrete and/or attention on site (e.g. curing). This may explain why the CEM III/B concrete has a higher diffusion value than both CEM I concretes, which is unexpected. With regard to the barrier and harbour quay structures, the following is noted: The ESSB Barrier (Eastern Scheldt Storm Surge Barrier) was made with the highest possible quality of materials and attention during production. The three harbour quays, all in Rotterdam harbour, on the other hand, were designed and built more or less as routine projects, without any special attention for durability. Table 4.2. Overview of chloride penetration results from six marine structures
(Polder & De Rooij 2005)
Structure Age DCl Cs Note Year 1012 m2 s-1 wt.%1
Pier slab 40 0.14-0.19 3.5 CEM I, low w/b; higher splash/ atmospheric zone, sheltered from rain
Pier beam 40 0.28 2.6 CEM I, very low w/b (c. 0.40), compressive strength 120 MPa; higher splash/ atmospheric zone, sheltered from rain
Pier deck 40 0.33 3.2 CEM III/B, higher splash zone, sheltered from rain
Barrier Haringvliet 40 0.12 2.8 CEM III/B; lower splash zone (+ 1 m)
Barrier ESSB 20 0.24 2.2-5 CEM III/B; Cs depends on height above sea level (+1 m …. + 9 m)
3 Harbour quays 20-33 0.12-0.19 3-4 CEM III/B lower splash zone 1 Cs in wt.% relative to cement.
4.3 Laboratory studies
In the laboratory, various durability and corrosion related properties of GGBS cement concrete have been investigated since the 1980s, including electrical resistivity (Polder & Ketelaars 1991) and its relationship to chloride transport (Polder 1995), corrosion rates with mixed in chloride (Fiore et al. 1996) or penetrated chloride (Polder & Peelen 2002); see also Bertolini et al. (2004), Bertolini & Polder (1997). More recently, data on chloride transport parameters have been analysed for use in service life prediction.
TNO report | TNO 2013 R10100 23 / 70
4.3.1 Resistivity study
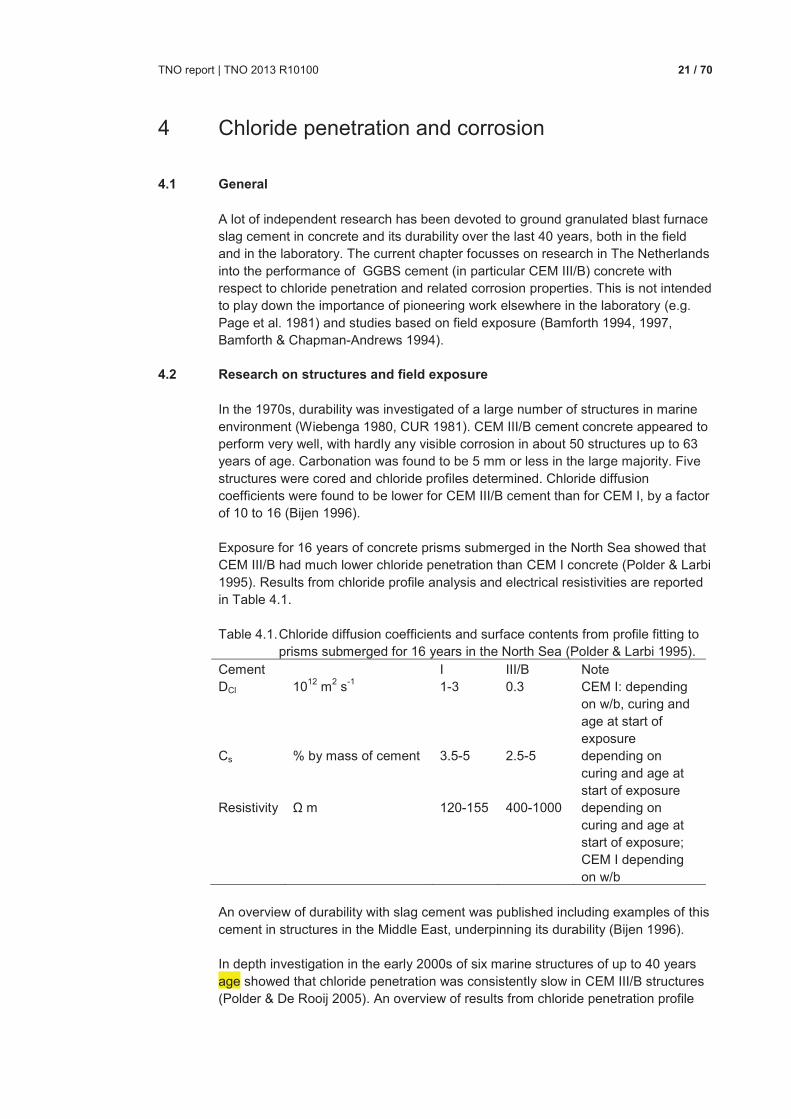
In 1989, a set of concrete specimens was cast in order to investigate the effect of cement type, water-to-cement ratio and external humidity on the resistivity of concrete. The experimental arrangement used by (Tritthart & Geymayer 1985) was slightly modified. Therefore, 30 cubes (150 mm) were made with four pairs of embedded brass electrodes with a diameter of 6 mm at a centre-to-centre distance of 50 mm parallel to the casting direction. Each pair of electrodes was embedded vertically at different depths (10 mm, 15 mm, 20 mm and 50 mm) such that a study of moisture changes at four depths would be possible (Fig. 4.1). Cell constants (ratio of resistivity and measured resistance, with dimension length, unit m) were determined from resistance measurements using electrodes in a similar arrangement placed in solutions of known conductivity. Cell constants had typical values of about 0.1 m.
Fig. 4.1. Electrode setup of two brass electrodes for each of the four cover depths
in a cube specimen. The concrete compositions used for casting the specimens were based on three w/b ratios, 0.45, 0.55 and 0.65 (with an approx. constant cement content of 320 kg m-3) and two cement types. The cement types used were ordinary Portland cement, corresponding to a modern CEM I 32.5 R and blast furnace slag cement with 70 % of slag content, which corresponds to a modern CEM III/B 42.5 LH HS. The aggregates were (rounded) siliceous river sand and gravel with a maximum size of 16 mm. After casting and demoulding at one day age, cubes were stored in a fog room at 20 °C until 28 days age. Sets of six cubes (one cube for each composition) were then distributed over various climate rooms: 20 °C, 50 %RH; 20 °C, 65 %RH; 20 °C, 80 %RH; 20 °C, 90 %RH (these were transferred to a fog room at > 95 %RH and 20 °C at age 200 days). One set was stored in two plastic containers filled with tap water in the laboratory at 20 °C, one container for CEM III/B specimens and one for CEM I specimens. The containers with these specimens were transferred to outside/unsheltered exposure at an age of about 7.5 years. From this moment on, the water level in the containers was not checked carefully; in some periods the level may have been low and the cubes may have dried out slightly. Related to moving the laboratory from Rijswijk to Delft in 2003/2004, specimens were stored
cove
r=
50
mm
cover = 10 mm
cove
r=
15
mm
cover = 20 mm
pairs ofbrass
electrodes
L = 50 mm
150
mm
150 mm
TNO report | TNO 2013 R10100 24 / 70
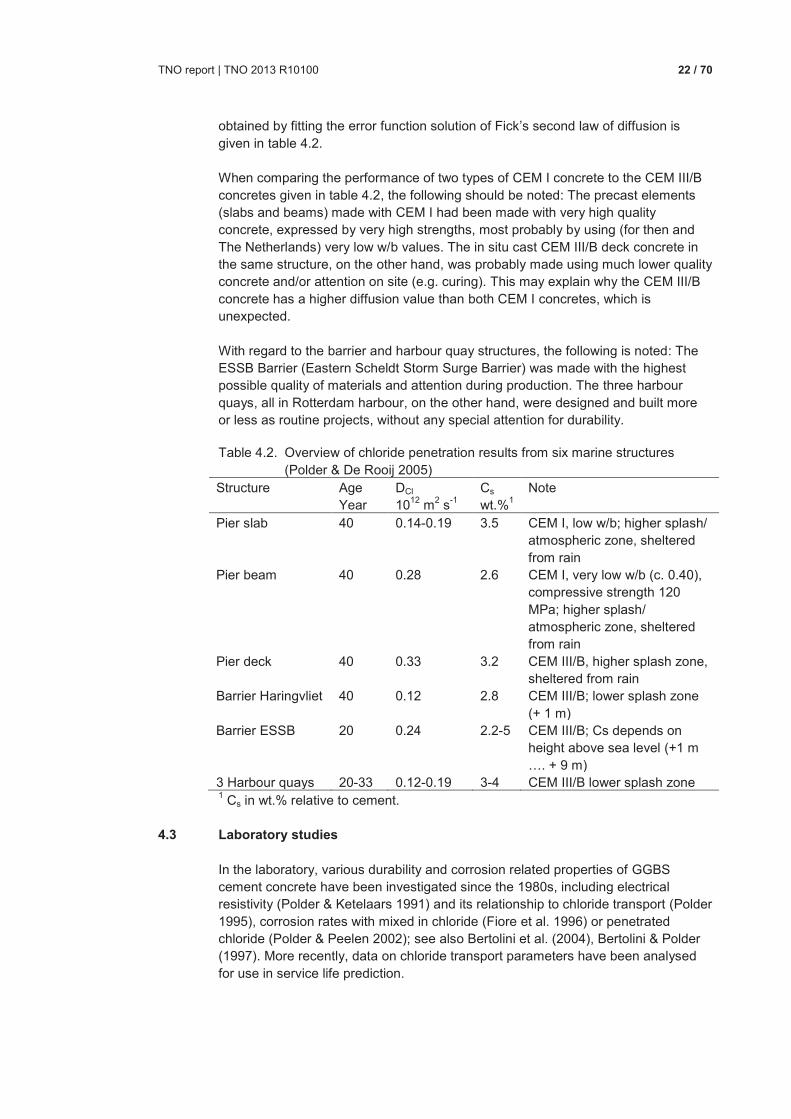
inside for several months and some specimens were lost (mainly those from 50 and 65 %RH). Finally, since mid-2004, the remaining specimens are exposed unsheltered on the roof of the TNO laboratory at Delft, The Netherlands. These are three cubes of each cement type and w/b-ratio which were previously stored in three different climates (submerged/outside; fog room; 80 %RH). Figure 4.2 shows the history of the specimens in terms of their storage conditions.
Fig. 4.2. Overview of curing and storage of specimens.
In April 2006, all cubes were measured on the same day at an age of 6,177 days (≈ 17 years). The temperature during measurements was approximately 10 °C and the weather condition was dry; no wet surfaces of the cubes due to rain were observed. The complete data set can be found in Osterminski et al. (2012). Results up to two years were reported in Polder & Ketelaars (1991). Summarizing: at age 28 days, Portland cement concrete delivered resistivity values which were three times lower than those of slag cement concrete. Coefficients of variation for six specimens of the same composition (measured with four electrode pairs) were about 5 to 10 %.
Over the subsequent years, resistivities increased with time. At 670 days, values varied widely, depending on cement type, external humidity and the depth of the electrodes. For submerged specimens, Portland cement concrete had lower values than slag cement concrete of the same w/b-ratios. These values were considerably higher in semi-dry climate (80 %RH) for each cement type, with yet higher values for electrodes near the surface and lower values at 50 mm depth. Drying out was clearly shown for cubes in 65 % and 50 %RH, with much higher resistivity values at 10 and 15 mm depth than at 50 mm depth. The difference is more than a factor two. For a more detailed picture of resistivity as a function of composition, depth and climate at 670 days, see Osterminski et al. (2012). For the results up to 17 years, two cross sections will be reported here; the resistivity of a single composition with slag cement as a function of depth in a semi-dry climate; and resistivity for two compositions in three sets of exposure conditions, using electrodes at one depth. The development of the resistivity of a CEM III/B specimen with w/b 0.45 in 20 °C, 80 %RH for the four investigated cover depths is shown in figure 4.3 Figure 4.4 shows the results of the resistivity for all 0.45 specimens, in dependence of time,
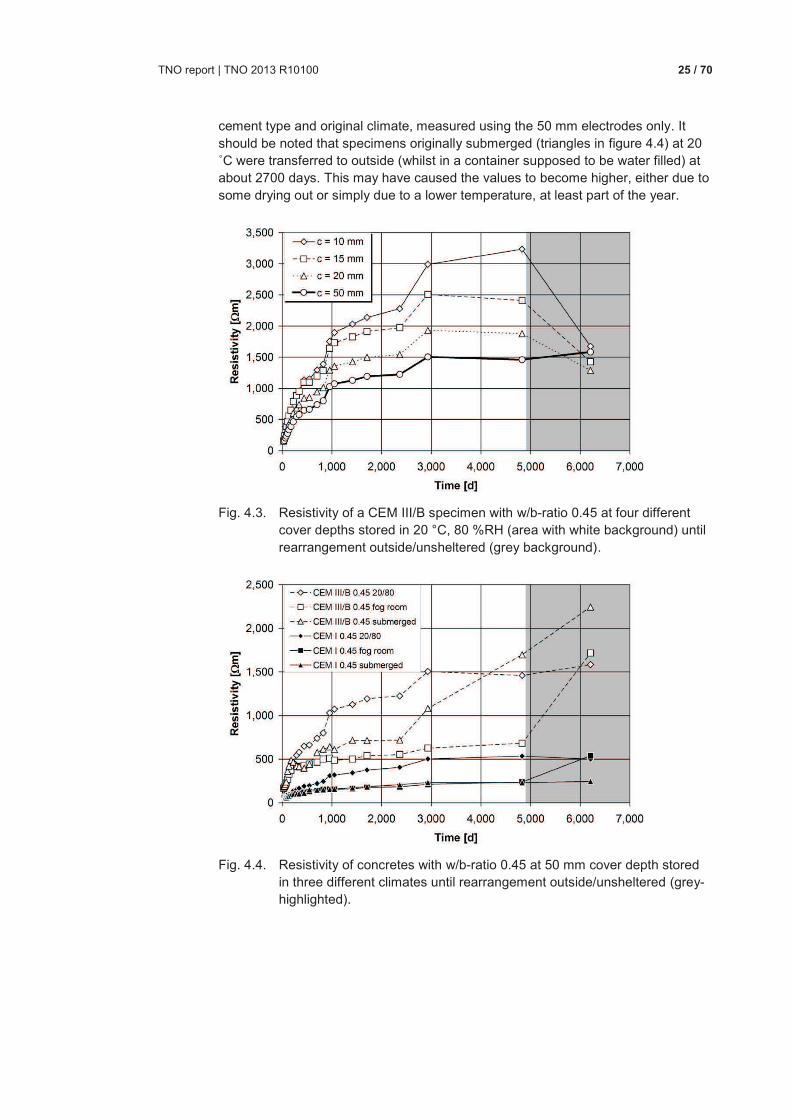
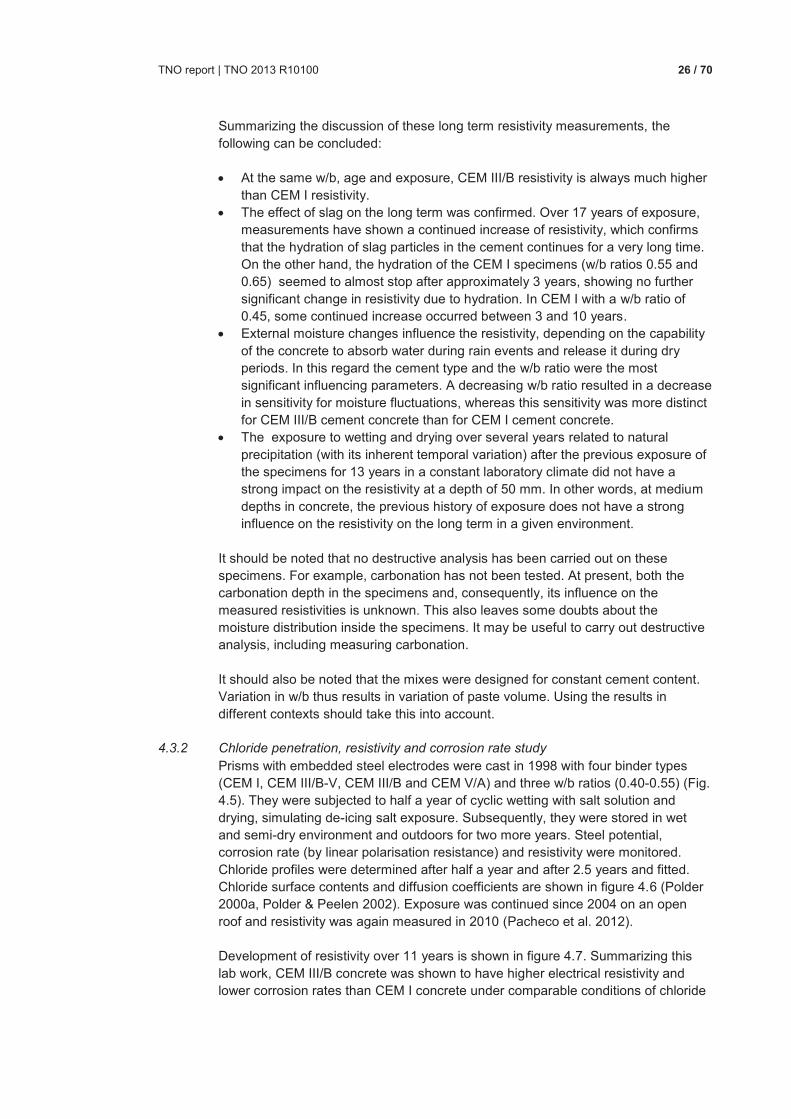
TNO report | TNO 2013 R10100 25 / 70
cement type and original climate, measured using the 50 mm electrodes only. It should be noted that specimens originally submerged (triangles in figure 4.4) at 20 ˚C were transferred to outside (whilst in a container supposed to be water filled) at about 2700 days. This may have caused the values to become higher, either due to some drying out or simply due to a lower temperature, at least part of the year.
Fig. 4.3. Resistivity of a CEM III/B specimen with w/b-ratio 0.45 at four different
cover depths stored in 20 °C, 80 %RH (area with white background) until rearrangement outside/unsheltered (grey background).
Fig. 4.4. Resistivity of concretes with w/b-ratio 0.45 at 50 mm cover depth stored
in three different climates until rearrangement outside/unsheltered (grey-highlighted).
TNO report | TNO 2013 R10100 26 / 70
Summarizing the discussion of these long term resistivity measurements, the following can be concluded: · At the same w/b, age and exposure, CEM III/B resistivity is always much higher
than CEM I resistivity. · The effect of slag on the long term was confirmed. Over 17 years of exposure,
measurements have shown a continued increase of resistivity, which confirms that the hydration of slag particles in the cement continues for a very long time. On the other hand, the hydration of the CEM I specimens (w/b ratios 0.55 and 0.65) seemed to almost stop after approximately 3 years, showing no further significant change in resistivity due to hydration. In CEM I with a w/b ratio of 0.45, some continued increase occurred between 3 and 10 years.
· External moisture changes influence the resistivity, depending on the capability of the concrete to absorb water during rain events and release it during dry periods. In this regard the cement type and the w/b ratio were the most significant influencing parameters. A decreasing w/b ratio resulted in a decrease in sensitivity for moisture fluctuations, whereas this sensitivity was more distinct for CEM III/B cement concrete than for CEM I cement concrete.
· The exposure to wetting and drying over several years related to natural precipitation (with its inherent temporal variation) after the previous exposure of the specimens for 13 years in a constant laboratory climate did not have a strong impact on the resistivity at a depth of 50 mm. In other words, at medium depths in concrete, the previous history of exposure does not have a strong influence on the resistivity on the long term in a given environment.
It should be noted that no destructive analysis has been carried out on these specimens. For example, carbonation has not been tested. At present, both the carbonation depth in the specimens and, consequently, its influence on the measured resistivities is unknown. This also leaves some doubts about the moisture distribution inside the specimens. It may be useful to carry out destructive analysis, including measuring carbonation. It should also be noted that the mixes were designed for constant cement content. Variation in w/b thus results in variation of paste volume. Using the results in different contexts should take this into account.
4.3.2 Chloride penetration, resistivity and corrosion rate study
Prisms with embedded steel electrodes were cast in 1998 with four binder types (CEM I, CEM III/B-V, CEM III/B and CEM V/A) and three w/b ratios (0.40-0.55) (Fig. 4.5). They were subjected to half a year of cyclic wetting with salt solution and drying, simulating de-icing salt exposure. Subsequently, they were stored in wet and semi-dry environment and outdoors for two more years. Steel potential, corrosion rate (by linear polarisation resistance) and resistivity were monitored. Chloride profiles were determined after half a year and after 2.5 years and fitted. Chloride surface contents and diffusion coefficients are shown in figure 4.6 (Polder 2000a, Polder & Peelen 2002). Exposure was continued since 2004 on an open roof and resistivity was again measured in 2010 (Pacheco et al. 2012). Development of resistivity over 11 years is shown in figure 4.7. Summarizing this lab work, CEM III/B concrete was shown to have higher electrical resistivity and lower corrosion rates than CEM I concrete under comparable conditions of chloride
TNO report | TNO 2013 R10100 27 / 70
and moisture. The higher electrical resistivity of CEM III/B concrete correlated with lower chloride diffusion coefficients.
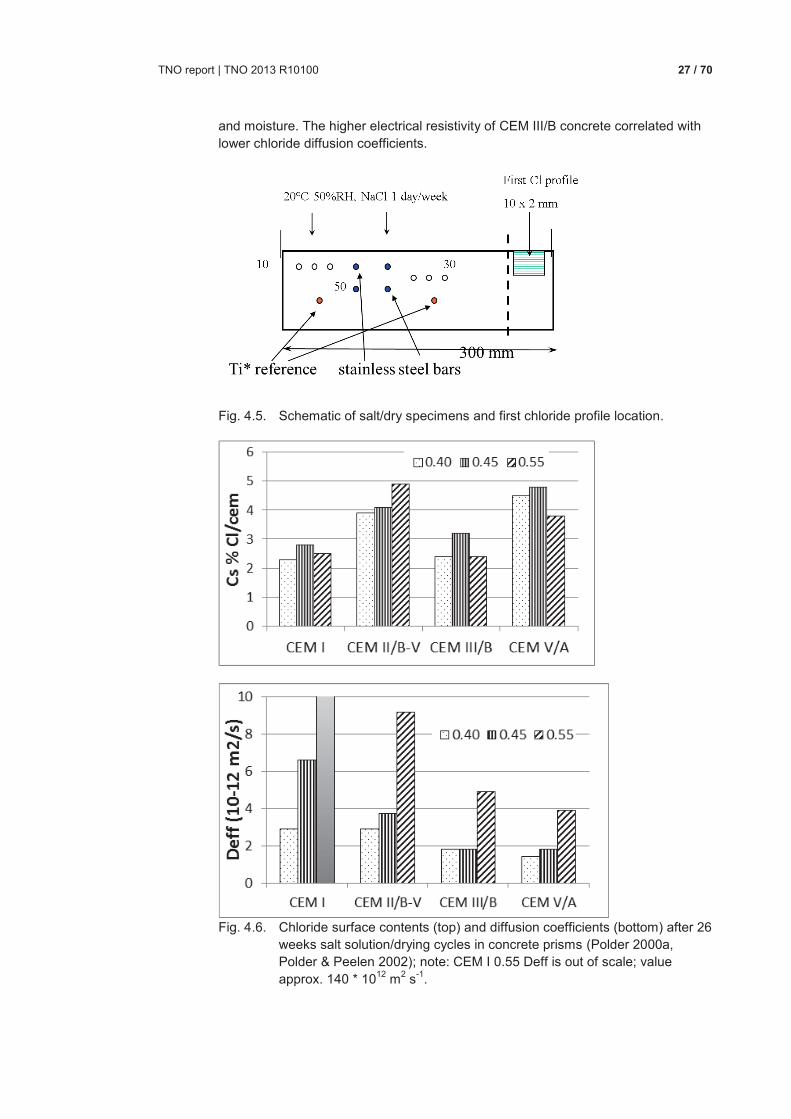
Fig. 4.5. Schematic of salt/dry specimens and first chloride profile location.
Fig. 4.6. Chloride surface contents (top) and diffusion coefficients (bottom) after 26
weeks salt solution/drying cycles in concrete prisms (Polder 2000a, Polder & Peelen 2002); note: CEM I 0.55 Deff is out of scale; value approx. 140 * 1012 m2 s-1.
TNO report | TNO 2013 R10100 28 / 70
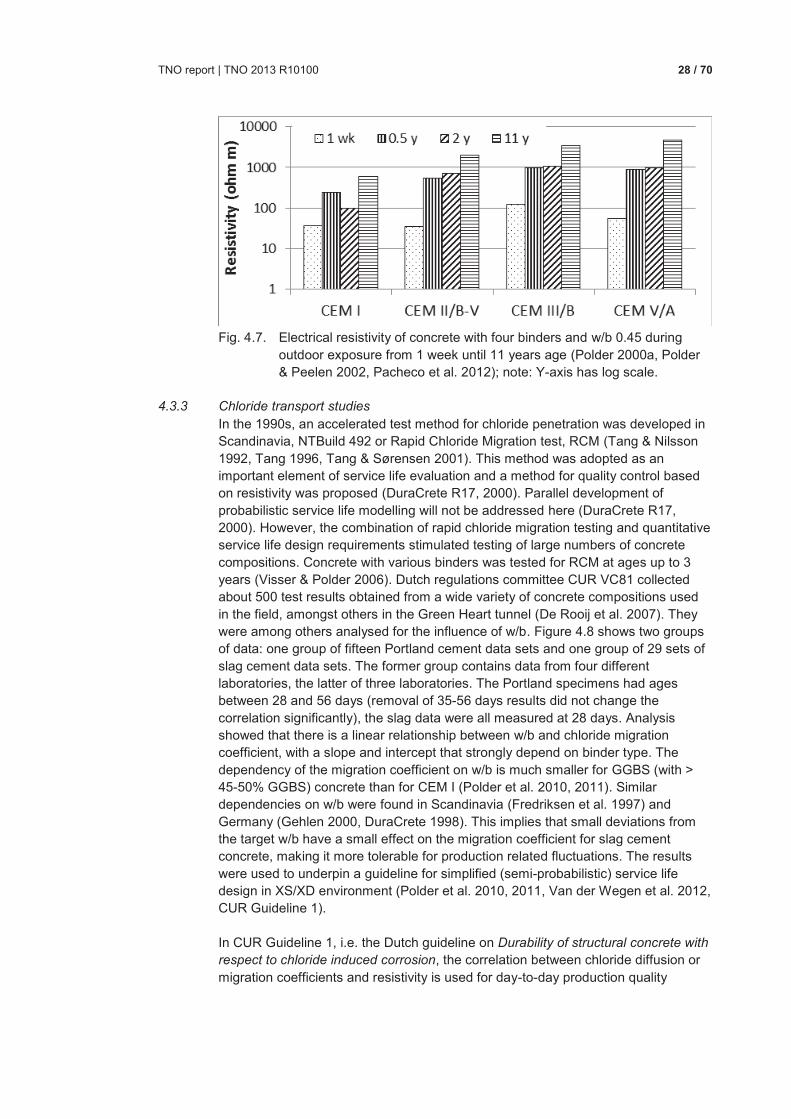
Fig. 4.7. Electrical resistivity of concrete with four binders and w/b 0.45 during
outdoor exposure from 1 week until 11 years age (Polder 2000a, Polder & Peelen 2002, Pacheco et al. 2012); note: Y-axis has log scale.
4.3.3 Chloride transport studies
In the 1990s, an accelerated test method for chloride penetration was developed in Scandinavia, NTBuild 492 or Rapid Chloride Migration test, RCM (Tang & Nilsson 1992, Tang 1996, Tang & Sørensen 2001). This method was adopted as an important element of service life evaluation and a method for quality control based on resistivity was proposed (DuraCrete R17, 2000). Parallel development of probabilistic service life modelling will not be addressed here (DuraCrete R17, 2000). However, the combination of rapid chloride migration testing and quantitative service life design requirements stimulated testing of large numbers of concrete compositions. Concrete with various binders was tested for RCM at ages up to 3 years (Visser & Polder 2006). Dutch regulations committee CUR VC81 collected about 500 test results obtained from a wide variety of concrete compositions used in the field, amongst others in the Green Heart tunnel (De Rooij et al. 2007). They were among others analysed for the influence of w/b. Figure 4.8 shows two groups of data: one group of fifteen Portland cement data sets and one group of 29 sets of slag cement data sets. The former group contains data from four different laboratories, the latter of three laboratories. The Portland specimens had ages between 28 and 56 days (removal of 35-56 days results did not change the correlation significantly), the slag data were all measured at 28 days. Analysis showed that there is a linear relationship between w/b and chloride migration coefficient, with a slope and intercept that strongly depend on binder type. The dependency of the migration coefficient on w/b is much smaller for GGBS (with > 45-50% GGBS) concrete than for CEM I (Polder et al. 2010, 2011). Similar dependencies on w/b were found in Scandinavia (Fredriksen et al. 1997) and Germany (Gehlen 2000, DuraCrete 1998). This implies that small deviations from the target w/b have a small effect on the migration coefficient for slag cement concrete, making it more tolerable for production related fluctuations. The results were used to underpin a guideline for simplified (semi-probabilistic) service life design in XS/XD environment (Polder et al. 2010, 2011, Van der Wegen et al. 2012, CUR Guideline 1). In CUR Guideline 1, i.e. the Dutch guideline on Durability of structural concrete with
respect to chloride induced corrosion, the correlation between chloride diffusion or migration coefficients and resistivity is used for day-to-day production quality
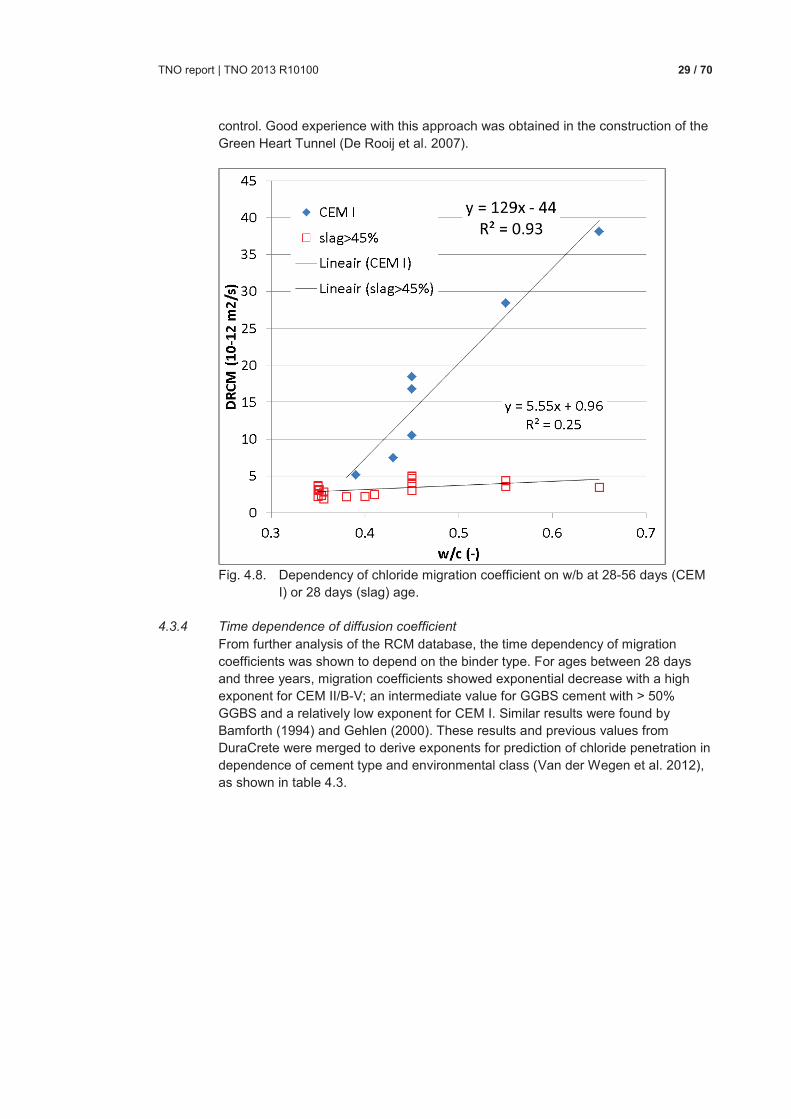
TNO report | TNO 2013 R10100 29 / 70
control. Good experience with this approach was obtained in the construction of the Green Heart Tunnel (De Rooij et al. 2007).
Fig. 4.8. Dependency of chloride migration coefficient on w/b at 28-56 days (CEM
I) or 28 days (slag) age.
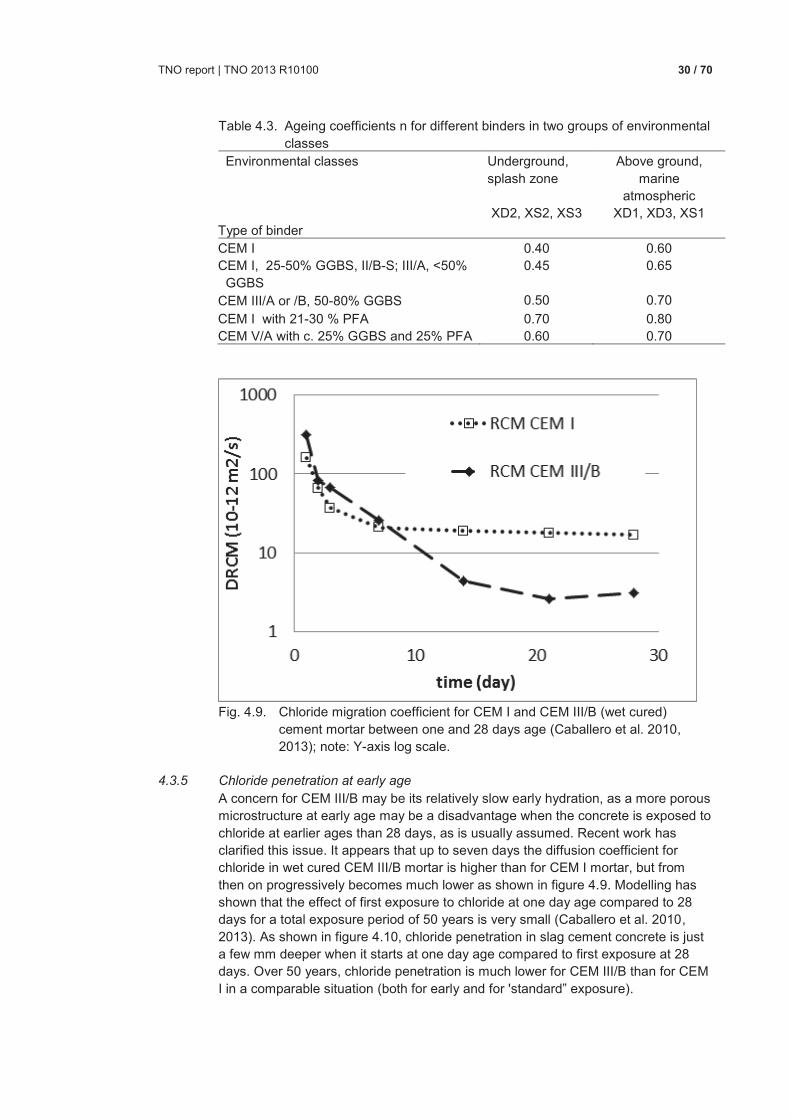
4.3.4 Time dependence of diffusion coefficient
From further analysis of the RCM database, the time dependency of migration coefficients was shown to depend on the binder type. For ages between 28 days and three years, migration coefficients showed exponential decrease with a high exponent for CEM II/B-V; an intermediate value for GGBS cement with > 50% GGBS and a relatively low exponent for CEM I. Similar results were found by Bamforth (1994) and Gehlen (2000). These results and previous values from DuraCrete were merged to derive exponents for prediction of chloride penetration in dependence of cement type and environmental class (Van der Wegen et al. 2012), as shown in table 4.3.
TNO report | TNO 2013 R10100 30 / 70
Table 4.3. Ageing coefficients n for different binders in two groups of environmental classes
Environmental classes
Underground, splash zone
Above ground, marine
atmospheric XD2, XS2, XS3 XD1, XD3, XS1
Type of binder
CEM I 0.40 0.60 CEM I, 25-50% GGBS, II/B-S; III/A, <50%
GGBS 0.45 0.65
CEM III/A or /B, 50-80% GGBS 0.50 0.70
CEM I with 21-30 % PFA 0.70 0.80 CEM V/A with c. 25% GGBS and 25% PFA 0.60 0.70
Fig. 4.9. Chloride migration coefficient for CEM I and CEM III/B (wet cured)
cement mortar between one and 28 days age (Caballero et al. 2010, 2013); note: Y-axis log scale.
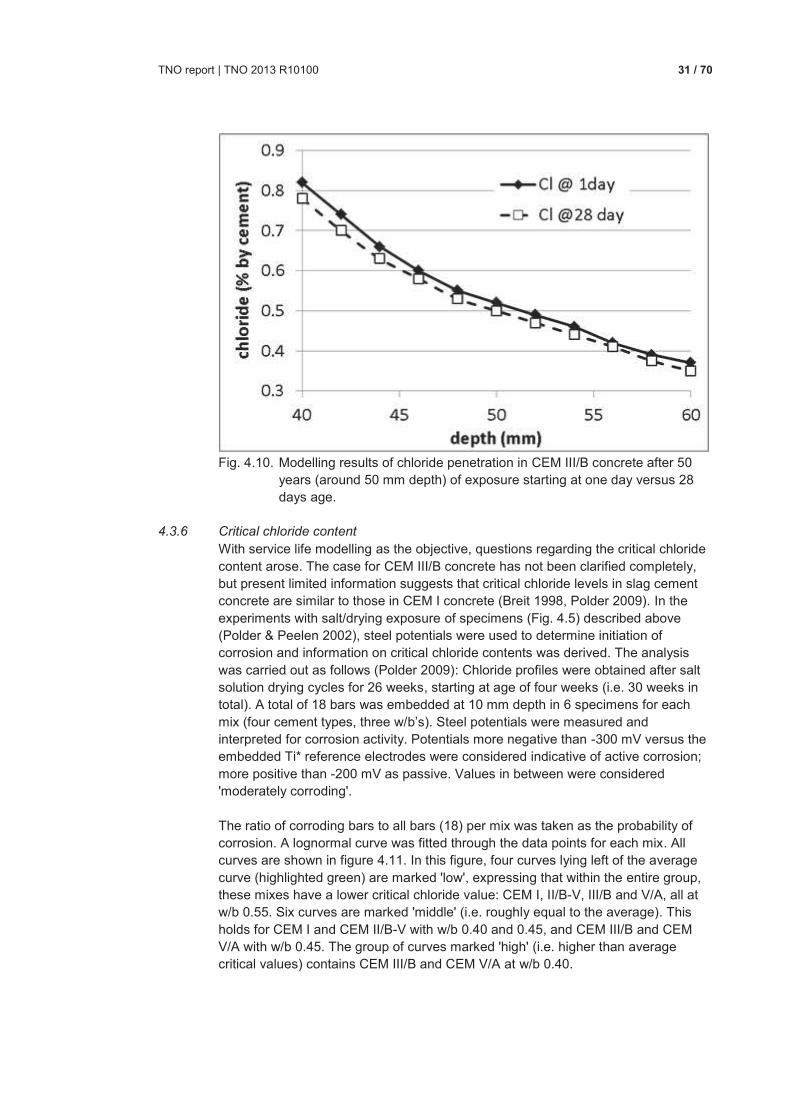
4.3.5 Chloride penetration at early age
A concern for CEM III/B may be its relatively slow early hydration, as a more porous microstructure at early age may be a disadvantage when the concrete is exposed to chloride at earlier ages than 28 days, as is usually assumed. Recent work has clarified this issue. It appears that up to seven days the diffusion coefficient for chloride in wet cured CEM III/B mortar is higher than for CEM I mortar, but from then on progressively becomes much lower as shown in figure 4.9. Modelling has shown that the effect of first exposure to chloride at one day age compared to 28 days for a total exposure period of 50 years is very small (Caballero et al. 2010, 2013). As shown in figure 4.10, chloride penetration in slag cement concrete is just a few mm deeper when it starts at one day age compared to first exposure at 28 days. Over 50 years, chloride penetration is much lower for CEM III/B than for CEM I in a comparable situation (both for early and for 'standard” exposure).
TNO report | TNO 2013 R10100 31 / 70
Fig. 4.10. Modelling results of chloride penetration in CEM III/B concrete after 50
years (around 50 mm depth) of exposure starting at one day versus 28 days age.
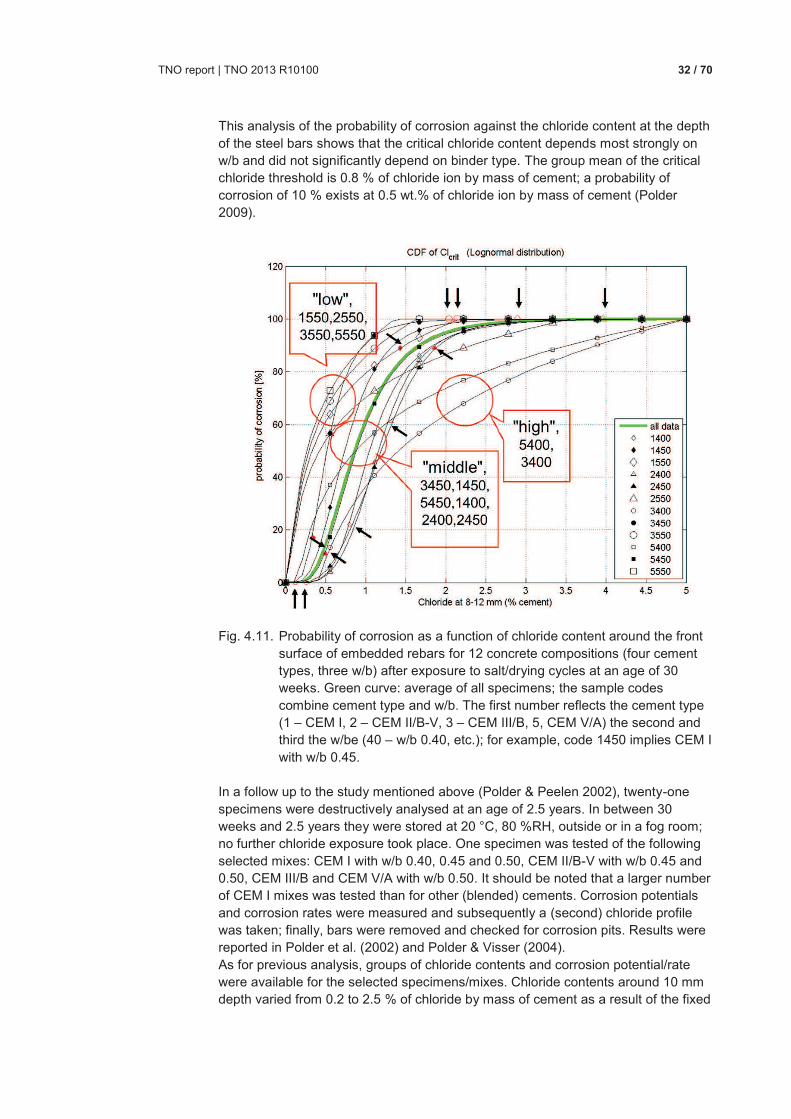
4.3.6 Critical chloride content
With service life modelling as the objective, questions regarding the critical chloride content arose. The case for CEM III/B concrete has not been clarified completely, but present limited information suggests that critical chloride levels in slag cement concrete are similar to those in CEM I concrete (Breit 1998, Polder 2009). In the experiments with salt/drying exposure of specimens (Fig. 4.5) described above (Polder & Peelen 2002), steel potentials were used to determine initiation of corrosion and information on critical chloride contents was derived. The analysis was carried out as follows (Polder 2009): Chloride profiles were obtained after salt solution drying cycles for 26 weeks, starting at age of four weeks (i.e. 30 weeks in total). A total of 18 bars was embedded at 10 mm depth in 6 specimens for each mix (four cement types, three w/b’s). Steel potentials were measured and
interpreted for corrosion activity. Potentials more negative than -300 mV versus the embedded Ti* reference electrodes were considered indicative of active corrosion; more positive than -200 mV as passive. Values in between were considered 'moderately corroding'. The ratio of corroding bars to all bars (18) per mix was taken as the probability of corrosion. A lognormal curve was fitted through the data points for each mix. All curves are shown in figure 4.11. In this figure, four curves lying left of the average curve (highlighted green) are marked 'low', expressing that within the entire group, these mixes have a lower critical chloride value: CEM I, II/B-V, III/B and V/A, all at w/b 0.55. Six curves are marked 'middle' (i.e. roughly equal to the average). This holds for CEM I and CEM II/B-V with w/b 0.40 and 0.45, and CEM III/B and CEM V/A with w/b 0.45. The group of curves marked 'high' (i.e. higher than average critical values) contains CEM III/B and CEM V/A at w/b 0.40.
TNO report | TNO 2013 R10100 32 / 70
This analysis of the probability of corrosion against the chloride content at the depth of the steel bars shows that the critical chloride content depends most strongly on w/b and did not significantly depend on binder type. The group mean of the critical chloride threshold is 0.8 % of chloride ion by mass of cement; a probability of corrosion of 10 % exists at 0.5 wt.% of chloride ion by mass of cement (Polder 2009).
Fig. 4.11. Probability of corrosion as a function of chloride content around the front surface of embedded rebars for 12 concrete compositions (four cement types, three w/b) after exposure to salt/drying cycles at an age of 30 weeks. Green curve: average of all specimens; the sample codes combine cement type and w/b. The first number reflects the cement type (1 – CEM I, 2 – CEM II/B-V, 3 – CEM III/B, 5, CEM V/A) the second and third the w/be (40 – w/b 0.40, etc.); for example, code 1450 implies CEM I with w/b 0.45.
In a follow up to the study mentioned above (Polder & Peelen 2002), twenty-one specimens were destructively analysed at an age of 2.5 years. In between 30 weeks and 2.5 years they were stored at 20 °C, 80 %RH, outside or in a fog room; no further chloride exposure took place. One specimen was tested of the following selected mixes: CEM I with w/b 0.40, 0.45 and 0.50, CEM II/B-V with w/b 0.45 and 0.50, CEM III/B and CEM V/A with w/b 0.50. It should be noted that a larger number of CEM I mixes was tested than for other (blended) cements. Corrosion potentials and corrosion rates were measured and subsequently a (second) chloride profile was taken; finally, bars were removed and checked for corrosion pits. Results were reported in Polder et al. (2002) and Polder & Visser (2004). As for previous analysis, groups of chloride contents and corrosion potential/rate were available for the selected specimens/mixes. Chloride contents around 10 mm depth varied from 0.2 to 2.5 % of chloride by mass of cement as a result of the fixed
TNO report | TNO 2013 R10100 33 / 70
exposure to salt solution and drying for 26 weeks and subsequent exposure without chloride. At 2.5 years, nearly all bars at 10 mm depth (in all specimens, for all investigated mixes) were corroding, both by corrosion potential and by corrosion rate (more than 2 µm a-1). At 2.5 years, chloride contents around 30 mm depth varied from 0.15 to 1.4 % of chloride by mass of cement. About 25 bars out of 63 bars at 30 mm depth were corroding, according to both corrosion potential and corrosion rate. The number of corroding bars increased from zero to 3 in the range of chloride contents between 0.25 and 0.75 %. The number of measurements was too small to distinguish between cement types.
4.3.7 Corrosion rate
Another set of observation on the group of specimens exposed to salt/dry loading (Fig. 4.5) concerns corrosion rates. From experiments up to one year (Polder & Peelen 2002), it appeared that corrosion rates for blended cements were systematically lower than for CEM I. In part this is due to lower chloride contents at that point in time at bar depth than for CEM I, in particular for CEM III/B and CEM V/A. Interestingly, CEM II/B-V had higher chloride content (at one year age) but lower corrosion rate than CEM I. This is probably due to higher resistivity for the former than for the latter. The effect of the storage climate is clear: the order of decreasing corrosion rates was fog room > outside > 20 °C, 80 %RH. This effect of humidity was strongly reflected in the resistivity. Table 4.4 shows the results for all 0.45 mixes. As mentioned above, at an age of 2.5 years 21 specimens (with an emphasis on CEM I concrete) were destructively analysed. Corrosion rates were measured up to then and the amount of corrosion was checked after removing the bars. The results can be summarised as follows (Polder et al. 2002). In table 4.5, a range of corrosion rates is given for each mix. Within those ranges, the highest corrosion rates occur for bars at 10 mm cover depth in the fog room, the lowest values are found for bars at 30 mm depth in 20 °C, 80 %RH; specimens outside are intermediate. Corrosion rates were rather stable over time (one to 2.5 year) in 20 °C, 80 %RH, outside and for bars at 30 mm depth in the fog room; they decreased by about 50 % from one year age to 2.5 year for bars at 10 mm depth in the fog room. The decrease in the fog room is due to changes in chloride content at these bars, as chloride ions move inwards to greater depths and, without external supply, they decrease at 10 mm bar depth (Polder & Visser 2004). Corrosion rates in CEM II/B-V, CEM III/B and CEM V/A are relatively low; those in CEM I concrete are systematically higher. In CEM I, they are higher for higher w/b. Both trends are related to the chloride contents in the various concrete mixes, see (Polder & Visser 2004). However, corrosion rate is also strongly related to resistivity.
TNO report | TNO 2013 R10100 34 / 70
Table 4.4. Test results for w/b 0.45 mixes at 52 weeks (corrosion rate and resistivity) or 30 weeks (chloride content). Corrosion rate and resistivity were measured at the same time
Table 4.5. Corrosion rates from LPR in mm/a from one to 2.5 year in concrete after
26 weeks of salt/drying cycles and then exposed outside, in 20 °C, 80 %RH or in a fog room (2 specimens each). Blanks imply that no data are available
cement w/b 0.40 0.45 0.55
CEM I 1 - 5 2 - 10 5 – 15 CEM II/B-V 1 - 5 1 – 5 CEM III/B 1 – 6 CEM V/A 1 - 5
4.4 Summary and conclusion
Studies of concrete in the field in marine environment on structures up to 60 years of age and several decades of laboratory work have shown that concrete made with cement that contains about 70 % of blast furnace slag (nowadays termed CEM III/B LH SR) shows excellent behaviour with respect to chloride penetration and reinforcement corrosion. Similarly favourable behaviour is expected in de-icing salt environment. In comparative studies, it was observed that chloride penetration in CEM I concrete was deeper and faster. Chloride profile analysis revealed that chloride surface contents were similar, but diffusion coefficients were consistently lower for CEM III/B than for CEM I. The decrease over time of apparent diffusion coefficients in CEM III/B cement is stronger than in CEM I. CEM III/B concrete has a higher electrical resistivity and lower corrosion rate after depassivation. The increase of resistivity due to slag hydration continues for a very long time. GGBS cement hydration is slower than Portland clinker hydration, but from about seven days age on chloride migration is slower in the former than in the latter. Critical (corrosion initiating) chloride contents appear comparable for all cement types mentioned. Summarizing, replacement of clinker by slag at high levels (50-70 %)
Exposure Fog room Outside 20 °C, 80 %RH
Electrode depth mm) 10 30/50 10 30/50 10 30/50
Corrosion rate measured by LPR (mm a-1)
CEM I 37 8.4 15 0.8 8.3 2.1 CEM II/B-V 18 3.3 5.7 0.9 5.3 1.0 CEM III/B 3.8 2.1 1.9 0.9 2.3 0.7 CEM V/A 3.1 1.9 1.5 1.9 1.6 0.7
Resistivity (W m)
CEM I 112 104 217 242 285 352 CEM II/B-V 401 713 971 1216 910 1442 CEM III/B 881 1118 1553 1817 1439 1997 CEM V/A 741 978 1481 1587 1539 2128
Chloride content (%) at 8 - 12 mm at 30 weeks
CEM I 1.56 CEM II/B-V 2.28 CEM III/B 0.56 CEM V/A 0.80

TNO report | TNO 2013 R10100 35 / 70
produces high chloride penetration resistance and high electrical resistivity, overall decreasing the risk of corrosion in chloride contaminated environments.
TNO report | TNO 2013 R10100 36 / 70
5 Carbonation
General consensus exists about the different response to carbonation by concrete made with ground blast furnace slag cement compared to concrete made with ordinary Portland cement. In the latter, atmospheric CO2 reacts with portlandite, Ca(OH)2 to the CaCO3-polymorphs calcite and vaterite, or rarely aragonite (e.g. Lang 2003). Given the larger molar volume of these carbonates compared to portlandite, the capillary porosity of the carbonated zone in ordinary Portland cement concrete decreases. The amount of portlandite in Portland cement concrete is, in principle, large enough to prevent the C-S-H itself being affected. This is different for concrete made with ground granulated blast furnace slag cement (e.g. Çopuroğlu 2006). Especially in case of CEM III/B, the amount of portlandite is low, and carbonation affects the C-S-H itself, resulting in a more open microstructure (which may affect frost-thaw resistance, see § 6), as can be seen in figure 5.1.
Fig. 5.1. Microphotographs illustrating the effect of carbonation on ground
granulated blast furnace slag concrete, CEM III/B. The bottom part of the concrete has been carbonated, shown in plain (upper left) and cross (upper right) polarized light, as well as UV-fluorescence (in which the intensity of the fluorescence corresponds to capillary porosity, see chapter 3).
5.1 Laboratory experiments
In the past, several laboratory experiments have been performed by TNO. Results are summarized in tables 5.1 for natural carbonation and 5.2 for accelerated carbonation. Results show that carbonation of CEM III/B is deeper than that of CEM III/A and CEM I at the same age, the latter being comparable.
TNO report | TNO 2013 R10100 37 / 70
Table 5.1. Natural carbonation of CEM III/B 42.5 compared to CEM III/A 52.5 (57 % GGBS) and CEM I 52.5 at 52 weeks in 20 C 65% RH in natural atmosphere (c. 0.04% CO2) , given as mean ± 1 standard deviation (Visser & Heijnen 1998)
Cement w/b Carbonation depth
Carbonation coefficient
kg m-3 mm 10-6 m s-0.5
I 52.5 300 0.55 2.9 ± 1.1 1.51 III/A 52.5 300 0.55 3.5 ± 0.9 2.14 III/B 42.5 300 0.55 7.9 ± 1.4 4.71
Fig. 5.2. Natural carbonation of concrete made with CEM III/B 42.5 compared to
CEM III/A 52.5 and CEM I 52.5 for mixtures given in table 5.1. Table 5.2. Accelerated carbonation of CEM III/B 42.5 with 75 % GGBS compared to
CEM I 32.5 R, CEM II/B-V 32.5 R (27 % PFA) and CEM V/A 42.5 (25 % GGBS, 25 % PFA) in after 26 weeks at 20 ˚C, 50 %RH and 5 % CO2 (Polder 2000b)
Cement w/b min typical max kg m-3 mm
I 32.5 R 338 0.40 9 17 - 38 100 318 0.45 10 13 - 22 30 287 0.55 23 27 - 40 100 II/B-V 32.5 R 333 0.40 8 13 - 19 20 314 0.45 21 26 - 32 34 280 0.55 32 34 - 37 42 III/B LH HS 42.5 339 0.40 21 27 - 32 40 316 0.45 33 35 - 50 100 286 0.55 100 100 V/A 42.5 333 0.40 14 15 - 18 20 322 0.45 20 21 - 24 27 279 0.55 36 43 - 100 100
0
2
4
6
8
10
0 13 26 39 52
depth
(m
m)
age (weeks)
CEM I 52.5
CEM III/A 52.5
CEM III/B 42.5
TNO report | TNO 2013 R10100 38 / 70
5.2 Carbonation of GGBS concrete in practice
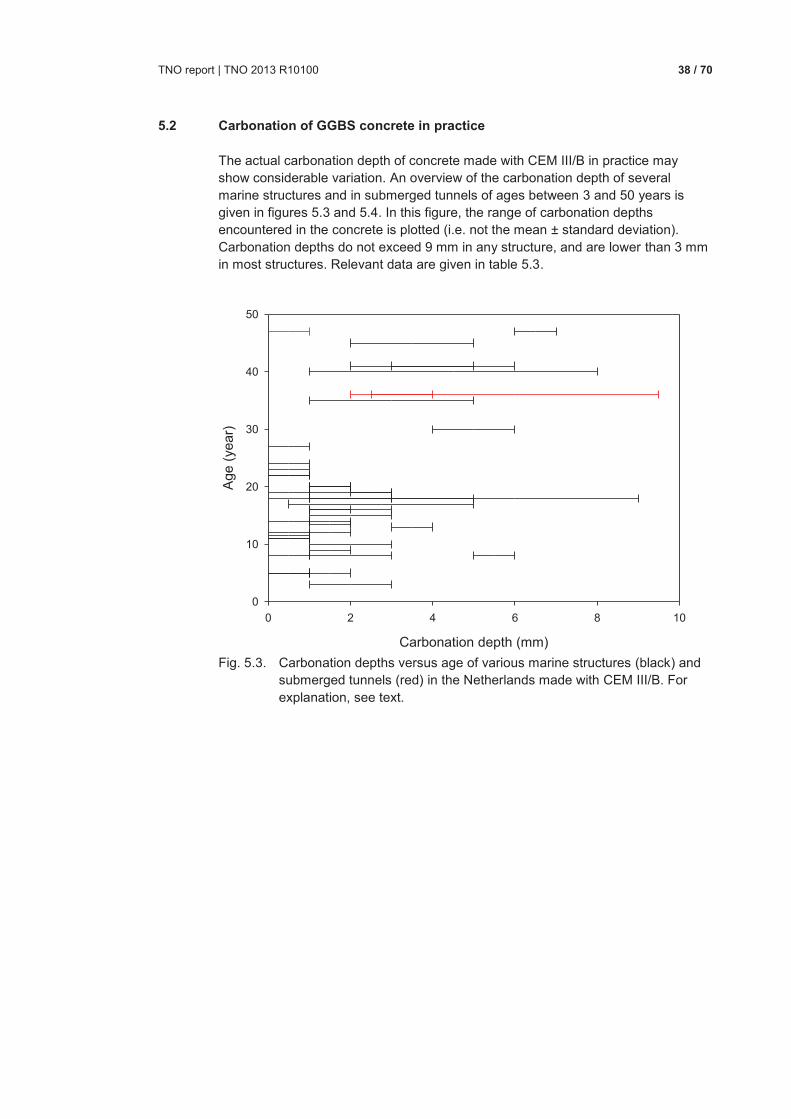
The actual carbonation depth of concrete made with CEM III/B in practice may show considerable variation. An overview of the carbonation depth of several marine structures and in submerged tunnels of ages between 3 and 50 years is given in figures 5.3 and 5.4. In this figure, the range of carbonation depths encountered in the concrete is plotted (i.e. not the mean ± standard deviation). Carbonation depths do not exceed 9 mm in any structure, and are lower than 3 mm in most structures. Relevant data are given in table 5.3.
Fig. 5.3. Carbonation depths versus age of various marine structures (black) and
submerged tunnels (red) in the Netherlands made with CEM III/B. For explanation, see text.
Carbonation depth (mm)
0 2 4 6 8 10
Age (
year)
0
10
20
30
40
50
TNO report | TNO 2013 R10100 39 / 70
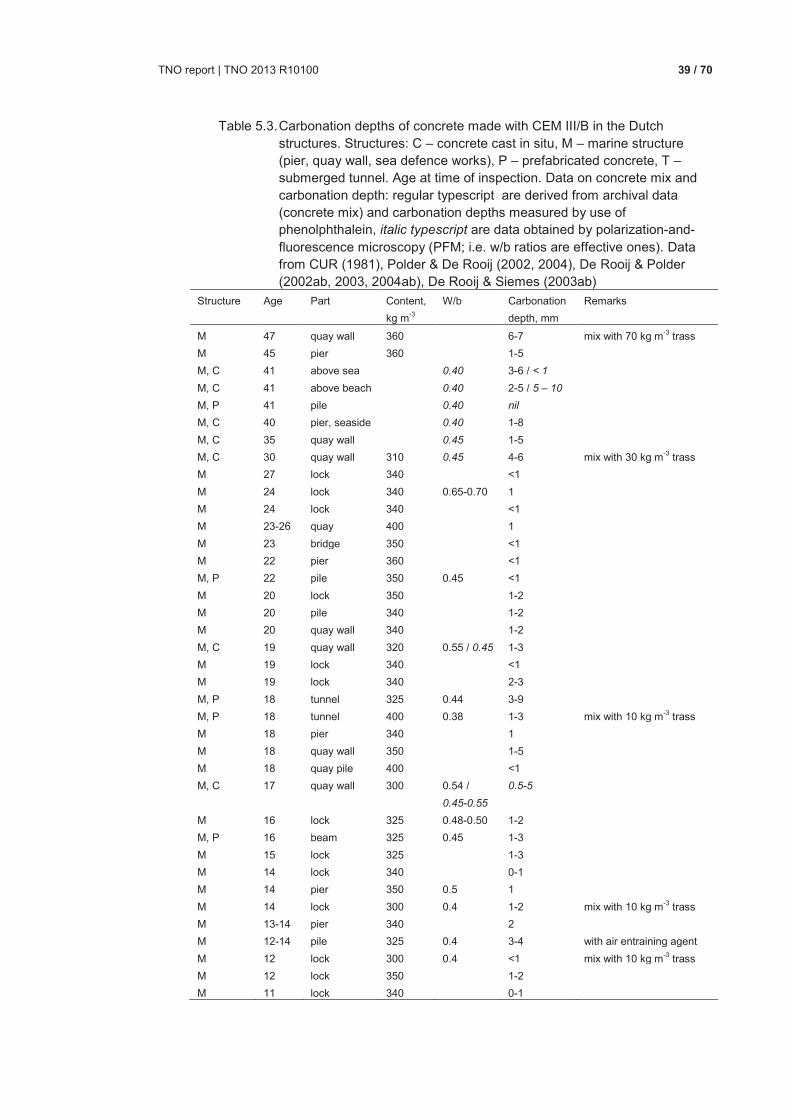
Table 5.3. Carbonation depths of concrete made with CEM III/B in the Dutch structures. Structures: C – concrete cast in situ, M – marine structure (pier, quay wall, sea defence works), P – prefabricated concrete, T – submerged tunnel. Age at time of inspection. Data on concrete mix and carbonation depth: regular typescript are derived from archival data (concrete mix) and carbonation depths measured by use of phenolphthalein, italic typescript are data obtained by polarization-and-fluorescence microscopy (PFM; i.e. w/b ratios are effective ones). Data from CUR (1981), Polder & De Rooij (2002, 2004), De Rooij & Polder (2002ab, 2003, 2004ab), De Rooij & Siemes (2003ab)
Structure Age Part Content,
kg m-3
W/b Carbonation
depth, mm
Remarks
M 47 quay wall 360 6-7 mix with 70 kg m-3 trass
M 45 pier 360 1-5
M, C 41 above sea 0.40 3-6 / < 1
M, C 41 above beach 0.40 2-5 / 5 – 10
M, P 41 pile 0.40 nil
M, C 40 pier, seaside 0.40 1-8
M, C 35 quay wall 0.45 1-5
M, C 30 quay wall 310 0.45 4-6 mix with 30 kg m-3 trass
M 27 lock 340 <1
M 24 lock 340 0.65-0.70 1
M 24 lock 340 <1
M 23-26 quay 400 1
M 23 bridge 350 <1
M 22 pier 360 <1
M, P 22 pile 350 0.45 <1
M 20 lock 350 1-2
M 20 pile 340 1-2
M 20 quay wall 340 1-2
M, C 19 quay wall 320 0.55 / 0.45 1-3
M 19 lock 340 <1
M 19 lock 340 2-3
M, P 18 tunnel 325 0.44 3-9
M, P 18 tunnel 400 0.38 1-3 mix with 10 kg m-3 trass
M 18 pier 340 1
M 18 quay wall 350 1-5
M 18 quay pile 400 <1
M, C 17 quay wall 300 0.54 /
0.45-0.55
0.5-5
M 16 lock 325 0.48-0.50 1-2
M, P 16 beam 325 0.45 1-3
M 15 lock 325 1-3
M 14 lock 340 0-1
M 14 pier 350 0.5 1
M 14 lock 300 0.4 1-2 mix with 10 kg m-3 trass
M 13-14 pier 340 2
M 12-14 pile 325 0.4 3-4 with air entraining agent
M 12 lock 300 0.4 <1 mix with 10 kg m-3 trass
M 12 lock 350 1-2
M 11 lock 340 0-1
TNO report | TNO 2013 R10100 40 / 70
Table 5.3. Continued.
M 11 lock 340 <1
M, P 10-13 pile base 375 0.47 <1
M 10 lock 325 1-3
M 10 quay wall 350 1
M 9 pier 350 1-2
M 8 pier 350 0.5 1
M 8 lock 325 1-3
M 8 lock 350 0-1
M 8 quay wall 350 5-6
M 6 lock 350 2
M 6 pump house 300 2
M 5 lock 325 0.5 0-1
M, P 5 lighthouse 360 0.45 <1
M 5 quay wall 310 1-2
M 4 pier 325 1
M 3 lock 300 1-3
T 36 inner wall 0.45 3-5 / 5-10 near entrance/exit
T 36 inner wall 0.45 4 / 2-3 in middle of tunnel
T 47 inner wall 0.45-0.55 0-1 in middle of tunnel
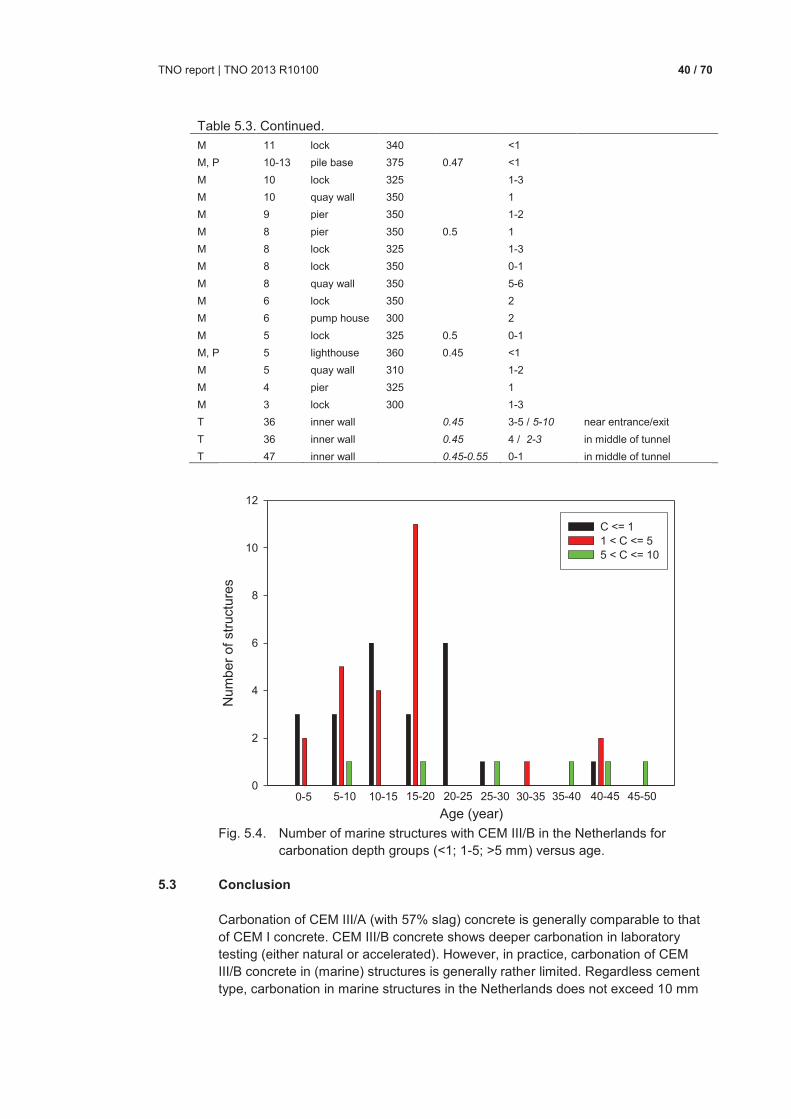
Fig. 5.4. Number of marine structures with CEM III/B in the Netherlands for
carbonation depth groups (<1; 1-5; >5 mm) versus age.
5.3 Conclusion
Carbonation of CEM III/A (with 57% slag) concrete is generally comparable to that of CEM I concrete. CEM III/B concrete shows deeper carbonation in laboratory testing (either natural or accelerated). However, in practice, carbonation of CEM III/B concrete in (marine) structures is generally rather limited. Regardless cement type, carbonation in marine structures in the Netherlands does not exceed 10 mm
0-5
Age (year)
Num
ber
of
stru
cture
s
0
2
4
6
8
10
12
C <= 11 < C <= 5 5 < C <= 10
5-10 10-15 15-20 20-25 25-30 30-35 35-40 40-45 45-50

TNO report | TNO 2013 R10100 41 / 70
at ages up to 50 year, and carbonation induced reinforcement corrosion is not an issue in structures with sufficient cover of good quality.
TNO report | TNO 2013 R10100 42 / 70
6 Freeze-thaw resistance
In this chapter, first general observations on the freeze-thaw resistance of CEM III/B concrete, based on field experience will be summarized (§ 6.1). To further evaluate the freeze-thaw resistance, results from a project considering concretes based on different cements and with different additives from four test sites (in use structures) in the Netherlands are presented in detail (§ 6.2). Additional laboratory experiments are summarized in § 6.3. In contrast to many other countries, the Dutch supplement to NEN-EN 206-1:
Concrete - Part 1: Specification, performance, production and conformity (NEN 8005:2008) specifies for exposure class XF4 either concrete with a w/b of 0.45 and 320 kg m-3 cement, but without air entraining agent, or concrete with w/b 0.50, 300 kg m-3 and an air entraining agent (3-5 vol.% air, depending on Dmax of the aggregate).
6.1 General observations on field experience in the Netherlands
In general, freeze-thaw damage, with or without de-icing salts of concrete is rather limited in the Netherlands, both in extent and number of cases. A major research project was devoted to freeze-thaw resistance around 2000. Inventory and evaluation resulted in a relatively small set of structures showing cases of damage. Experience has been summarized by Visser (1999, 2000), and has been substantiated since: · The most common damage is due to frost in combination with de-icing salts.
Only one case of pure freeze-thaw damage without de-icing salts has been encountered.
· Superficial damage mostly occurs at open, exposed sites. · Flaking is the most common damage pattern; it seems to be limited to a surface
layer of poorer quality, regardless the type of cement used. · Concrete under a high water load, for example curbs and supports exposed to
seepage, may show more severe damage, resulting in loss of cement skin and coarse aggregate grains sticking out.
· Microscopic investigation has not revealed any internal damage in concretes with freeze-thaw damage.
· Concrete with a poor quality surface layer, due to either high w/b, poor curing, or, in case of CEM III/B, carbonation, is most prone to freeze-thaw damage in combination with de-icing salts, as might be expected. This holds for all types of cement (CEM I, CEM II/B-V, CEM III).
· CEM III/B seems to be more prone to freeze-thaw with de-icing salt damage. The damage is, however, limited, affecting only the outermost 2-3 mm. In most cases, this is related to carbonation at young age (which may have been enhanced by bad curing). In case of CEM III/B, carbonation results in a more open microstructure, in contrast to CEM I. This does, however, not always result in frost damage, as demonstrated by New Jersey profiles of CEM III/B cement made with a high carbonation depth, but without frost damage.
· The role of de-icing salts is unclear. In some cases, ingress of chloride was not demonstrated, though damage did only occur on locations exposed to de-icing salts.
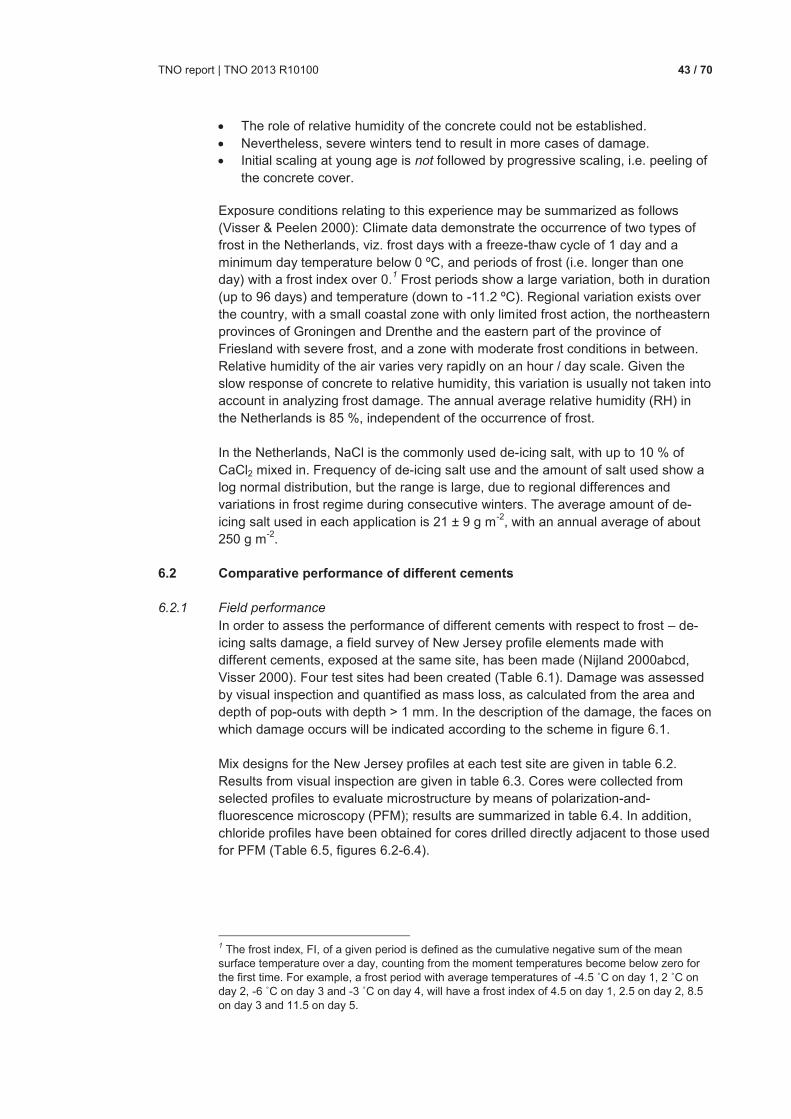
TNO report | TNO 2013 R10100 43 / 70
· The role of relative humidity of the concrete could not be established. · Nevertheless, severe winters tend to result in more cases of damage. · Initial scaling at young age is not followed by progressive scaling, i.e. peeling of
the concrete cover. Exposure conditions relating to this experience may be summarized as follows (Visser & Peelen 2000): Climate data demonstrate the occurrence of two types of frost in the Netherlands, viz. frost days with a freeze-thaw cycle of 1 day and a minimum day temperature below 0 ºC, and periods of frost (i.e. longer than one day) with a frost index over 0.1 Frost periods show a large variation, both in duration (up to 96 days) and temperature (down to -11.2 ºC). Regional variation exists over the country, with a small coastal zone with only limited frost action, the northeastern provinces of Groningen and Drenthe and the eastern part of the province of Friesland with severe frost, and a zone with moderate frost conditions in between. Relative humidity of the air varies very rapidly on an hour / day scale. Given the slow response of concrete to relative humidity, this variation is usually not taken into account in analyzing frost damage. The annual average relative humidity (RH) in the Netherlands is 85 %, independent of the occurrence of frost. In the Netherlands, NaCl is the commonly used de-icing salt, with up to 10 % of CaCl2 mixed in. Frequency of de-icing salt use and the amount of salt used show a log normal distribution, but the range is large, due to regional differences and variations in frost regime during consecutive winters. The average amount of de-icing salt used in each application is 21 ± 9 g m-2, with an annual average of about 250 g m-2.
6.2 Comparative performance of different cements
6.2.1 Field performance
In order to assess the performance of different cements with respect to frost – de-icing salts damage, a field survey of New Jersey profile elements made with different cements, exposed at the same site, has been made (Nijland 2000abcd, Visser 2000). Four test sites had been created (Table 6.1). Damage was assessed by visual inspection and quantified as mass loss, as calculated from the area and depth of pop-outs with depth > 1 mm. In the description of the damage, the faces on which damage occurs will be indicated according to the scheme in figure 6.1. Mix designs for the New Jersey profiles at each test site are given in table 6.2. Results from visual inspection are given in table 6.3. Cores were collected from selected profiles to evaluate microstructure by means of polarization-and-fluorescence microscopy (PFM); results are summarized in table 6.4. In addition, chloride profiles have been obtained for cores drilled directly adjacent to those used for PFM (Table 6.5, figures 6.2-6.4).
1 The frost index, FI, of a given period is defined as the cumulative negative sum of the mean surface temperature over a day, counting from the moment temperatures become below zero for the first time. For example, a frost period with average temperatures of -4.5 ˚C on day 1, 2 ˚C on day 2, -6 ˚C on day 3 and -3 ˚C on day 4, will have a frost index of 4.5 on day 1, 2.5 on day 2, 8.5 on day 3 and 11.5 on day 5.
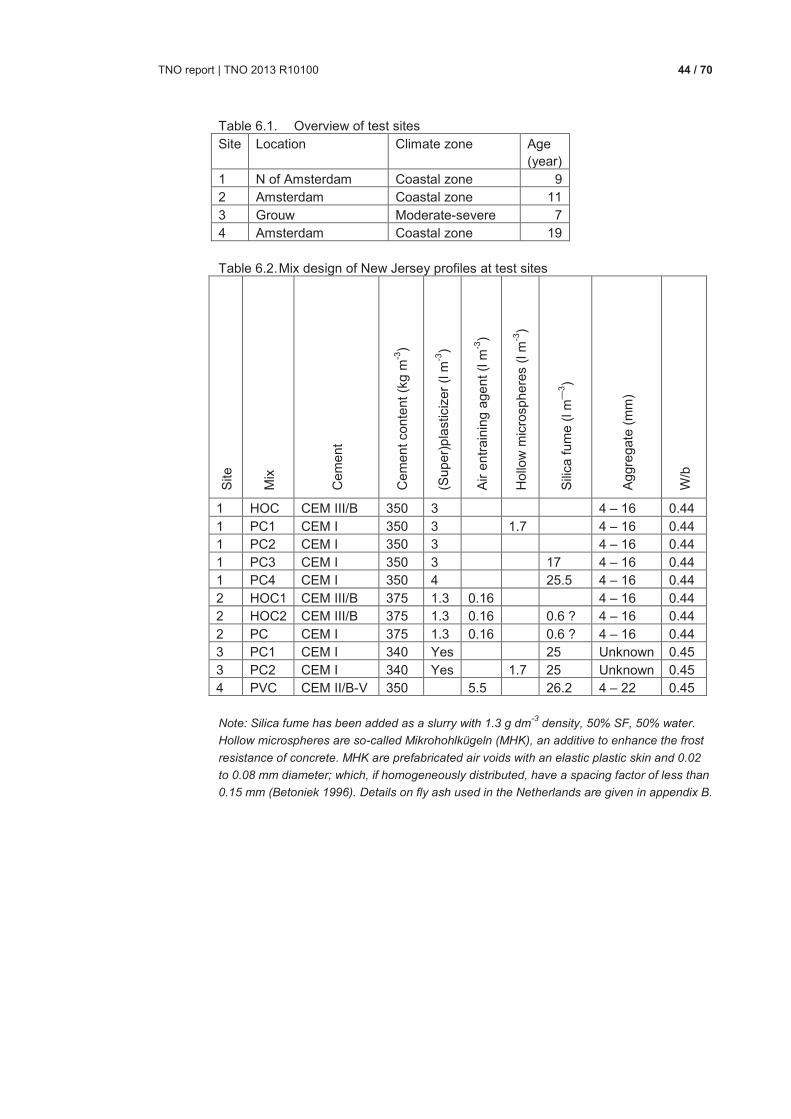
TNO report | TNO 2013 R10100 44 / 70
Table 6.1. Overview of test sites
Site Location Climate zone Age (year)
1 N of Amsterdam Coastal zone 9
2 Amsterdam Coastal zone 11
3 Grouw Moderate-severe 7
4 Amsterdam Coastal zone 19
Table 6.2. Mix design of New Jersey profiles at test sites
Site
Mix
Cem
ent
Cem
ent co
nte
nt
(kg m
-3)
(Super)
pla
stic
izer
(l m
-3)
Air e
ntr
ain
ing a
ge
nt (l m
-3)
Hollo
w m
icro
sph
ere
s (l m
-3)
Sili
ca f
um
e (
l m—
3)
Aggre
gate
(m
m)
W/b
1 HOC CEM III/B 350 3 4 – 16 0.44
1 PC1 CEM I 350 3 1.7 4 – 16 0.44
1 PC2 CEM I 350 3 4 – 16 0.44
1 PC3 CEM I 350 3 17 4 – 16 0.44
1 PC4 CEM I 350 4 25.5 4 – 16 0.44
2 HOC1 CEM III/B 375 1.3 0.16 4 – 16 0.44
2 HOC2 CEM III/B 375 1.3 0.16 0.6 ? 4 – 16 0.44
2 PC CEM I 375 1.3 0.16 0.6 ? 4 – 16 0.44
3 PC1 CEM I 340 Yes 25 Unknown 0.45
3 PC2 CEM I 340 Yes 1.7 25 Unknown 0.45
4 PVC CEM II/B-V 350 5.5 26.2 4 – 22 0.45
Note: Silica fume has been added as a slurry with 1.3 g dm-3
density, 50% SF, 50% water.
Hollow microspheres are so-called Mikrohohlkügeln (MHK), an additive to enhance the frost
resistance of concrete. MHK are prefabricated air voids with an elastic plastic skin and 0.02
to 0.08 mm diameter; which, if homogeneously distributed, have a spacing factor of less than
0.15 mm (Betoniek 1996). Details on fly ash used in the Netherlands are given in appendix B.
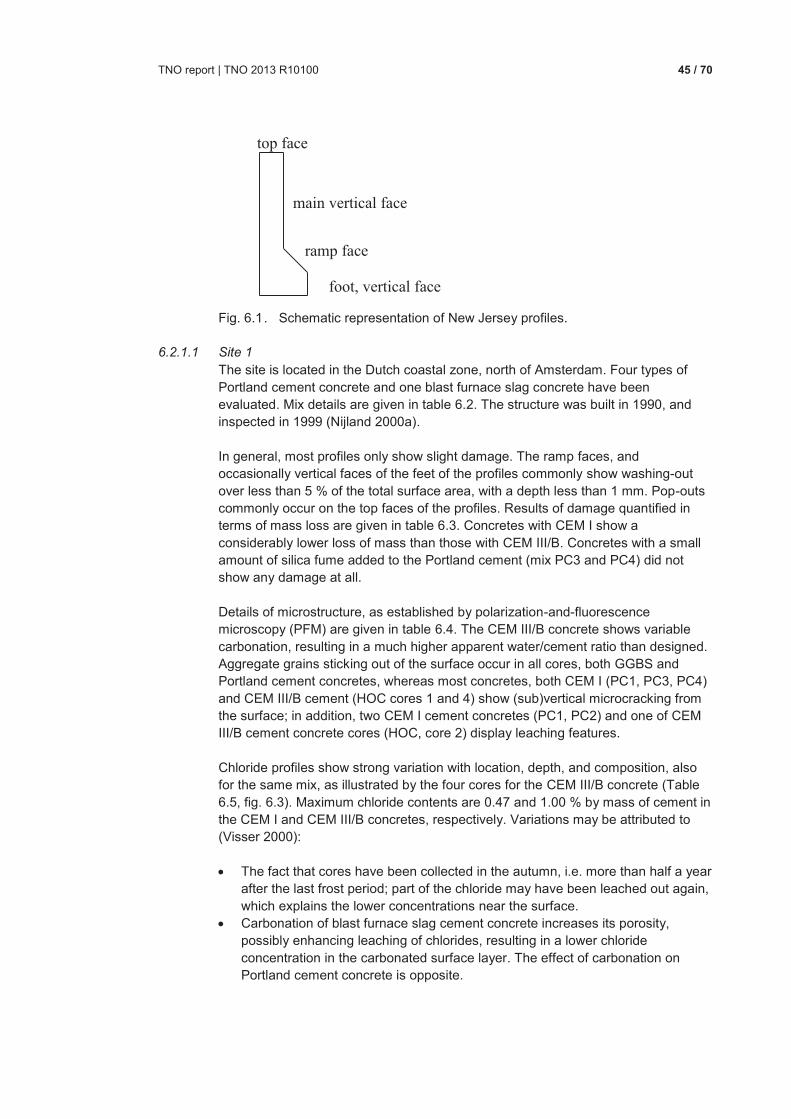
TNO report | TNO 2013 R10100 45 / 70
Fig. 6.1 . Schematic representation of New Jersey profiles.
6.2.1.1 Site 1
The site is located in the Dutch coastal zone, north of Amsterdam. Four types of Portland cement concrete and one blast furnace slag concrete have been evaluated. Mix details are given in table 6.2. The structure was built in 1990, and inspected in 1999 (Nijland 2000a). In general, most profiles only show slight damage. The ramp faces, and occasionally vertical faces of the feet of the profiles commonly show washing-out over less than 5 % of the total surface area, with a depth less than 1 mm. Pop-outs commonly occur on the top faces of the profiles. Results of damage quantified in terms of mass loss are given in table 6.3. Concretes with CEM I show a considerably lower loss of mass than those with CEM III/B. Concretes with a small amount of silica fume added to the Portland cement (mix PC3 and PC4) did not show any damage at all. Details of microstructure, as established by polarization-and-fluorescence microscopy (PFM) are given in table 6.4. The CEM III/B concrete shows variable carbonation, resulting in a much higher apparent water/cement ratio than designed. Aggregate grains sticking out of the surface occur in all cores, both GGBS and Portland cement concretes, whereas most concretes, both CEM I (PC1, PC3, PC4) and CEM III/B cement (HOC cores 1 and 4) show (sub)vertical microcracking from the surface; in addition, two CEM I cement concretes (PC1, PC2) and one of CEM III/B cement concrete cores (HOC, core 2) display leaching features. Chloride profiles show strong variation with location, depth, and composition, also for the same mix, as illustrated by the four cores for the CEM III/B concrete (Table 6.5, fig. 6.3). Maximum chloride contents are 0.47 and 1.00 % by mass of cement in the CEM I and CEM III/B concretes, respectively. Variations may be attributed to (Visser 2000): · The fact that cores have been collected in the autumn, i.e. more than half a year
after the last frost period; part of the chloride may have been leached out again, which explains the lower concentrations near the surface.
· Carbonation of blast furnace slag cement concrete increases its porosity, possibly enhancing leaching of chlorides, resulting in a lower chloride concentration in the carbonated surface layer. The effect of carbonation on Portland cement concrete is opposite.
top face
main vertical face
ramp face
foot, vertical face
TNO report | TNO 2013 R10100 46 / 70
· Drying of the concrete, resulting in higher chloride concentrations. Drying will strongly depend on exposure and wetting conditions.
· Drying from another than the exposed surface (wicking). · Possible multidirectional exposure to de-icing salts. Ingress of chlorides is apparently not controlled by normal diffusion. Diffusion coefficients calculated in table 6.5 are an indication at best. They, however, resemble values found in the splash zone of marine structures; therefore, they are not unrealistic.
6.2.1.2 Site 2
The site is located in Amsterdam, in the Dutch coastal zone. One type of CEM I concrete and two CEM III/B concretes have been evaluated. Mix details are given in table 6.2. The structure was built in 1988, and inspected in 1999 (Nijland 2000b). Generally, the New Jersey profiles show only slight damage, in the form of washing-out of notably the ramps and, to a lesser extent, the main vertical faces. Pop-outs commonly occur on the top faces. Results of damage quantified in terms of mass loss are given in table 6.3. The CEM I concrete shows more damage than both CEM III/B cement concretes. As on site 1, blast furnace slag cement concretes show variable, but higher carbonation depths than the CEM I concrete, resulting in enhanced apparent water/binder ratio’s (Table 6.4). The elements show aggregate grains sticking out of the surface, whereas the CEM I concrete also shows (sub)vertical microcracking from the surface. Chloride profiles are variable (Table 6.5, fig. 6.3), affected by processes outlined in § 6.2.11. Again, calculated diffusion coefficients are rough estimates.
6.2.1.3 Site 3
The site is located in the northern province of Friesland, in the zone with a moderate to severe frost regime. Two types of CEM I concrete have been evaluated. Mix details are given in table 6.2. The structure was built in 1992, and inspected in 1999 (Nijland 2000c). Many profiles show an elaborate pattern of craquélé cracking. Frost – de-icing salt damage occurred in the form of pop-outs. Two types of CEM I concrete were inspected, with and without hollow microspheres, but could not be distinguished in the field. Out of 30 profiles, 25 did not show any damage (Table 6.3). The concrete shows almost no carbonation (Table 6.4), but does show aggregate grains sticking out of the surface, and (sub)vertical microcracking from the surface. Chloride profiles show the same pattern, but variation in magnitude (Table 6.5, fig. 6.4). Again, calculated diffusion coefficients are rough estimates.
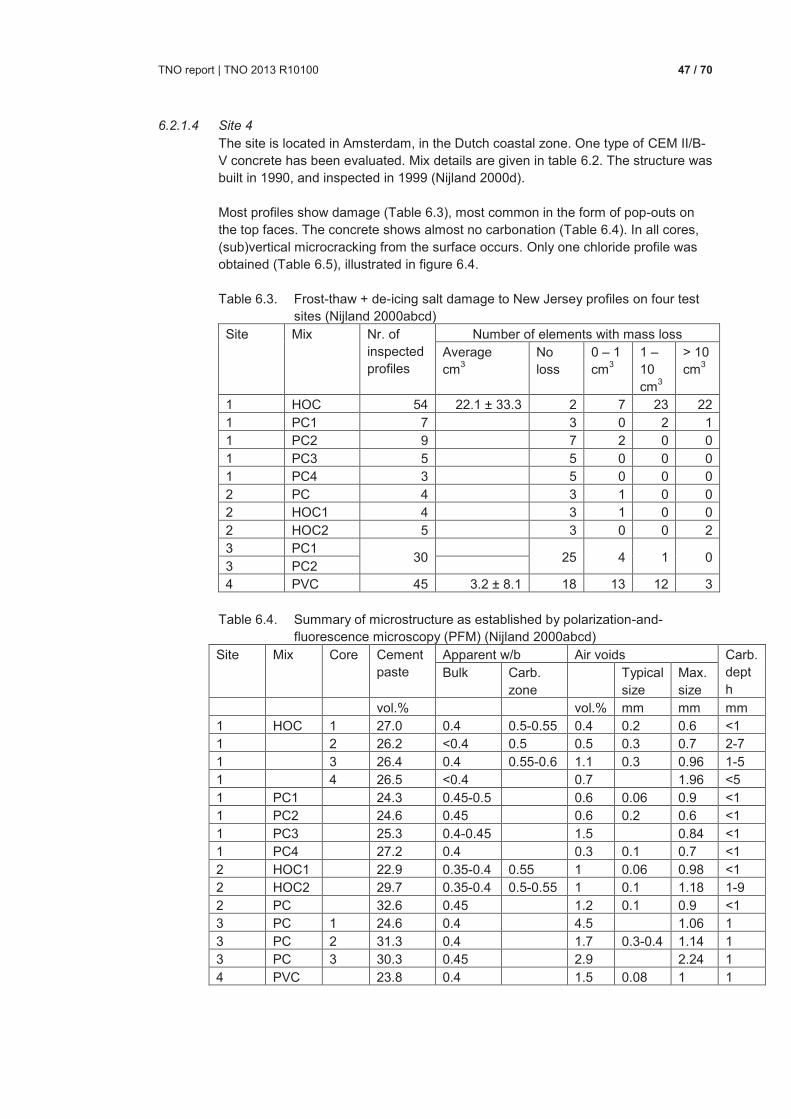
TNO report | TNO 2013 R10100 47 / 70
6.2.1.4 Site 4
The site is located in Amsterdam, in the Dutch coastal zone. One type of CEM II/B-V concrete has been evaluated. Mix details are given in table 6.2. The structure was built in 1990, and inspected in 1999 (Nijland 2000d). Most profiles show damage (Table 6.3), most common in the form of pop-outs on the top faces. The concrete shows almost no carbonation (Table 6.4). In all cores, (sub)vertical microcracking from the surface occurs. Only one chloride profile was obtained (Table 6.5), illustrated in figure 6.4. Table 6.3. Frost-thaw + de-icing salt damage to New Jersey profiles on four test
sites (Nijland 2000abcd)
Site Mix Nr. of inspected profiles
Number of elements with mass loss
Average cm3
No loss
0 – 1 cm3
1 – 10 cm3
> 10 cm3
1 HOC 54 22.1 ± 33.3 2 7 23 22
1 PC1 7 3 0 2 1
1 PC2 9 7 2 0 0
1 PC3 5 5 0 0 0
1 PC4 3 5 0 0 0
2 PC 4 3 1 0 0
2 HOC1 4 3 1 0 0
2 HOC2 5 3 0 0 2
3 PC1 30
25 4 1 0
3 PC2
4 PVC 45 3.2 ± 8.1 18 13 12 3
Table 6.4. Summary of microstructure as established by polarization-and-
fluorescence microscopy (PFM) (Nijland 2000abcd)
Site Mix Core Cement paste
Apparent w/b Air voids Carb. depth
Bulk Carb. zone
Typical size
Max. size
vol.% vol.% mm mm mm
1 HOC 1 27.0 0.4 0.5-0.55 0.4 0.2 0.6 <1
1 2 26.2 <0.4 0.5 0.5 0.3 0.7 2-7
1 3 26.4 0.4 0.55-0.6 1.1 0.3 0.96 1-5
1 4 26.5 <0.4 0.7 1.96 <5
1 PC1 24.3 0.45-0.5 0.6 0.06 0.9 <1
1 PC2 24.6 0.45 0.6 0.2 0.6 <1
1 PC3 25.3 0.4-0.45 1.5 0.84 <1
1 PC4 27.2 0.4 0.3 0.1 0.7 <1
2 HOC1 22.9 0.35-0.4 0.55 1 0.06 0.98 <1
2 HOC2 29.7 0.35-0.4 0.5-0.55 1 0.1 1.18 1-9
2 PC 32.6 0.45 1.2 0.1 0.9 <1
3 PC 1 24.6 0.4 4.5 1.06 1
3 PC 2 31.3 0.4 1.7 0.3-0.4 1.14 1
3 PC 3 30.3 0.45 2.9 2.24 1
4 PVC 23.8 0.4 1.5 0.08 1 1
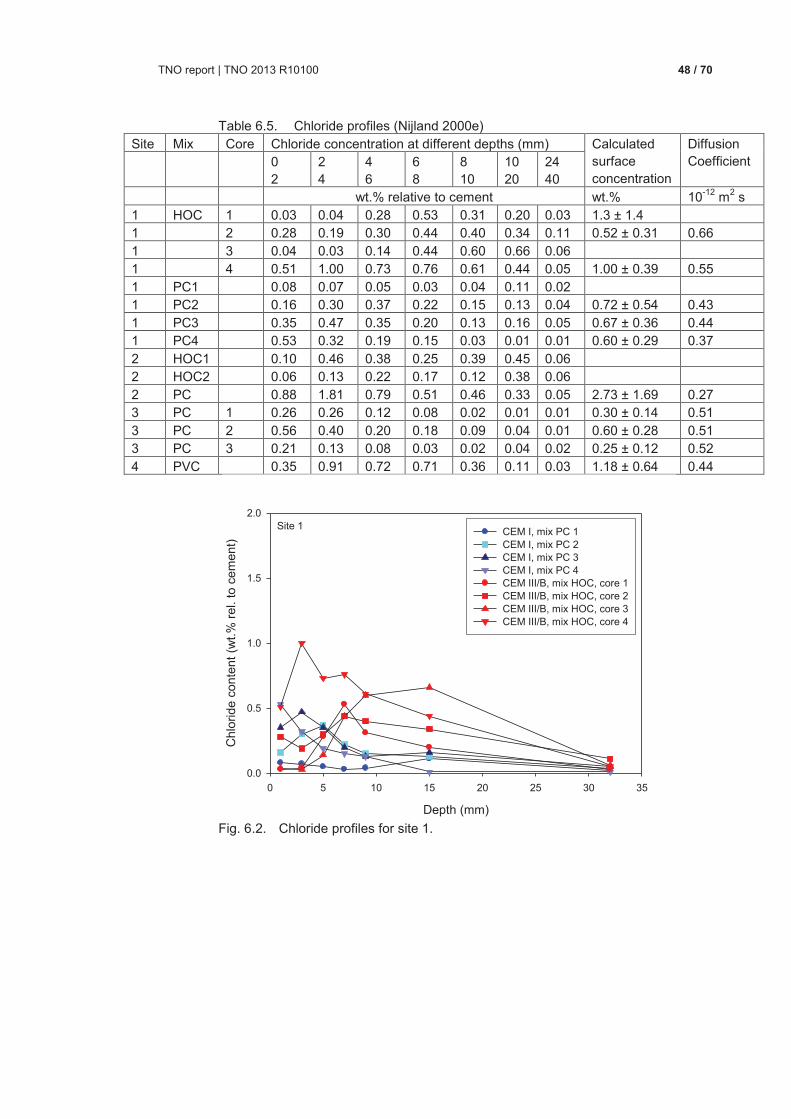
TNO report | TNO 2013 R10100 48 / 70
Table 6.5. Chloride profiles (Nijland 2000e)
Site Mix Core Chloride concentration at different depths (mm) Calculated surface concentration
Diffusion Coefficient 0
2 2 4
4 6
6 8
8 10
10 20
24 40
wt.% relative to cement wt.% 10-12 m2 s
1 HOC 1 0.03 0.04 0.28 0.53 0.31 0.20 0.03 1.3 ± 1.4
1 2 0.28 0.19 0.30 0.44 0.40 0.34 0.11 0.52 ± 0.31 0.66
1 3 0.04 0.03 0.14 0.44 0.60 0.66 0.06
1 4 0.51 1.00 0.73 0.76 0.61 0.44 0.05 1.00 ± 0.39 0.55
1 PC1 0.08 0.07 0.05 0.03 0.04 0.11 0.02
1 PC2 0.16 0.30 0.37 0.22 0.15 0.13 0.04 0.72 ± 0.54 0.43
1 PC3 0.35 0.47 0.35 0.20 0.13 0.16 0.05 0.67 ± 0.36 0.44
1 PC4 0.53 0.32 0.19 0.15 0.03 0.01 0.01 0.60 ± 0.29 0.37
2 HOC1 0.10 0.46 0.38 0.25 0.39 0.45 0.06
2 HOC2 0.06 0.13 0.22 0.17 0.12 0.38 0.06
2 PC 0.88 1.81 0.79 0.51 0.46 0.33 0.05 2.73 ± 1.69 0.27
3 PC 1 0.26 0.26 0.12 0.08 0.02 0.01 0.01 0.30 ± 0.14 0.51
3 PC 2 0.56 0.40 0.20 0.18 0.09 0.04 0.01 0.60 ± 0.28 0.51
3 PC 3 0.21 0.13 0.08 0.03 0.02 0.04 0.02 0.25 ± 0.12 0.52
4 PVC 0.35 0.91 0.72 0.71 0.36 0.11 0.03 1.18 ± 0.64 0.44
Fig. 6.2. Chloride profiles for site 1.
Depth (mm)
0 5 10 15 20 25 30 35
Chlo
ride c
onte
nt
(wt.
% r
el.
to c
em
ent)
0.0
0.5
1.0
1.5
2.0
CEM I, mix PC 1CEM I, mix PC 2 CEM I, mix PC 3 CEM I, mix PC 4 CEM III/B, mix HOC, core 1CEM III/B, mix HOC, core 2CEM III/B, mix HOC, core 3CEM III/B, mix HOC, core 4
Site 1
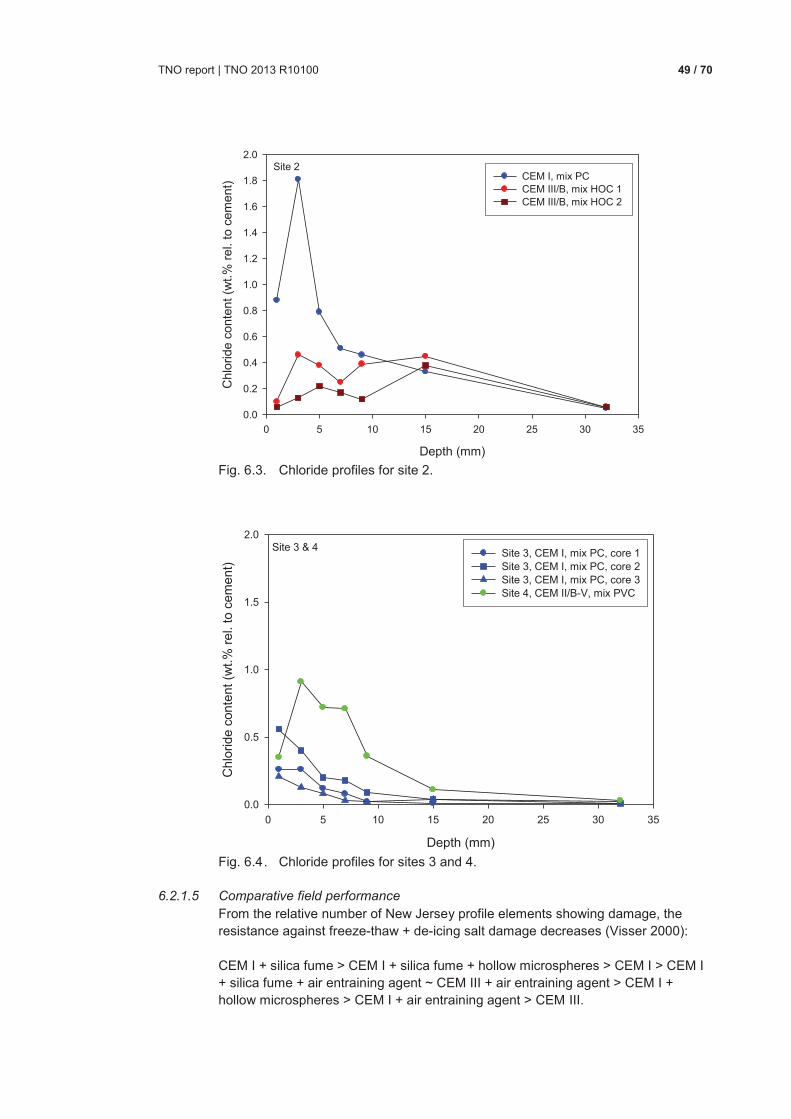
TNO report | TNO 2013 R10100 49 / 70
Fig. 6.3. Chloride profiles for site 2.
Fig. 6.4 . Chloride profiles for sites 3 and 4.
6.2.1.5 Comparative field performance
From the relative number of New Jersey profile elements showing damage, the resistance against freeze-thaw + de-icing salt damage decreases (Visser 2000): CEM I + silica fume > CEM I + silica fume + hollow microspheres > CEM I > CEM I + silica fume + air entraining agent ~ CEM III + air entraining agent > CEM I + hollow microspheres > CEM I + air entraining agent > CEM III.
Depth (mm)
0 5 10 15 20 25 30 35
Chlo
ride c
onte
nt
(wt.
% r
el.
to c
em
ent)
0.0
0.2
0.4
0.6
0.8
1.0
1.2
1.4
1.6
1.8
2.0
CEM I, mix PC CEM III/B, mix HOC 1CEM III/B, mix HOC 2
Site 2
Depth (mm)
0 5 10 15 20 25 30 35
Chlo
ride c
onte
nt
(wt.
% r
el.
to c
em
ent)
0.0
0.5
1.0
1.5
2.0
Site 3, CEM I, mix PC, core 1Site 3, CEM I, mix PC, core 2Site 3, CEM I, mix PC, core 3Site 4, CEM II/B-V, mix PVC
Site 3 & 4
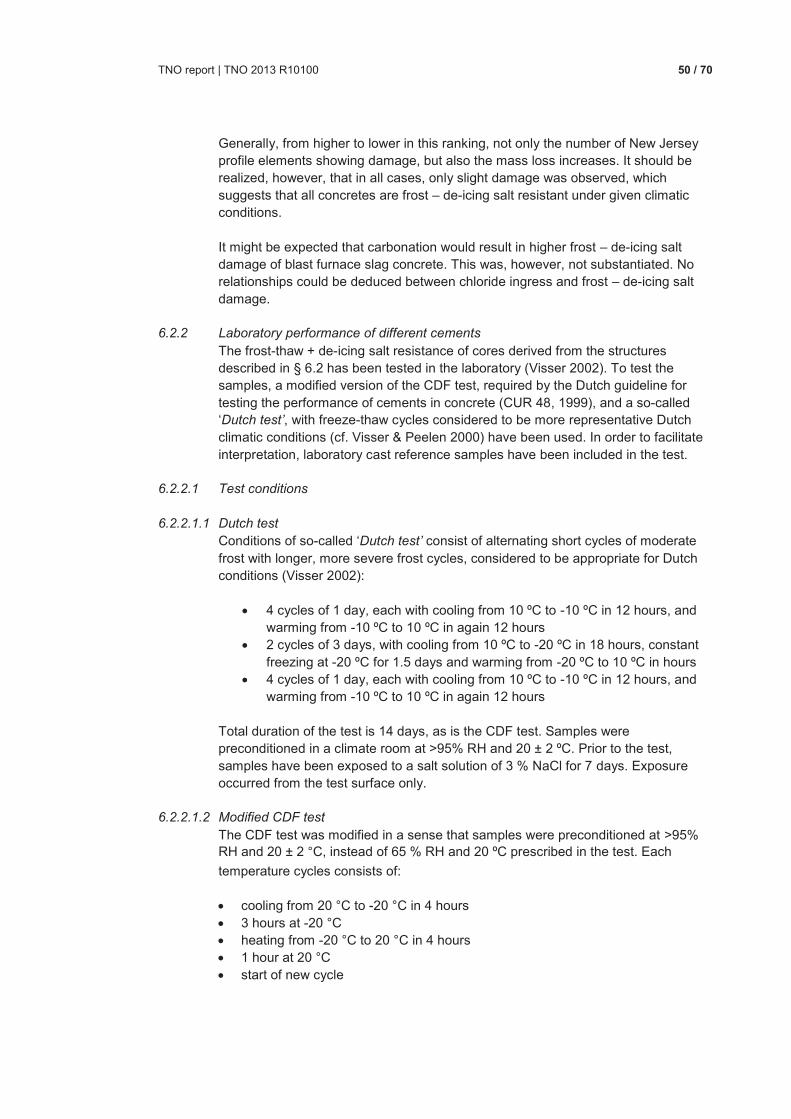
TNO report | TNO 2013 R10100 50 / 70
Generally, from higher to lower in this ranking, not only the number of New Jersey profile elements showing damage, but also the mass loss increases. It should be realized, however, that in all cases, only slight damage was observed, which suggests that all concretes are frost – de-icing salt resistant under given climatic conditions. It might be expected that carbonation would result in higher frost – de-icing salt damage of blast furnace slag concrete. This was, however, not substantiated. No relationships could be deduced between chloride ingress and frost – de-icing salt damage.
6.2.2 Laboratory performance of different cements
The frost-thaw + de-icing salt resistance of cores derived from the structures described in § 6.2 has been tested in the laboratory (Visser 2002). To test the samples, a modified version of the CDF test, required by the Dutch guideline for testing the performance of cements in concrete (CUR 48, 1999), and a so-called ‘Dutch test’, with freeze-thaw cycles considered to be more representative Dutch climatic conditions (cf. Visser & Peelen 2000) have been used. In order to facilitate interpretation, laboratory cast reference samples have been included in the test.
6.2.2.1 Test conditions
6.2.2.1.1 Dutch test
Conditions of so-called ‘Dutch test’ consist of alternating short cycles of moderate frost with longer, more severe frost cycles, considered to be appropriate for Dutch conditions (Visser 2002):
· 4 cycles of 1 day, each with cooling from 10 ºC to -10 ºC in 12 hours, and warming from -10 ºC to 10 ºC in again 12 hours
· 2 cycles of 3 days, with cooling from 10 ºC to -20 ºC in 18 hours, constant freezing at -20 ºC for 1.5 days and warming from -20 ºC to 10 ºC in hours
· 4 cycles of 1 day, each with cooling from 10 ºC to -10 ºC in 12 hours, and warming from -10 ºC to 10 ºC in again 12 hours
Total duration of the test is 14 days, as is the CDF test. Samples were preconditioned in a climate room at >95% RH and 20 ± 2 ºC. Prior to the test, samples have been exposed to a salt solution of 3 % NaCl for 7 days. Exposure occurred from the test surface only.
6.2.2.1.2 Modified CDF test
The CDF test was modified in a sense that samples were preconditioned at >95% RH and 20 ± 2 °C, instead of 65 % RH and 20 ºC prescribed in the test. Each
temperature cycles consists of: · cooling from 20 °C to -20 °C in 4 hours · 3 hours at -20 °C · heating from -20 °C to 20 °C in 4 hours · 1 hour at 20 °C · start of new cycle
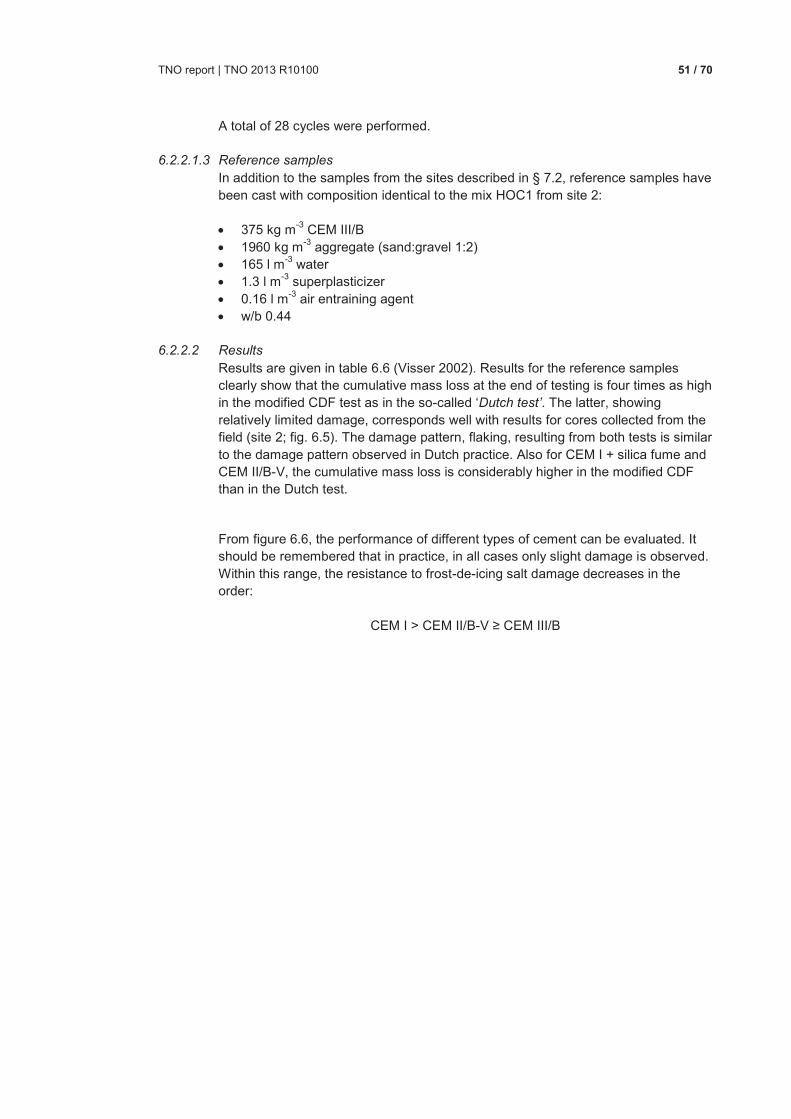
TNO report | TNO 2013 R10100 51 / 70
A total of 28 cycles were performed.
6.2.2.1.3 Reference samples
In addition to the samples from the sites described in § 7.2, reference samples have been cast with composition identical to the mix HOC1 from site 2: · 375 kg m-3 CEM III/B · 1960 kg m-3 aggregate (sand:gravel 1:2) · 165 l m-3 water · 1.3 l m-3 superplasticizer · 0.16 l m-3 air entraining agent · w/b 0.44
6.2.2.2 Results
Results are given in table 6.6 (Visser 2002). Results for the reference samples clearly show that the cumulative mass loss at the end of testing is four times as high in the modified CDF test as in the so-called ‘Dutch test’. The latter, showing relatively limited damage, corresponds well with results for cores collected from the field (site 2; fig. 6.5). The damage pattern, flaking, resulting from both tests is similar to the damage pattern observed in Dutch practice. Also for CEM I + silica fume and CEM II/B-V, the cumulative mass loss is considerably higher in the modified CDF than in the Dutch test. From figure 6.6, the performance of different types of cement can be evaluated. It should be remembered that in practice, in all cases only slight damage is observed. Within this range, the resistance to frost-de-icing salt damage decreases in the order:
CEM I > CEM II/B-V ≥ CEM III/B
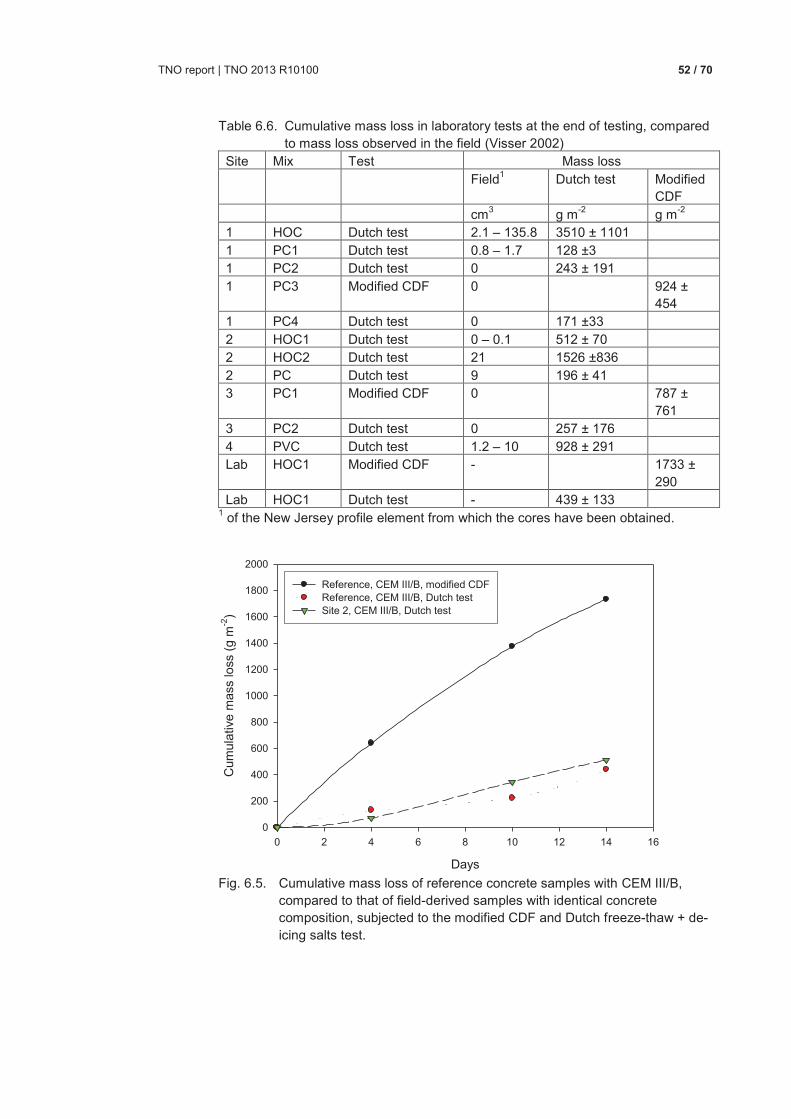
TNO report | TNO 2013 R10100 52 / 70
Table 6.6. Cumulative mass loss in laboratory tests at the end of testing, compared to mass loss observed in the field (Visser 2002)
Site Mix Test Mass loss
Field1 Dutch test Modified CDF
cm3 g m-2 g m-2
1 HOC Dutch test 2.1 – 135.8 3510 ± 1101
1 PC1 Dutch test 0.8 – 1.7 128 ±3
1 PC2 Dutch test 0 243 ± 191
1 PC3 Modified CDF 0 924 ± 454
1 PC4 Dutch test 0 171 ±33
2 HOC1 Dutch test 0 – 0.1 512 ± 70
2 HOC2 Dutch test 21 1526 ±836
2 PC Dutch test 9 196 ± 41
3 PC1 Modified CDF 0 787 ± 761
3 PC2 Dutch test 0 257 ± 176
4 PVC Dutch test 1.2 – 10 928 ± 291
Lab HOC1 Modified CDF - 1733 ± 290
Lab HOC1 Dutch test - 439 ± 133 1 of the New Jersey profile element from which the cores have been obtained.
Fig. 6.5. Cumulative mass loss of reference concrete samples with CEM III/B,
compared to that of field-derived samples with identical concrete composition, subjected to the modified CDF and Dutch freeze-thaw + de-icing salts test.
Days
0 2 4 6 8 10 12 14 16
Cum
ula
tive m
ass
loss
(g m
-2)
0
200
400
600
800
1000
1200
1400
1600
1800
2000
Reference, CEM III/B, modified CDFReference, CEM III/B, Dutch testSite 2, CEM III/B, Dutch test
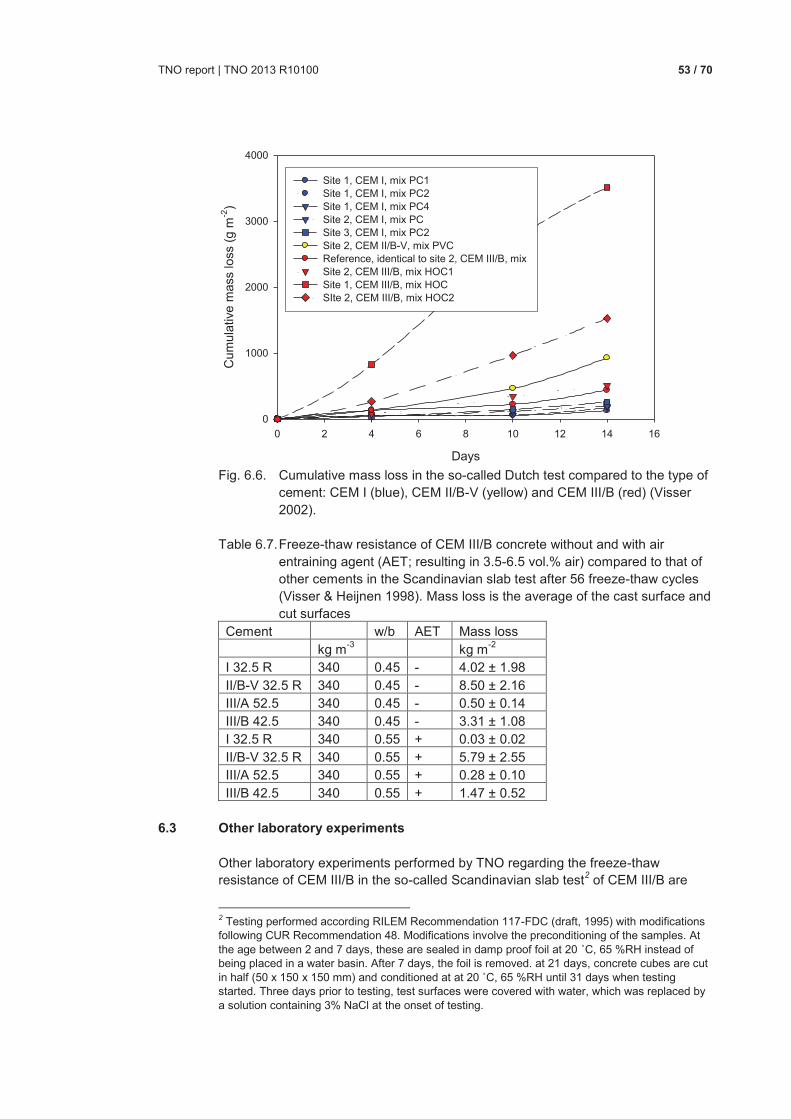
TNO report | TNO 2013 R10100 53 / 70
Fig. 6.6. Cumulative mass loss in the so-called Dutch test compared to the type of
cement: CEM I (blue), CEM II/B-V (yellow) and CEM III/B (red) (Visser 2002).
Table 6.7. Freeze-thaw resistance of CEM III/B concrete without and with air
entraining agent (AET; resulting in 3.5-6.5 vol.% air) compared to that of other cements in the Scandinavian slab test after 56 freeze-thaw cycles (Visser & Heijnen 1998). Mass loss is the average of the cast surface and cut surfaces
Cement w/b AET Mass loss
kg m-3 kg m-2
I 32.5 R 340 0.45 - 4.02 ± 1.98
II/B-V 32.5 R 340 0.45 - 8.50 ± 2.16
III/A 52.5 340 0.45 - 0.50 ± 0.14
III/B 42.5 340 0.45 - 3.31 ± 1.08
I 32.5 R 340 0.55 + 0.03 ± 0.02
II/B-V 32.5 R 340 0.55 + 5.79 ± 2.55
III/A 52.5 340 0.55 + 0.28 ± 0.10
III/B 42.5 340 0.55 + 1.47 ± 0.52
6.3 Other laboratory experiments
Other laboratory experiments performed by TNO regarding the freeze-thaw resistance of CEM III/B in the so-called Scandinavian slab test2 of CEM III/B are
2 Testing performed according RILEM Recommendation 117-FDC (draft, 1995) with modifications following CUR Recommendation 48. Modifications involve the preconditioning of the samples. At the age between 2 and 7 days, these are sealed in damp proof foil at 20 ˚C, 65 %RH instead of being placed in a water basin. After 7 days, the foil is removed. at 21 days, concrete cubes are cut in half (50 x 150 x 150 mm) and conditioned at at 20 ˚C, 65 %RH until 31 days when testing started. Three days prior to testing, test surfaces were covered with water, which was replaced by a solution containing 3% NaCl at the onset of testing.
Days
0 2 4 6 8 10 12 14 16
Cum
ula
tive m
ass
loss
(g m
-2)
0
1000
2000
3000
4000
Site 1, CEM I, mix PC1Site 1, CEM I, mix PC2Site 1, CEM I, mix PC4Site 2, CEM I, mix PCSite 3, CEM I, mix PC2Site 2, CEM II/B-V, mix PVCReference, identical to site 2, CEM III/B, mix Site 2, CEM III/B, mix HOC1Site 1, CEM III/B, mix HOCSIte 2, CEM III/B, mix HOC2
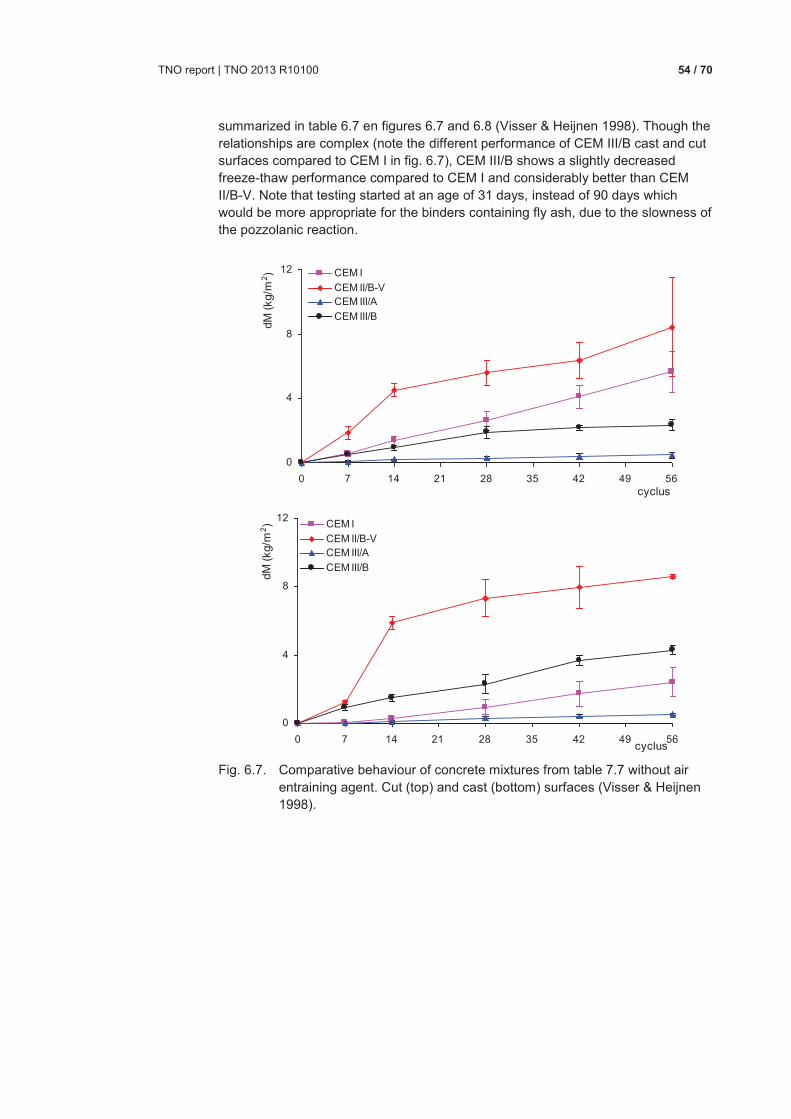
TNO report | TNO 2013 R10100 54 / 70
summarized in table 6.7 en figures 6.7 and 6.8 (Visser & Heijnen 1998). Though the relationships are complex (note the different performance of CEM III/B cast and cut surfaces compared to CEM I in fig. 6.7), CEM III/B shows a slightly decreased freeze-thaw performance compared to CEM I and considerably better than CEM II/B-V. Note that testing started at an age of 31 days, instead of 90 days which would be more appropriate for the binders containing fly ash, due to the slowness of the pozzolanic reaction.
Fig. 6.7. Comparative behaviour of concrete mixtures from table 7.7 without air
entraining agent. Cut (top) and cast (bottom) surfaces (Visser & Heijnen 1998).
0
4
8
12
0 7 14 21 28 35 42 49 56cyclus
dM
(kg/m
2) CEM I
CEM II/B-VCEM III/A
CEM III/B
0
4
8
12
0 7 14 21 28 35 42 49 56cyclus
dM
(kg
/m2) CEM I
CEM II/B-VCEM III/A
CEM III/B
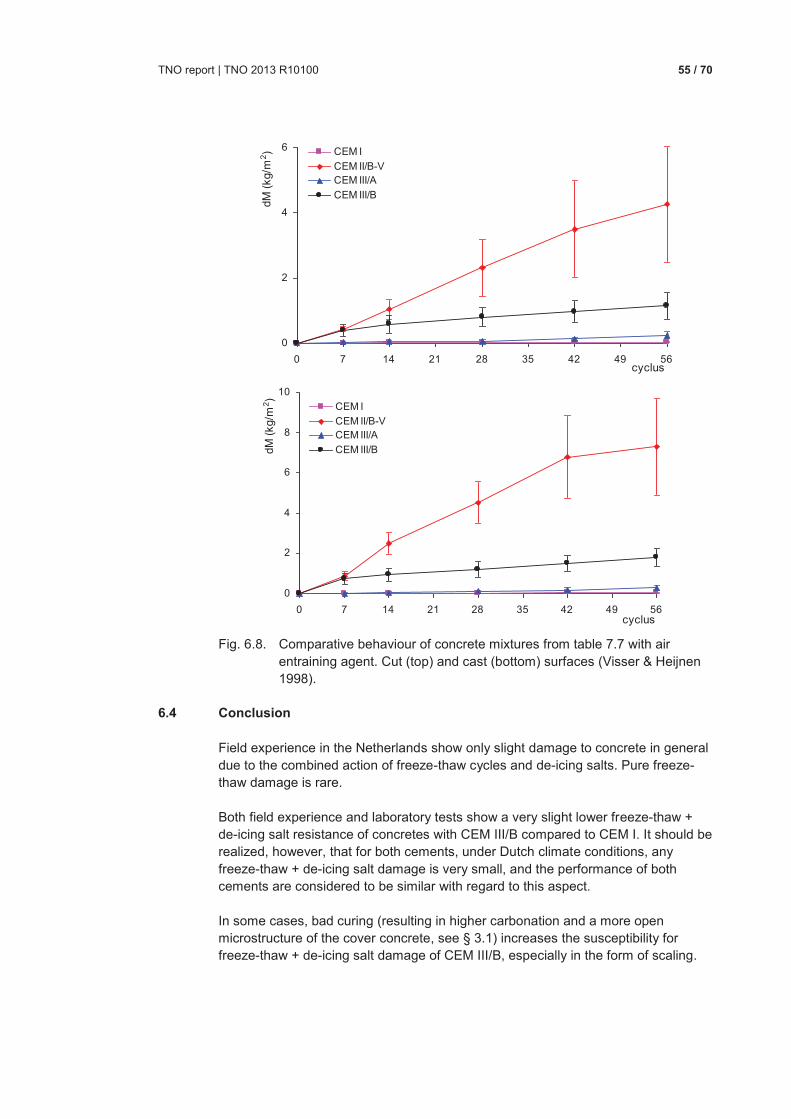
TNO report | TNO 2013 R10100 55 / 70
Fig. 6.8. Comparative behaviour of concrete mixtures from table 7.7 with air
entraining agent. Cut (top) and cast (bottom) surfaces (Visser & Heijnen 1998).
6.4 Conclusion
Field experience in the Netherlands show only slight damage to concrete in general due to the combined action of freeze-thaw cycles and de-icing salts. Pure freeze-thaw damage is rare. Both field experience and laboratory tests show a very slight lower freeze-thaw + de-icing salt resistance of concretes with CEM III/B compared to CEM I. It should be realized, however, that for both cements, under Dutch climate conditions, any freeze-thaw + de-icing salt damage is very small, and the performance of both cements are considered to be similar with regard to this aspect. In some cases, bad curing (resulting in higher carbonation and a more open microstructure of the cover concrete, see § 3.1) increases the susceptibility for freeze-thaw + de-icing salt damage of CEM III/B, especially in the form of scaling.
0
2
4
6
0 7 14 21 28 35 42 49 56cyclus
dM
(kg/m
2) CEM I
CEM II/B-VCEM III/A
CEM III/B
0
2
4
6
8
10
0 7 14 21 28 35 42 49 56cyclus
dM
(kg/m
2)
CEM I
CEM II/B-VCEM III/A
CEM III/B
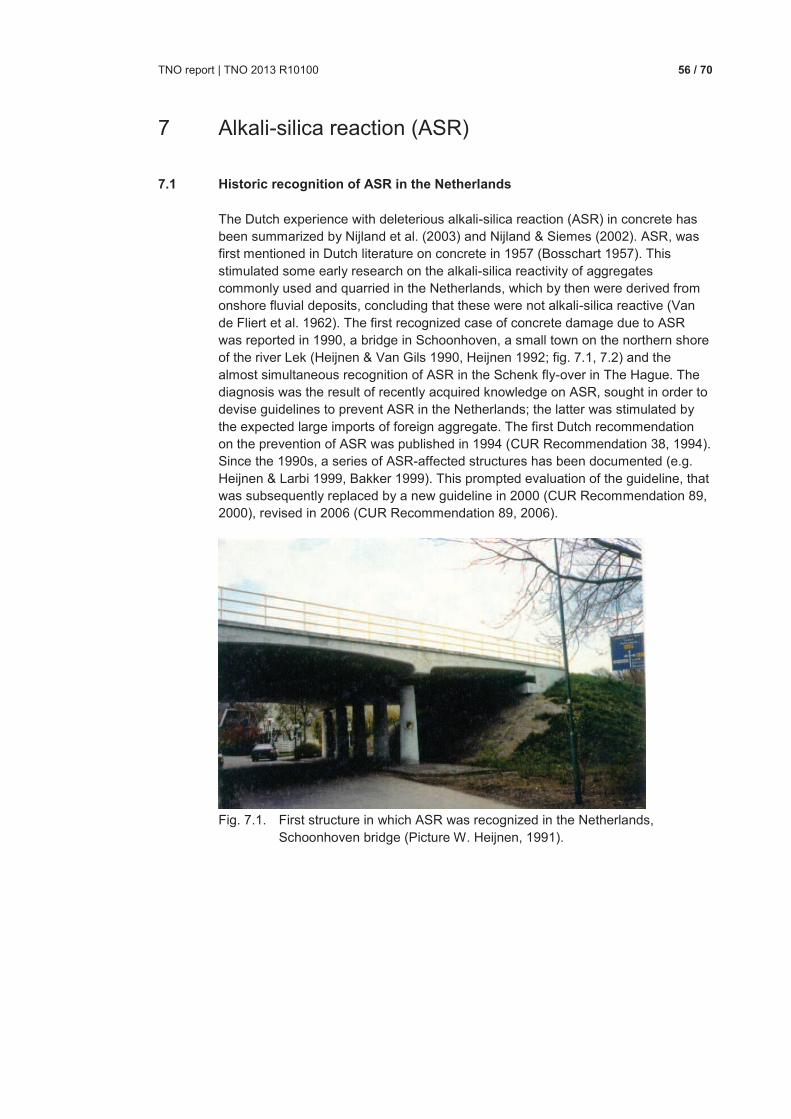
TNO report | TNO 2013 R10100 56 / 70
7 Alkali-silica reaction (ASR)
7.1 Historic recognition of ASR in the Netherlands
The Dutch experience with deleterious alkali-silica reaction (ASR) in concrete has been summarized by Nijland et al. (2003) and Nijland & Siemes (2002). ASR, was first mentioned in Dutch literature on concrete in 1957 (Bosschart 1957). This stimulated some early research on the alkali-silica reactivity of aggregates commonly used and quarried in the Netherlands, which by then were derived from onshore fluvial deposits, concluding that these were not alkali-silica reactive (Van de Fliert et al. 1962). The first recognized case of concrete damage due to ASR was reported in 1990, a bridge in Schoonhoven, a small town on the northern shore of the river Lek (Heijnen & Van Gils 1990, Heijnen 1992; fig. 7.1, 7.2) and the almost simultaneous recognition of ASR in the Schenk fly-over in The Hague. The diagnosis was the result of recently acquired knowledge on ASR, sought in order to devise guidelines to prevent ASR in the Netherlands; the latter was stimulated by the expected large imports of foreign aggregate. The first Dutch recommendation on the prevention of ASR was published in 1994 (CUR Recommendation 38, 1994). Since the 1990s, a series of ASR-affected structures has been documented (e.g. Heijnen & Larbi 1999, Bakker 1999). This prompted evaluation of the guideline, that was subsequently replaced by a new guideline in 2000 (CUR Recommendation 89, 2000), revised in 2006 (CUR Recommendation 89, 2006).
Fig. 7.1. First structure in which ASR was recognized in the Netherlands,
Schoonhoven bridge (Picture W. Heijnen, 1991).
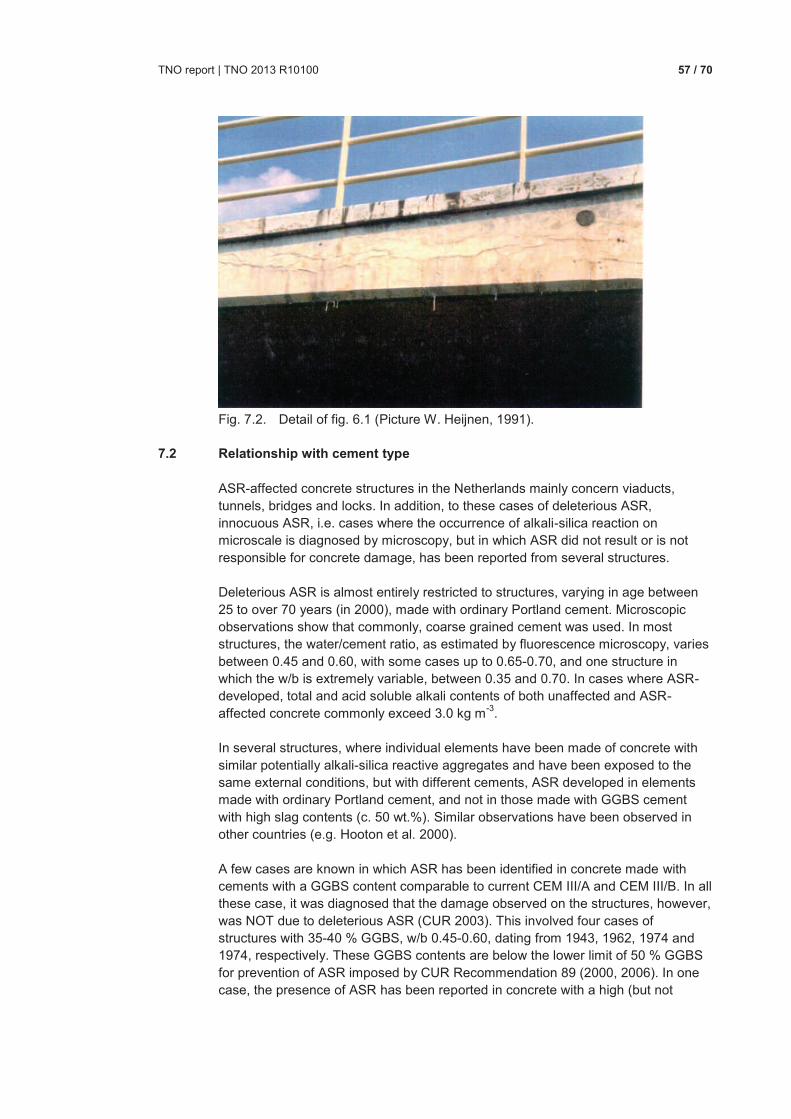
TNO report | TNO 2013 R10100 57 / 70
Fig. 7.2. Detail of fig. 6.1 (Picture W. Heijnen, 1991).
7.2 Relationship with cement type
ASR-affected concrete structures in the Netherlands mainly concern viaducts, tunnels, bridges and locks. In addition, to these cases of deleterious ASR, innocuous ASR, i.e. cases where the occurrence of alkali-silica reaction on microscale is diagnosed by microscopy, but in which ASR did not result or is not responsible for concrete damage, has been reported from several structures. Deleterious ASR is almost entirely restricted to structures, varying in age between 25 to over 70 years (in 2000), made with ordinary Portland cement. Microscopic observations show that commonly, coarse grained cement was used. In most structures, the water/cement ratio, as estimated by fluorescence microscopy, varies between 0.45 and 0.60, with some cases up to 0.65-0.70, and one structure in which the w/b is extremely variable, between 0.35 and 0.70. In cases where ASR-developed, total and acid soluble alkali contents of both unaffected and ASR-affected concrete commonly exceed 3.0 kg m-3. In several structures, where individual elements have been made of concrete with similar potentially alkali-silica reactive aggregates and have been exposed to the same external conditions, but with different cements, ASR developed in elements made with ordinary Portland cement, and not in those made with GGBS cement with high slag contents (c. 50 wt.%). Similar observations have been observed in other countries (e.g. Hooton et al. 2000). A few cases are known in which ASR has been identified in concrete made with cements with a GGBS content comparable to current CEM III/A and CEM III/B. In all these case, it was diagnosed that the damage observed on the structures, however, was NOT due to deleterious ASR (CUR 2003). This involved four cases of structures with 35-40 % GGBS, w/b 0.45-0.60, dating from 1943, 1962, 1974 and 1974, respectively. These GGBS contents are below the lower limit of 50 % GGBS for prevention of ASR imposed by CUR Recommendation 89 (2000, 2006). In one case, the presence of ASR has been reported in concrete with a high (but not
TNO report | TNO 2013 R10100 58 / 70
determined) GGBS content from 1935 (demolished now); in two cases, the presence of ASR was been reported in concretes with GGBS content above 65, both built in 1976. Reinvestigation of these structures has definitively shown that concrete damage was not due to ASR. The actual cause of concrete damage in these structures varies. Shrinkage and frost, leading to cracking of the concrete, have been involved in some cases (CUR 2003). Since 2000, no new cases of either deleterious or innocuous ASR in concrete structures made with either CEM III/A or CEM III/B have come to the attention of TNO.
7.3 Conclusion
Experience in the Netherlands has shown that cements with sufficiently high GGBS contents (above 50 %) adequately prevent the development of deleterious ASR in concrete. Dutch regulations, i.e CUR Recommendation 89 (2006), rely on experience rather than experiments in specifying cement with sufficient high GGBS (or fly ash) contents in order to prevent deleterious ASR. Experiments reported in literature, however, support this experience (Smolczyk 1974, Siebel et al. 2001, 2002).
TNO report | TNO 2013 R10100 59 / 70
8 Summary of performance of CEM III/B in Dutch concretes
The durability performance of CEM III/B (with about 70% GGBS) concrete in the Netherlands can be summarized as follows: · Chloride penetration is considerably slower and less deep for CEM III/B
compared to CEM I concrete at similar chloride surface contents, as reflected by lower diffusion coefficients.
· Decrease of apparent chloride diffusion coefficients with age is stronger for CEM III/B than for CEM I, with higher electrical resistivity and lower corrosion rate after depassivation for CEM III/B concrete; the latter shows excellent behaviour with respect to reinforcement corrosion.
· CEM III/B hydration is slower than CEM I hydration; sufficiently long wet curing is required.
· Carbonation of CEM III/B concrete is faster (in particular in laboratory experiments) than CEM I concrete and results in a more open microstructure. In practice, however, carbonation depths are shallow en pose no problem with respect to reinforcement corrosion for cover depths in the usual range for civil engineering structures.
· Freeze-thaw + de-icing salt resistance of CEM III/B concrete is slightly lower than that of CEM I concrete.
· Under Dutch climate conditions, any freeze-thaw + de-icing salt damage of concrete is very small and the performance of CEM III/B and CEM I concrete are considered to be similar with regard to this aspect.
· In some cases, bad curing (resulting in higher carbonation and a more open microstructure of the cover concrete) increases the susceptibility for freeze-thaw + de-icing salt damage of CEM III/B, especially in the form of scaling, at young age.
· Experience in the Netherlands has shown that deleterious ASR does not occur in concretes with either CEM III/B or CEM III/A with over 50 % GGBS, whilst potentially alkali-silica reactive aggregate is used.
TNO report | TNO 2013 R10100 60 / 70
9 References
9.1 Standards, recommendations and guidelines
BRL 9325, 2006. Nationale beoordelingsrichtlijn voor het KOMO® productcertificaat voor gemalen gegranuleerde hoogovenslak voor het gebruik als bindmiddel met Portland cement (CEM I) in beton. BMC, Gouda. BRL 9340, 2007. Nationale beoordelingsrichtlijn voor het KOMO® attest voor een combinatie van gemalen gegranuleerde hoogovenslak, poederkoolvliegas en Portland cement voor toepassing als bindmiddel in beton. BMC, Gouda. CUR Guideline 1, 2009, Duurzaamheid van constructief beton met betrekking tot chloride-geïnitieerde wapeningscorrosie. CUR, Gouda. CUR Recommendation 38, 1994. Maatregelen om schade aan beton door de alkali-silicareactie (ASR) te voorkomen. CUR, Gouda. CUR Recommendation 48, 1999. Geschiktheidsonderzoek van nieuwe cementen voor algemene toepassing in beton. CUR, Gouda. CUR Recommendation 66, 1998. Toepassing van poederkoolvliegas in mortel en beton. CUR, Gouda. CUR Recommendation 89, 2000. Maatregelen ter voorkoming van betonschade door alkali-silicareactie (ASR). CUR, Gouda. CUR Recommendation 89, 2006. Maatregelen ter voorkoming van betonschade door alkali-silicareactie (ASR). 2nd revised edition, CUR, Gouda. EN 197-1, 2011. Cement - Part 1: Composition, specifications and conformity criteria for common cements. NEN, Delft. EN 450-1, 2012. Fly ash for concrete - Part 1: Definition, specifications and conformity criteria. NEN, Delft. EN 13670, 2009. Execution of concrete structures. NEN, Delft. GBV 1918. Gewapend Beton Voorschriften, voorzien van toelichtingen en tekstfiguren door A.A. van der Vooren. 2nd ed.,L.J. Veen, Amsterdam. N 484, 1933. Hoogovencement - Definitie en keuringsvoorschriften. NEN, Delft. NEN 3550, 1995. Cement. Definities, eisen en keuringscriteria. NEN, Delft. NEN 3550, 2006. Cement volgens NEN-EN 197-1, NEN-EN 197-4 of NEN-EN 14216, met aanvullende speciale eigenschappen – Definities en eisen. NEN, Delft. NEN 3550, 2012. Cement volgens NEN-EN 197-1, NEN-EN 197-4 of NEN-EN 14216, met aanvullende speciale eigenschappen – Definities en eisen. NEN, Delft.
TNO report | TNO 2013 R10100 61 / 70
NEN 5950, 1986. Voorschriften Beton Technologie (VBT 1986) - Eisen, vervaardiging en keuring. NEN, Delft. NEN 8005, 2008. Nederlandse invulling van NEN-EN 206-1: Beton - Deel 1: Specificatie, eigenschappen, vervaardiging en conformiteit. NEN, Delft. RILEM Recommendation 117-FDC, 1995 (draft). Freeze-thaw and de-icing resistance of concrete: Draft recommendations for test methods for the freeze-thaw resistance of concrete. Slab test and cube test. Materials & Structures 28:366-371. ROK, 2013. Richtlijn Ontwerpen Kunstwerken, RTD 1001:2013, version 1.2. Ministry of Infrastructure, The Hague.
9.2 Literature and reports
Bakker, J.D., 1999. ASR in 20 bridges in and over motorway 59 in The Netherlands. Proceedings of the 8th International Conference on Structural Faults and Repair, London. Bakker, R.F.M., 1983. Permeability of blended cement concrete. In: Malhotra, V.M., ed., Fly ash, silica fume, slag and other mineral byproducts in concrete. ACI Pscial publication 79, 1:589–605. Bamforth, P.B., 1994. Admitting that chlorides are admitted. Concrete, nov./dec. 1994, 18-21. Bamforth, P.B., 1997. Corrosion of reinforcement in concrete caused by wetting and drying cycles in chloride-containing environments - Results obtained from RC blocks exposed for 9 years adjacent to bridge piers on the A19 near Middlesborough. Taywood Engineering Ltd report PBB/BM/1746. Bamforth, P.B. & Chapman-Andrews, J., 1994. Long term performance of RC elements under UK coastal conditions. In: Swamy, R.N., ed., Proceedings, International Conference on Corrosion and Corrosion Protection of Steel in Concrete. Sheffield Academic Press, 139-156. Barker, A.P., 1989. An electron optical examination of zoning in blastfurnace slag hydrates: Part I. Slag cement pastes at early ages. Advances in Cement Research 2:171-179. Bertolini, L., Elsener, B., Pedeferri, P. & Polder, R.B., 2004. Corrosion of steel in concrete: Prevention, diagnosis, repair. Wiley-VCH Verlag, Weinheim. Bertolini, L. & Polder, R.B., 1997. Concrete resistivity and reinforcement corrosion rate as a function of temperature and humidity of the environment. TNO report 97-BT-R0574. Betoniek, 1996. Bellen in beton. Betoniek, november/december 1996.
TNO report | TNO 2013 R10100 62 / 70
Bijen, J., 1996. Blast furnace slag cement for durable marine structures. VNC, 's-Hertogenbosch. Bosschart, R.A.J., 1957. Alkali-reacties van de toeslag in beton. Cement 9:494-500. Bouwmeester – van den Bos, W.J., 2008. Influence of curing on the pore structure of concrete. In: Walraven, J.C. & Stoelhorst, D., eds., Tailor made concrete structures. CRC Press, Boca Raton, 65-70. Bouwmeester-van de Bos, J., Polder, R.B. & Lollini, F., 2010. The effect of curing on the microstructure and chloride penetration resistance of concrete. In: Breugel, K. van, Ye, G. & Yuan, Y., eds., Proceedings, 2nd International Conference on Service Life Design, Delft, 919-928. Breit, W., 1998. Critical chloride content – Investigations of steel in alkaline chloride solutions. Materials and Corrosion 49:539-550. Brodersen, H.A. & Bruckmann, J., 2000. Wirkungsmechanismen in hüttensand-haltigen Bindemitteln. In: 14th Ibausil, Weimar, 1:159-165. Bruckmann, J., 2004. Einfluss der Rohstoffauswahl auf die Eigenschaften von hüttensandhaltigen Zementen. Beton-Informationen 44(2/3)29-36. Bürchler, D., Elsener, B. & Böhni, H., 1996, Electrical resistivity and dielectric properties of hardened cement paste and mortar. In: Page, C.L., Bamforth, P.B., & Figg, J.W., eds., Proceedings of the 4th International Symposium on Corrosion of Reinforcement in Concrete Construction. Society of Chemical Industry, Cambridge, 283-293. Caballero, J., Polder, R.B., Leegwater, G. & Fraaij, A., 2010. Chloride penetration into cementitious mortar at early age. In: Breugel, K. van, Ye, G. & Yuan, Y., eds., Proceedings, 2nd International Conference on Service Life Design, Delft, 65-72. Caballero, J., Polder, R.B., Leegwater, G. & Fraaij, A., 2013. Chloride penetration into cementitious mortar at early age. Heron, in preparation. Chen, W. & Brouwers, H.J.H., 2007. The hydration of slag, part 2: Reaction models for blended cement. Journal of Materials Science 42:444-464. Clear, C.A., 1994. Formwork striking times for ground granulated blast furnace slag concrete: Test and site results. Proceedings of the Institute of Civil Engineers, Structures and Buildings 104:441-448. Çopuroğlu, O., 2006. Frost salt scaling of cement-based materials with a high slag content. PhD thesis, Delft University of Technology, Delft. CUR, 1981. Duurzaamheid maritieme constructiees. CUR, Gouda, CUR report 100. Durability of marine concrete structures, in Dutch. CUR, 2003. Achtergronden bij CUR-Aanbeveling 89. Maatregelen ter voorkoming van betonschade door alkali-silicareacite (ASR). CUR, Gouda. CUR report 2003-1.
TNO report | TNO 2013 R10100 63 / 70
Demoulian, E., Gourdin, P., Hawthorn, F. & Vernet, C., 1980. Influence de la composition chimique et de la texture des laitiers sur leur hydraulicité. Proceedings of the 7th International Congress on the Chemistry of Cement, Paris, 2:III-89-III-94. Dolbor, F.C., 1961. Einfluss der Abkuhlungsbedingungen und der chemischen Zusammensetzung auf die hydraulischen Eigenschaften von Hämatitschlacken. PhD thesis, Technische Hochschule Aachen. DuraCrete, 1998. Statistical Quantification, Material Parameter, DuraCrete Task 4 Working report BE95-1347/TG4/D. DuraCrete R17, 2000. DuraCrete Final Technical Report. Document BE95-1347/R17. The European Union – Brite EuRam III, DuraCrete – Probabilistic Performance based Durability Design of Concrete Structures. CUR, Gouda.
Escalante, J.I., Gómez, L.Y., Johal, K.K., Mendoza, G., Mancha, H. & Méndez, J., 2001. Reactivity of blast furnace slag in Portland cement blends hydrated under different conditions. Cement & Concrete Research 31:1403-1409. Feng, Q.L., Lachowski, E.E. & Glasser, F.P., 1989. Densification and migration of ions in blast furnace slag – Portland cement pastes. Material Research Society Symposium Proceedings 136:263-272. Fiore, S., Polder, R.B. & Cigna, R., 1996. Evaluation of the concrete corrosivity by means of resistivity measurements. In: Page, C.L., Bamforth, P.B. & Figg, J.W., eds., Proceedings, Fourth International Symposium on Corrosion of Reinforcement in Concrete Construction. Society of Chemical Industry, Cambridge, 273-282. Fliert, C. van de, Hove, J.F. ten & Schrap, L.W., 1962. Alkali-aggregaatreactie in beton. Cement 14:20-28. Frederiksen, J.M., Sørensen, H.E., Andersen, A. & Klinghoffer, O., 1997. The effect of the w/b ratio on chloride transport into concrete – immersion, migration and resistivity tests. Danish Road Directorate, Copenhagen, HETEK report 54. Gehlen, C., 2000. Probabilistische Lebensdauerbemessung von Stahlbeton-bauwerken. Deutscher Ausschuss für Stahlbeton 510. Gollop, R.S. & Taylor, H.F.W., 1996a. Microstructural and microanalytical studies of sulfate attack. IV. Reactions of a slag cement paste with sodium and magnesium sulfate solutions. Cement & Concrete Research 26:1013-1028. Gollop, R.S. & Taylor, H.F.W., 1996b. Microstructural and microanalytical studies of sulfate attack. V. Comparison of different slag blends. Cement & Concrete Research 26:1029-1044. Harrison, A.M., Winter, N.B. & Taylor, H.F.W., 1987. Microstructure and microchemistry of slag cement pastes. Materials Research Society Symposium Proceedings 85:213-222. Heerding, A., 1971. Cement in Nederland. CEMIJ, IJmuiden.
TNO report | TNO 2013 R10100 64 / 70
Heinemann, H.A., 2013. Historic concrete.From concrete repair to concrete conservation. PhD thesis, Delft University of Technology, Delft. Heinemann, H.A. & Nijland, T.G., 2009. Concrete in the Netherlands: Historic use of components and conservation. Proceedings of the 3rd International Congress on Construction History, Cottbus, 791-797. Heijnen, W.M.M., 1992. Alkali-aggregate reactions in the Netherlands. Proceedings of the 9th International Conference on Alkali-Aggregate Reaction in Concrete, London, 432-439. Heijnen, W.M.M. & Gils, F.A.J. van, 1990. Inspectie viaduct in rondweg te Schoon hoven. Alkali-silicareactie nu ook in Nederland. TNO report BI-90-824. Heijnen, W.M.M. & Larbi, J.A., 1999. Preventive measures against concrete damage to ASR in the Netherlands - current state-of-affairs. Heron 44:285-298. Holden, W.R., Page, C.L. & Short, N.R., 1983. The influence of chlorides and sulphates on durability. In: Crane, A.P., ed., Corrosion of reinforcement in concrete construction. Ellis Horwood Ltd., Chichester, 143-150. Hooton, R.D., 1987. The reactivity and hydration products of blast-furnace slag. In: Malhotra, V.M., ed., Supplementary cementing materials for concrete. Ministry of Supply and Services Canada, Ottawa, 245-288. Hooton, D., Donnelly, C.R., Clarida, B. & Rogers, C.A., 2000. An assessment of the effectiveness of blast-furnace slag in counteracting the effects of alkali-silica reaction. In: Bérubé, M.A., Fournier, B. & Durand, B., eds., Proceedings of the 11th International Conference on Alkali-Aggregate Reaction, Quebec, 1313-1322. Kloes, J.A. van der, 1924. Onze bouwmaterialen. Deel III. Mortels en beton. L.J. Veen, Amsterdam. Kolyvas, C., Schlangen, E. & Bouwmeester-van den Bos, W.J., 2007. Influence of curing methods on transport properties of cover concrete. In: Audenaert, K., Marsavina, I. & Schutter, G. de, eds., Transport mechanisms in cracked concrete. Acco, Leuven, 87-98. Lang, E., 2003. Einfluss unterschiedlicher Karbonatphasen auf den Frost-Tausalzwiderstand – Labor- und Praxisverhalten. Beton-Informationen (3):39-59. Lanser, P., 2009. Lijdend voorwerp of bindend element. Cement (3):36-40. Larbi, J.A., Fraay, A.L.A. & Bijen, J.M.J.M., 1990. The chemistry of the pore fluid of silica-fume blended cement systems. Cement & Concrete Research 20:506-516. Neville, A.M., 1996. Properties of concrete, 4th ed., John Wiley & Sons, New York. Nijland, T.G., 2000a. VODOSCHA 2 Velserverkeerstunnel. Nebest bv, report B-2461a.
TNO report | TNO 2013 R10100 65 / 70
Nijland, T.G., 2000b. VODOSCHA 2 Zeeburgertunnel. Nebest bv, report B-2461d. Nijland, T.G., 2000a. VODOSCHA 2 Aquaduct Grouw. Nebest bv, report B-2461c. Nijland, T.G., 2000a. VODOSCHA 2 Onderdoorgang Bosch en Lommer. Nebest bv, report B-2461b. Nijland, T.G., 2000e. VODOSCHA 2 Evaluatie chlorideprofielen in termen van diffusie. Nebest bv, report B-2461e. Nijland, T.G. & Heinemann, H.A., 2008. Beton, een materiaalgescheidenis vanuit de componenten. Praktijkreeks Cultureel Erfgoed 4(12), 28 pp. Nijland, T.G., Larbi, J.A. & Siemes, A.J., 2003. Experience of ASR in the Netherlands. EMSAGG Conference European marine sand and gravel - shaping the future', Delft University of Technoloy, febr. 2003. Nijland, T.G. & Siemes, A.J., 2002. Alkali-silica reaction in the Netherlands: Experiences and current research. Heron 47:81-85. Osterminski, K., Polder, R.B. & Schiessl, P., 2012. Long term electrical resistivity of concrete. Heron, in preparation. Pacheco, J., Morales-Nápoles, O. & Polder, R.B., 2012. Statistical analysis of electrical resistivity as a tool for estimating cement type of 12-year-old concrete specimens. In: Alexander, M.G., Beushausen, H.D. & Dehn, F., eds., International Conference on Concrete Repair, Rehabilitation and Retrofitting III. Taylor & Francis, London, 701-706. Page, C.L., Short, N. R. & El Tarras, A., 1981. Diffusion of chloride ions in hardened cement paste. Cement & Concrete Research 11:395-406. Page, C.L. & Vennesland, Ø., 1983. Pore solution composition and chloride binding capacity of silica fume cement pastes. Materials & Structures 16:19-25. Passow, H., 1913. Hochofenzement, kurzer Leitfaden für die Erzeugung und Verwendung von Hochofenzement. Verlag der Tonindustrie-Zeitung, Berlin. Polder, R.B., 1986. Chloride in cement-sand mortar - A. Expression experiments, TNO report BI-86-21. Polder, R.B., 1997. Chloride diffusion and resistivity testing of five concrete mixes for marine environment. In: Nilsson, L.O. & Ollivier, P., eds., Proceedings, RILEM. International Workshop on Chloride Penetration into Concrete, St-Remy-les-Chevreuses. RILEM, 225-233. Polder, R.B., 1998, Further study of hydrophobic treatment of concrete – final report, TNO report 98-BT-R0270/3, June 1998. Vervolgonderzoek naar het hydrofoberen van beton – Eindrapport, in Dutch.
TNO report | TNO 2013 R10100 66 / 70
Polder, R.B., 2000a. Simulated de-icing salt exposure of blended cement concrete - chloride penetration. In: Andrade, C. & Kropp, J., eds., Proceedings, 2nd Int. RILEM Workshop Testing and Modelling the Chloride Ingress into Concrete. RILEM Publications PRO 19:189-202. Polder, R.B., 2000b. Corrosion protection of concrete with fly ash cement and other binders. TNO report 2000-BT-MK-R0018-02. Polder, R.B., 2009. Critical chloride content for reinforced concrete and its relationship to concrete resistivity. Materials and Corrosion 60:623-630. Polder, R.B., 2012a. Effects of slag and fly ash in concrete in chloride environment – Research from The Netherlands. Nordic Workshop, february 15-16, 2012. Norwegian Public Roads Administration, Oslo. Polder, R.B., 2012b. Effects of slag and fly ash in concrete in chloride environment – Research from The Netherlands. Heron, in press. Polder, R.B., Borsje, H., & Vries, J. de, 2001. Prevention of reinforcement corrosion by hydrophobic treatment of concrete. Heron 46:227-238. Polder, R.B. & Ketelaars, M.B.G., 1991. Electrical resistance of blast furnace slag cement and ordinary Portland cement concretes. In: Swamy, R.N., eds., Proceedings, International Conference Blended Cements in Construction, Sheffield. Elsevier, 401-415. Polder, R.B. & Larbi, J.A., 1995. Investigation of concrete exposed to North Sea water submersion for 16 years. Heron 40:31-56. Polder, R.B. & Peelen, W.H.A., 2002. Characterisation of chloride transport and reinforcement corrosion in concrete under cyclic wetting and drying by electrical resistivity. Cement & Concrete Composites 24:427-435. Polder, R.B., Peelen, W.H.A., Bertolini, L. & Guerrieri, M., 2002. Corrosion rate of rebars from linear polarization resistance and destructive analysis in blended cement concrete after chloride loading. In: 15th International Corrosion Congress, Granada, September 22-27 (on cd-rom). Polder, R.B. & Rooij, M.R. de, 2002. DuMaCon Phase 1- Miniproject Service life design of a quay wall - Final version. TNO report 2001-CI-R-0276-04. Polder, R.B. & Rooij, M.R. de, 2004. Duurzaamheid Mariene Constructies. TNO report 2004-CI-R0047-8. Polder, R.B. & Rooij, M.R. de, 2005. Durability of marine concrete structures – field investigations and modelling. Heron 50:133-143. Polder, R.B. & Visser, J., 2004. Redistribution of chloride in blended cement concrete during storage in various climates. In: 3rd RILEM Workshop Testing and Modelling Chloride Ingress into Concrete, September 9-10, 2002. RILEM Proceedings PRO 38, 347-359.
TNO report | TNO 2013 R10100 67 / 70
Polder, R.B., Walker, R. & Page, C.L., 1995. Electrochemical desalination of cores from a reinforced concrete coastal structure. Magazine of Concrete Research 47:321-327. Polder, R.B., Wegen, G. van der & Breugel, K. van, 2010. Guideline for service life design of structural concrete with regard to chloride induced corrosion – the approach in The Netherlands. In: Breygel, K. van, Ye, G. & Yan, Y., eds. Proceedings, 2nd International Conference on Service Life Design, Delft, 265-272. Polder, R.B., Wegen, G. van der & Breugel, K. van, 2011. Guideline for service life design of structural concrete – a performance based approach with regard to chloride induced corrosion. In: Dehn, F. & Beushausen, H., eds., Proceedings, fib Workshop Performance-based Specifications for Concrete, Leipzig, 25-34. Regourd, M., 1980. Structure and behaviour of slag Portland cement hydrates. Proceedings of the 7th International Congress on the Chemistry of Cement, Paris, 3:2-10-2-26. Richardson, I.G. & Groves, G.W., 1992. Microstructure and microanalysis of hardened cement pastes involving ground granulated blast-furnace slag. Journal of Materials Science 27:6204-6212. Ringers, J.A., 1924. De bouw van de nieuwe schutsluis te IJmuiden. Hoofdstuk 1. Voorbereidingen van de bouw. De Ingenieur 39(39):745-756. Rooij, M.R. de & Polder, R.B., 2002a. Duurzaamheid Pier Scheveningen. Onderzoek aan meetplaatsen - Eindversie -. TNO report 2001-CI-R1037-3. Rooij, M.R. de & Polder, R.B., 2002b. Duurzaamheidonderzoek aan palen Pier Scheveningen - Eindversie -. TNO report 2005-CI-1055-02. Rooij, M.R. de & Polder, R.B., 2003. Investigation of the concrete structure of the Eastern Scheldt Barrier after 20 years of exposure to marine environment -Final version -. TNO report 2002-CI-R2118-3. Rooij, M.R. de & Polder, R.B., 2004a. Investigation of the influence of marine exposure on concrete piers of the Haringvliet sluice complex. TNO report 2003-CI-R0122-2. Rooij, M.R. de & Polder, R.B., 2004b. Investigation of the influence of marine exposure to three quay walls in Rotterdam Harbour - Final version-. TNO report 2003-CI-R0082-5. Rooij, M. de, Polder, R.B. & Oosten, H. van, 2007. Validation of durability of cast in situ concrete of the Groene Hart railway tunnel. Heron 52:225-238. Rooij, M.R. de & Siemes, A.J., 2003a. Delft Cluster Project 01.02.06. Durability of underground concrete structures in the Netherlands; Investigation of the 1st Benelux Tunnel. TNO report 2002-CI-R2080-3.
TNO report | TNO 2013 R10100 68 / 70
Rooij, M.R. de & Siemes, A.J., 2003b. Delft Cluster Project 01.02.06. Durability of underground concrete structures in the Netherlands; Investigation of the Velsertunnel. TNO report 2002-CI-R2081-2. Scharroo, P.W., 1946. Scheikunde der bouwmaterialen. L.J. Veen, Amsterdam. Siebel, E., Bokern, J. & Sylla, H.M., 2001. Entwicklung neuer NA-Zemente auf Basis von Zementen mit Hüttensand als Hauptbestandteil (Teil 1). Beton 51, 693-697. Siebel, E., Bokern, J. & Sylla, H.M., 2002. Entwicklung neuer NA-Zemente auf Basis von Zementen mit Hüttensand als Hauptbestandteil (Teil 2). Beton 52, 47-50. Smolczyk, H.G., 1974. Slag cements and alkali-reactive aggregates. Proceedings of the 6th International Symposium on the Chemistry of Cement, Moscow. Smolczyk, H.G., 1980. Slag structure and identification of slags. Proceedings of the 7th International Congress on the Chemistry of Cement, Paris, 1:III-1/3-1/17. Tang, L., 1996. Electrically accelerated methods for determining chloride diffusivity in concrete. Magazine of Concrete Research 48:173-179. Tang, L. & Nilsson, L.O., 1992. Rapid determination of chloride diffusivity of concrete by applying an electric field. ACI Materials Journal 49:49-53. Tang, L. & Sørensen, H.E., 2001. Precision of the Nordic test methods for measuring the chloride diffusion/migration coefficients of concrete. Materials & Structures 34:479-485. Taylor, H.F.W., 1998. Cement chemistry. 2nd ed., Thomas Telford, London. Tellegen, C., 1924. De bouw van de nieuwe schutsluis te IJmuiden. Hoofdstuk 2. Bouw der schutkolk muren. De Ingenieur 39(40):767-773. Tritthart, J. & Geymayer, H., 1995. Änderungen des elektrischen Widerstandes in austrocknendem Beton. Zement und Beton 1:74-79. Uchikawa, H., 1986. Effect of blending components on hydration and structure formation. Proceedings 8th International Congress on the Chemistry of Cement, Rio de Janeiro, 3:249-280 VDZ, 1999. Activity report 1996-1999. Verlag Bau+Technik, Düsseldorf. Visser, J.A., 1927. Betonbedrijf aan het buitensluishoofd te IJmuiden. Bouwbedrijf 4(21):507-510 & 4(23):531-534. Visser, J.H.M., 1999. Vorstdooizoutschade aan beton: Literatuurstudie naar Nederlandse schadegevallen. TNO report 1999-BT-MK-R0284. Visser, J.H.M., 2000. Vorstdooizoutschade aan beton: Samenvattend rapport naar Nederlandse schadegevallen. TNO report 2000-BT-MK-R0231.
TNO report | TNO 2013 R10100 69 / 70
Visser, J.H.M., 2002. Vorstdooizoutbestandheid van betonkernen uit New-Jersey profielen volgens de CDF-test of een aan Nederlandse omstandigheden aangepaste test. TNO report 2002-CI-R2011. Visser, J.H.M. & Heijnen, W.M.M., 1998. Duurzaamheid van Hoogovencement 52,5. TNO report 98-BT-R0720-02. Visser, J.H.M. & Peelen, W.H., 2000. Vorstdooizoutschade aan beton: Klimaat- en strooizoutgegevens van Nederland. TNO report 2000-BT-MK-R0130. Visser, J. H.M. & Polder, R.B., 2006. Concrete binder performance evaluation in service life design. In: Kovler, K., ed., Proceedings, ConcreteLife'06 - International RILEM-JCI Seminar on Concrete Durability and Service Life Planning: Curing, Crack Control, Performance in Harsh Environments. RILEM. Wang, P.Z., Trettin, R. & Rudert, V., 2003. Einflussgröße auf die Reaktivität von Hüttensanden und ihre Beurteilung. In: 15th Ibausil, Weimar, 1:1321-1335. Wegen, G. van der, Polder, R.B. & Breugel, K. van, 2012, Guideline for service life design of structural concrete – a performance based approach with regard to chloride induced corrosion. Heron, in preparation. Wiebenga, J.G., 1980. Durability of concrete structures along the North Sea coast of the Netherlands. In: Performance of concrete in marine environment. ASTM Special Publication SP-65, 437-452. Wiebenga, J.C., 1987. Blast furnace slag cement in the Netherlands. In: International Workshop on Granulated Blast-Furnace Slag in Concrete, Mississanga, October 22-23, 1987. Also in TNO report BI-87-96.
9.3 Product information sheets
ENCI, 1998a. ENCI Productinformatie hoogovencement 42,5, CEM III/B 42,5 LH HS. ENCI, Maastricht. ENCI, 1998b. ENCI Productinformatie hoogovencement 42,5 plus, CEM III/B 42,5 LH HS plus. ENCI, IJmuiden. Holcim, 2011a. Holcim Productinformatie hoogovencement CEM III/B 42,5 N LH HSR LA, fabriek Haccourt. Holcim, Nijvel. Holcim, 2011b. Holcim Productinformatie hoogovencement CEM III/B 42,5 N LH HSR LA, fabriek Obourg. Holcim, Nijvel.

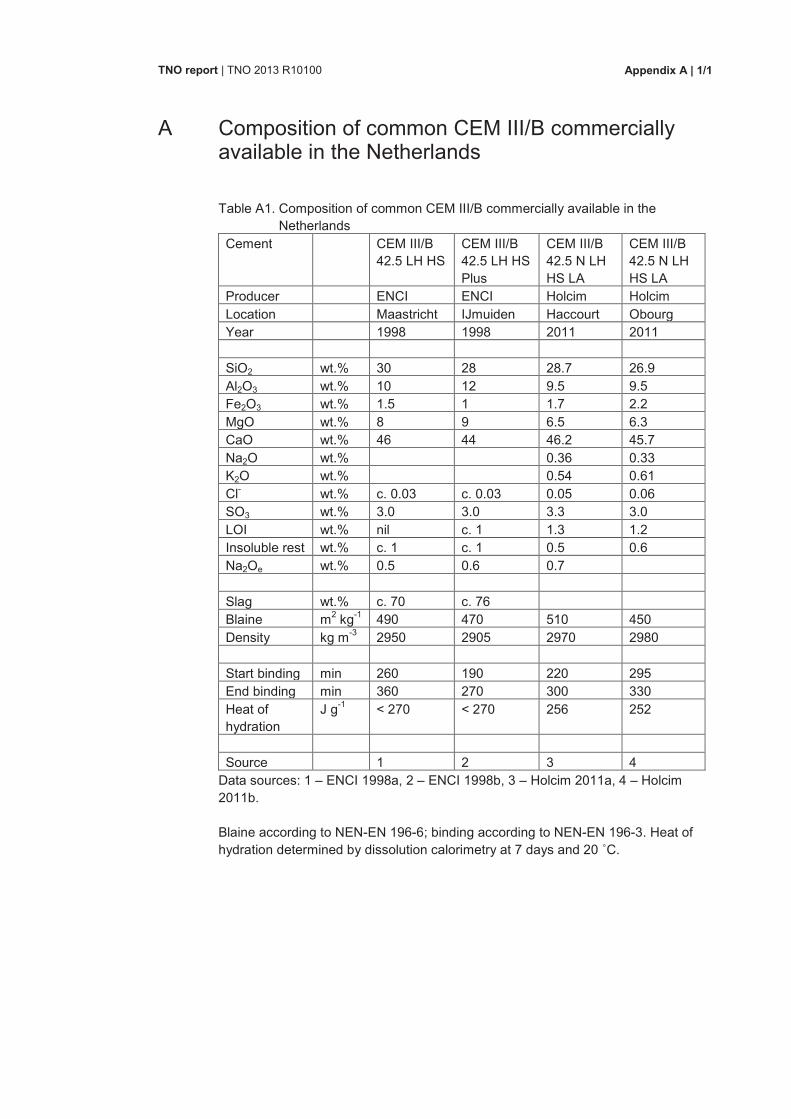
Appendix A | 1/1
TNO report | TNO 2013 R10100
A Composition of common CEM III/B commercially available in the Netherlands
Table A1. Composition of common CEM III/B commercially available in the Netherlands
Cement CEM III/B 42.5 LH HS
CEM III/B 42.5 LH HS Plus
CEM III/B 42.5 N LH HS LA
CEM III/B 42.5 N LH HS LA
Producer ENCI ENCI Holcim Holcim
Location Maastricht IJmuiden Haccourt Obourg
Year 1998 1998 2011 2011
SiO2 wt.% 30 28 28.7 26.9
Al2O3 wt.% 10 12 9.5 9.5
Fe2O3 wt.% 1.5 1 1.7 2.2
MgO wt.% 8 9 6.5 6.3
CaO wt.% 46 44 46.2 45.7
Na2O wt.% 0.36 0.33
K2O wt.% 0.54 0.61
Cl- wt.% c. 0.03 c. 0.03 0.05 0.06
SO3 wt.% 3.0 3.0 3.3 3.0
LOI wt.% nil c. 1 1.3 1.2
Insoluble rest wt.% c. 1 c. 1 0.5 0.6
Na2Oe wt.% 0.5 0.6 0.7
Slag wt.% c. 70 c. 76
Blaine m2 kg-1 490 470 510 450
Density kg m-3 2950 2905 2970 2980
Start binding min 260 190 220 295
End binding min 360 270 300 330
Heat of hydration
J g-1 < 270 < 270 256 252
Source 1 2 3 4
Data sources: 1 – ENCI 1998a, 2 – ENCI 1998b, 3 – Holcim 2011a, 4 – Holcim 2011b. Blaine according to NEN-EN 196-6; binding according to NEN-EN 196-3. Heat of hydration determined by dissolution calorimetry at 7 days and 20 ˚C.
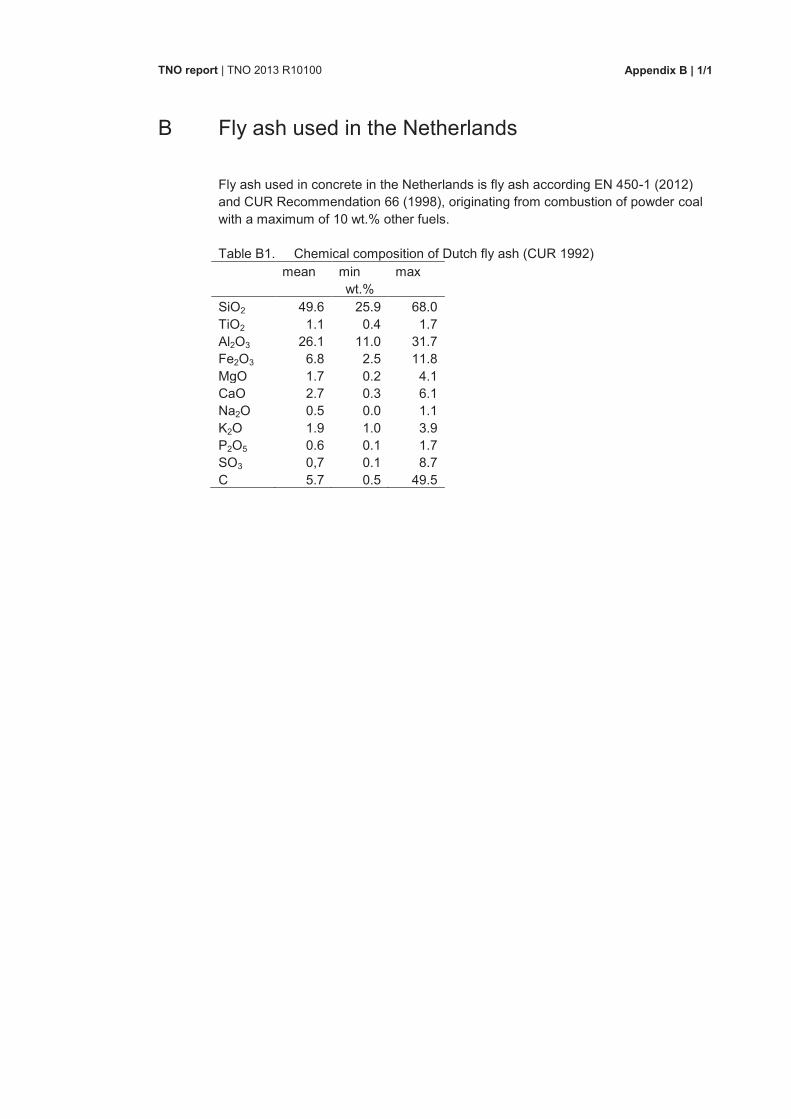
Appendix B | 1/1
TNO report | TNO 2013 R10100
B Fly ash used in the Netherlands
Fly ash used in concrete in the Netherlands is fly ash according EN 450-1 (2012) and CUR Recommendation 66 (1998), originating from combustion of powder coal with a maximum of 10 wt.% other fuels. Table B1. Chemical composition of Dutch fly ash (CUR 1992)
mean min max wt.%
SiO2 49.6 25.9 68.0 TiO2 1.1 0.4 1.7 Al2O3 26.1 11.0 31.7 Fe2O3 6.8 2.5 11.8 MgO 1.7 0.2 4.1 CaO 2.7 0.3 6.1 Na2O 0.5 0.0 1.1 K2O 1.9 1.0 3.9 P2O5 0.6 0.1 1.7 SO3 0,7 0.1 8.7 C 5.7 0.5 49.5

Trygt fram sammen
Statens vegvesenVegdirektoratetPublikasjonsekspedisjonenPostboks 8142 Dep 0033 OSLOTlf: (+47 915) [email protected]
ISSN: 1893-1162
vegvesen.no