sizing the height of discontinuities, their ... · 1 1 sizing the height of discontinuities, their...
TRANSCRIPT
1 1
SIZING THE HEIGHT OF DISCONTINUITIES, THEIR CHARACTERISATION IN PLANAR / VOLUMETRIC
BY PHASED ARRAY TECHNIQUE BASED ON DIFFRACTED ECHOES
G. Nardoni, M. Certo, P. Nardoni, M. Feroldi , D. Nardoni
I&T Nardoni Institute ± Brescia ± Italy
L. Possenti, A. Filosi, S. Quetti
ATB Riva Calzoni ± Brescia ± Italy
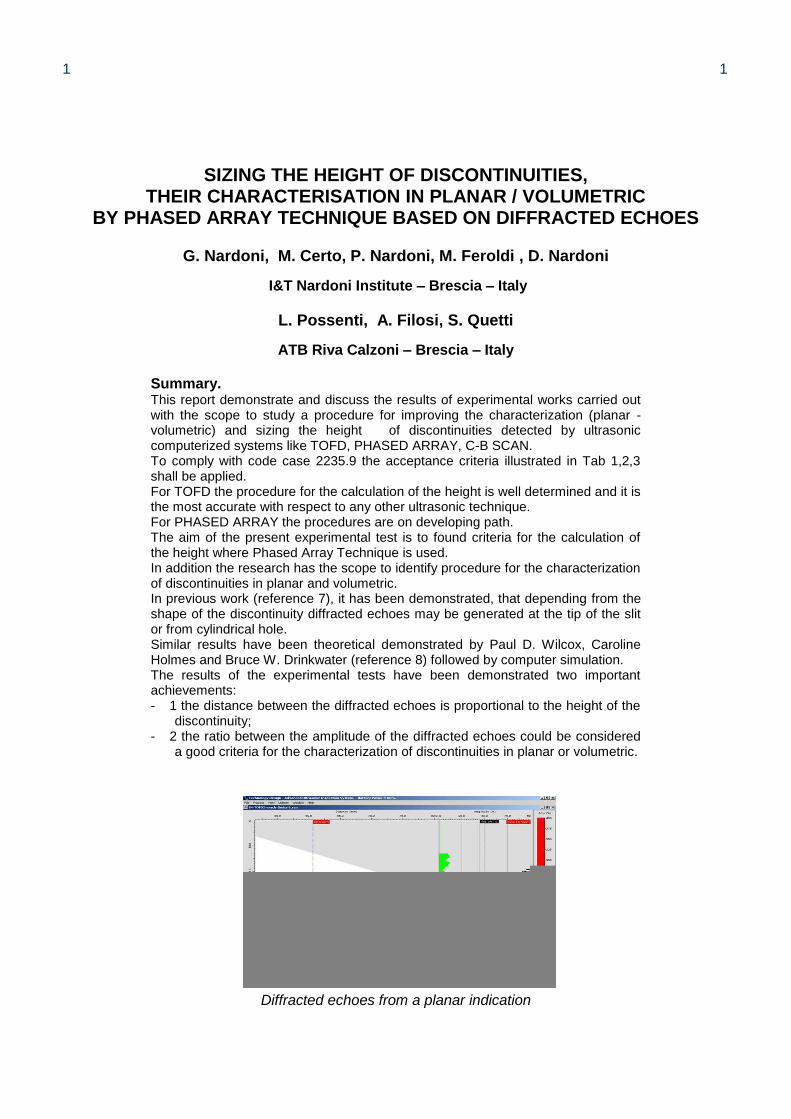
Summary. This report demonstrate and discuss the results of experimental works carried out with the scope to study a procedure for improving the characterization (planar - volumetric) and sizing the height of discontinuities detected by ultrasonic computerized systems like TOFD, PHASED ARRAY, C-B SCAN. To comply with code case 2235.9 the acceptance criteria illustrated in Tab 1,2,3 shall be applied. For TOFD the procedure for the calculation of the height is well determined and it is the most accurate with respect to any other ultrasonic technique. For PHASED ARRAY the procedures are on developing path. The aim of the present experimental test is to found criteria for the calculation of the height where Phased Array Technique is used. In addition the research has the scope to identify procedure for the characterization of discontinuities in planar and volumetric. In previous work (reference 7), it has been demonstrated, that depending from the shape of the discontinuity diffracted echoes may be generated at the tip of the slit or from cylindrical hole. Similar results have been theoretical demonstrated by Paul D. Wilcox, Caroline Holmes and Bruce W. Drinkwater (reference 8) followed by computer simulation. The results of the experimental tests have been demonstrated two important achievements: - 1 the distance between the diffracted echoes is proportional to the height of the
discontinuity; - 2 the ratio between the amplitude of the diffracted echoes could be considered
a good criteria for the characterization of discontinuities in planar or volumetric.
Diffracted echoes from a planar indication
2 2
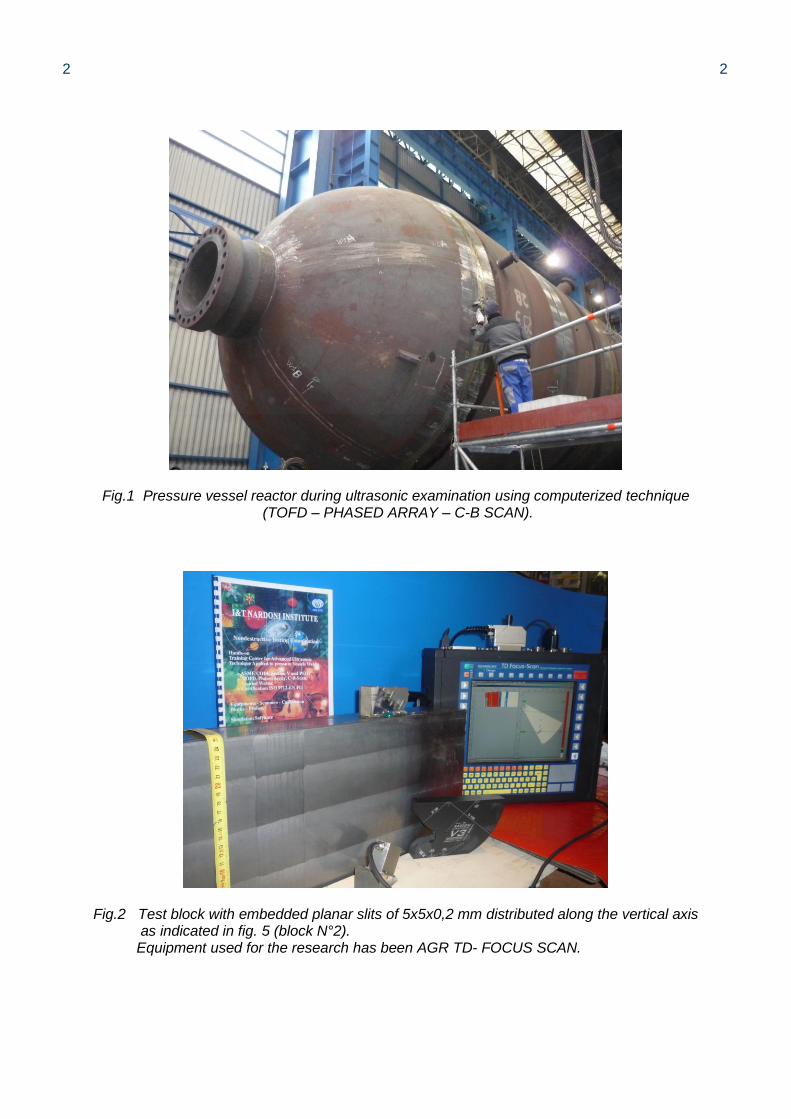
Fig.1 Pressure vessel reactor during ultrasonic examination using computerized technique (TOFD – PHASED ARRAY – C-B SCAN).
Fig.2 Test block with embedded planar slits of 5x5x0,2 mm distributed along the vertical axis as indicated in fig. 5 (block N°2). Equipment used for the research has been AGR TD- FOCUS SCAN.
3 3
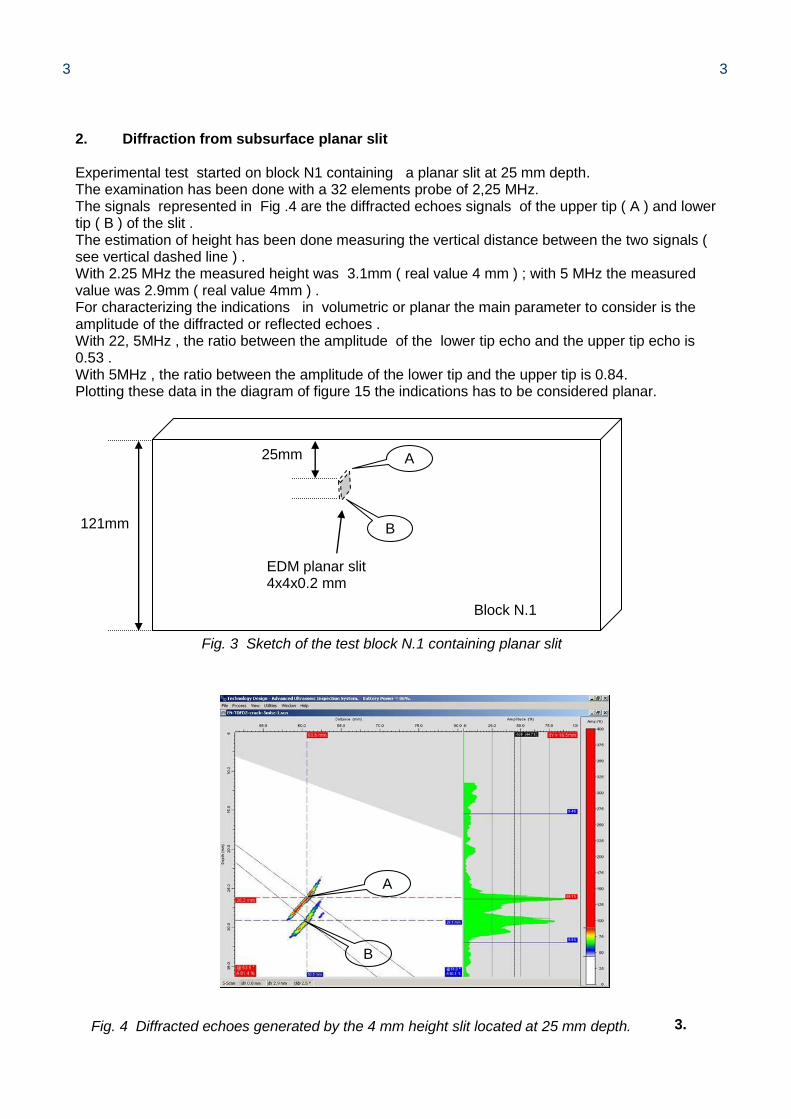
2. Diffraction from subsurface planar slit Experimental test started on block N1 containing a planar slit at 25 mm depth. The examination has been done with a 32 elements probe of 2,25 MHz. The signals represented in Fig .4 are the diffracted echoes signals of the upper tip ( A ) and lower tip ( B ) of the slit . The estimation of height has been done measuring the vertical distance between the two signals ( see vertical dashed line ) . With 2.25 MHz the measured height was 3.1mm ( real value 4 mm ) ; with 5 MHz the measured value was 2.9mm ( real value 4mm ) . For characterizing the indications in volumetric or planar the main parameter to consider is the amplitude of the diffracted or reflected echoes . With 22, 5MHz , the ratio between the amplitude of the lower tip echo and the upper tip echo is 0.53 . With 5MHz , the ratio between the amplitude of the lower tip and the upper tip is 0.84. Plotting these data in the diagram of figure 15 the indications has to be considered planar. Block N.1 Fig. 3 Sketch of the test block N.1 containing planar slit
3.
EDM planar slit 4x4x0.2 mm
25mm
121mm B
A
Fig. 4 Diffracted echoes generated by the 4 mm height slit located at 25 mm depth.
B
A
4 4
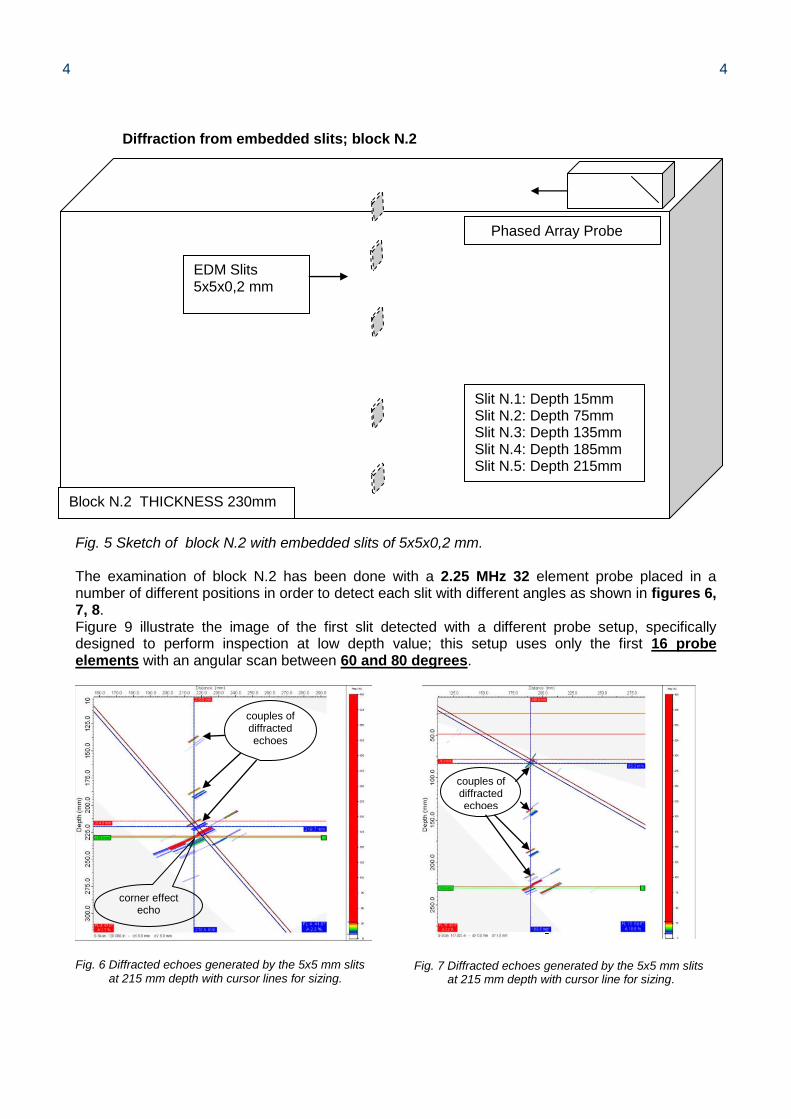
Diffraction from embedded slits; block N.2 Fig. 5 Sketch of block N.2 with embedded slits of 5x5x0,2 mm. The examination of block N.2 has been done with a 2.25 MHz 32 element probe placed in a number of different positions in order to detect each slit with different angles as shown in figures 6, 7, 8. Figure 9 illustrate the image of the first slit detected with a different probe setup, specifically designed to perform inspection at low depth value; this setup uses only the first 16 probe elements with an angular scan between 60 and 80 degrees.
Fig. 6 Diffracted echoes generated by the 5x5 mm slits at 215 mm depth with cursor lines for sizing.
Figure 5: Sketch of a validation block containing embedded small EDM vertical 5x5 mm planar defect
Phased Array Probe direction
EDM Slits 5x5x0,2 mm
Slit N.1: Depth 15mm Slit N.2: Depth 75mm Slit N.3: Depth 135mm Slit N.4: Depth 185mm Slit N.5: Depth 215mm
Block N.2 THICKNESS 230mm
Fig. 7 Diffracted echoes generated by the 5x5 mm slits at 215 mm depth with cursor line for sizing.
couples of diffracted echoes
corner effect echo
couples of diffracted echoes
5 5
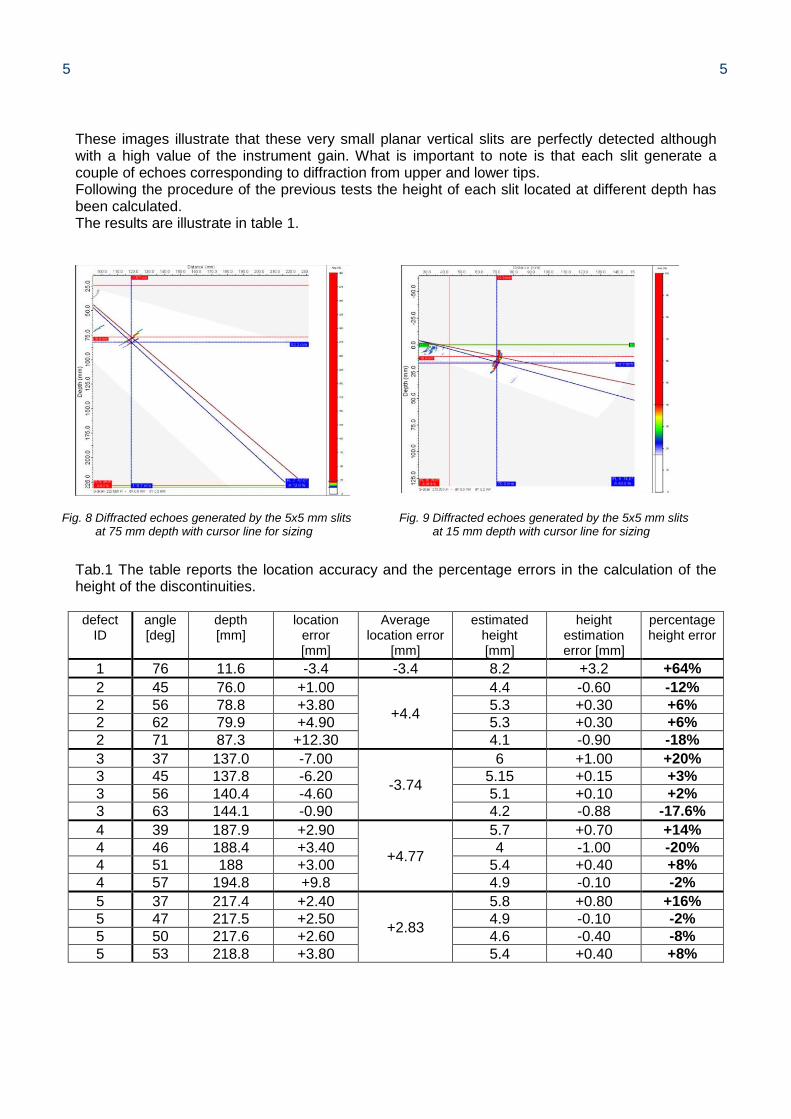
These images illustrate that these very small planar vertical slits are perfectly detected although with a high value of the instrument gain. What is important to note is that each slit generate a couple of echoes corresponding to diffraction from upper and lower tips. Following the procedure of the previous tests the height of each slit located at different depth has been calculated. The results are illustrate in table 1.
Tab.1 The table reports the location accuracy and the percentage errors in the calculation of the height of the discontinuities. defect
ID angle [deg]
depth [mm]
location error [mm]
Average location error
[mm]
estimated height [mm]
height estimation error [mm]
percentage height error
1 76 11.6 -3.4 -3.4 8.2 +3.2 +64%
2 45 76.0 +1.00
+4.4
4.4 -0.60 -12%
2 56 78.8 +3.80 5.3 +0.30 +6%
2 62 79.9 +4.90 5.3 +0.30 +6%
2 71 87.3 +12.30 4.1 -0.90 -18%
3 37 137.0 -7.00
-3.74
6 +1.00 +20%
3 45 137.8 -6.20 5.15 +0.15 +3%
3 56 140.4 -4.60 5.1 +0.10 +2%
3 63 144.1 -0.90 4.2 -0.88 -17.6%
4 39 187.9 +2.90
+4.77
5.7 +0.70 +14%
4 46 188.4 +3.40 4 -1.00 -20%
4 51 188 +3.00 5.4 +0.40 +8%
4 57 194.8 +9.8 4.9 -0.10 -2%
5 37 217.4 +2.40
+2.83
5.8 +0.80 +16%
5 47 217.5 +2.50 4.9 -0.10 -2%
5 50 217.6 +2.60 4.6 -0.40 -8%
5 53 218.8 +3.80 5.4 +0.40 +8%
Fig. 8 Diffracted echoes generated by the 5x5 mm slits at 75 mm depth with cursor line for sizing
Fig. 9 Diffracted echoes generated by the 5x5 mm slits at 15 mm depth with cursor line for sizing
6 6
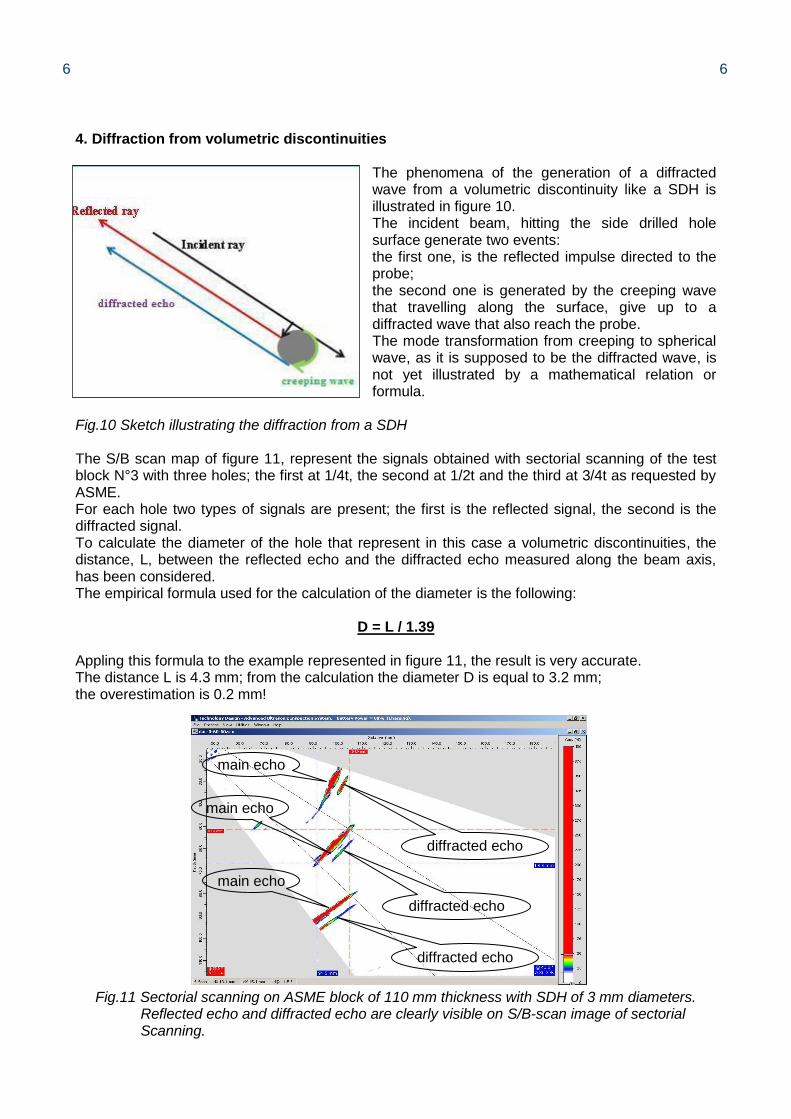
4. Diffraction from volumetric discontinuities
The phenomena of the generation of a diffracted wave from a volumetric discontinuity like a SDH is illustrated in figure 10. The incident beam, hitting the side drilled hole surface generate two events: the first one, is the reflected impulse directed to the probe; the second one is generated by the creeping wave that travelling along the surface, give up to a diffracted wave that also reach the probe. The mode transformation from creeping to spherical wave, as it is supposed to be the diffracted wave, is not yet illustrated by a mathematical relation or formula.
Fig.10 Sketch illustrating the diffraction from a SDH The S/B scan map of figure 11, represent the signals obtained with sectorial scanning of the test block N°3 with three holes; the first at 1/4t, the second at 1/2t and the third at 3/4t as requested by ASME. For each hole two types of signals are present; the first is the reflected signal, the second is the diffracted signal. To calculate the diameter of the hole that represent in this case a volumetric discontinuities, the distance, L, between the reflected echo and the diffracted echo measured along the beam axis, has been considered. The empirical formula used for the calculation of the diameter is the following:
D = L / 1.39
Appling this formula to the example represented in figure 11, the result is very accurate. The distance L is 4.3 mm; from the calculation the diameter D is equal to 3.2 mm; the overestimation is 0.2 mm!
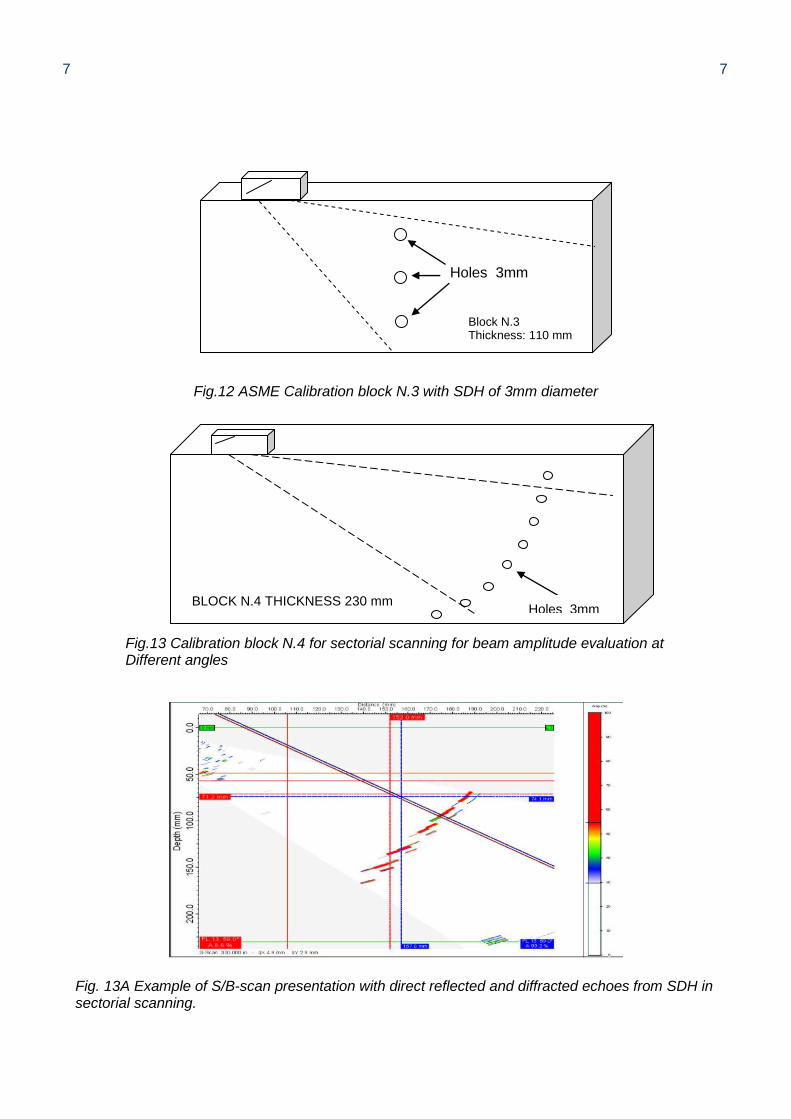
Fig.11 Sectorial scanning on ASME block of 110 mm thickness with SDH of 3 mm diameters. Reflected echo and diffracted echo are clearly visible on S/B-scan image of sectorial Scanning.
main echo
diffracted echo
main echo
diffracted echo
main echo
diffracted echo
7 7
Fig.12 ASME Calibration block N.3 with SDH of 3mm diameter
Fig. 13A Example of S/B-scan presentation with direct reflected and diffracted echoes from SDH in sectorial scanning.
Fig.13 Calibration block N.4 for sectorial scanning for beam amplitude evaluation at Different angles
Holes 3mm BLOCK N.4 THICKNESS 230 mm
Block N.3 Thickness: 110 mm
Holes 3mm
8 8
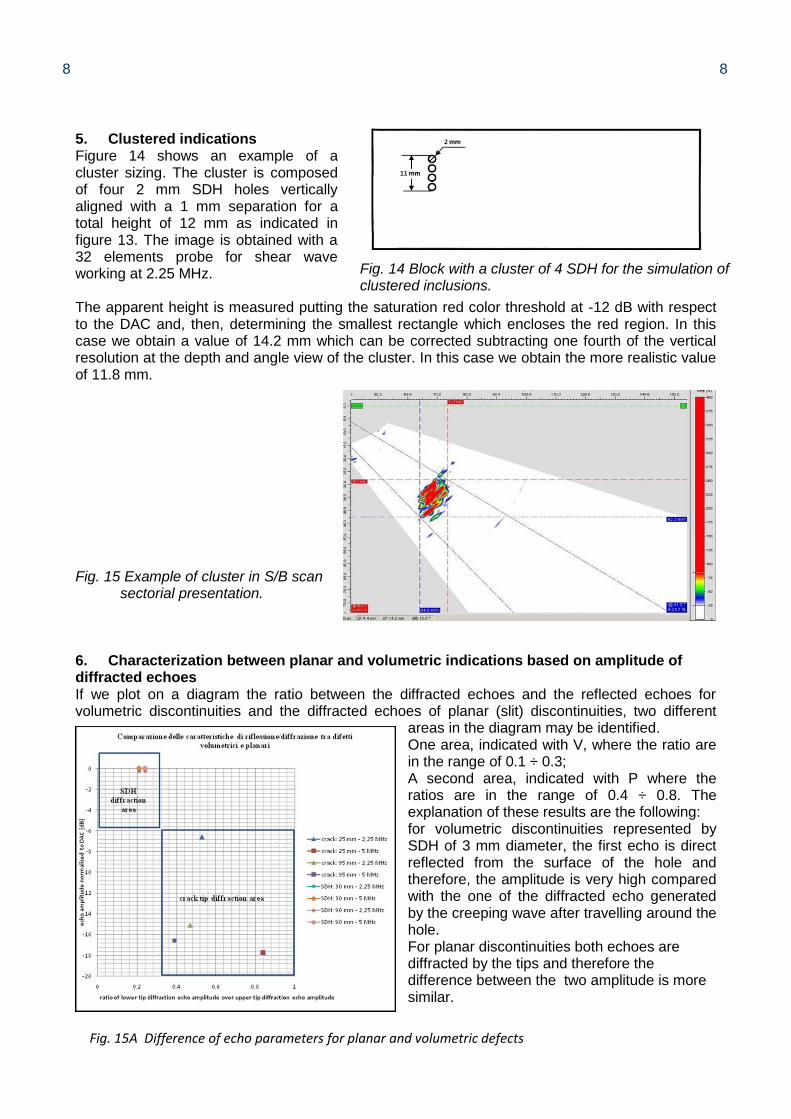
5. Clustered indications Figure 14 shows an example of a cluster sizing. The cluster is composed of four 2 mm SDH holes vertically aligned with a 1 mm separation for a total height of 12 mm as indicated in figure 13. The image is obtained with a 32 elements probe for shear wave working at 2.25 MHz. The apparent height is measured putting the saturation red color threshold at -12 dB with respect to the DAC and, then, determining the smallest rectangle which encloses the red region. In this case we obtain a value of 14.2 mm which can be corrected subtracting one fourth of the vertical resolution at the depth and angle view of the cluster. In this case we obtain the more realistic value of 11.8 mm. Fig. 15 Example of cluster in S/B scan sectorial presentation. 6. Characterization between planar and volumetric indications based on amplitude of diffracted echoes If we plot on a diagram the ratio between the diffracted echoes and the reflected echoes for volumetric discontinuities and the diffracted echoes of planar (slit) discontinuities, two different
areas in the diagram may be identified. One area, indicated with V, where the ratio are in the range of 0.1 ÷ 0.3; A second area, indicated with P where the ratios are in the range of 0.4 ÷ 0.8. The explanation of these results are the following: for volumetric discontinuities represented by SDH of 3 mm diameter, the first echo is direct reflected from the surface of the hole and therefore, the amplitude is very high compared with the one of the diffracted echo generated by the creeping wave after travelling around the hole. For planar discontinuities both echoes are diffracted by the tips and therefore the difference between the two amplitude is more similar.
Fig. 15A Difference of echo parameters for planar and volumetric defects
Fig. 14 Block with a cluster of 4 SDH for the simulation of clustered inclusions.
9 9
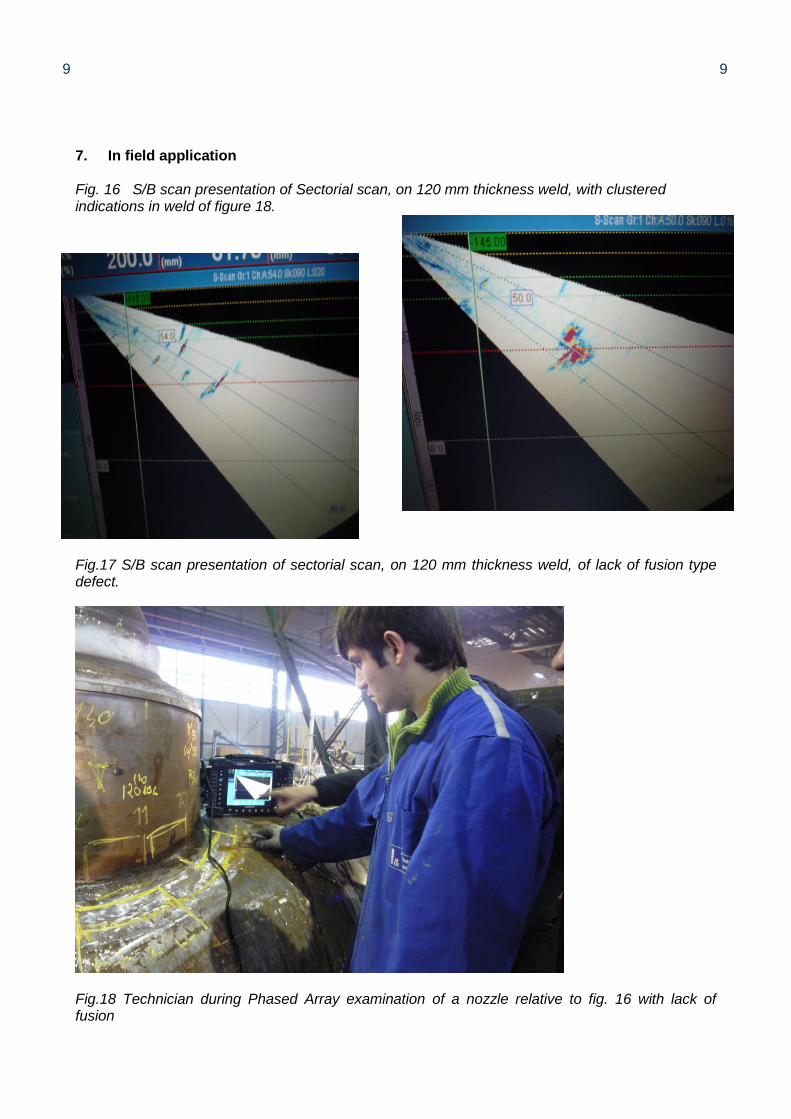
7. In field application Fig. 16 S/B scan presentation of Sectorial scan, on 120 mm thickness weld, with clustered indications in weld of figure 18.
Fig.17 S/B scan presentation of sectorial scan, on 120 mm thickness weld, of lack of fusion type defect.
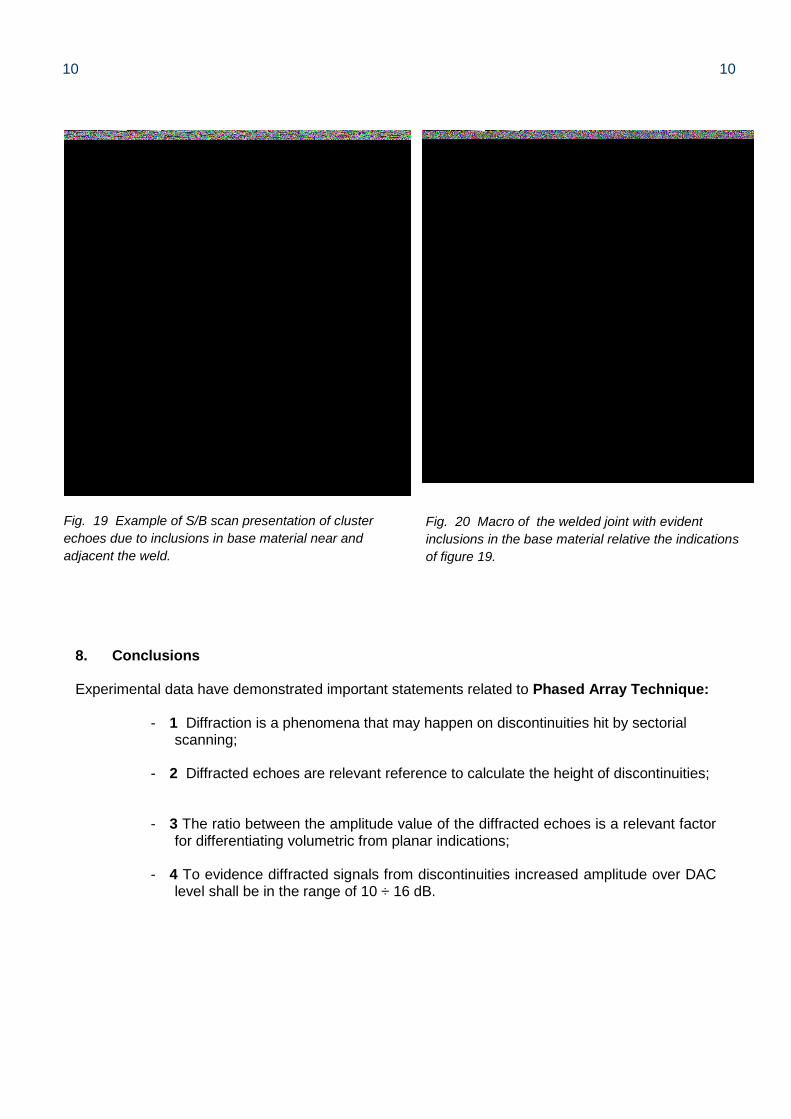
Fig.18 Technician during Phased Array examination of a nozzle relative to fig. 16 with lack of fusion
10 10
Fig. 19 Example of S/B scan presentation of cluster
echoes due to inclusions in base material near and
adjacent the weld.
Fig. 20 Macro of the welded joint with evident
inclusions in the base material relative the indications
of figure 19.
8. Conclusions Experimental data have demonstrated important statements related to Phased Array Technique:
- 1 Diffraction is a phenomena that may happen on discontinuities hit by sectorial scanning;
- 2 Diffracted echoes are relevant reference to calculate the height of discontinuities;
- 3 The ratio between the amplitude value of the diffracted echoes is a relevant factor
for differentiating volumetric from planar indications;
- 4 To evidence diffracted signals from discontinuities increased amplitude over DAC level shall be in the range of 10 ÷ 16 dB.
11 11
References [1] Sharp R. S., “Research Techniques in Non Destructive Testing”, Vol. IV, 1980 [2] Malcolm, J. Crocker, “ Encyclopedia of Acoustics”, Vol. One, 1997 [3] ASME Code Sec. V, art. 4, Code Case 2235.9. Use of Ultrasonic Examination in Lieu of Radiography. [4] Ichiro Komura, Taiji Hirasawa, Satoshi Nagai (Toshiba),Jun-ichi Takabayashi (Keihin), Katsuhiko Naruse (Isogo Nuclear) “Crack Detection and Sizing Technique by Ultrasonic and Electromagnetic Methods”, Proceedings of the 25th MPA Seminar, MPA Stuttgart, Germany, October 7 - 8, 1999 [5] R/D Tech, “Introduction to Phased Array Ultrasonic Technology Applications: R/D Tech Guideline”, Quebec City, Canada, R/D Tech, 2004. [6] Lafontaine, G. and F. Cancre, "Potential of Ultrasonic Phased Arrays for Faster, Better and Cheaper Inspections," NDT.net, Vol. 5, No. 10, October 2000, <www.ndt.net/article/v05n10/lafont2/lafont2.htm>. [7] Nardoni G., “CB-Scan Technique with Phased Array Probe: Sizing procedures using diffracted echoes”, Conference on ASME Code Case 2235.9: From acceptance criteria based on amplitude of signal to acceptance criteria based on size, Moscow, 2008. [8] Paul D. Wilcox, Caroline Holmes and Bruce W. Drinkwater “Advanced Reflector Characterization with Ultrasonic Phased arrays in NDE Applications”; IEEE Transactions on Ultrasonics, ferroelectrics, and Frequency Control, Vol.54, N.8, August 2007 [9] ASME Code Case 2235.9.