size-exclusion high-performance liquid chromatography...
TRANSCRIPT
SIZE-EXCLUSION HIGH-PERFORMANCE LIQUID CHROMATOGRAPHY FOR RAPID EXAMINATION
OF SIZE DIFFERENCES OF CEREAL PROTEINS
Jean-Claude Autran
Laboratoire de Technologie des Cereales, INRA, 2 Place Viala, 34060 Montpellier Cedex 1, France
INTRODUCTION
Considerable research has been carried out on proteins of wheat and other cereals to determine relations between composition and effect on quality. Because quality is often associated with the occurrence of large protein aggregates, it is essential to assess the size range of gluten proteins and to determine the proportions of aggregating and monomeric proteins in flour or grain. SDS-P AGE can be used to separate prolamins or subunits of glutelins according to molecular size. However, because the reduction of S-S bonds is a prerequisite to investigate large size aggregates, SDS-P AGE studies cannot avoid a loss of information on how the individual polypeptides interact to form large glutenin polymers. Therefore, techniques' that could perform high-resolution separations of proteins in a non-denaturing manner would have a decisive advantage to investigate protein functionality in the various applications of wheats. Sizeexclusion chromatography, later adapted to high-performance methods as size-exclusion high-performance liquid chromatography (SE-HPLQ, is the technique most commonly used to retain information at the level of protein aggregates and to give insight into structure and interactions between components. This chapter is an attempt to review methods of SE-HPLC
326
analysis of cereal proteins, especially for rapid examination of size differences. The first part presents basic principles, and considers the equipment and procedures. Practical information, to assist investigators, is not described in detail since it is largely common to all types of HPLC, but indications relating to specific problems of SE-HPLC fractionation of cereal proteins are given where relevant. I then consider the application of SE-HPLC to studies of wheat proteins (characterization of molecular size, discrimination of genotypes, quality prediction).
BASIC PRINCIPLES
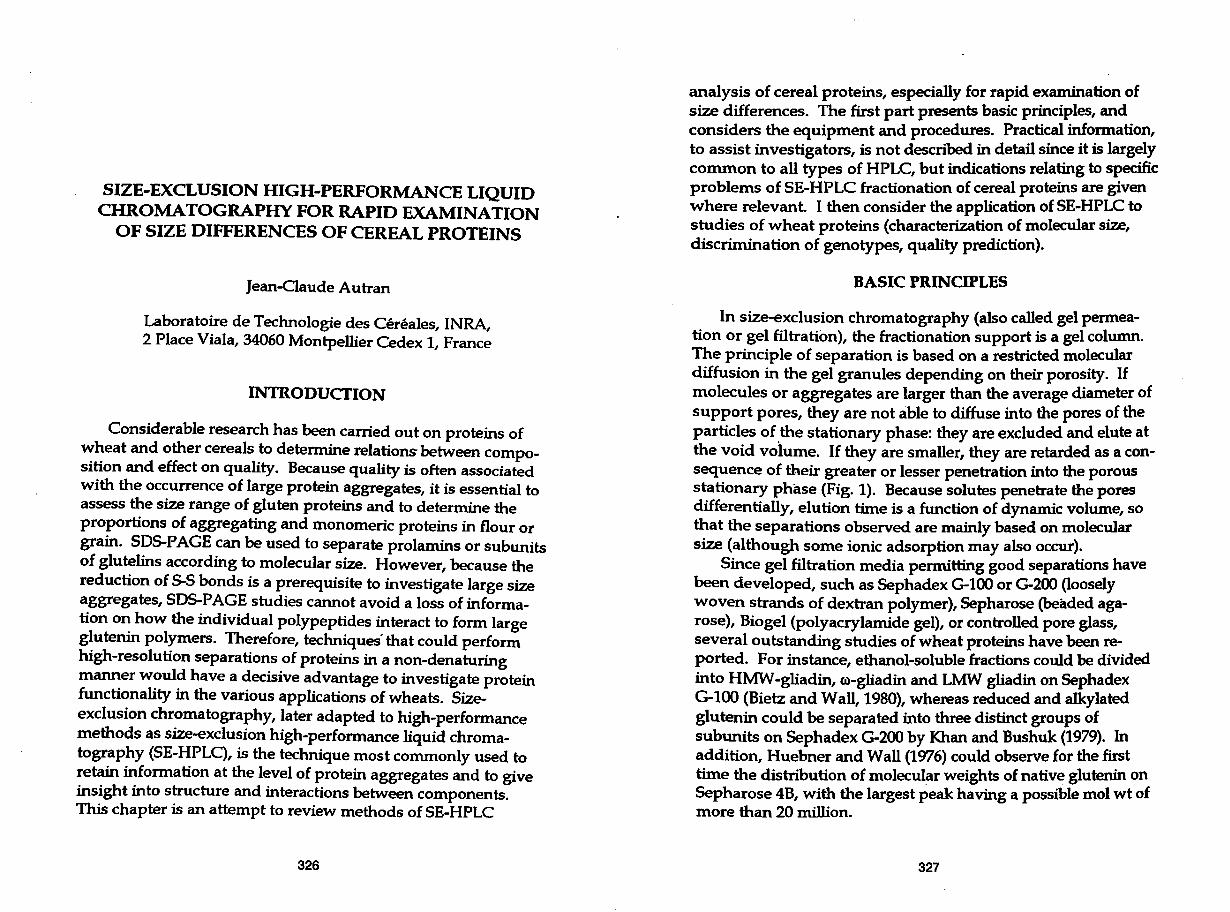
In size-exclusion chromatography (also called gel permeation or gel filtration), the fractionation support is a gel column. The principle of separation is based on a restricted molecular diffusion in the gel granules depending on their porosity. If molecules or aggregates are larger than the average diameter of support pores, they are not able to diffuse into the pores of the particles of ,the stationary phase: they are excluded and elute at the void volume. If they are smaller, they are retarded as a consequence of their greater or lesser penetration into the porous stationary phase (Fig. 1). Because solutes penetrate the pores differentially, elution time is a function of dynamic volume, so that the separations observed are mainly based on molecular size (although some ionic adsorption may also occur).
Since gel filtration media permitting good separations have been developed, such as Sephadex G-100 or G-200 (loosely woven strands of dextran polymer), Sepharose (beaded agarose), Biogel (polyacrylamide gel), or controlled pore glass, several outstanding studies of wheat proteins have been reported. For instance, ethanol-soluble fractions could be divided into HMW-gliadin, m-gliadin and LMW gliadin on Sephadex G-100 (Bietz and Wall, 1980), whereas reduced and alkylated glutenin could be separated into three distinct groups of subunits on Sephadex G-200 by I<han and Bushuk (1979). In addition, Huebner and Wall (1976) could observe for the first time the distribution of molecul~r weights of native glutenin on Sepharose 4B, with the largest peak having a possible mol wt of more than 20 million.
327
Fig. 1. Schematic representation of the path of various protein molecules during size-exclusion chromatography. The chromatographic partition coefficient is defined as K = (V e-Vo}/(Vt-Vo}, where Ve is the measured elution volume, Vo is the column void volume or exclusion volume and Vt is the total column volume, i.e., the sum of Vo and the pore volume V p·
However, conventional chromatographic methods suffer from disadvantages: they are tedious, lengthy, and difficult-to reproduce or to quantitate. They fit quite well to preparative fractionations and purifications, not to rapid screening of many wheat samples, making it necessary to investigate high performance supports that could allow high mobile phase velocities and therefore very short runs.
Size-exclusion chromatography was the first mode of liquid chromatography to be adapted to high performance methods for protein analysis due to the development of highly resistant packings that were assumed to minimize interactions with the support. However, two major deficiencies initially associated with SE-HPLC methods prevented attainment of separations that were at least comparable to those of classical gels. All supports investigated, including silica and polymers, still more or less adsorbed proteins by ionic and hydrophobic interactions, respectively,_ making it necessary to deactivate the support surfaces by stable neutral layers thin enough to allow access to 60-lCXX> A pores. Also, swelling properties of new supports
328
were inferior to those of carbohydrate gels, making them unable to resolve large size aggregates (Gooding, 1986).
Methods development has progressed quickly and improved columns, coupled with better equipment that significantly improved chromatographic separations, were made available. New silica-based packings, prepared from 3-5 micron-sized ultrapure silica bonded with a patented hydrophilic coating, were largely developed that reduced interactions and approximated ideal conditions of size-exclusion. In addition, various improvements such as selection of proper mobile phase, appropriate adjustment of pH and ionic strength, and especially use of detergents counteracting hydrophobic interactions made resolution and analysis time in high performance systems obviously superior and generally allowed any protein that could be separated on carbohydrate columns to be analyzed bySE-HPLC.
1•> u•l ? ~(I -:i
J• . 'i 00
3 !,O
8 00
1.~o
7.00 ':'> ~
b 5(1 ~
b 00
Cll 5 50
~ 5 00 _. 0 > 4 ~·O
::3 4 00 {'1
~ 3 50 ""; c ,, C'l
3 OCJ
Minutes
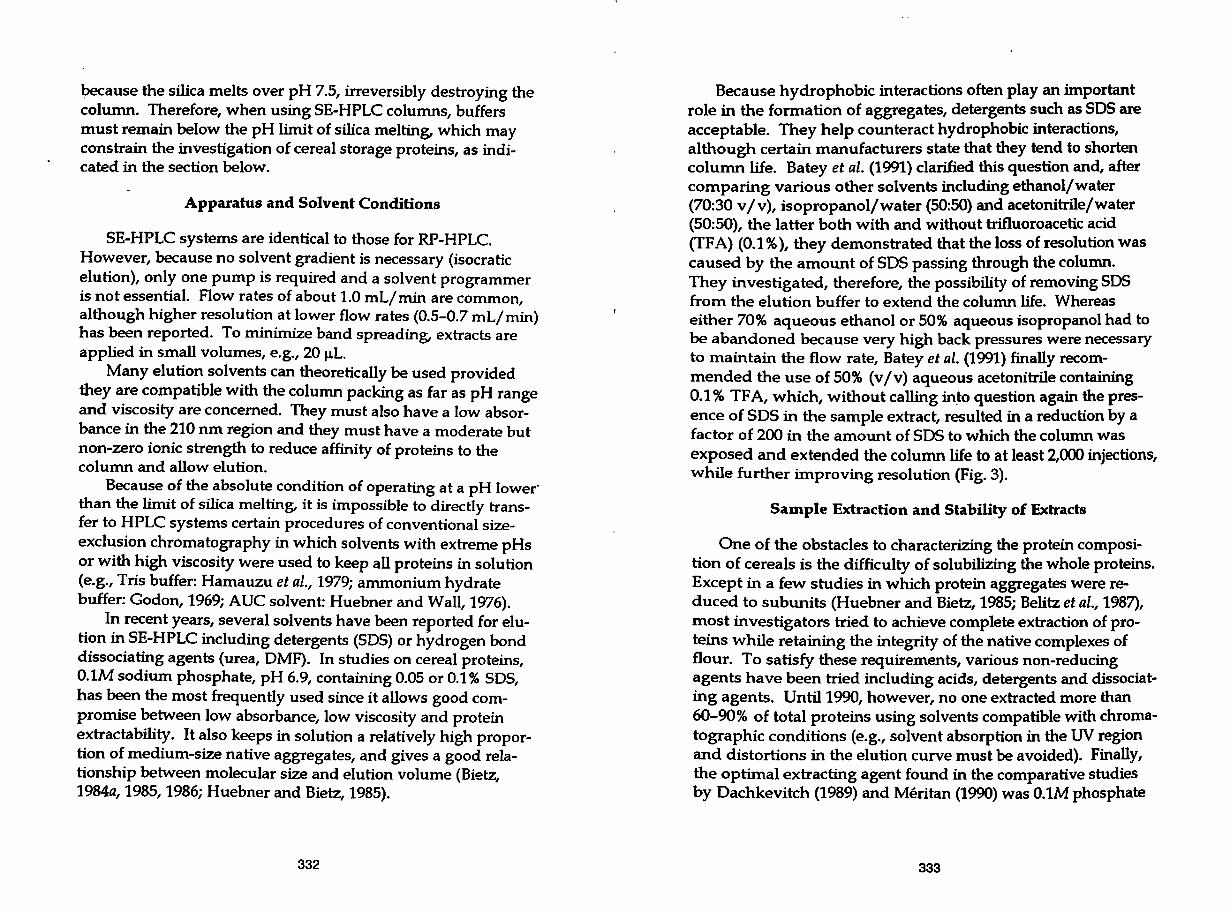
Fig. 2. Typical elution pattern of barley storage proteins extracted by phosphate-SOS buffer (pH 6.9) (from Benetrix, unpublished results).
329
In the case of cereals, although RP-HPLC has been much more· developed for various uses (see other chapters of this book), SE-HPLC has become an invaluable tool for rapid examination of size differences of proteins (Fig. 2). Despite specific difficulties associated with insolubility and aggregative behavior of storage proteins, especially glutenin, a number of reports were presented, following pioneer studies from Bietz's group (Bietz, 1984a,b, 1985; Huebner and Bietz, 1985), that could make SE-HPLC work in good conditions, and were a breakthrough in the investigation of protein functionality and quality assessment.
ANALYTICAL CONDITIONS AND METHODS
Columns
While a major limitation of conventional gel-type media is their lack of mechanical strength, it is obvious that the highmobile-phase velocities used in HPLC require packing materials that are rigid, physically and chemically stable, uniform and inert. Such columns, generally silica-based, suitable for proteins, ~re now available. Unlike the types of columns that are used in reversed-phase HPLC in which silica is modified to incorporate hydrophobic groups, or in ion-exchange HPLC in which silanols are derivatized with compounds having ionizable groups, SE-HPLC requires, in ideal conditions, that the stationary phase does not interact with proteins. Consequently, in SEHPLC columns, residual silanols are usually blocked by "endcapping" to minimize adsorption and allow sample recoveries usually greater than 95%. ,
While a number of columns are available for various types of polymers, including oligosaccharides, polysaccharides, or cationic polymers, those specifically designed for proteins are few. These last years, many SE-HPLC studies of cereal proteins used TSK columns from Toyo Soda, marked ~y various suppliers (Spherogel from Beckman, Protein Pak from Waters, Ultro Pak from Pharmacia/LKB, Biosil from Biorad), all made from ultrapure silica bonded with a hydrophilic group that removes activity of residual silanols. For instance, the use of
330
TSK:3000SW columns (10 ± 2 µm of particle dial!'e~r, with 250 A pores) was reported by Bietz (1984a) and Orsi and Bekes (1986), whereas the use of TSK-4000SW (13 ± 3 µm particle diameter, with 400 A pores) was more widely used (Huebner and Bietz, 1985; Bietz, 1986; Seilmeier et al., 1987; Dachkevitch and Autran, 1989). The use of Protein-Pak 300 (dial-bonded 10 µm silica gel, mol wt range 10,000 to 300,000) has been also reported by Singh et al. (1990a,b) and Batey et al. (1991). These columns allow fractionation over a wide range of mol wt which depends, in fact, on the type of solvent that more or less lines or blocks pores. For instance, the range for TSK-30CXlSW is assumed to be 1,000 to 300,000 when a protein is injected in a salt solution, and only 1,000to100,000 when in a 0.1 % SOS solution, 1,000 to 70,000 when in 6M GuHO solution. The same is true for TSK-4000SW (5,000 to 1,000,000 when in salt solution).
Very recently, polyether-bonded 5 µm silica packings (UltraSpherogel™-SEC columns SEC 2000, 3000, 4000) were developed by Beckman to avoid non-specific interactions. These columns have increased reproducibility and efficiency from 500,000 to 2 million Da, pH 2.5-8.0, and 0 to 40°C at 2000 psi. They withstand denaturing agents such as BM urea or 6M GuHCl, but to our knowledge, have not been used on cereal proteins.
Alternatively, Superose 6 or 12 (agarose-based) have been used with Pharmacia FPLC (Lundh and MacRitchie, 1989; Huebner et al., 1990; Pasaribu et al., 1992). However, al~ough specifically designed for the study of proteins and enzymes (lower pressure, glass pumps and Teflon tubing, no stainless steel), such systems are usually not strictly classified as HPLC.
All analytical SE-HPLC columns are generally larger (7.5 x
300 mm, or 7.5 x 60 cm) than analytical RP-HPLC columns. Preparative columns (25 x 300 mm) are also available.
SE-HPLC columns are usually much more expensive ($600-1,000) than RP-HPLC columns. On the other hand, their lifetime is generally shorter [a loss of resolution after 250-300 injections was reported by Meritan (1Q90) and by Batey et al. · (1991)], and they are less resistant to certain solvents and pHs. For instance, TSK can operate in the 2.0-7.5 pH range only
331
~ause the silica melts over pH 7.5, irreversibly destroying the column. Therefore, when using SE-HPLC columns, buffers must remain below the pH limit of silica melting, which may constrain the investigation of cereal storage proteins, as indicated in the section below.
Apparatus and Solvent Conditions
SE-HPLC systems are identical to those for RP-HPLC. However, because no solvent gradient is necessary (isocratic elution), only one pump is required and a solvent programmer is not essential. Flow rates of about 1.0 mL/min are common, although higher resolution at lower flow rates (0.5-0.7 mL/ min) has been reported. To minimize band spreading, extracts are applied in small volumes, e.g., 20 µL.
Many elution solvents can theoretically be used provided they are compatible with the column packing as far as pH range and viscosity are concerned. They must also have a low absorbance in the 210 nm region and they must have a moderate but non-zero ionic strength to reduce affinity of proteins to the column and allow elution.
Because of the absolute condition of operating at a pH lower· than the limit of silica melting, it is impossible to directly transfer to HPLC systems certain procedures of conventional sizeexclusion chromatography in which solvents with extreme pHs or with high viscosity were used to keep all proteins in solution (e.g., Tris buffer: Hamauzu et al., 1979; ammonium hydrate buffer: Codon, 1969; AUC solvent: Huebner and Wall, 1976).
In recent years, several solvents have been reported for elution in SE-HPLC including detergents (SOS) or hydrogen bond dissociating agents (urea, DMF). In studies on cereal proteins, O.lM sodium phosphate, pH 6.9, containing 0.05 or 0.1 % SOS, has been the most frequently used since it allows good compromise between low absorbance, low viscosity and protein extractability. It also keeps in solution a relatively high propor-
. tion of medium-size native aggregates, and gives a good relationship between molecular size and elution volume (Bietz, 1984a, 1985, 1986; Huebner and Bietz, 1985).
332
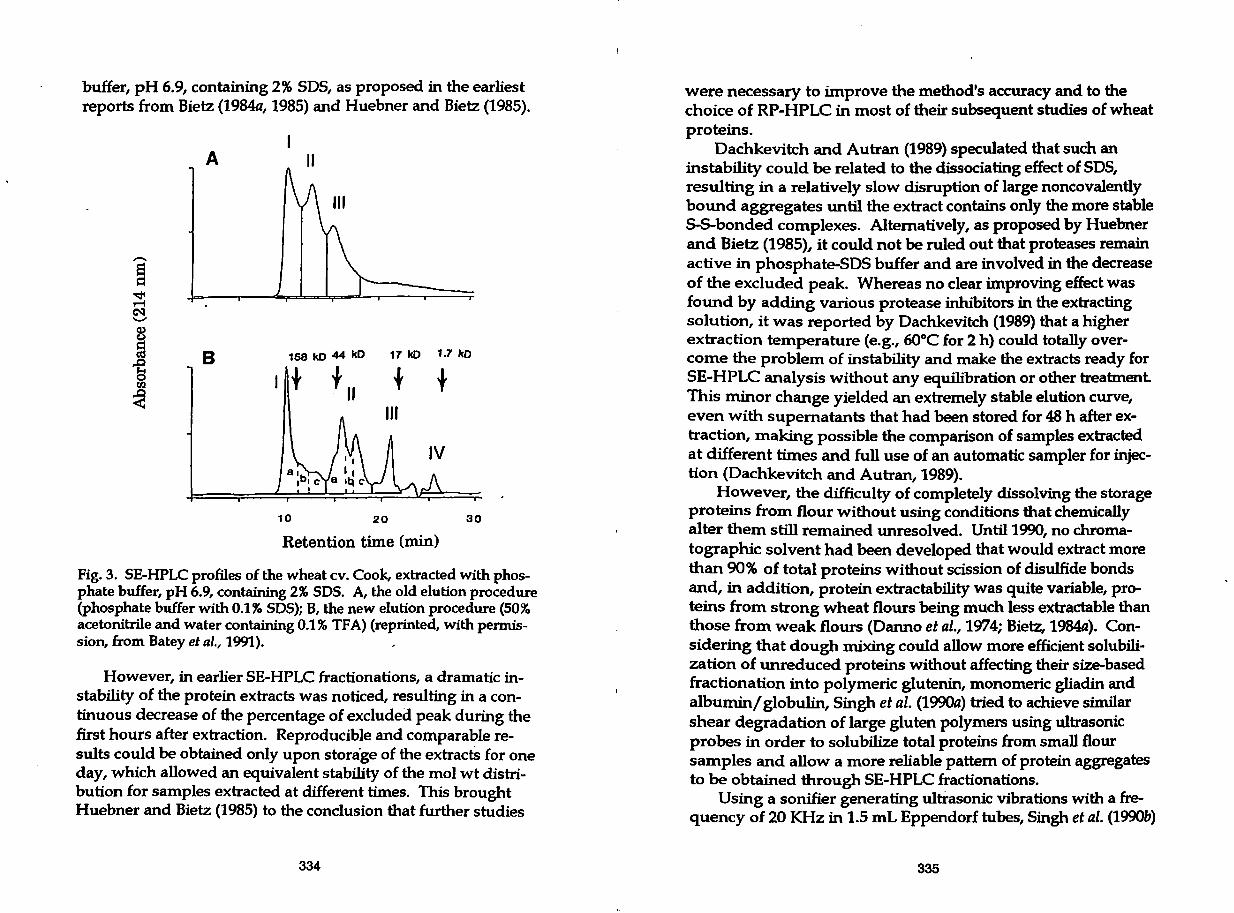
Because hydrophobic interactions often play an important role in the formation of aggregates, detergents such as SOS are acceptable. They help counteract hydrophobic interactions, although certain manufacturers state that they tend to shorten column life. Batey et al. (1991) clarified this question and, after comparing various other solvents including ethanol/water (70:30 v/v), isopropanolfwater (50:50) and acetonitrile/water (50:50), the latter both with and without trifluoroacetic acid (TF A) (0.1 % ), they demonstrated that the loss of resolution was caused by the amount of SOS passing through the column. They investigated, therefore, the possibility of removing SOS from the elution buffer to extend the column life. Whereas either 70% aqueous ethanol or 50% aqueous isopropanol had to be abandoned because very high back pressures were necessary to maintain the flow rate, Batey et al. (1991) finally recommended the use of 50% (v/v) aqueous acetonitrile containing 0.1 % TF A, which, without calling in~o question again the presence of SOS in the sample extract, resulted in a reduction by a factor of 200 in the amount of SOS to which the column was exposed and extended the column life to at least 2,000 injections, while further improving resolution (Fig. 3).
Sample Extraction and Stability of Extracts
One of the obstacles to characterizing the protein composition of cereals is the difficulty of solubilizing the whole proteins. Except in a few studies in which protein aggregates were reduced to subunits (Huebner and Bietz, 1985; Belitz et al., 1~87), most investigators tried to achieve complete extraction of proteins while retaining the integrity of the native complexes of flour. To satisfy these requirements, various non-reducing agents have been tried including acids, detergents and dissociating agents. Until 1990, however, no one extracted more than 60-90% of total proteins using solvents compatible with chromatographic conditions (e.g., solvent absorption in the UV region and distortions in the elution curve must be avoided}. Finally, the optimal extracting agent found in the comparative studies by Dachkevitch (1989) and Meritan (199o) was 0.1Mphosphate
333
buffer, pH 6.9, containing 2% SOS, as proposed in the earliest reports from Bietz (1984a, 1985) and Huebner and Bietz (1985).
A II
....-.
~ .qt -4 C'I ..._., Q) u ~
158 kO 44 kD 17 kD 1.7 kD ~ B rf + f II t t 0 tll
~
10 20 30
Retention time (min)
Fig. 3. SE-HPLC profiles of the wheat cv. Cook, extracted with phosphate buffer, pH 6.9, containing 2% SOS. A, the old elution procedure (phosphate buffer with 0.1 % SOS); B, the new elution procedure (50% acetonitrile and water containing 0.1 % TF A) (reprinted, with permission, from Batey et al., 1991).
However, in earlier SE-HPLC fractionations, a dramatic instability of the protein extracts was noticed, resulting in a continuous decrease of the percentage of excluded peak during the first hours after extraction. Reproducible and comparable results could be obtained only upon storage of the extractS for one day, which allowed an equivalent stability of the mol wt distribution for samples extracted at different times. This brought Huebner and Bietz (1985) to the conclusion that further studies
334
were necessary to improve the method's accuracy and to the choice of RP-HPLC in most of their subsequent studies of wheat proteins.
Dachkevitch and Autran (1989) speculated that such an instability could be related to the dissociating effect of SOS, resulting in a relatively slow disruption of large noncovalently bound aggregates until the extract contains only the more stable S-S-bonded complexes. Alternatively, as proposed by Huebner and Bietz (1985), it could not be ruled out that proteases remain active in phosphate-SOS buffer and are involved in the decrease of the excluded peak. Whereas no clear improving effect was found by adding various protease inhibitors in the extracting solution, it was reported by Dachkevitch (1989) that a higher extraction temperature (e.g., 60°C for 2 h) could totally overcome the problem of instability and make the extracts ready for SE-HPLC analysis without any equilibration or other treatment This minor change yielded an extremely stable elution curve, even with supernatants that had been stored for 48 h after extraction, making possible the comparison of samples extracted at different times and full use of an automatic sampler for injection (Dachkevitch and Autran, 1989).
However, the difficulty of completely dissolving the storage proteins from flour without using conditions that chemically alter them still remained unresolved. Until 1990, no chromatographic solvent had been developed that would extract more than 90% of total proteins without scission of disulfide bonds and, in addition, protein extractability was quite variable, proteins from strong wheat flours being much less extractable than those from weak flours (Danno et al., 1974; Bietz, 1984a). Considering that dough mixing could allow more efficient solubilization of unreduced proteins without affecting their size-based fractionation into polymeric glutenin, monomeric gliadin and albumin/ globulin, Singh et al. (1990a) tried to achieve similar shear degradation of large gluten polymers using ultrasonic probes in order to solubilize total proteins from small flour samples and allow a more reliable pattern of protein aggregates to be obtained through SE-HPLC fractionations.
Using a sonifier generating ultrasonic vibrations with a frequency of 20 KHz in 1.5 mL Eppendorf tubes, Singh et al. (1990b)
335
clearly demonstrated that complete dissolution of unreduced proteins from strong and weak flours was possible in a 2 % SDS solution (pH 6.9), with the following major advantages: (i) a very short time (30 sec) is needed to completely extract proteins, (ii) a very small quantity of flour (11 mg) is required, (iii) only very large glutenin polymers-that require much less energy for their shear degradation - are degraded and the resulting products elute from the column without affecting the size-based fractionation into polymeric and monomeric groups.
Troubleshooting
Care of SE-HPLC columns is similar to that of any type of HPLC and is that recommended by manufacturers. Protein extracts must be centrifuged (at least 25,000 g for 10 min) and elution solvents must be filtered through a 0.45 or 0.22 µm filter to remove particulates. In-line filters and/ or guard columns are also to be used (Bietz, 1990).
The major problem with SE-HPLC is the loss of resolution and increased pressure that occur after a few hundred injections, sometimes even in less than one hundred injections when. the protein sample is extracted from complex mixtures such as wholemeal wheat, rye or sorghum flours or hulled barley kernels. While in other types of HPLC it is sometimes possible to restore column performance and normal operating pressure by washing according to manufacturer's recommendations (often in the reverse direction and using alcohols, acetonitrile, diluted sodium hydroxide solutions, or proteases), there are few reports of durable regeneration of a silica-based SE-HPLG column, either by washing, or by local repacking. As stressed by Bietz (1986), once problems occur, lost resolution or increased pressure can seldom be reversed.
The origin of these troubles is manifold: clogging by large aggregates that do not elute from the colu1TU1, irreversible adsorption interactions between the stationary phase and proteins or impurities of tJ:te extract (soluble starch, polyphenols?), or SDS that binds to the support and affects the apparent pore size and resolution.
336
These factors make SE-HPLC more expensive than other HPLC modes, and limit the use of SE-HPLC as a routine procedure. To extend column life and to achieve acceptance of SEHPLC as a routine procedure, Batey et al. (1991) proposed either finding an alternative column packing or changing the sample preparation and running conditions. As indicated above, these authors especially recommend completely removing SDS from the elution solvent and using 50% (v /v) aqueous acetonitrile containing 0.1 % TF A, which is likely to extend the column life to at least 2,0CX> injections. In connection with this, Pasaribu et al. (1992) recently suggested adding 0.08M NaCl to the phosphateSDS buffer in fractionations using Superose columns. This, associated with sonicated extracts, allowed NaOH washing of the columns, and led to higher protein recovery, extended column life and improved resolution.
As a general rule, because slow changes in selectivity and resolution generally occur that result from type and age of SEHPLC columns, it is highly recommended that system performance be monitored. This can be achieved by analyzing at regular intervals standard proteins of known molecular weight as shown in Fig. 4.
APPLICATIONS
Characterization of Molecular Size of Protein Polypeptides and of Protein Aggregates in "Wheat
The knowledge of the size range of proteins is likely to provide a better insight into the aspects of protein composition that determine quality (functional properties) of various cereal products. It is essential, therefore, to determine routinely the proportions of the various classes of monomers and aggregates that occur in breeding lines, in harvested grains, or in processed foods.
Since proteins are sorted on the basis of their Stokes radii or hydrodynamic volumes during SE-HPLC fractionation, mol wt can be estimated from elution volumes. To determine the molecular size of proteins separated by SE-HPLC, it is necessary
337
first to calibrate columns using proteins of known mol wt (Fig. 4).
10 Volume. ml
20
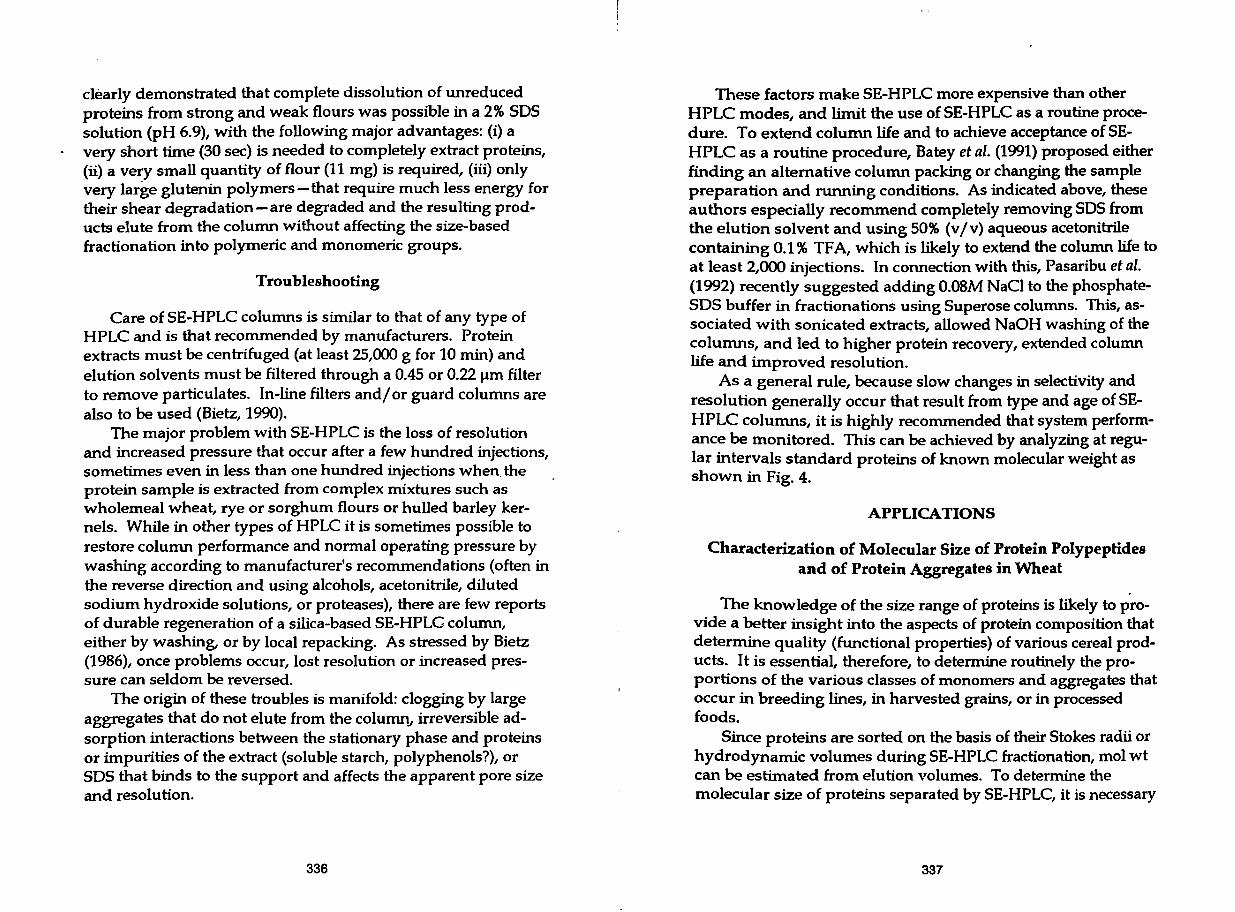
Fig. 4. SE-HPLC of native standard proteins on TSK-4000SW. Thyroglobulin (mol wt 660,000 plus 330,000), bovine serum albumin (68,000plusa136,000 dimer), ovalbumin (43,000), chymotrypsinogen A (25,700), cytochrome c (11,700) and adenosine-5'-phosphate (383-), complexed to SOS, were analyzed at 1.0 mL/m.in. The column effluent was monitored at 210 nm (reprinted, with permission, from Bietz, 1984a).
When the logarithm of mol wt for standard proteins in either native or reduced states is plotted against elution time (or volume) for each protein, a straight line is obtained under ideal conditions. The equation for this line
log mol wt = a Ve + b
where Ve is the elution volume, determined by linear regression analysis, can then be used to estimate the mol wt of unknown proteins on the basis of elution time (Bietz, 1984a). Computer programs can be used with this information to indicate start, maximum and end time, relative area and relative % and apparent mol wt of.each peak.
The molecular size distribution of the main groups of wheat proteins has been reported by Bietz (1984a). For instance, when
338
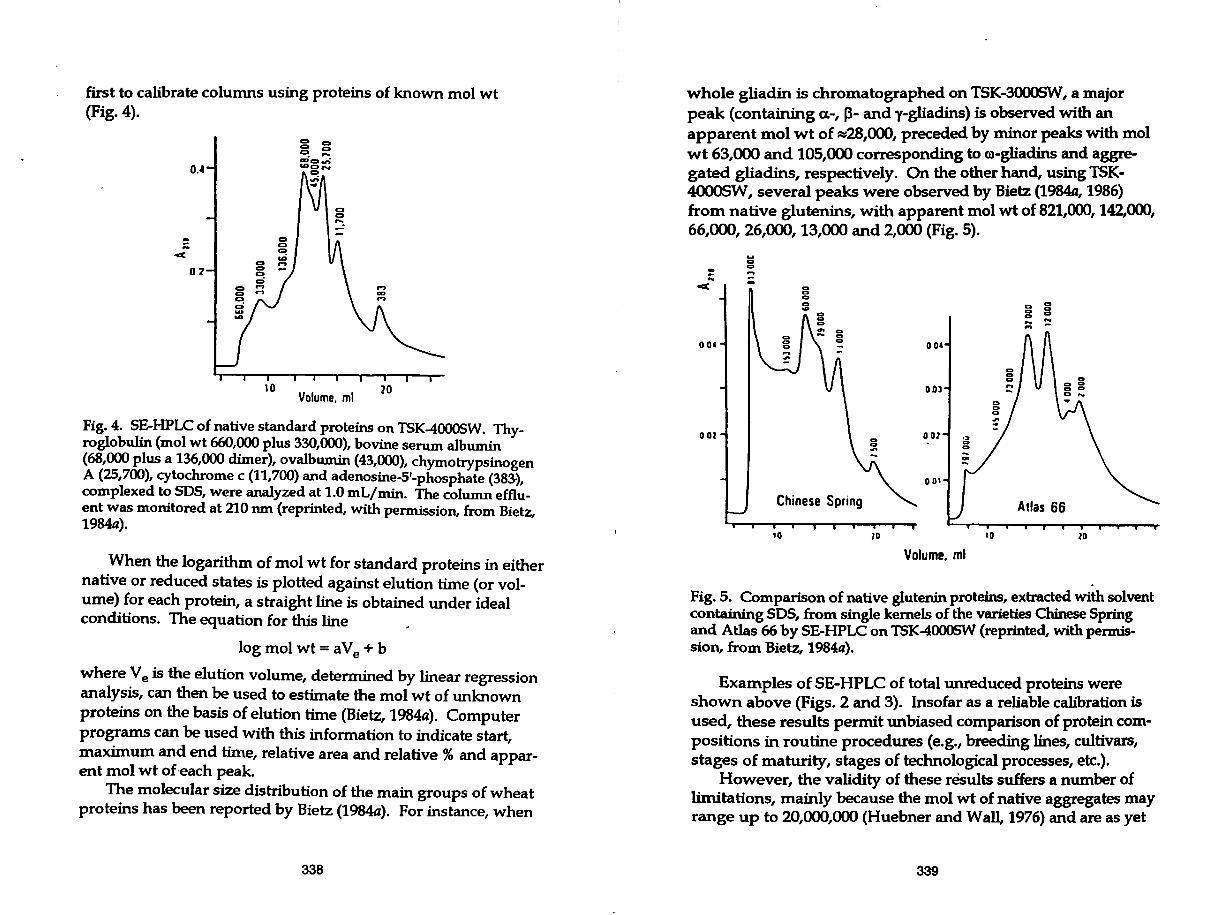
whole gliadin is chromatographed on TSK-3000SW, a major peak (containing a.-, J3- and y-gliadins) is observed with an apparent mol wt of ~28,000, preceded by minor peaks with mol wt 63,000 and 105,000 corresponding to m-gliadins and aggregated gliadins, respectively. On the other hand, using TSK-4000SW, several peaks were observed by Bietz (1984a, 1986) from native glutenins, with apparent mol wt of 821,000, 142,000, 66,000, 26,000, 13,000 and 2,000 (Fig. 5).
-... <
0 QC
0 01
Chinese Spring
10 10
0 QC
DDl
0 !)1
DOI
Volume, ml
10
Q Cl Q Cl Cl a ::; ~
Atlas 66
lO
Fig. 5. Comparison of native glutenin proteins, extracted with solvent containing SOS, from single kernels of the varieties Chinese Spring and Atlas 66 by SE-HPLC on TSK-4000SW (reprinted, with permission, from Bietz, 1984a).
Examples of SE-HPLC of total unreduced proteins were shown above (Figs. 2 and 3). Insofar as a reliable calibration is used, these results permit unbiased comparison of protein compositions in routine procedures (e.g., breeding lines, cultivars, stages of maturity, stages of technological processes, etc.).
However, the validity of these results suffers a number of limitations, mainly because the mol wt of native aggregates may range up to 20,000,000 (Huebner and Wall, 1976) and are as yet
339
beyond the range of commonly used large pore-size columns, such as TSK-4000SW, which has a fractionation range of only one to two million (Bietz, 1986). Thus, the information obtained relates only to the soluble fraction. This is of interest in various applications, but only partially describes the protein composition,~ since information on highly aggregated fractions (that do not elute from the column) is not accessible. Moreover, such results can be misleading when comparing cultivars or lines whose protein extraction rate is variable. It was clearly demonstrated by Singh et al. (1990a) that both the proportions of the main peaks and absolute areas strongly depend on % of protein recovery (Table I).
TABLE I Extractability of Unreduced Proteins in 2% SDS Solution
(Reprinted, with permission, from Singh et al., 1990a)
% HPLC Area Absolute HPLC
Treatment
Stirring only 120min
Sonication Setting 10
2min 4min
Setting 7 2min 4min
Setting 3 10min
Protein Recovery8
65.4
97.1 97.6
94.6 95.6
94.9
(%) Areab
Pl P2 P3 Pt P2
20.2 53.5 26.3 56 148
37.4 41.4 21.3 135 149 35.8 42.7 21.5 130 155
37.9 41.2 21.0 130 142 36.4 41.7 21.9 129 148
36.6 41.7 21.8 131 149
a Based on Kjeldahl N in the residues. b Arbitrary unit for HPLC peak area xl0-5.
P3
73
77 78
72 78
78
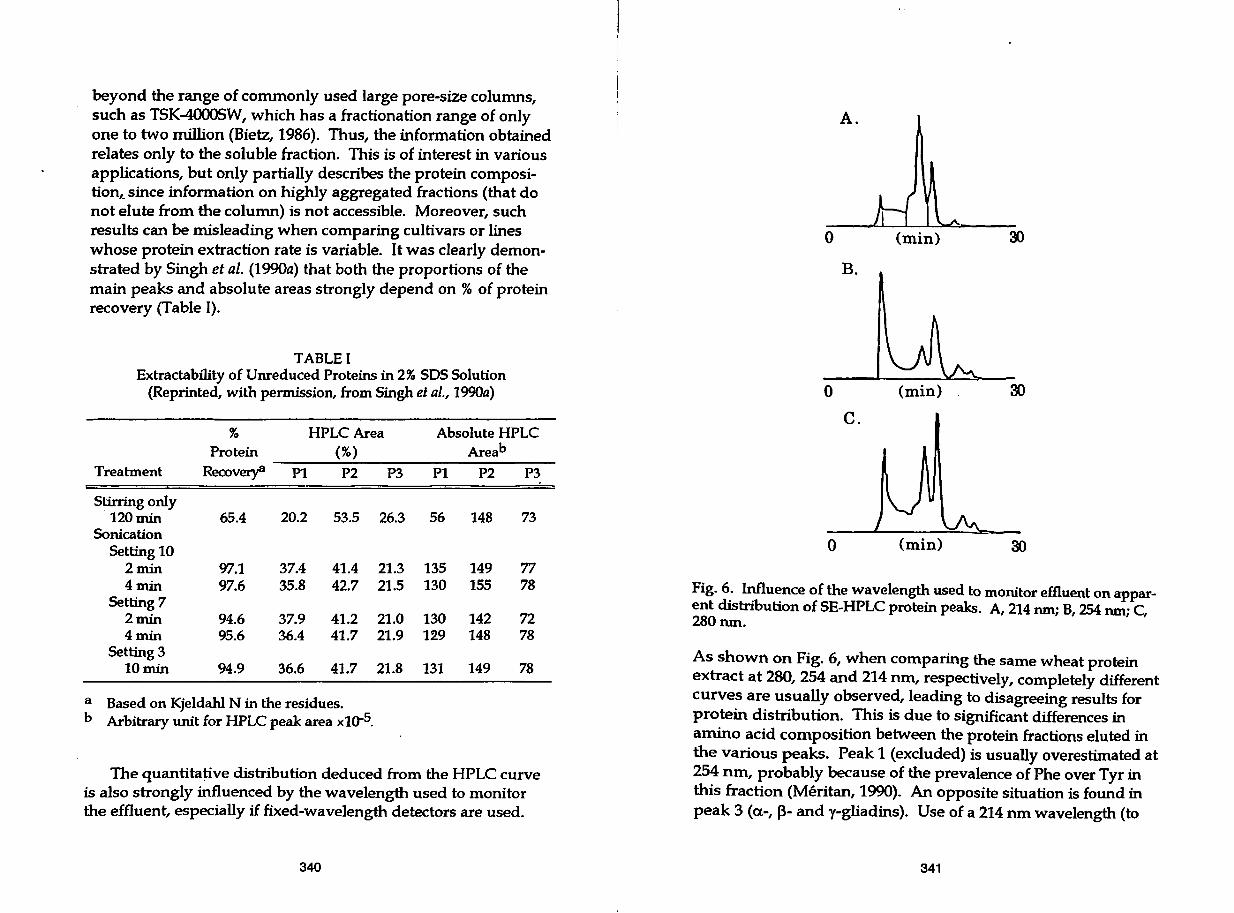
The quantitatjve distribution deduced from the HPLC curve is also strongly influenced by the wavelength used to monitor the effluent, especially if fixed-wavelength detectors are used.
340
A.
0 (min) 30
B.
0
c.
0 (min) 30
Fig. 6. Influence of the wavelength used to monitor effiuent on apparent distribution of SE-HPLC protein peaks. A, 214 nm· B 254 nm· C 28 ' ' ' ' Onm.
As shown on Fig. 6, when comparing the same wheat protein extract at 280, 254 and 214 nm, respectively, completely different curves are usually observed, leading to disagreeing results for protein distribution. This is due to significant differences in amino acid composition between the protein fractions eluted in the various peaks. Peak 1 (excluded) is usually overestimated at 254 nm, probably because of the prevalence of Phe over Tyr in this fraction (Meritan, 1990). An opposite situation is found in peak 3 (a-, f3- and y-gliadins). Use of a 214 nm wavelength (to
341
detect peptide bond carbonyl groups at maximum sensitivity) is likely to give a more reliable pattern of protein distribution. Care is also necessary to avoid overestimating the excluded peak that is frequently turbid, so light scattering and UV absorption influence absorption.
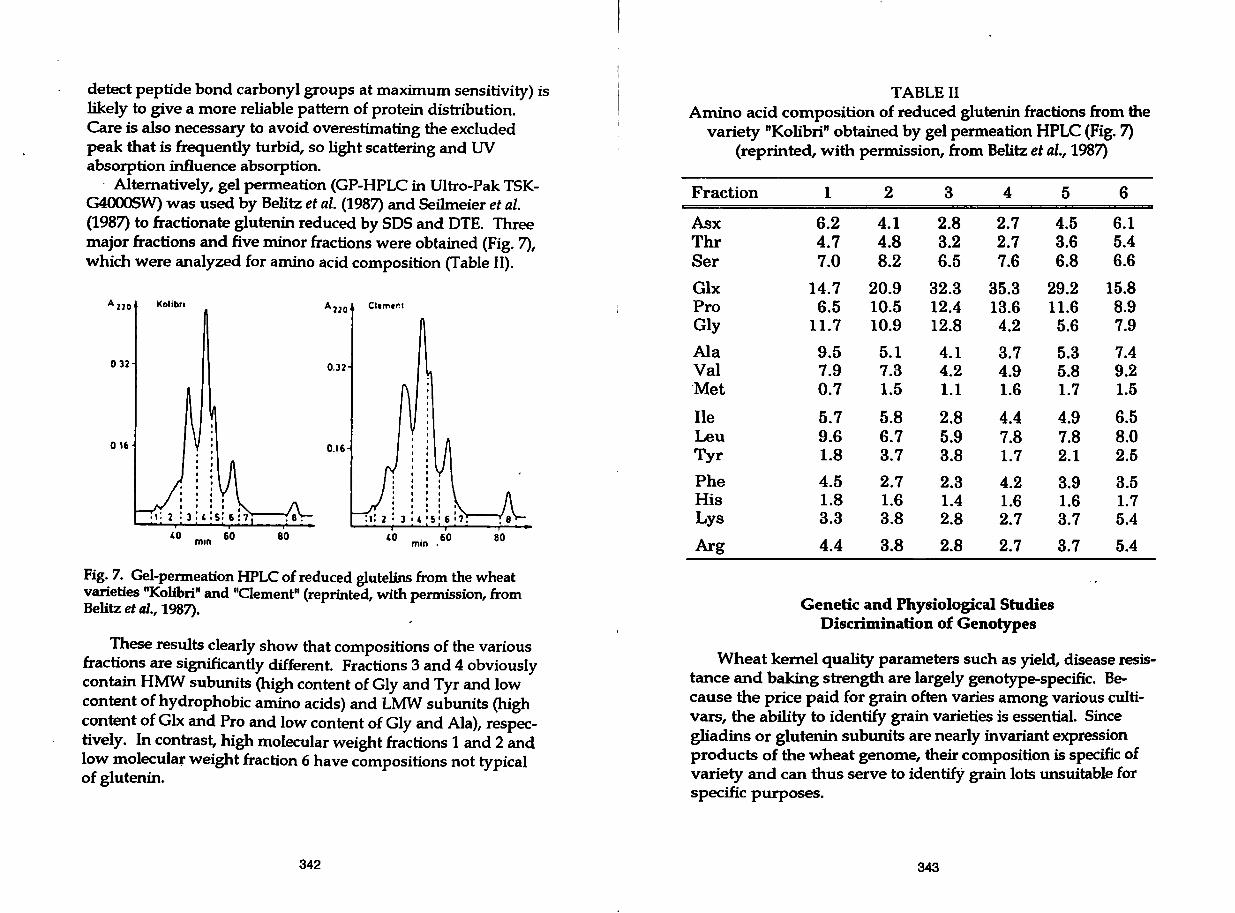
· Alternatively, gel permeation (GP-HPLC in Ultro-Pak TSKG4000SW) was used by Belitz et al. (1987) and Seilmeier et al. (1987) to fractionate glutenin reduced by SDS and DTE. Three major fractions and five minor fractions were obtained (Fig. 7), which were analyzed for amino acid composition (Table II).
A 21 o Kolibri
0 32 0.32
'O min 60 80 ,0 . 60 min • 80
Fig. 7. Gel-permeation HPLC of reduced glutelins from the wheat varieties "Kolibri" and 110ement11 (reprinted, with permission, from Belitz et al., 1987).
These results clearly show that compositions of the various fractions are significantly different. Fractions 3 and 4 obviously contain HMW subunits (high content of Gly and Tyr and low content of hydrophobic amino acids) and LMW subunits (high content of Glx and Pro and low content of Gly and Ala), respectively. In contrast, high molecular weight fractions 1and2 and low molecular weight fraction 6 have compositions not typical of glutenin.
342
TABLE II Amino acid composition of reduced glutenin fractions from the
variety "Kolibri" obtained by gel permeation HPLC (Fig. 7) (reprinted, with permission, from Belitz et al., 1987)
Fraction
Asx Thr Ser
Glx Pro Gly
Ala Val ·Met
Ile Leu Tyr
Phe His Lys
Arg
1 2 3 4 5
6.2 4.1 2.8 2.7 4.5 4.7 4.8 3.2 2.7 3.6 7.0 8.2 6.5 7.6 6.8
14.7 20.9 32.3 35.3 29.2 6.5 10.5 12.4 13.6 11.6
11.7 10.9 12.8 4.2 5.6
9.5 5.1 4.1 3.7 5.3 7.9 7.3 4.2 4.9 5.8 0.7 1.5 · 1.1 1.6 1.7
5.7 5.8 2.8 4.4 4.9 9.6 6.7 5.9 7.8 7.8 1.8 3.7 3.8 1.7 2.1 4.5 2.7 2.3 4.2 3.9 1.8 1.6 1.4 1.6 1.6 3.3 3.8 2.8 2.7 3.7
4.4 3.8 2.8 2.7 3.7
Genetic and Physiological Studies Discrimination of Genotypes
6
6.1 5.4 6.6
15.8 8.9 7.9
7.4 9.2 1.5
6.5 8.0 2.5
3.5 1.7 5.4
5.4
Wheat kernel quality parameters such as yield, disease resistance and baking strength are largely genotype-specific. Because the price paid for grain often varies among various cultivars, the ability to identify grain varieties is essential. Since gliadins or glutenin subunits are nearly invariant expression products of the wheat genome, their composition is specific of variety and can thus serve to identify grain lots unsuitable for specific purposes.
343
Although electrophoresis is very successful for varietal identification, it is only one of many procedures, including reversed-phase high-performance liquid chromatography (see Chapter 5 in this book).
However, in contrast to RP-HPLC, very few studies attempted cultivar identification from SE-HPLC curves because the technique yields only a few large peaks with apparently little possibility for discriminating many cultivars.
For instance, Bietz (1984a) extracted glutenin from four cultivars with an SOS solution (without ME) after previous extraction of albumins, globulins and gliadins, and observed that the glutenins differed markedly in SE-HPLC pattern. Atlas 66, a high-protein soft red winter wheat used in breeding programs, had relatively little HMW glutenin in the extract, but was rich in LMW proteins, which apparently incorporate noncovalently into glutenin. In contrast, Chinese Spring and Red Chief, wheats of poor quality, have large amounts ~f HMW proteins. Centurk, a good bread wheat, has a balance of HMW and LMW species. Thus, SE-HPLC may differentiate genotypes by determining the mol wt distributions of HMW proteins (Bietz, 1986).
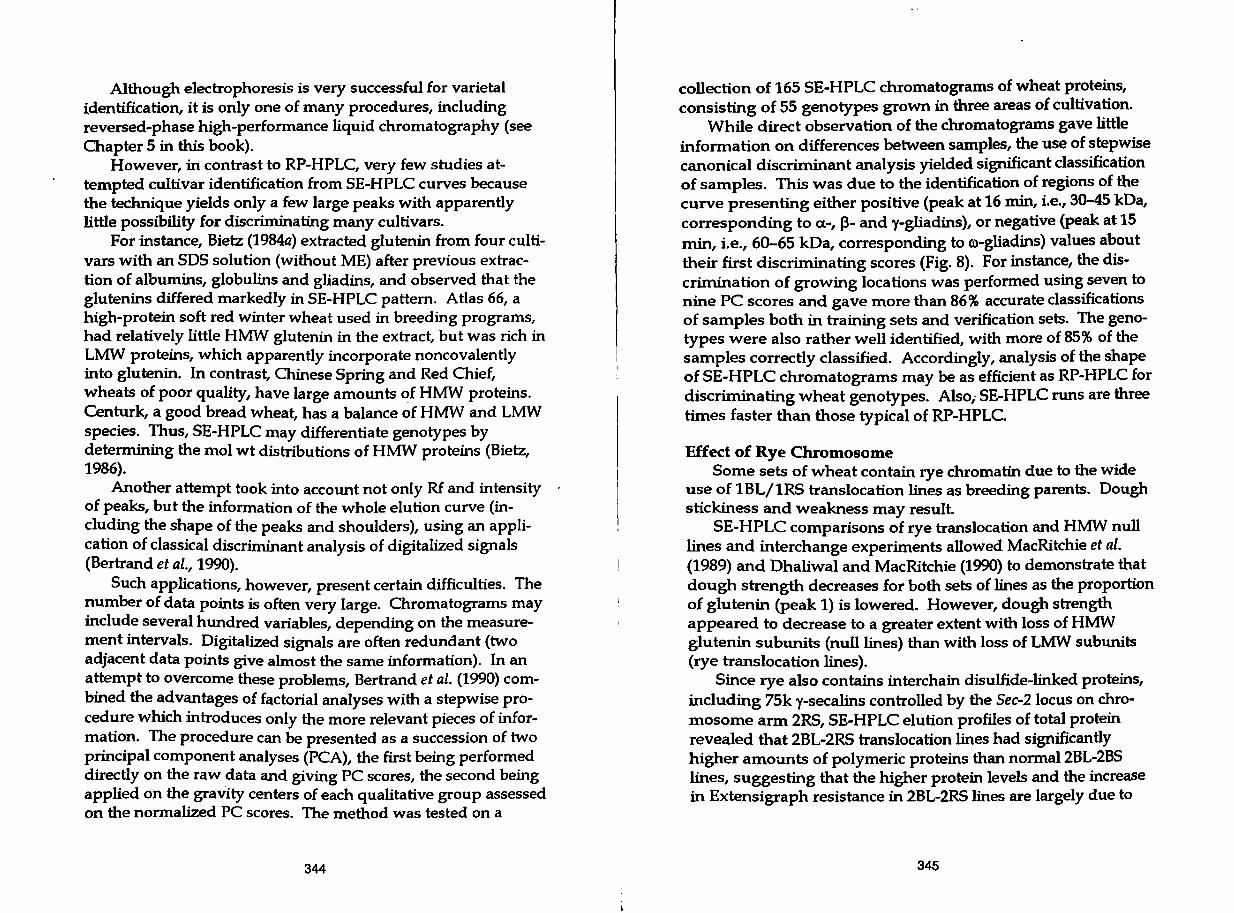
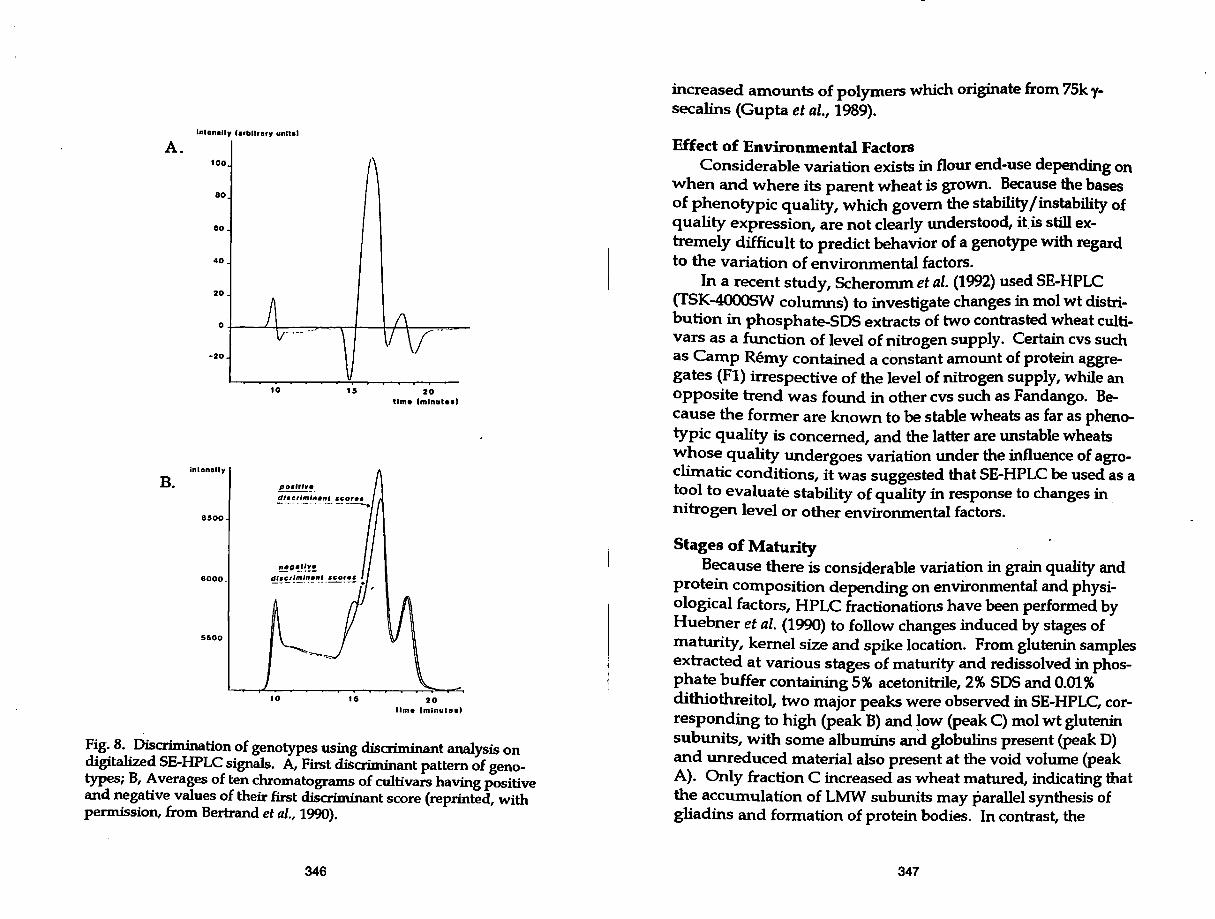
Another attempt took into account not only Rf and intensity of peaks, but the information of the whole elution curve (including the shape of the peaks and shoulders), using an application of classical discriminant analysis of digitalized signals (Bertrand et al., 1990).
Such applications, however, present certain difficulties. The number of data points is often very large. Chromatograms may include several hundred variables, depending on the measurement intervals. Digitalized signals are often redundant (two adjacent data points give al.most the same information). In an attempt to overcome these problems, Bertrand et al. (1990) combined the advantages of factorial analyses with a stepwise procedure which introduces only the more relevant pieces of information. The procedure can be presented as a succession of two principal component analyses (PCA), the first being performed directly on the raw data and giving PC scores, the second being applied on the gravity centers of each qualitative group assessed on the normalized PC scores. The method was tested on a
344
collection of 165 SE-HPLC chromatograms of wheat proteins, consisting of 55 genotypes grown in three areas of cultivation.
While direct observation of the chromatograms gave little information on differences between samples, the use of stepwise canonical discriminant analysis yielded significant classification of samples. This was due to the identification of regions of the curve presenting either positive (peak at 16 min, i.e., 30-45 kDa, corresponding to a-, P- and y-gliadins}, or negative (peak at 15 min, i.e., 60-65 kDa, corresponding to ro-gliadins) values about their first discriminating scores (Fig. 8). For instance, the discrimination of growing locations was performed using seven to nine PC scores and gave more than 86% accurate classifications of samples both in training sets and verification sets. The genotypes were also rather well identified, with more of 85% of the samples correctly classified. Accordingly, analysis of the shape of SE-HPLC chromatograms may be as efficient as RP-HPLC for discriminating wheat genotypes. Also; SE-HPLC runs are three times faster than those typical of RP-HPLC.
Effect of Rye Chromosome Some sets of wheat contain rye chromatin due to the wide
use of 1BL/1RS translocation lines as breeding parents. Dough stickiness and weakness may result.
SE-HPLC comparisons of rye translocation and HMW null lines and interchange experiments allowed MacRitchie et al. (1989) and Dhaliwal and MacRitchie (1990) to demonstrate that dough strength decreases for both sets of lines as the proportion of glutenin (peak 1) is lowered. However, dough strength appeared to decrease to a greater extent with loss of HMW glutenin subunits (null lines) than with loss of LMW subunits (rye translocation lines).
Since rye also contains interchain disulfide-linked proteins, including 75k y-secalins controlled by the Sec-2 locus on chromosome arm 2RS, SE-HPLC elution profiles of total protein revealed that 2BL-2RS translocation lines had significantly higher amounts of polymeric proteins than normal 2BL-2BS lines, suggesting that the higher protein levels and the increase in Extensigraph resistance in 2BL-2RS lines are largely due to
345
lntonally (erbllrary unll•I
A. 100
80
eo
40
20
10 15 20 time Cmln11tH)
inlonalty
B.
6500
8000
5500
10 15 20 llme (mlnut•••
F~g .. 8 .. Discrimination of genotypes using discriminant analysis on digitalized SE-HPLC signals. A, First discriminant pattern of genotypes; B, ~ verages of ten chromatograms of cultivars having positive and negative values of their first discriminant score (reprinted, with permission, from Bertrand et al., 1990).
346
increased amounts of polymers which originate from 75k ysecalins (Gupta et al., 1989).
Effect of Environmental Factors Considerable variation exists in flour end-use depending on
when and where its parent wheat is grown. Because the bases of phenotypic quality, which govern the stability/ instability of quality expression, are not clearly understood, it.is still extremely difficult to predict behavior of a genotype with regard to the variation of environmental factors.
In a recent study, Scheromm et al. (1992) used SE-HPLC (TSK-4000SW columns) to investigate changes in mol wt dismbution in phosphate-SOS extracts of two contrasted wheat cultivars as a function of level of nitrogen supply. Certain cvs such as Camp Remy contained a constant amount of protein aggregates (Fl) irrespective of the level of nitrogen supply, while an opposite trend was found in other cvs such as Fandango. Because the former are known to be stable wheats as far as phenotypic quality is concerned, and the latter are unstable wheats whose quality undergoes variation under the influence of agroclimatic conditions, it was suggested that SE-HPLC be used as a tool to evaluate stability of quality in response to changes in nitrogen level or other environmental factors.
Stages of Maturity Because there is considerable variation in grain quality and
protein composition depending on environmental and physiological factors, HPLC fractionations have been performed by Huebner et al. (1990) to follow changes induced by stages of maturity, kernel size and spike location. From glutenin samples extracted at various stages of maturity and redissolved in phosphate buffer containing 5% acetonitrile, 2% SOS and 0.01% dithiothreitol, two major peaks were observed in SE-HPLC, corresponding to high (peak B) and low (peak q mol wt glutenin subunits, with some albumins and globulins present (peak D) and unreduced material also present at the void volume (peak A). Only fraction C increased as wheat matured, indicating that the accumulation of LMW subunits may parallel synthesis of gliadins and formation of protein bodies. In contrast, the
347
amount of HMW subunits and of other constituents remained nearly constant and may be largely non-storage proteins. Thus, although both types of subunits of glutenin are present early during kernel development, they differ in rates of accumulation.
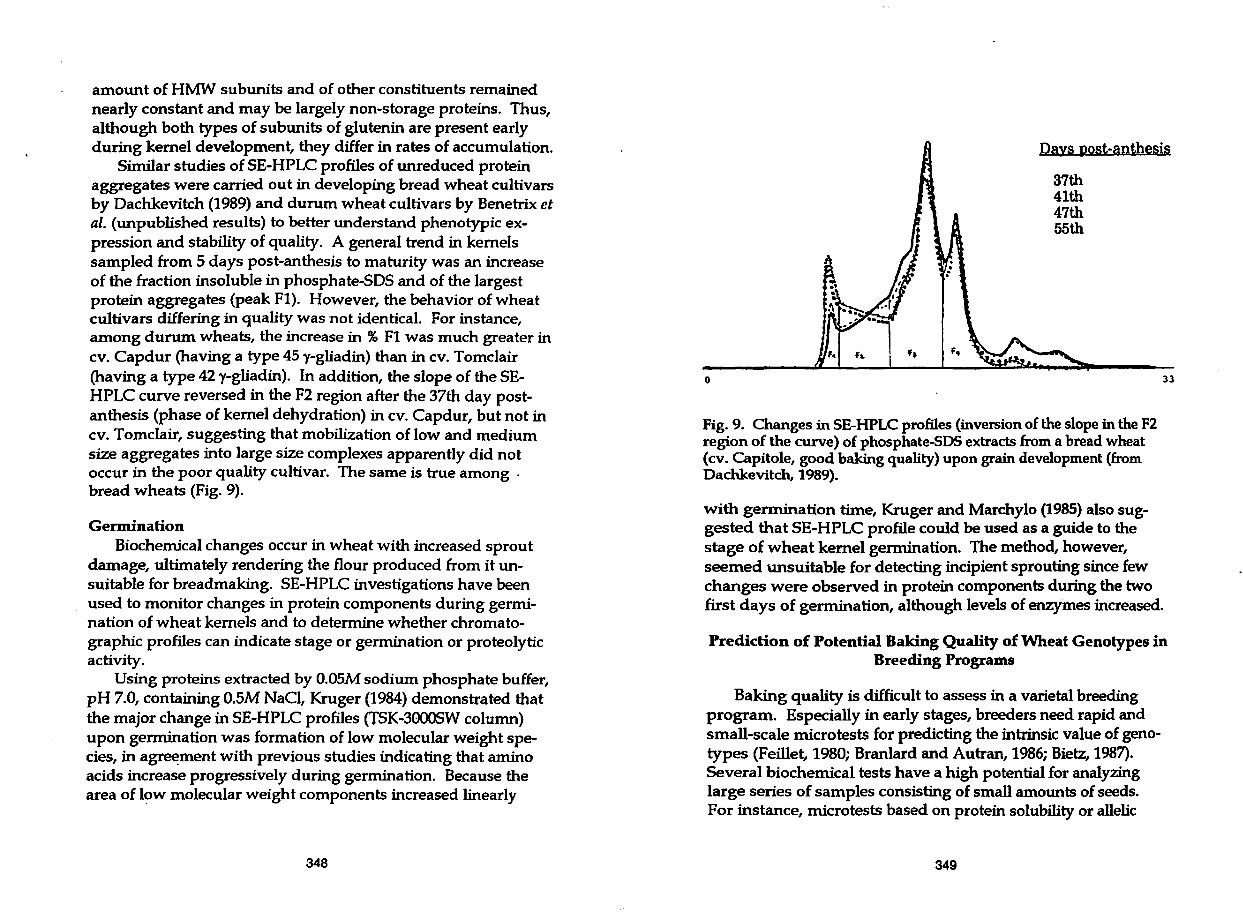
Similar studies of SE-HPLC profiles of unreduced protein aggregates were carried out in developing bread wheat cultivars by Dachkevitch (1989) and durum wheat cultivars by Benetrix et al. (unpublished results) to better understand phenotypic expression and stability of quality. A general trend in kernels sampled from 5 days post-anthesis to maturity was an increase of the fraction insoluble in phosphate-SOS and of the largest protein aggregates (peak Fl). However, the behavior of wheat cultivars differing in quality was not identical. For instance, among durum wheats, the increase in % Fl was much greater in cv. Capdur (having a type 45 y-gliadin) than in cv. Tomclair (having a type 42 y-gliadin). In addition, the slope of the SEHPLC curve reversed in the F2 region after the 37th day postanthesis (phase of kernel dehydration) in cv. Capdur, but not in cv. Tomclair, suggesting that mobilization of low and medium size aggregates into large size complexes apparently did not occur in the poor quality cultivar. The same is true among . bread wheats (Fig. 9).
Germination Biochemical changes occur in wheat with increased sprout
damage, ultimately rendering the flour produced from it unsuitable for breadmaking. SE-HPLC investigations have been used to monitor changes in protein components during germination of wheat kernels and to determine whether chromatographic profiles can indicate stage or germination or proteolytic activity.
Using proteins extracted by 0.05M sodium phosphate buffer, pH 7.0, containing O.SM NaCl, Kruger (1984) demonstrated that the major change in SE-HPLC profiles (TSK-3000SW column) upon germination was formation of low molecular weight species, in agr~ment with previous studies indicating that amino acids increase progressively during germination. Because the area of low molecular weight components increased linearly
348
0
Days post-anthesis
37th 41th 47th 55th
33
Fig. 9. Changes in SE-HPLC profiles (inversion of the slope in the F2 region of the curve) of phosphate-SOS extracts from a bread wheat (cv. Capitole, good baking quality) upon grain development (from Dachkevitch, 1989).
with germination time, Kruger and Marchylo (1985) also suggested that SE-HPLC profile could be used as a guide to the stage of wheat kernel germination. The method, however, seemed unsuitable for detecting incipient sprouting since few changes were observed in protein components during the two first days of germination, although levels of enzymes increased.
Prediction of Potential Baking Quality of Wheat Genotypes in Breeding Programs
Baking quality is difficult to assess in a varietal breeding program. Especially in early stages, breeders need rapid and small-scale microtests for predicting the intrinsic value of genotypes (Feillet, 1980; Branlard and Autran, 1986; Bietz, 1987). Several biochemical tests have a high potential for analyzing large series of samples consisting of small amounts of seeds. For instance, microtests based on protein solubility or allelic
349
variation at loci coding HMW-glutenin subunits yield results generally independent of the agronomic record of samples, and are suitable for screening genotypes in early generations of breeding programs.
However, to evaluate breadmaking potential and use such information intelligently in breeding and during processing, further studies on flour proteins were necessary, not only at the level of monomers or subunits (e.g., using SDS-PAGE), but using methods capable of assessing protein structure and interactions.
The advent of HPLC techniques for wheat protein analyses, with their automation, reproducibility and quantitation, have made possible the rapid screening of large numbers of breeders' samples. This was not possible by low pressure conventional liquid chromatography (Bietz, 1983, 1984a, 1985, 1986; Autran, 1987).
Major advances in this field have been obtained using reversed-phase HPLC (RP-HPLq. Several reports have applied RP-HPLC to quality prediction because of relationships of some specific peaks or chromatographic regions to quality characteristics (Huebner and Bietz, 1985, 1986, 1987; Bumouf and Bietz, 1987; Lookhart and Albers, 1988; Huebner, 1989). ·
Conversely, although it has been reported that baking strength is primarily determined by the occurrence of large protein aggregates (Huebner and Wall, 1976; Field et al., 1983; Millin et al., 1983; Bushuk, 1987), SE-HPLC has been, until these very last years, rarely attempted for quality prediction.
Pioneering studies by Bietz (1984a) and Huebner and Bietz (1985) attempted to extend to HPLC systems t}le previous results of Huebner and Wall (1976), who related the mol wt distribution of A UC-soluble proteins on agarose columns to breadmaking quality. Higher quality wheats contained more proteins of higher molecular weights. Some promising results, obtained from a limited number of samples, confirmed that dough mixing time was correlated with the amount of highmolecular-weight glutenin, or with the ratio of aggregative to monomeric proteins, indicating possible use in breeding (Huebner and Bietz, 1985; Orsi and Bekes, 1986; Orsi et al., 1987; MacRitchie et al., 1989).
350
However, whereas some early results indicated that the magnitud~ of the first peak (> 800 kDa) from unreduced (phosphate-SOS) extracts was directly related to mixing time, later results tended to show the opposite trend because of (i) instability of extracts and (ii) poor control of protein extraction. For instance, Autran (1987) showed from 30 French genotypes that the peak 1 (excluded)/ peak 2(size:115-650 kDa) ratio was negatively related to dough strength and to the elastic recovery of gluten. Further attempts to overcome the instability of protein extracts were carried out by Dachkevitch and Autran (1989) who noticed that a higher extraction temperature (60°C for 2 h) could make the phosphate-SOS extracts ready for SE-HPLC on TSK-4000SW columns without any other equilibration or treatment. Such conditions yielded an extremely stable elution curve, even between supematants stored for 0, 12, 24 or 48 h after extraction. This allowed an automatic sampler to be used with unreduced extracts. .
Dachkevitch and Autran (1989) extended this study three years, and assessed not only correlations with quality data, but also ability to discriminate between genotypes, inheritance, and respective influence of genetics and growing location, year, or protein content.
This study suggested that the negative relationship observed between the proportion of excluded peak and baking strength (Fig. 10) resulted from the use of a mild extraction, which left in the residue a high percentage (up to 30%) of total proteins. It was indicated that use of very efficient solvents (generally not compatible with SE-HPLC columns) would show a positive correlation whereas intermediate conditions (e.g., an acetic acid solvent) would show no correlation at all.
Using extractions by phosphate-SOS (pH 6.9) containing 2% SOS, it was demonstrated that either the percentage of peak 1 or the peak 1/peak 2 ratio has a good ability to discriminate between genotypes (as indicated by the high values of the ratio a2a/ a2L of the variances respectively assignable to genotype and to growing location) and may be more reliable parameters for breeding programs than many ~ther criteria (Table III).
351

Capito le
Recite I
0 s w ~ w ~ ~ Time, min
Fig. 10. Elution profiles obtained by SE-HPLC on a TSK-4000SW column of unreduced flour proteins extracted with phosphate-SOS from three bread wheat cultivars, Promentin, Capitole, and Recital. Column solvent was 0.lM sodium phosphate containing 0.1 % SOS. Elution positions of the molecular weight standards are indicated. Alveograph W indices for the three cultivars are 105, 110, and 200, respectively. The characteristics of the chromatograms of the three cultivars are as follows: %Fl= 11.5, 8.8, and 6.4; Fl/F2 ratio= 0.49, 0.39, and 0.29 (from Oachkevitch and Autran, 1989).
On the other hand, correlations obtained from 65 genotypes grown in three locations in 1985, 1986 and 1987 (Table IV) sug-gested the following observations: ·
• the flour protein content is much more associated to the soluble fraction Fs (r = 0.78***) than to any of the fractions Fl to F4.
352
• both % Fl and % F2 are negatively correlated with Alveograph W index, to Mixograph index, and Zeleny volume, and, to a lesser extent to Alveograph P index, while % Fi and % F3 are positively correlated with these criteria.
• the highest (negative) correlation coefficients with the different baking strength criteria are observed for the Fl/F2 ratio (for instance: r = -0.80*"* with both W index and Mixograph index).
• although the insoluble residue (Fi ) may contribute to baking strength, the correlations involving% Fl or F1/F2 ratio are still significant whether the variation in Fi is or is not taken into account.
• a positive correlation is observed (from a restricted number of samples) between the % F2 and both loaf volumes in French baking technology and dough extensibility, suggesting possible importance of intermediate aggregates as a basis of these "technological characteristics.
TABLE III Analysis of Variance of Some SE-HPLC Chromatographic and Technological Characteristics for 15 Genotypes Grown in Five
Locations in 1985 (from Dachkevitch and Autran, 1989)
Percentage of Variability Assignable to
Growing Characteristic Genotype Location Residue a2G/a2L
% F1 76.4 2.9 20.7 large % F2 70.4 7.8 21.8 9.0 % F3 67.9 14.6 17.5 5.0 % F4 39.5 45.4 15.1 0.8 F1/F2 ratio 62.4 2.9 34.7 large % Fs 17.3 70.2 12.5 0.2 % Fi 9.1 79.3 11.6 0.1 W (Alveograph) 77.1 9.3 13.6 8.0 Mixograph Index 70.3 18.5 11.2 4.0
353
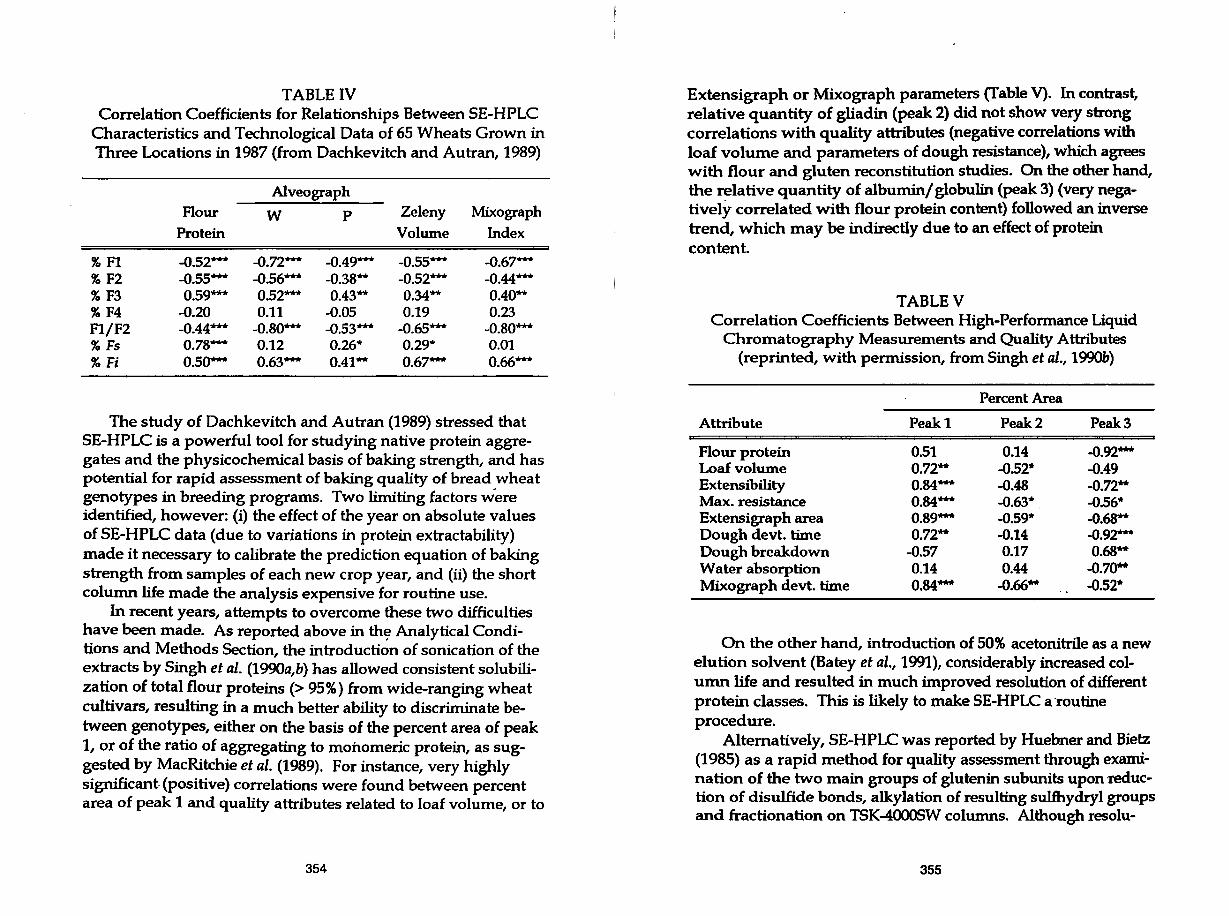
TABLE IV Correlation Coefficients for Relationships Between SE-HPLC
Characteristics and Technological Data of 65 Wheats Grown in Three Locations in 1987 (from Dachkevitch and Autran, 1989)
Alveograph
Flour w p Zeleny Mixograph
Protein Volume Index
% Fl -0.52*** -0.72*** -0.49*** -0.55*** -0.67**'* % F2 -0.55*** -0.56*** -0.38'** -0.52*** -0.44*** % F3 0.59*** 0.52*** 0.43'** 0.34'** 0.40"'* % F4 -0.20 0.11 -0.05 0.19 0.23 F1/F2 -0.44*** -0.80*** -0.53*** -0.65*** -0.80*** % Fs 0.78*** 0.12 0.26* 0.29* 0.01 %Fi 0.50*** 0.63*** 0.41'** 0.67**'* 0.66***
The study of Dachkevitch and Autran (1989) stressed that SE-HPLC is a powerful tool for studying native protein aggregates and the physicochemical basis of baking strength, and has potential for rapid assessment of baking quality of bread wheat genotypes in breeding programs. Two limiting factors were identified, however: (i) the effect of the year on absolute values of SE-HPLC data (due to variations in protein extractability) made it necessary to calibrate the prediction equation of baking strength from samples of each new crop year, and (ii) the short column life made the analysis expensive for routine use.
In recent years, attempts to overcome these two difficulties have been made. As reported above in th~ Analytical Conditions and Methods Section, the introduction of sonication of the extracts by Singh et al. (1990a,b) has allowed consistent solubilization of total flour proteins(> 95%) from wide-ranging wheat cultivars, resulting in a much better ability to discriminate between genotypes, either on the basis of the percent area of peak 1, or of the ratio of aggregating to monomeric protein, as suggested by MacRitchie et al. (1989). For instance, very highly significant. (positive) correlations were found between percent area of peak 1 and quality attributes related to loaf volume, or to
354
Extensigraph or Mixograph parameters (Table V). In contrast, relative quantity of gliadin (peak 2) did not show very strong correlations with quality attributes (negative correlations with loaf volume and parameters of dough resistance), which agrees with flour and gluten reconstitution studies. On the other hand, the r~lative quantity of albumin/ globulin (peak 3) (very negatively correlated with flour protein content) followed an inverse trend, which may be indirectly due to an effect of protein content.
TABLEV Correlation Coefficients Between High-Performance Liquid
Chromatography Measurements and Quality Atbibutes (reprinted, with permission, from Singh et al., 1990b)
Percent Area
Attribute Peakl Peak2 Peak3
Flour protein 0.51 0.14 -0.92*** Loaf volume 0.72 ..... -0.52* -0.49 Extensibility 0.84*** -0.48 -0.72 ..... Max. resistance 0.84*** -0.63* -0.56* Extensigraph area 0.89*** -0.59* -0.68** Dough devt. time 0.72** -0.14 -0.92.,.,.. Dough breakdown -0.57 0.17 0.68 ..... Water absorption 0.14 0.44 -0.70** Mixograph devt. time 0.84*** -0.66 ..... -0.52*
On the other hand, introduction of 50% acetonitrile as a new elution solvent (Batey et al., 1991), considerably increased column life and resulted in much improved resolution of different protein classes. This is likely to make SE-HPLC a ·routine procedure.
Alternatively, SE-HPLC was reported by Huebner and Bietz (1985) as a rapid method for quality assessment through examination of the two main groups of glutenin subunits upon reduction of disulfide bonds, alkylation of resulting sulfhydryl groups and fractionation on TSK-4000SW columns. Although resolu-
355
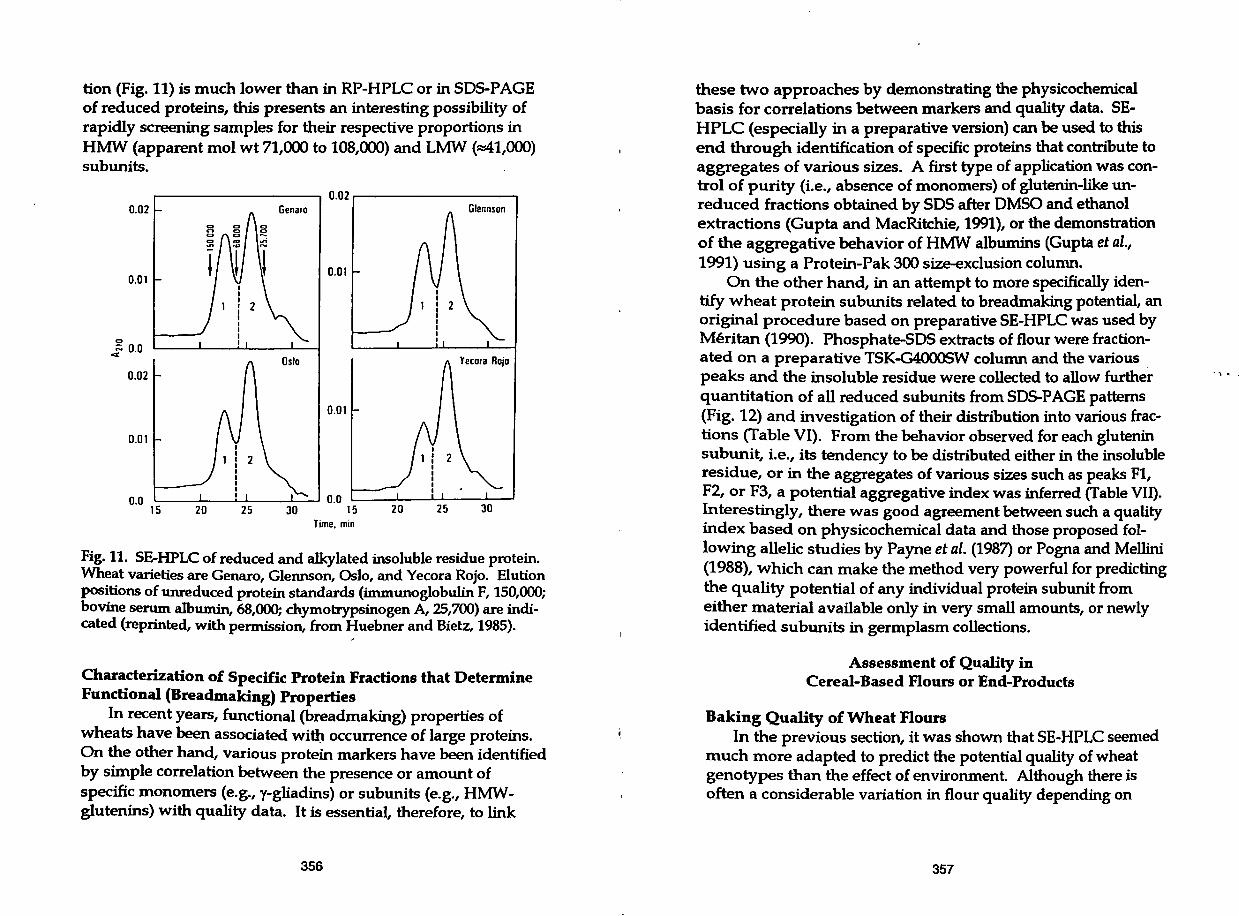
tion (Fig. 11) is much lower than in RP-HPLC or in SOS-PAGE of reduced proteins, this presents an interesting possibility of rapidly screening samples for their respective proportions in HMW (apparent mol wt 71,000 to 108,000) and LMW (~1,000) subunits.
0.02
0.01
]. 0.0
0.02
0.01
0.0
----------... 0.02----------,
0.01
Oslo
0.01
.___ _ _.._ __ ..._ _ _.._--.J 0.0
15 20 25 30 15 Time. min
Yecora Rojo
20 25 30
Fig. 11. SE-HPLC of reduced and alkylated insoluble residue protein. Wheat varieties are Genaro, Glennson, Oslo, and Yecora Rojo. Elution positions of unreduced protein standards (immunoglobulin F, 150,000; bovine serum albumin, 68,000; chymotrypsinogen A, 25,700) are indicated (reprinted, with permission, &om Huebner and Bietz, 1985).
Characterization of Specific Protein Fractions that Determine Functional {Breadmaking) Properties
In recent years, functional (breadmaking) properties of wheats have been associated witl:t occurrence of large proteins. On the other hand, various protein markers have been identified by simple correlation between the presence or amount of specific monomers (e.g., y-gliadins) or subunits (e.g., HMWglutenins) with quality data. It is essential, therefore, to link
356
these two approaches by demonstrating the physicochemical basis for correlations between markers and quality data. SEHPLC (especially in a preparative version) can be used to this end through identification of specific proteins that contribute to aggregates of various sizes. A first type of application was control of purity (i.e., absence of monomers) of glutenin-like unreduced fractions obtained by SOS after OMSO and ethanol extractions (Gupta and MacRitchie, 1991), or the demonstration of the aggregative behavior of HMW albumins (Gupta et al., 1991) using a Protein-Pak 300 size-exclusion column.
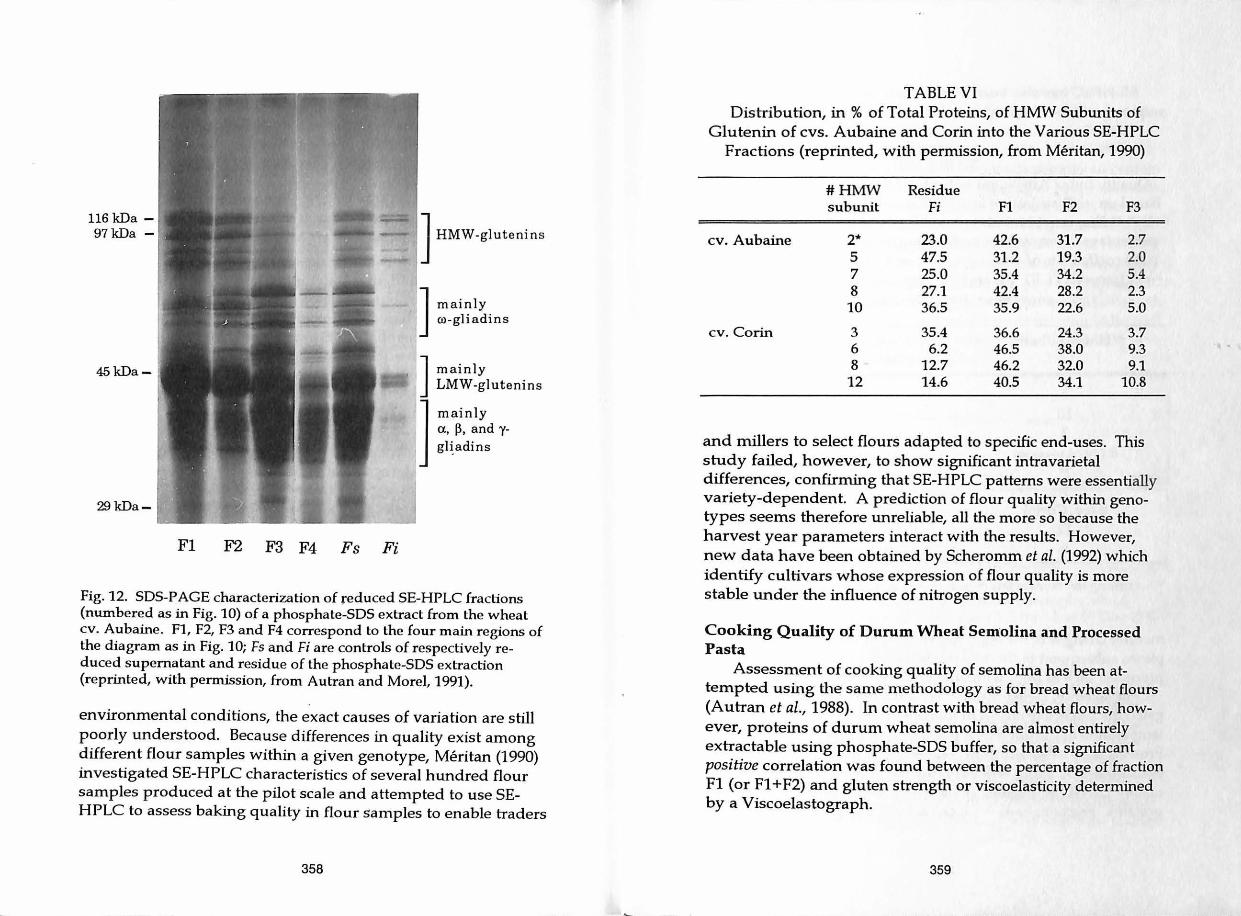
On the other hand, in an attempt to more specifically identify wheat protein subunits related to breadmaking potential, an original procedure based on preparative SE-HPLC was used by Meritan (1990). Phosphate-SOS extracts of flour were fractionated on a preparative TSK-G4000SW column and the various peaks and the insoluble residue were collected to allow further quantitation of all reduced subunits from SOS-PAGE patterns (Fig. 12) and investigation of their distribution into various fractions (Table VI). From the behavior observed for each glutenin subunit, i.e., its tendency to be distributed either in the insoluble residue, or in the aggregates of various sizes such as peaks Fl, F2, or F3, a potential aggregative index was inferred (fable VII) . Interestingly, there was good agreement between such a quality index b~sed on physicochemical data and those proposed following allelic studies by Payne et al. (1987) or Pogna and Mellini (1988), which can make the method very powerful for predicting the quality potential of any individual protein subunit from either material available only in very small amounts, or newly identified subunits in germplasm collections.
Assessment of Quality in Cereal-Based Flours or End-Products
Baking Quality of Wheat Flours In the previous section, it was shown that SE-HPLC seemed
much more adapted to predict the potential quality of wheat genotypes than the effect of environment. Although there is often a considerable variation in flour quality depending on
357
., " .
116 kDa -97kDa -
45kDa-
29kDa-
Fl F2 F3 F4 Fs Fi
J HMW-glutenins
] mainly ro-gliadins
] mainly LMW-glutenins
]
mainly o:, ~. and ygl~ adins
Fig. 12. SDS-P AGE characterization of reduced SE-HPLC fractions (numbered as in Fig. 10) of a phosphate-SOS extract from the wheat cv. Aubaine. Fl, F2, F3 and F4 correspond to the four main regions of the diagram as in Fig. 10; Fs and Fi are controls of respectively reduced supernatant and residue of the phosphate-SOS extraction (reprinted, with permission, from Autran and Morel, 1991).
environmental conditions, the exact causes of variation are still poorly understood. Because differences in quality exist among different flour samples within a given genotype, Meritan (1990) investigated SE-HPLC characteristics of several hundred flour samples produced at the pilot scale and attempted to use SEHPLC to assess baking quality in flour samples to enable traders
358
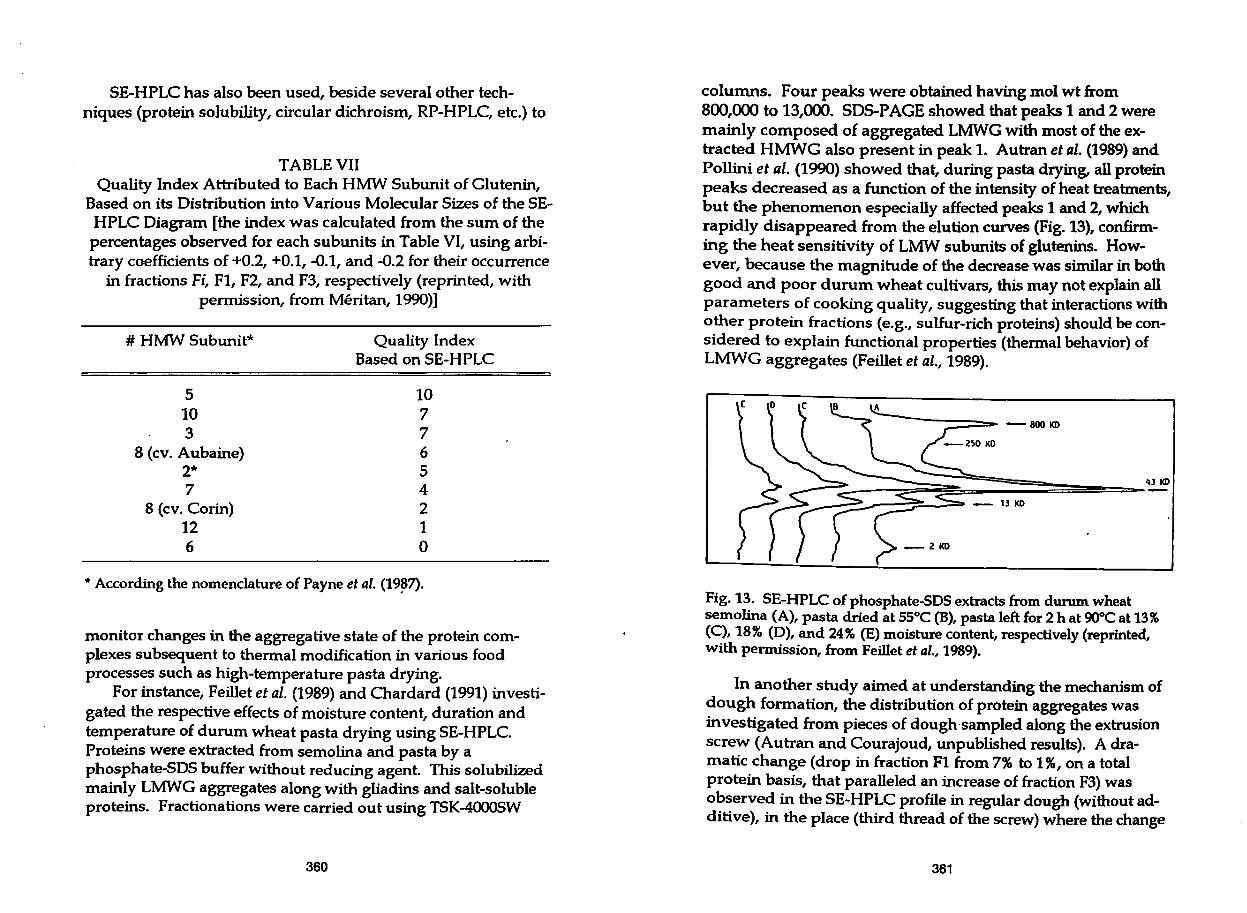
TABLE VI Distribution, in % of Total Proteins, of HMW Subunits of
Glutenin of cvs. Aubaine and Corin into the Various SE-HPLC Fractions (reprinted, with permission, from Meritan, 1990)
#HMW Residue subunit Fi Fl F2 F3
cv. Aubaine 2* 23.0 42.6 31.7 2.7 5 47.5 31.2 19.3 2.0 7 25.0 35.4 34.2 5.4 8 27.1 42.4 28.2 2.3 10 36.5 35.9 22.6 5.0
cv. Corin 3 35.4 36.6 24.3 3.7 6 6.2 46.5 38.0 9.3 8 12.7 46.2 32.0 9.1
12 14.6 40.5 34.1 10.8
and millers to select flours adapted to specific end-uses. This study failed, however, to show significant intravarietal differences, confirming that SE-HPLC patterns were essentially variety-dependent. A prediction of flour quality within genotypes seems therefore unreliable, all the more so because the harvest year parameters interact with the results. However, new data have been obtained by Scheromm et al. (1992) which identify cultivars whose expression of flour quality is more stable under the influence of nitrogen supply.
Cooking Quality of Durum Wheat Semolina and Processed Pasta
Assessment of cooking quality of semolina has been attempted using the same methodology as for bread wheat flours (Autran et al., 1988). In contrast with bread wheat flours, however, proteins of durum wheat semolina are almost entirely extractable using phosphate-SDS buffer, so that a significant positive correlation was found between the percentage of fraction Fl (or Fl +F2) and gluten strength or viscoelasticity determined by a Viscoelastograph.
359
SE-HPLC has also been used, beside several other techniques (protein solubility, circular dichroism, RP-HPLC, etc.) to
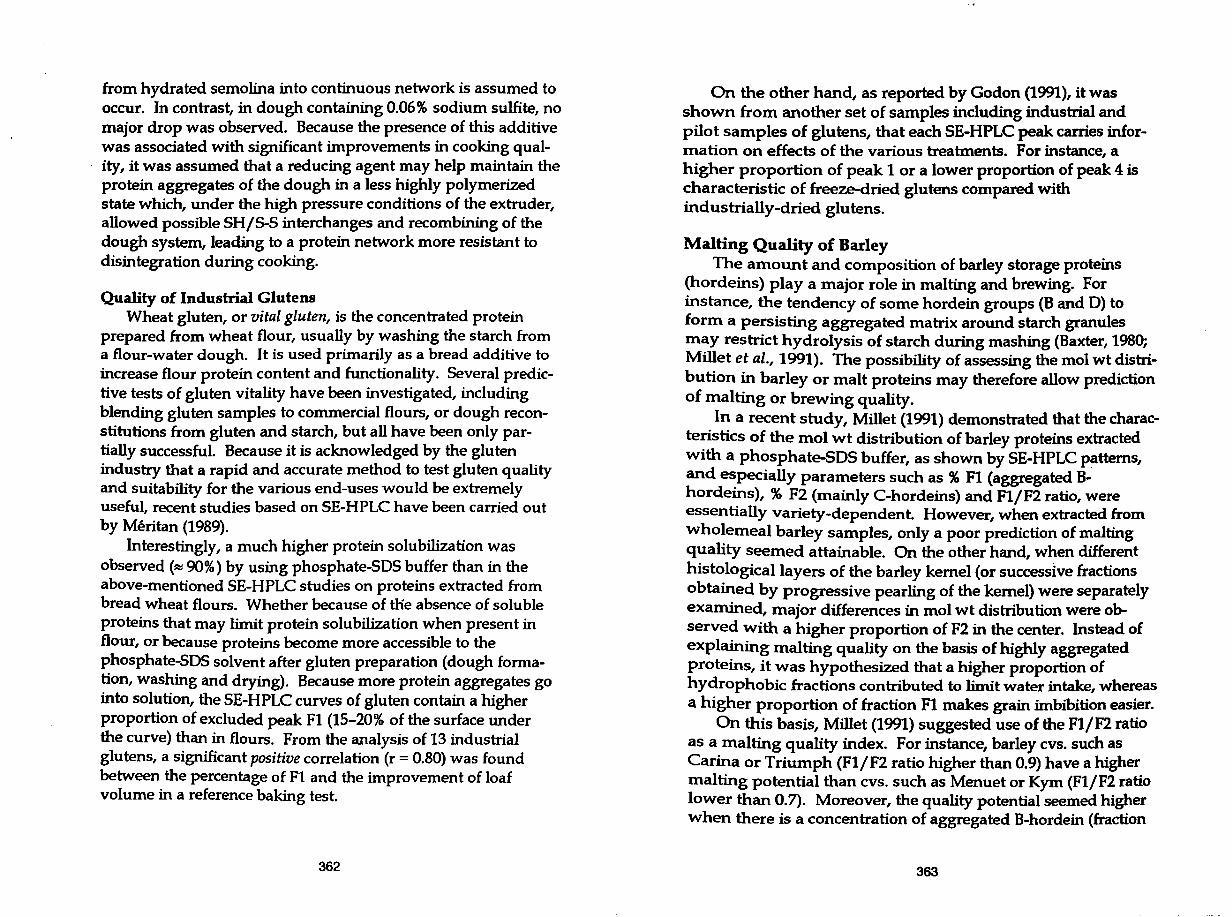
TABLE VII Quality Index Attributed to Each HMW Subunit of Glutenin,
Based on its Disbibution into Various Molecular Sizes of the SEHPLC Diagram [the index was calculated from the sum of the percentages observed for each subunits in Table VI, using arbitrary coefficients of +0.2, +0.1, -0.1, and -0.2 for their occurrence
in fractions Fi, Fl, F2, and F3, respectively (reprinted, with permission, from Meritan, 1990)]
# HMW Subunit*
5 10 3
8 (cv. Aubaine) 2* 7
8 (cv. Corin) 12 6
Quality Index Based on SE-HPLC
10 7 7 6 5 4 2 1 0
* According the nomenclature of Payne et al. (19~7).
monitor changes in the aggregative state of the protein complexes subsequent to thermal modification in various food processes such as high-temperature pasta drying.
For instance, Feillet et al. (1989) and Chardard (1991) investigated the respective effects of moisture content, duration and temperature of durum wheat pasta drying using SE-HPLC. Proteins were extracted from semolina and pasta by a phosphate-SOS buffer without reducing agent. This solubilized mainly LMWG aggregates along with gliadins and salt-soluble proteins. Fractionations were carried out using TSK-4000SW
360
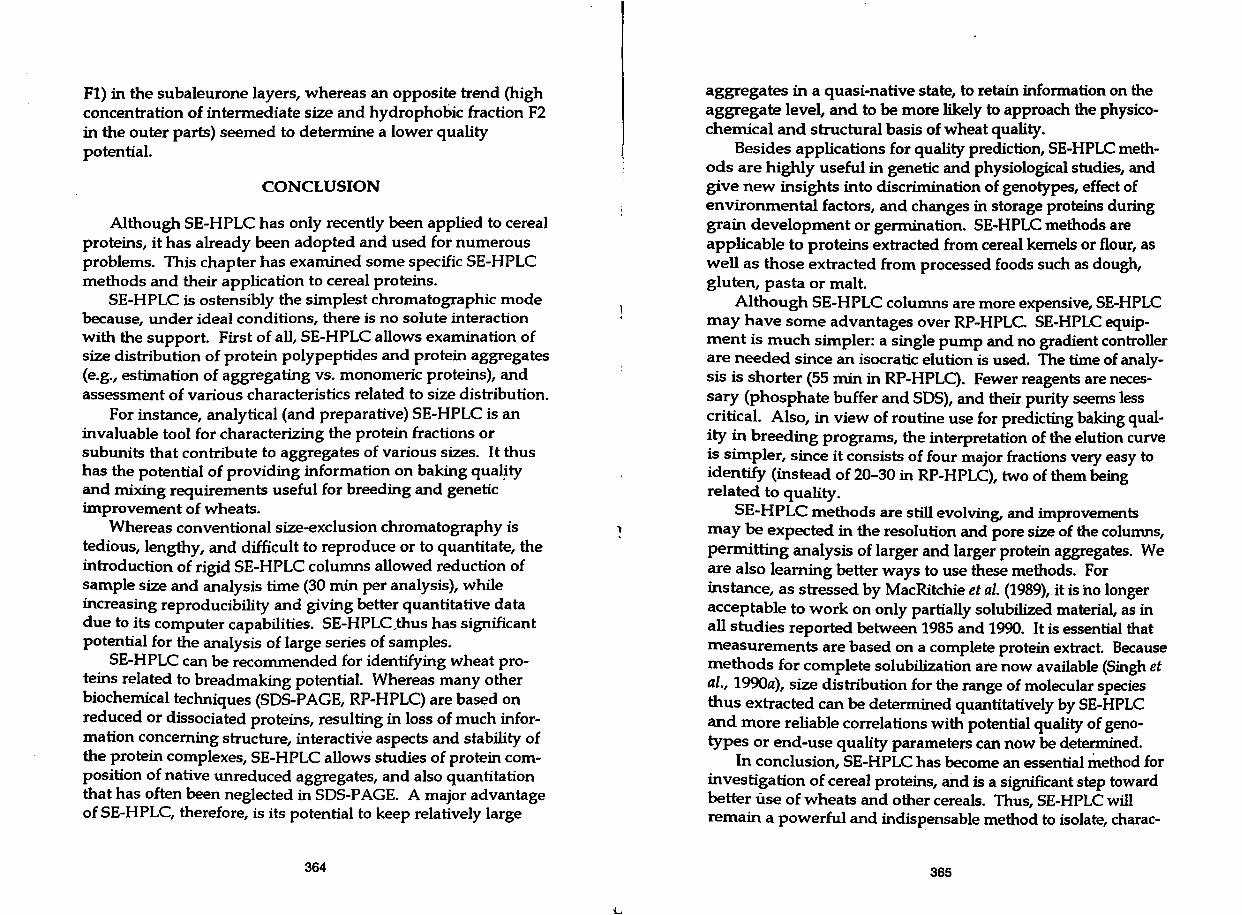
columns. Four peaks were obtained having mol wt from 800,000 to 13,000. SDS-P AGE showed that peaks 1 and 2 were mainly composed of aggregated LMWG with most of the extracted HMWG also present in peak 1. Autran et al. (1989) and Pollini et al. (1990) showed that, during pasta drying, all protein peaks decreased as a function of the intensity of heat treatments, but the phenomenon especially affected peaks 1 and 2, which rapidly disappeared from the elution curves (Fig. 13), confirming the heat sensitivity of LMW subunits of glutenins. However, because the magnitude of the decrease was similar in both good and poor durum wheat cultivars, this may not explain all parameters of cooking quality, suggesting that interactions with other protein fractions (e.g., sulfur-rich proteins) should be considered to explain functional properties (thermal behavior) of LMWG aggregates (Feillet et al., 1989).
Fig. 13. SE-HPLC of phosphate-SOS extracts .&om durum wheat semolina (A), pasta dried at 55°C {B), pasta left for 2 hat 90°C at 13% (C), 18% (D), and 24% (E) moisture content, respectively (reprinted, with permission, from Feillet et al., 1989).
In another study aimed at understanding the mechanism of dough formation, the distribution of protein aggregates was investigated from pieces of dough·sampled along the extrusion screw (Autran and Courajoud, unpublished results). A dramatic change (drop in fraction Fl from 7% to 1%, on a total protein basis, that paralleled an increase of fraction F3) was observed in the SE-HPLC profile in regular dough (without additive), in the place (third thread of the screw) where the change
361
from hydrated semolina into continuous network is assumed to occur. In contrast, in dough containing 0.06% sodium sulfite, no major drop was observed. Because the presence of this additive was associated with significant improvements in cooking quality, it was assumed that a reducing agent may help maintain the protein aggregates of the dough in a less highly polymerized state which, under the high pressure conditions of the extruder, allowed possible SH/S-S interchanges and recombining of the dough system, leading to a protein network more resistant to disintegration during cooking.
Quality of Industrial Glutens Wheat gluten, or vital gluten, is the concentrated protein
prepared from wheat flour, usually by washing the starch from a flour-water dough. It is used primarily as a bread additive to increase flour protein content and functionality. Several predictive tests of gluten vitality have been investigated, including blending gluten samples to commercial flours, or dough reconstitutions from gluten and starch, but all have been only partially successful. Because it is acknowledged by the gluten industry that a rapid and accurate method to test gluten quality and suitability for the various end-uses would be extremely useful, recent studies based on SE-HPLC have been carried out by Meritan (1989).
Interestingly, a much higher protein solubilization was observed <~ 90%) by using phosphate-SOS buffer than in the above-mentioned SE-HPLC studies on proteins extracted from bread wheat flours. Whether because of tlie absence of soluble proteins that may limit protein solubilization when present in flour, or because proteins become more accessible to the phosphate-SOS solvent after gluten preparation (dough formation, washing and drying). Because more protein aggregates go into solution, the SE-HPLC curves of gluten contain a higher proportion of excluded peak Fl (15-20% of the surface under the curve) than in flours. From the analysis of 13 industrial glutens, a significant positive correlation (r = 0.80) was found between the percentage of Fl and the improvement of loaf volume in a reference baking test.
362
On the other hand, as reported by Godon (1991), it was shown from another set of samples including industrial and pilot samples of glutens, that each SE-HPLC peak carries information on effects of the various treatments. For instance, a higher proportion of peak 1 or a lower proportion of peak 4 is characteristic of freeze-dried glutens compared with industrially-dried glutens.
Malting Quality of Barley The amount and composition of barley storage proteins
(hordeins) play a major role in malting and brewing. For instance, the tendency of some hordein groups (B and D) to form a persisting aggregated matrix around starch granules may restrict hydrolysis of starch during mashing (Baxter, 1980; Millet et al., 1991). The possibility of assessing the mol wt distribution in barley or malt proteins may therefore allow prediction of malting or brewing quality.
In a recent study, Millet (1991) demonstrated that the characteristics of the mol wt distribution of barley proteins extracted with a phosphate-SOS buffer, as shown by SE-HPLC p~ttems, and especially parameters such as % Fl (aggregated Bhordeins ), % F2 (mainly C-hordeins) and Fl/F2 ratio, were essentially variety-dependent. However, when extracted from · wholemeal barley samples, only a poor prediction of malting quality seemed attainable. On the other hand, when different histological layers of the barley kernel (or successive fractions obtained by progressive pearling of the kernel) were separately examined, major differences in mol wt distribution were observed with a higher proportion of F2 in the center. Instead of explaining malting quality on the basis of highly aggregated proteins, it was hypothesized that a higher proportion of hydrophobic fractions contributed to limit water intake, whereas a higher proportion of fraction Fl makes grain imbibition easier.
On this basis, Millet (1991) suggested use of the F1/F2 ratio as a malting quality index. For instance, barley cvs. such as Carina or Triumph (F1/F2 ratio higher than 0.9) have a higher malting potential than cvs. such as Menuet or Kym (Fl/F2 ratio lower than 0.7). Moreover, the quality potential seemed higher when there is a concentration of aggregated B-hordein (fraction
363
Fl) in the subaleurone layers, whereas an opposite trend (high concentration of intermediate size and hydrophobic fraction F2 in the outer parts) seemed to determine a lower quality potential.
CONCLUSION
Although SE-HPLC has only recently been applied to cereal proteins, it has already been adopted and used for numerous problems. This chapter has examined some specific SE-HPLC methods and their application to cereal proteins.
SE-HPLC is ostensibly the simplest chromatographic mode because, under ideal conditions, there is no solute interaction with the support. First of all, SE-HPLC allows examination of size distribution of protein polypeptides and protein aggregates (e.g., estimation of aggregating vs. monomeric proteins), and assessment of various characteristics related to size distribution.
For instance, analytical (and preparative) SE-HPLC is an invaluable tool for characterizing the protein fractions or subunits that contribute to aggregates of various sizes. It thus has the potential of providing information on baking qua~ty and mixing requirements useful for breeding and genetic improvement of wheats.
Whereas conventional size-exclusion chromatography is tedious, lengthy, and difficult to reproduce or to quantitate, the introduction of rigid SE-HPLC columns allowed reduction of sample size and analysis time (30 min per analysis), while increasing reproducibility and giving better quantitative data due to its computer capabilities. SE-HPLC,thus has significant potential for the analysis of large series of samples.
SE-HPLC can be recommended for identifying wheat proteins related to breadmaking potential. Whereas many other biochemical techniques (SOS-PAGE, RP-HPLC) are based on reduced or dissociated proteins, resulting in loss of much information concerning structure, interactive aspects and stability of the protein complexes, SE-HPLC allows studies of protein composition of native unreduced aggregates, and also quantitation that has often been neglected in SOS-PAGE. A major advantage of SE-HPLC, therefore, is its potential to keep relatively large
364
l
aggregates in a quasi-native state, to retain information on the aggregate level, and to be more likely to approach the physicochemical and structural basis of wheat quality.
Besides applications for quality prediction, SE-HPLC methods are highly useful in genetic and physiological studies, and give new insights into discrimination of genotypes, effect of environmental factors, and changes in storage proteins during grain development or germination. SE-HPLC methods are applicable to proteins extracted from cereal kernels or flour, as well as those extracted from processed foods such as dough, gluten, pasta or malt.
Although SE-HPLC columns are more expensive, SE-HPLC may have some advantages over RP-HPLC. SE-HPLC equipment is much simpler: a single pump and no gradient controller are needed since an isocratic elution is used. The time of analysis is shorter (55 min in RP-HPLC). Fewer reagents are necessary (phosphate buffer and SOS), and their purity seems less critical. Also, in view of routine use for predicting baking quality in breeding programs, the interpretation of the elution curve is simpler, since it consists of four major fractions very easy to identify (instead of 20-30 in RP-HPLC), two of them being related to quality.
SE-HPLC methods are still evolving, and improvements may be expected in the 1·esolution and pore size of the columns, permitting analysis of larger and larger protein aggregates. We are also learning better ways to use these methods. For instance, as stressed by MacRitchie et al. (1989),.it is ho longer acceptable to work on only partially solubilized material, as in all studies reported between 1985 and 1990. It is essential that measurements are based on a complete protein extract. Because methods for complete solubilization are now available (Singh et al., 1990a), size distribution for the range of molecular species thus extracted can be determined quantitatively by SE-HPLC and more reliable correlations with potential quality of genotypes or end-use quality parameters can now be determined.
In conclusion, SE-HPLC has become an essential method for investigation of cereal proteins, and is a significant step toward better use of wheats and other cereals. Thus, SE-HPLC will remain a powerful and indispensable method to isolate, charac-
365
terize and compare proteins of grains, flours, or processed cereal products. It will help us explore and further improve the full potential and the industrial use of cereals, assuring good quality of cereals and cereal-based products.
LITERATURE CITED
Autran, J.-C. 1987. Biochemical tests for the evaluation of wheat technological quality: Their potential in breeding programs. Pages 19-37 in: Proc. Seminar on Hard Wheats in the E.E.C.: Agronomical, Biochemical, Genetic and Technological Aspects. B. Borghi, ed. Commission of the European Communities, 3-5 June, San Angelo Lodigiano (Milano), Italy.
Autran, J.-C. and Morel, M. H. 1991. Variabilite et controle genetique de la composition des bles en glutenines de haut poids moleculaire: Contribution de certaines sous-unites a la formation d'agregats. Pages 234-244 in: Compte Rendu Scientifique de l' A.I.P. Structure, Fonctionnalite et Determinisme Genetique et Agronomique des Glutenines de Haut Poids Moleculaire. P. Feillet, ed. lnstitut National de la Recherche Agronomique, Paris.
Autran, J.-C., Ait-Mouh, 0. and Feillet, P. 1989. Themial modification of gluten as related to end-use properties. Pages 563-593 in: Wheat is Unique: Structure, Composition, Processing, End-Use Properties, and Products. Y. Pomeranz, ed. AACC, St. Paul, MN.
Autran, J.-C., Dachkevitch, T. and Feillet, P. 1988. Size-exclusion high-performance liquid chromatography of bread wheat and durum wheat proteins: An effic!ent tool for predicting quality in breeding programs and investigating physicochemical basis of quality. Cereal Foods World 33:689.
Batey, I. L., Gupta, R. B. and MacRitchie, F. 1991. Use of sizeexclusion high-performance liquid chromatography in the study of wheat flour proteins: an improved chromatographic procedure. Cereal Chem. 68:207-209.
Baxter, E. D. 1980. Sulfur-containing hordeins and their importance in malting and brewing. Brew. Dig. 55 (1):45-47.
Belitz, H.-D., Kim, J. J.1 Kieffer, R., Seilmeier, W., Werbeck, U. and Wieser, H. 1987. Separation and characterization of
366
·-·
reduced glutelins from different wheat varieties and importance of the gliadin/ glutenin ratio for the strength of gluten. Pages 189-205 in: Proc. 3rd International Workshop on Gluten Proteins. R. Lasztity and F. Bekes, eds. World Scientific, 6-9 May, Budapest, Hungary.
Bertrand, D., Courcoux, P., Autran, J.-C., Meritan, R. and Robert, P. 1990. Stepwise factorial discriminant analysis of continuous digitalized signals. Application to chromatograms of wheat proteins. Journal of Chemomehics 4:413-427.
Bietz, J. A. 1983. Separation of cereal proteins by reversed-phase high-performance liquid chromatography. J. Chromatogr. 255:219-238.
Bietz, J. A. 1984a. Analysis of wheat gluten proteins by reversed-phase high-performance liquid chromatography, part I. Bakers Dig. 58(1):15-17, 20-31, 32.
Bietz, J. A. 1984b. Analysis of wheat gluten proteins by reversed-phase high-performance liquid chromatography, part II. Bakers Dig. 58(2):22, 24~
Bietz, J. A. 1985. High performance liquid chromatography: how proteins look in cereals. Cereal Chem. 62:201-212.
Bietz, J. A. 1986. HPLC of cereal proteins. Pages 105-170 in: Advances in Cereal Science and Technology. Y. Pomeranz, ed. AACC, St. Paul, MN.
Bietz, J. A. 1987. Genetic and biochemical studies of nonenzymatic endosperm proteins. Pages 215-241 in: Wheat and Wheat Improvement, 2nd ed. E. G. Heyne, ed. ~erican Society of Agronomy Inc., Madison, WI, USA.
Bietz, J. A. 1990. HPLC of cereal endosperm storage proteins. Pages 429-455 in: HPLC.ofBio_logical Macromolecules, Methods and Applications. K. M. Gooding and F. E. Regnier, eds. Marcel Dekker Inc., New York, NY, USA.
Bietz, J. A. and Wall, J. S. 1980. Identity of high molecular weight gliadin and ethanol-soluble glutenin subunits of wheat: relation to gluten structure. Cereal Chem. 57:415-421.
367
Branlard, G. and Autran, J.-C. 1986. L'amelioration genetique de la qualite technologique du ble tendre. Culture Technique 16:132-144.
Bumouf, T. and Bietz, J. A. 1987. Identification of wheat cultivars and prediction of quality by reversed-phase highperformance liquid chromatography analysis of endosperm storage proteins. Seed Sci. Technol. 15:79-99.
Bushuk, W. 1987. Aspects of chemical and physical structure of wheat proteins that determine breadmaking quality. Pages 7-17 in: Proc. Seminar on Hard Wheats in the E.E.C.: Agronomical, Biochemical, Genetic and Technological Aspects. B. Borghi, ed. Commission of the European Communities, 3-5 June, San Angelo Lodigiano (Milano), Italy.
Chardard, I. 1991. Etude des interactions des proteines au cours des processus de fabrication et de traitements hydrothermiques des pates alimentaires. Role fonctionnel des fractions DSG. These (Doctorat), Universite des Sciences et Techniques du Languedoc, 256p.
Dachkevitch, T. 1989. Etude des complexes proteiques du ble tendre par chromatographie liquide a haute performance de tamisage moleculaire (SE-HPLC): relation avec Ia qnalite technologique. These, Universite des Sciences et Techniques du Languedoc, 127p.
Dachkevitch, T. and Autran, J.-C. 1989. Prediction of baking quality of bread wheats in breeding programs by sizeexclusion high-performance liquid chromatography. Cereal Chem. 66:448-456.
Danno, G., Kanazawa, K. and Natake, M. 1974. Extraction of wheat flour proteins with sodium dodecyl sulfate and their molecular weight distribution. Agric. Biol. Chem. 38:1947-1953.
Dhaliwal, A. S. and MacRitchie, F. 1990. Contributions of protein fractions to dough handling properties of wheat-rye translocation cultivars. J. Cereal.Sci. 12:113-122.
Feillet, P. 1980. Evaluation and measurements of wheat quality. Pages 183-200 in: Recent Progress in Cereal Chemistry and Technology. G. Charalambous, ed. Academic Press, London.
Feillet, P., Ait-Mouh, 0., Kobrehel, K. and Autran, J.-C. 1989. The role of low molecular weight glutenins in the
368
determination of cooking quality of pasta products: An overview. Cereal Chem. 66:26-30.
Field, J. M., Shewry, P. R. and Millin, B. J. 1983. Aggregation states of alcohol-soluble storage proteins of barley, rye, wheat and maize. J. Sci. Food Agric. 34: 362-370.
Godon, B. 1969. Etude physico-chimique des associations proteiques du gluten de ble. These (Doctorat). Faculte.des Sciences, Paris, 133p.
Godon, B. 1991. Des methodes pour caracteriser les glutens industriels. Ind. Alim. Agric. 108:131-140.
Gooding, K. M. 1986. High-performance liquid chromatography of proteins- a current look at the state of the technique. BioChromatography 1:34-40.
Gupta, R. B. and MacRitchie, F. 1991. A rapid one-step one dimensional SOS-PAGE procedure for analysis of subunit composition of glutenin in wheal J. Cereal Sci. 14:105-109.
Gupta, R. B., Shepherd, K. W. and MacRitchie, F. 1989. Effect of rye chromosome arm 2RS on flour proteins and physical dough properties in bread wheat. J. Cereal Sci. 10:169-173.
Gupta, R. B., Shepherd, K. W. and MacRitchie, F. 1991. Genetic control and biochemical properties of some high-molecular weight albumins in bread wheat. J. Cereal Sci. 13:221-235.
Hamauzu, Z., Khan, K. and Bushuk, W. 1979. Studies of glutenin. XIV. Gel filtration and sodium dodecyl sulfate electrophoresis of glutenin solubilized in sodium stearate. Cereal Chem. 56:513-516.
Huebner, F. R. 1989. Assessment of potential breadmaking quality of hard spring wheats by high-performance liquid chromatography of gliadins-Year two. Cereal Chem. 66:333-337.
Huebner, F. R. and Bietz, J. A. 1985. Detection of quality differences among wheats by high-performance liquid chromatography. J. Chromatogr. 327:333-342.
Huebner, F. R. and Bietz, J. A. 1986. Assessment of the potential breadmaking quality of hard wheats by reversed-phase high-performance liquid chromatography of gliadins. J. Cereal Sci. 4:370-388.
Huebner, F. R. and Bietz, J. A. 1987. Improvements in wheat protein analysis and quality prediction by reversed-phase
369
high-performance liquid chromatography. Cereal Chem. 64:15-20.
Huebner, F. R. and Wall, J. S. 1976. Fractionation and quantitative differences of glutenin from wheat varieties varying in baking quality. Cereal Chem. 53:258.
Huebner, F. R., Kaczkowski, J. and Bietz, J. A. 1990. Quantitative variation of wheat proteins from grain at different stages of maturity and from different spike locations. Cereal Chem. 67:464-470.
Khan, K. and Bushuk, W. 1979. Studies of glutenin. XII. Comparison by sodium dodecyl sulfate-polyacrylamide gel electrophoresis of unreduced and reduced glutenin from various isolation and purification procedures. Cereal Chem. 56:63-68.
Kruger, J.E. 1984. Rapid analysis of changes in the molecular weight distribution of buffer-soluble proteins during germination of wheat. Cereal Chem. 61:205-208.
Kruger, J. E. and Marchylo, B. A. 1985. Examination of the mobilization of storage proteins of wheat kernels during germination by high-performance reversed-phase and gel permeation chromatography. Cereal Chem. 62:1-5 ..
Lookhart, G. L. and Albers, L. D. 1988. Correlations between reversed-phase high-performance liquid chromatography and acid- and sodium dodecyl sulfate-polyacrylamide gel electrophoretic data on prolamins from sister lines differing in baking quality. Cereal Chem. 65:222-227.
Lundh, G. and MacRitchie, F. 1989. Size exclusion HPLC characterisation of gluten protein fractions varying in breadmaking potential. J. Cereal Sci. 10:247~253.
MacRitchie, F., Gupta, R. B. and Wrigley, C. W. 1989. Chemical aspects of wheat proteins related to breadmaking potential. Pages 115-122 in: Wheat End-Use Properties, Proceedings from ICC '89. H. Salovaara, ed. University of Helsinki, 13-15 June, Lahti, Finland.
Meritan, R. 1990. Etude des proteines de ble tendre par chromatographie liquide a haute performance de tamisage moleculaire: contribution a }'appreciation de la qualite boulangere. These (Doctorat), lnstitut National Agronomique ParisGrignon, 154p.
370
Millin, B. ]., Field, J.M. and Shewry, P.R. 1983. Cereal storage proteins and their effect on technological properties. Pages 255-319 in: Seed Proteins, Phytochemical Society of Europe Symposia, Series n° 20. J. Daussant, J. Mosse and J. Vaughan, eds. Academic Press, London.
Millet, M. 0. 1991. Etude du caractere agregatif des proteines de l'orge. Relations avec la qualite malticole et brassicole. These (Doctorat), Universite des Sciences et Techniques du Languedoc, 179p.
Millet, M. 0., Montembault, A. and Autran, J.-C. 1991. Hordein composition differences in various anatomical regions of the kernel between two different barley types. Sciences des Aliments 11:155-161.
Orsi, F. and Bekes, F. 1986. Investigation of cereal proteins by HPLC. Pages 233-240 in: Chromatography '85, Symp. Biol. Hung. H. Kalasz and L. S. Ettre, eds. Akademiai Kiado, Budapest, Hungary. ·
Orsi, F., Pallagi, E., Bekes, F. and Lasztity, R. 1987. Investigation of wheat proteins by high performance gel chromatography. Pages 141-160 in: Proc. 3rd International Workshop on Gluten Proteins. R. Lasztity and F. Bekes, eds. World Scientific, 6-9 May, Budapest, Hungary.
Pasaribu, S. J., Tomlinson, J. D. and McMaster, G. J. 1992. Fractionation of wheat flour proteins by size exclusion HPLC on an agarose-based matrix. J. Cereal Sci. 15:121-136.
Payne, P. I., Nightingale, M.A., Krattiger, A. F. and Holt, L. M. 1987. The relationship between HMW glutenin subunit composition and the bread-making qualit}' of British-grown wheat varieties. J. Sci. Food Agric. 40:51-65.
Pogna, N. E., Mellini, F., Beretta, A. and Dal Belin Peruffo, A. 1989. The high-molecular-weight glutenin subunits of comm.on wheat cultivars grown in Italy. J. Genet. Breed. 43:17-24.
Pollini, C. and Tonatello, C. 1990. HPLC characterization of proteins during pasta production. Page 81 in: New Trends in Cereal Food, ICC/ AACC Symposium Interactions of Cereal Components and their Implications for the Future,
371
International Association of Cereal Chemistry, 29-31 May, Vienna, Austria.
Scheromm, P., Martin, G., Bergoin, A. and Autran, ]. C. 1992. Influence of nitrogen fertilization on the potential breadbaking quality of two wheat cultivars differing in their responses to increasing nitrogen supplies. Cereal Chem. 69:664-670.
Seilmeier, W., Wieser, H. and Belitz, H.-D. 1987. Highperformance liquid chromatography of reduced glutenin: Amino acid composition of fractions and components. Z. Lebensm.-Unters. Forsch. 185:487-489.
Singh, N. K., Donovan, G. R., Batey, I. L. and MacRitchie, F. 1990a. Use of sonication and size-exclusion highperformance liquid chromatography in the study of wheat flour proteins. I. Dissolution of total proteins in the absence of reducing agents. Cereal Chem. 67:150-161.
Singh, N. K., Donovan, G. R. and MacRitchie, F. 1990b. Use of sonication and size-exclusion high-performance liquid chromatography in the study of wheat flour proteins. II. Relative quantity of glutenin as a measure of breadmaking quality. Cereal Chem. 67:161-170.
372
HPLC ION-EXCHANGE CHROMATOGRAPHIC SEPARATIONS OF CEREAL AND LEGUME
PROTEINS
Ian L. Batey
CSIRO Division of Plant Industry Wheat Research Unit
North Ryde NSW 2113 Australia
INTRODUCTION
For many years, ion-exchange chromatography has been one step in methods for the preparative fractionation of cereal proteins. The advent of consistent ion-exchange media meant that protein separation could be effected reproducibly not only within a particular laboratory, but also in others. Despite this long history of use for the purification of cere~ storage proteins, high performance ion-exchange chromatography (IE-HPLC) has not become a common technique in cereal protein separations. The introduction of reversed-phase HPLC as a tool for protein chemists has left the development of ion-exchange methods for cereal proteins lagging far behind. It was only with the preparation of mono-disperse polymeric beads (Ugelstad et al., 1983) that high-performance ion-exchange liquid chromatography made a real leap forward. Columns made from these beads, with wide pore diameter and regular bead size, gave a far higher consistency of column performance in comparison with silica-based columns of the day ijanson, 1985). Methods utilizing these columns are frequently referred to as fast protein liquid chromatography, or FPLC (a registered trademark of
373
·1