six sigma dmaic improvement story - miami-dade · lean six sigma problem solving process 2 define...
TRANSCRIPT
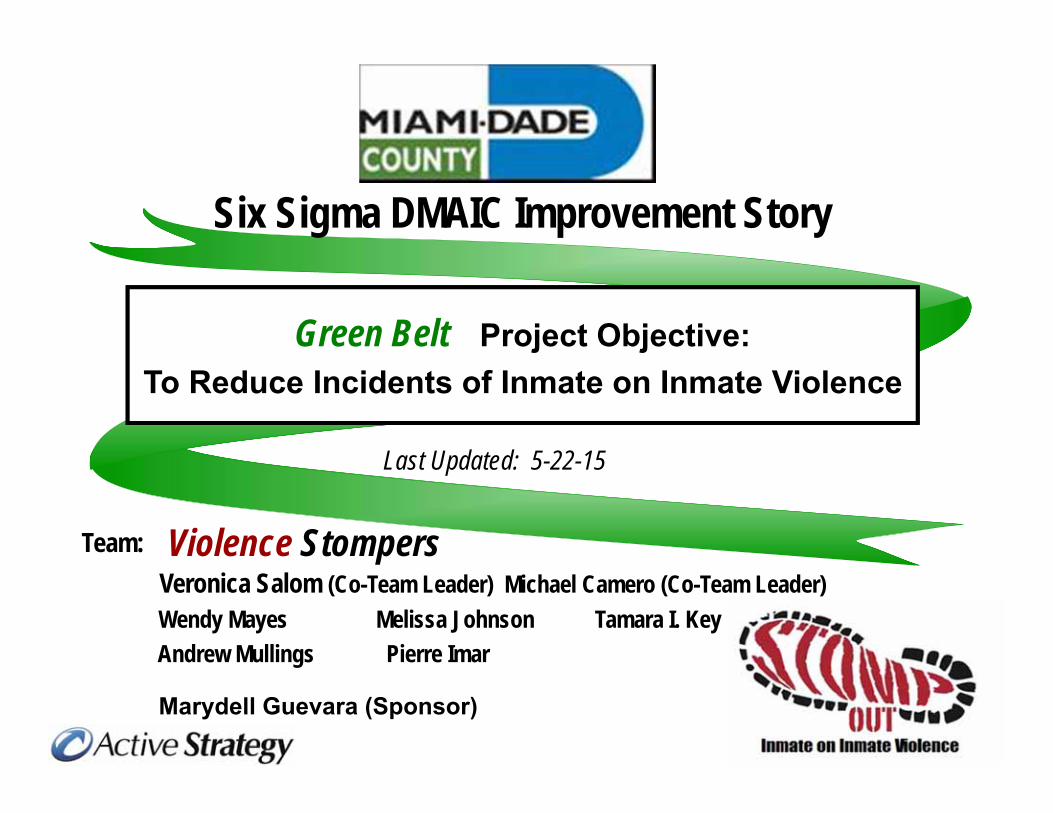
Last Updated: 5-22-15
Team: Veronica Salom (Co-Team Leader) Michael Camero (Co-Team Leader) Wendy Mayes Melissa Johnson Tamara I. KeyAndrew Mullings Pierre Imar
Green Belt Project Objective:To Reduce Incidents of Inmate on Inmate Violence
Six Sigma DMAIC Improvement Story
Marydell Guevara (Sponsor)
Violence Stompers
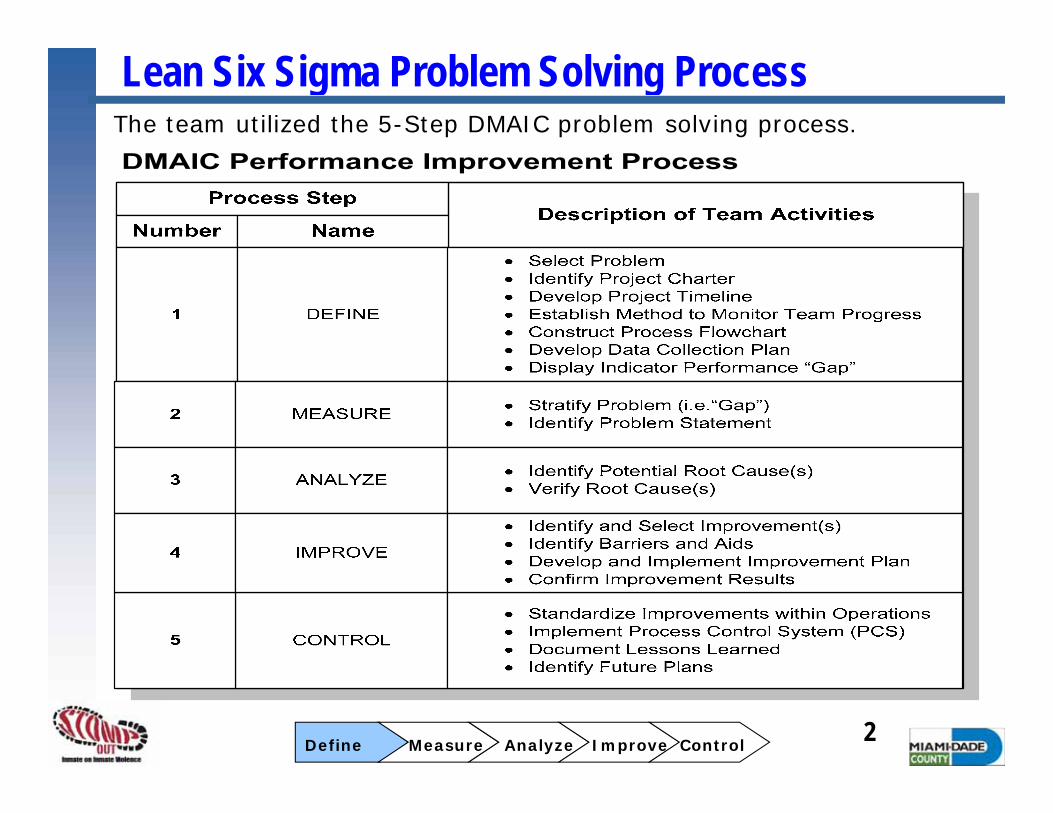
Lean Six Sigma Problem Solving Process
2Define Measure Analyze Improve Control
The team utilized the 5-Step DMAIC problem solving process.
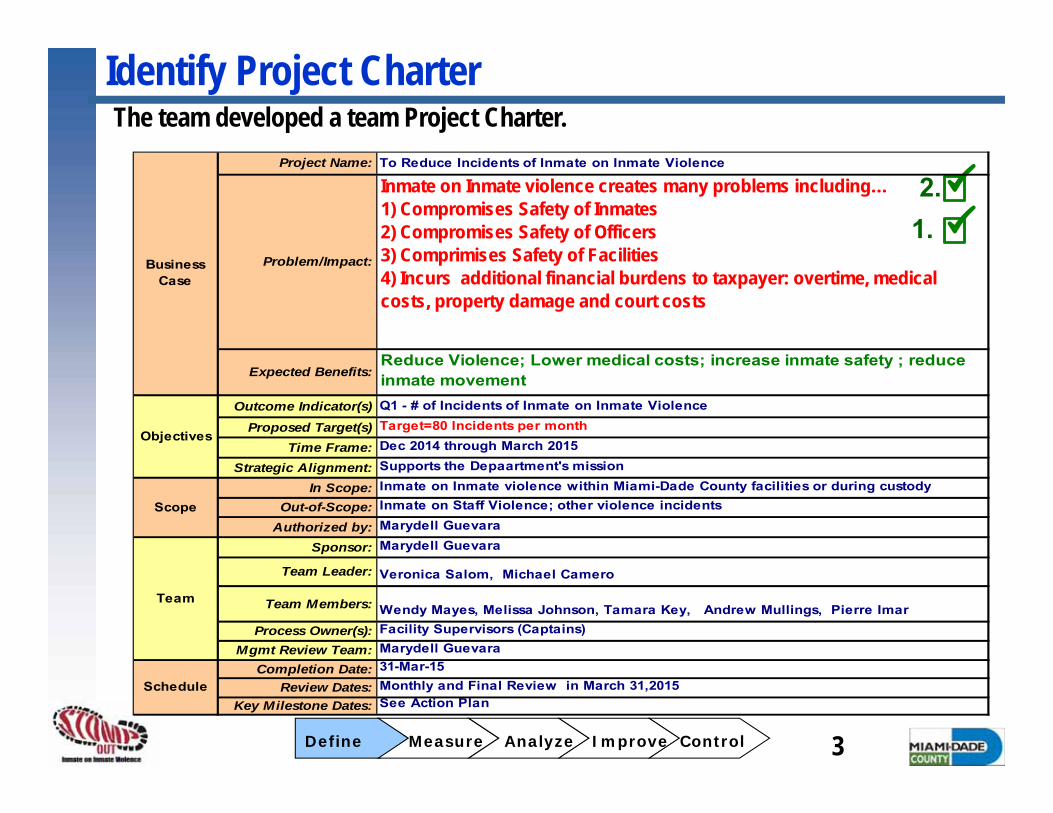
Identify Project CharterThe team developed a team Project Charter.
3Define Measure Analyze Improve Control
1.2.
Project Name: To Reduce Incidents of Inmate on Inmate Violence
Problem/Impact:
Inmate on Inmate violence creates many problems including…1) Compromises Safety of Inmates2) Compromises Safety of Officers3) Comprimises Safety of Facilities4) Incurs additional financial burdens to taxpayer: overtime, medical costs, property damage and court costs
Expected Benefits:Reduce Violence; Lower medical costs; increase inmate safety ; reduce inmate movement
Outcome Indicator(s) Q1 - # of Incidents of Inmate on Inmate Violence
Proposed Target(s) Target=80 Incidents per month
Time Frame: Dec 2014 through March 2015
Strategic Alignment: Supports the Depaartment's mission
In Scope: Inmate on Inmate violence within Miami-Dade County facilities or during custodyOut-of-Scope: Inmate on Staff Violence; other violence incidents
Authorized by: Marydell Guevara
Sponsor: Marydell Guevara
Team Leader: Veronica Salom, Michael Camero
Team Members: Wendy Mayes, Melissa Johnson, Tamara Key, Andrew Mullings, Pierre ImarProcess Owner(s): Facility Supervisors (Captains)
Mgmt Review Team: Marydell GuevaraCompletion Date: 31-Mar-15
Review Dates: Monthly and Final Review in March 31,2015Key Milestone Dates: See Action Plan
Team
Schedule
Business Case
Objectives
Scope

Develop Project Timeline PlanLegend:
= Actual= Proposed
The team developed a timeline plan to complete the Project.
Define Measure Analyze Improve Control
4.
4
Dec Jan Feb Mar Apr May
1. Define
2. Measure
3. Analyze
4. Improve
5. Control
WHAT: Complete DMAIC Story Project by March 31, 2015DMAIC Story
Process StepWHEN
2012
12/30/15
Completed 1-9-15
Completed 1/9/15
9/30/15
Completed 1/30/15
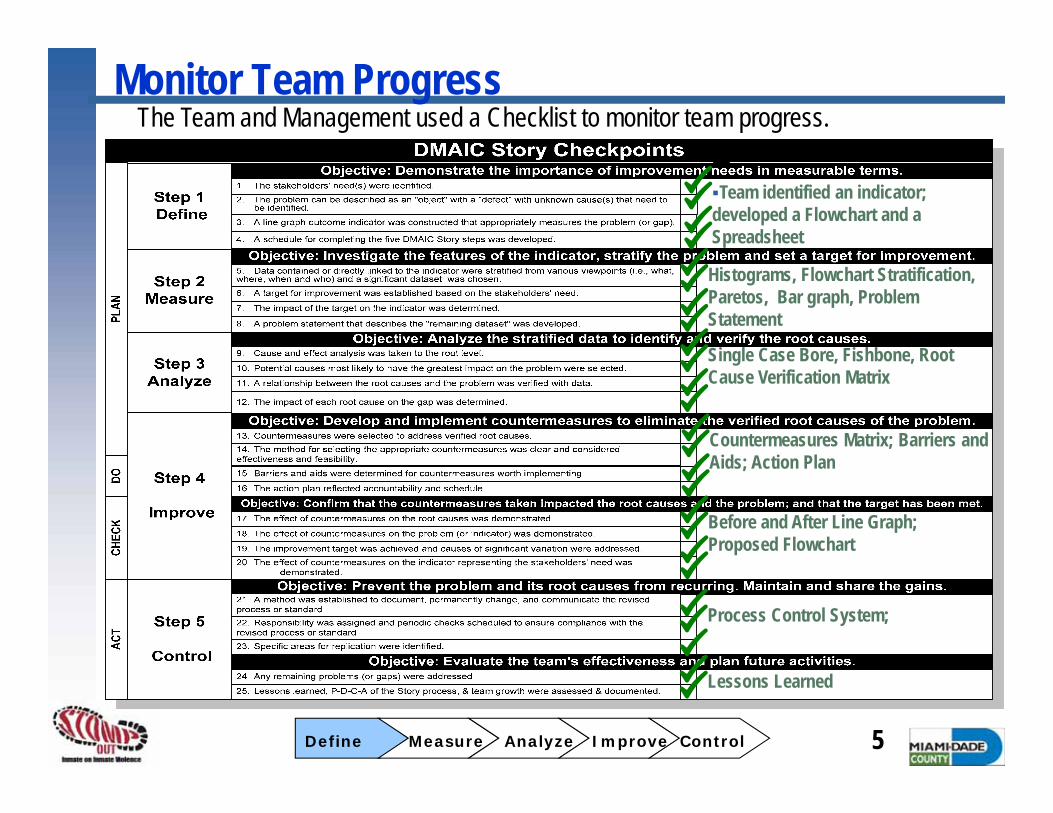
Monitor Team Progress
Team identified an indicator; developed a Flowchart and a Spreadsheet
The Team and Management used a Checklist to monitor team progress.
5Define Measure Analyze Improve Control
Histograms, Flowchart Stratification, Paretos, Bar graph, Problem Statement
Single Case Bore, Fishbone, Root Cause Verification Matrix
Countermeasures Matrix; Barriers and Aids; Action Plan
Before and After Line Graph; Proposed Flowchart
Process Control System;
Lessons Learned
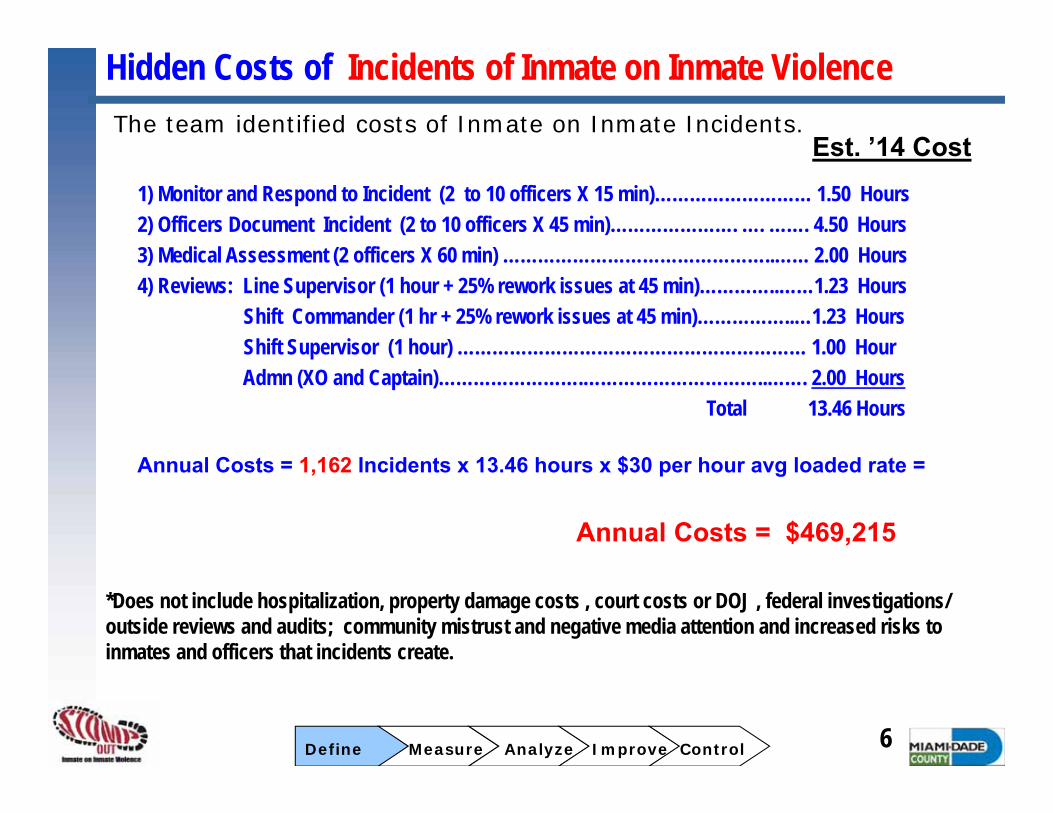
Hidden Costs of Incidents of Inmate on Inmate ViolenceThe team identified costs of Inmate on Inmate Incidents.
6Define Measure Analyze Improve Control
Est. ’14 Cost
Annual Costs = $469,215
*Does not include hospitalization, property damage costs , court costs or DOJ , federal investigations/ outside reviews and audits; community mistrust and negative media attention and increased risks to inmates and officers that incidents create.
1) Monitor and Respond to Incident (2 to 10 officers X 15 min)……………………… 1.50 Hours2) Officers Document Incident (2 to 10 officers X 45 min)…………………. …. ……. 4.50 Hours3) Medical Assessment (2 officers X 60 min) ………………………………………..…… 2.00 Hours4) Reviews: Line Supervisor (1 hour + 25% rework issues at 45 min)…………..……1.23 Hours
Shift Commander (1 hr + 25% rework issues at 45 min)……………..…1.23 HoursShift Supervisor (1 hour) …………………………………………………… 1.00 HourAdmn (XO and Captain)…………………….…………………………..……. 2.00 Hours
Total 13.46 Hours
Annual Costs = 1,162 Incidents x 13.46 hours x $30 per hour avg loaded rate =
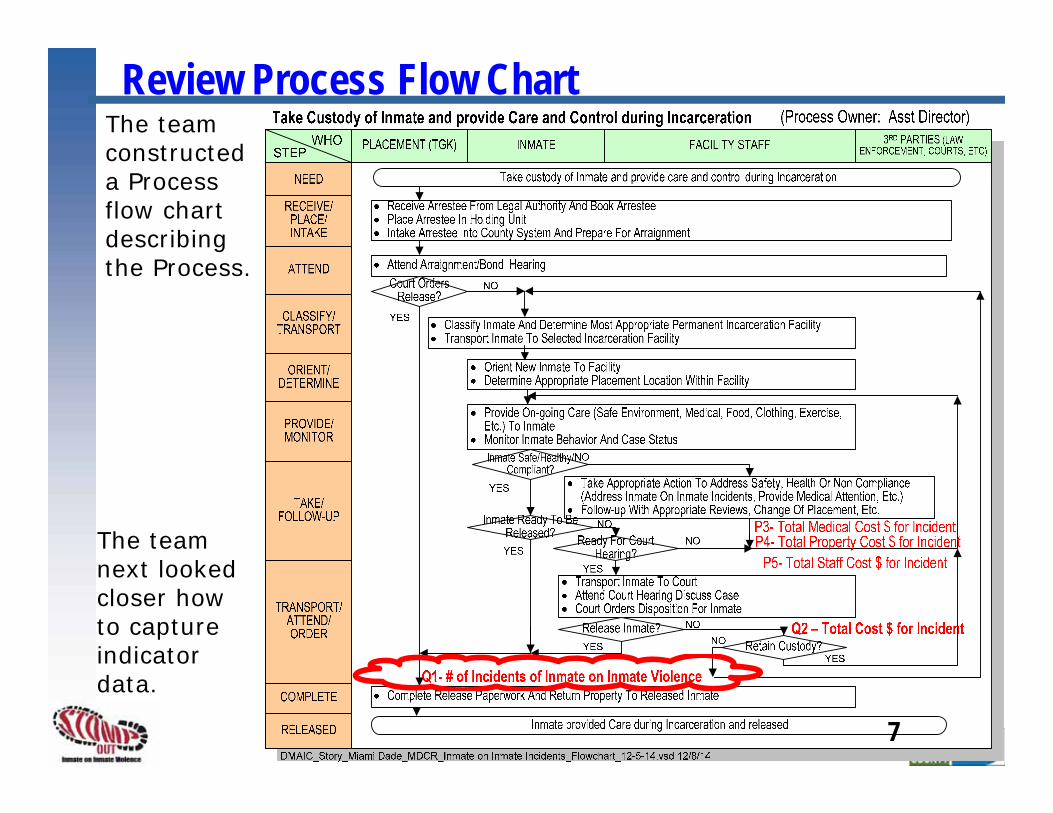
Review Process Flow Chart
The team next looked closer how to capture indicator data.
The team constructed a Process flow chart describing the Process.
7
U V W X Y Z AP AQ AS
Date Time Mi Hr DayAvg % Mo13.0 33.3 34.0 5.0 $700.00 $360.00 8.0 8.0 8.0 $600.00 $1,660.00
P1 P2 P3 P4 P5 Q21/14/14 8:00 AM 8 Tu Afternoon 1/20/14 4 6 $0 $150 2.0 2.0 2.0 $150.00 $300.002/3/14 9:30 AM 9 Mo Day 2/10/14 8 7 $200 $200 4.0 4.0 4.0 $300.00 $700.005/2/14 10:00 PM 22 Fr Midnite 5/4/14 90 2 $500 $10 2.0 2.0 2.0 $150.00 $660.00
STAFF Hours
Incident Cost Information
Date of Incident
Shift
Date Incident
File Closed
AB= U-T
# of Days to Close Incident
File
AD= Z-U
Total Costs for Incident
Property Costs In
cide
nt R
evie
w
AW= AT+AU+AV
OUTCOMES
AQ
Add
ress
Inci
dent
Medical Costs
Total
Inci
dent
Fol
low
-up
Staff Cost at $25 per
hour
AOAN
MILESTONE DATES Duration
# of Days
Shortest Length of Stay
Avg Days
BCBWHAT WHEN
B C D E F H I J K L M N O P R S T
Line
#
% F Avg %Y Avg %Y %Y %Y %Y % Inside33.3 22.0 33.3 2.0 33.3 33.3 33.3 33.3 33.3
1 Level 1 F 21 Y 1 Y Y Y Y Bartering No Injury Chair PTDC Outside BasketbaRecreation 1/10/142 Level 3 M 24 N 3 N N N N Girlfriend Doctor VisKnife TTC Inside Cafeteria Eating 1/26/143 Level 1 M 21 N 2 N N N N Insults HospitalizaFork MWDC Outside Cell Sleeping 2/1/14
W H O WHAT WHERE
# o
Inm
ates
Invo
lved
D E M O G R A P H I C S
Reason for Incident
Type of Weapon
used
Inmate(s) Classific-
ation
Any Inmate with 1st arrest
Involved?Inmate(s) Gender(s) Y
oung
est I
nmat
e A
ge
All
Inm
ates
Alre
ady
Sen
tenc
ed?
Rep
eat O
ffend
ers
invo
lved
?
Invo
lved
Min
ority
(ies)
All
inm
ates
had
Pre
viou
s C
onvi
ctio
ns?
Severity of
incident
Facilty Inmates Reside
atInside/
Outside?
Earliest Date of
Inmate(s) Intake into
Facility
Inmate Activity at
Time of Incident
Location of
incident
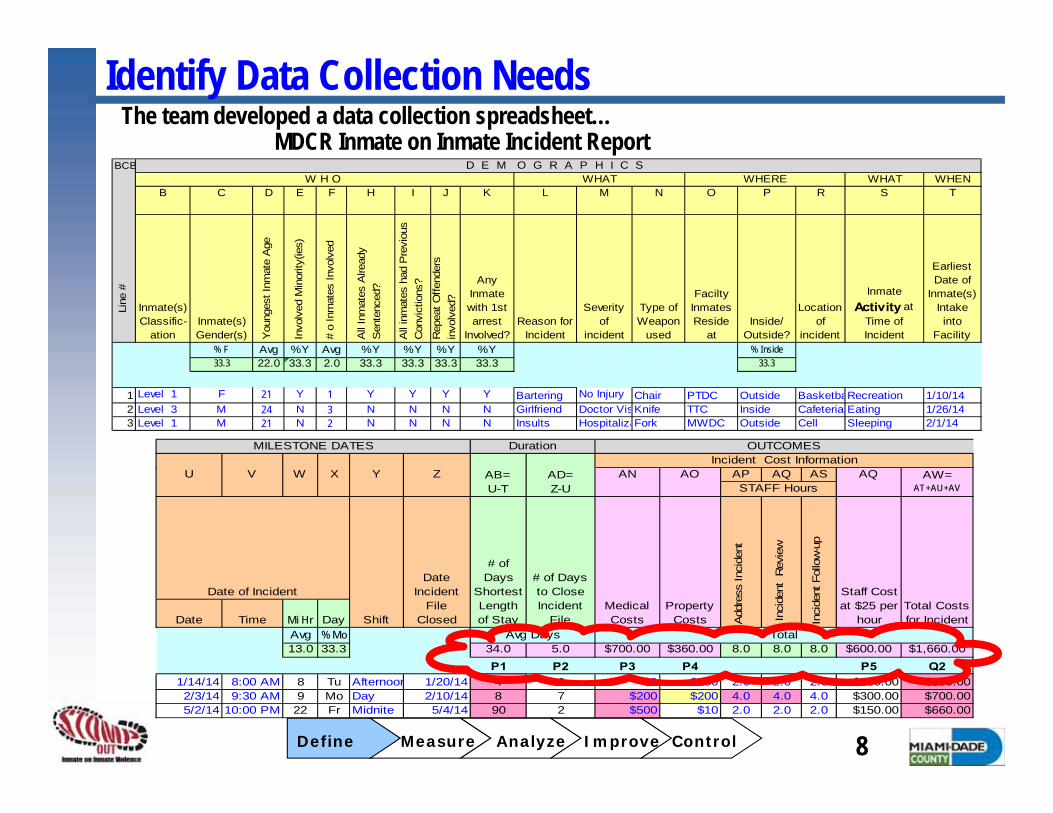
Identify Data Collection NeedsThe team developed a data collection spreadsheet…
8Define Measure Analyze Improve Control
MDCR Inmate on Inmate Incident Report

0
20
40
60
80
100
120
140
Jan
Feb
Mar
Apr
May
Jun
Jul
Aug
Sep
Oct
Nov
Dec
Month
Perc
enta
ge
TargetAverageActual
Review Selected Indicator
The team next looked closer at the gap.
Q1- # of Incidents of Inmate on Inmate Violence
The team collected Q1 indicator data and reviewed performance trends:
9
Target = 80
Define Measure Analyze Improve Control
3.
Average=96.9
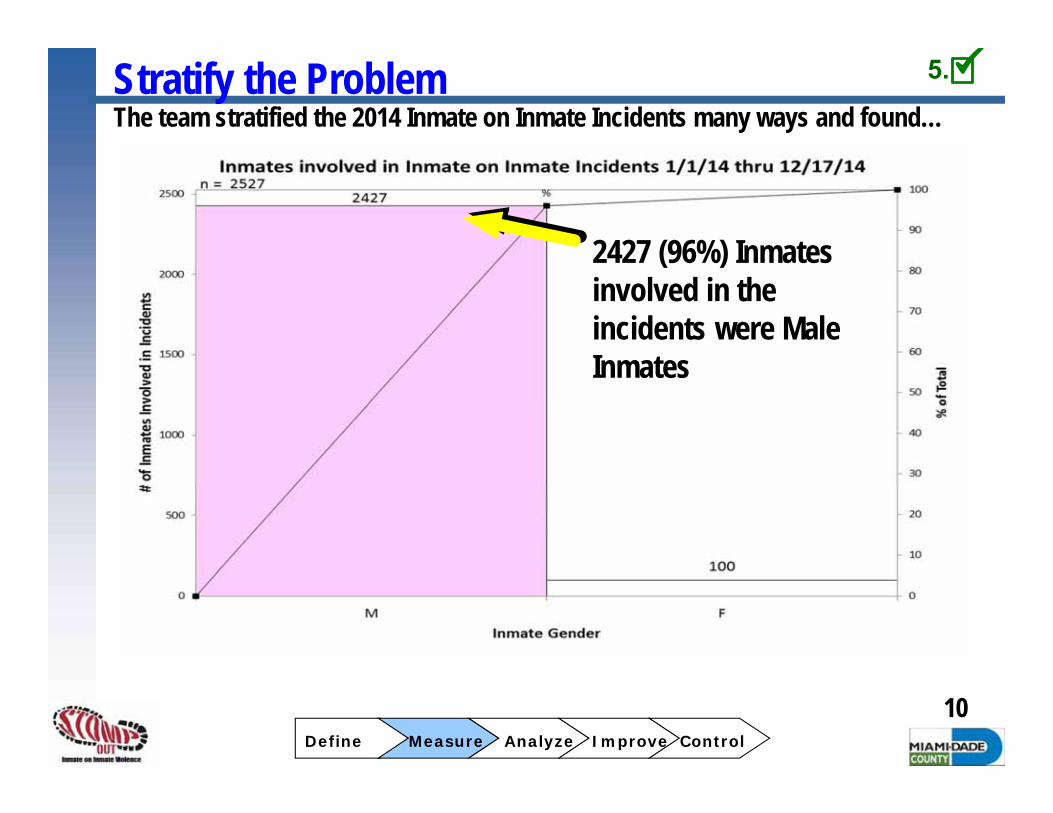
Stratify the Problem
10
2427 (96%) Inmates involved in the incidents were Male Inmates
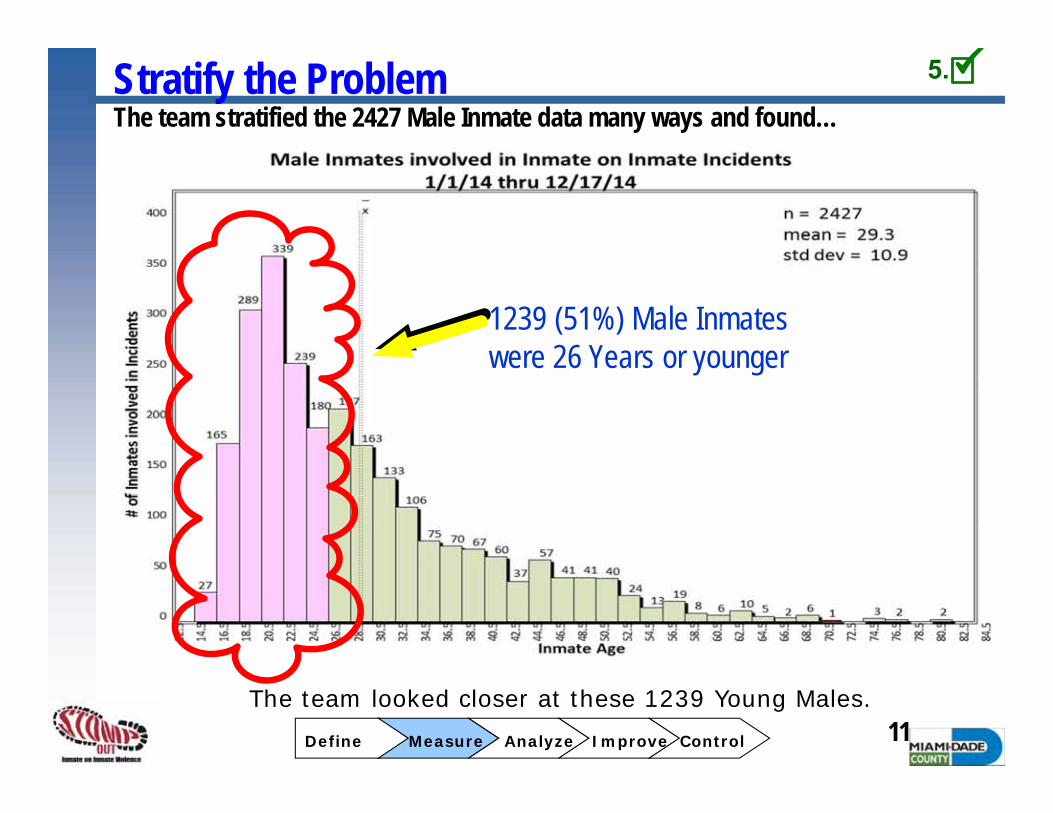
The team stratified the 2014 Inmate on Inmate Incidents many ways and found…
Define Measure Analyze Improve Control
5.
Stratify the Problem
11The team looked closer at these 1239 Young Males.
1239 (51%) Male Inmates were 26 Years or younger
The team stratified the 2427 Male Inmate data many ways and found…
Define Measure Analyze Improve Control
5.
Stratify the Problem
12
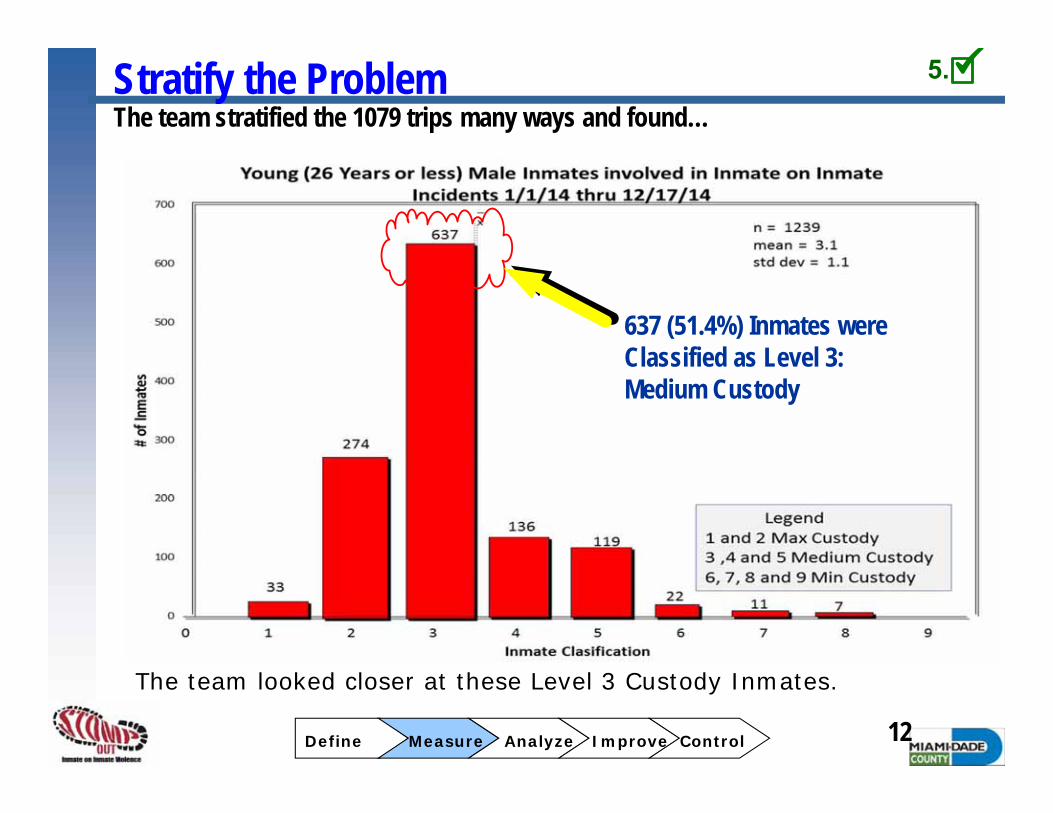
The team looked closer at these Level 3 Custody Inmates.
637 (51.4%) Inmates were Classified as Level 3: Medium Custody
The team stratified the 1079 trips many ways and found…
Define Measure Analyze Improve Control
5.
Stratify the Problem
13
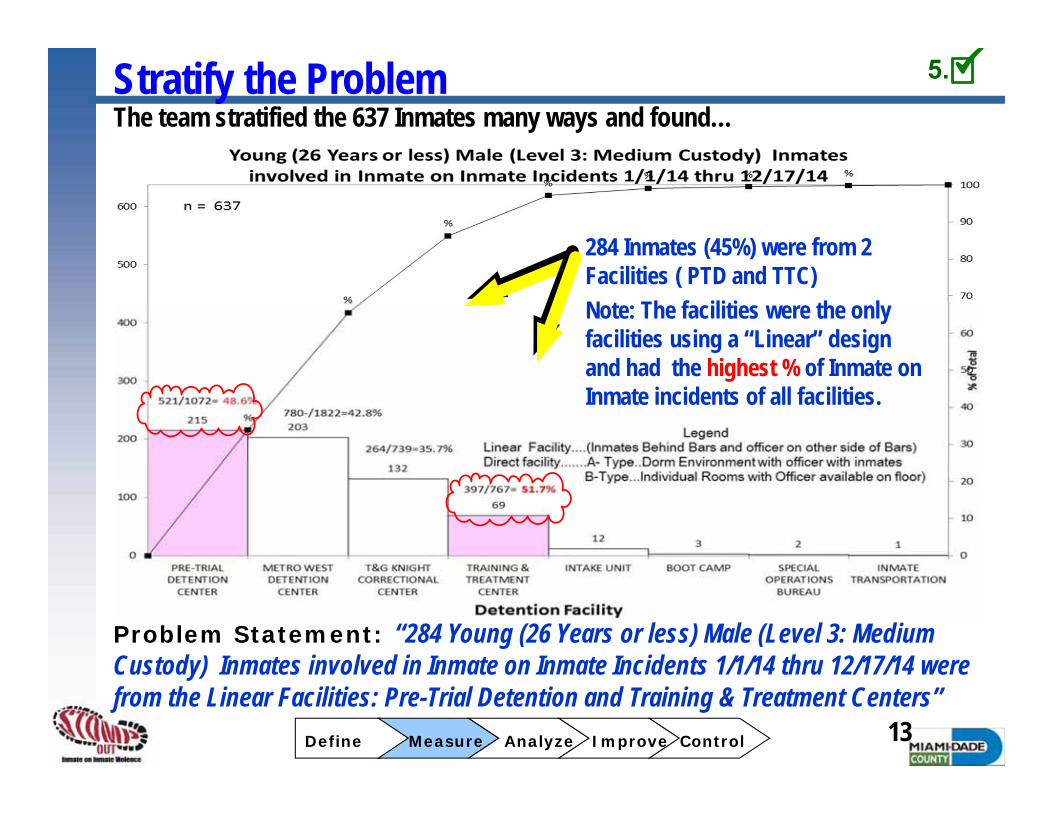
284 Inmates (45%) were from 2 Facilities ( PTD and TTC)Note: The facilities were the only facilities using a “Linear” design and had the highest % of Inmate on Inmate incidents of all facilities.
The team stratified the 637 Inmates many ways and found…
Define Measure Analyze Improve Control
5.
Problem Statement: “284 Young (26 Years or less) Male (Level 3: Medium Custody) Inmates involved in Inmate on Inmate Incidents 1/1/14 thru 12/17/14 were from the Linear Facilities: Pre-Trial Detention and Training & Treatment Centers”
Single Case Bore Analysis
Reasons or Factors (That possibly contributed to the
Inmate on Inmate incident)
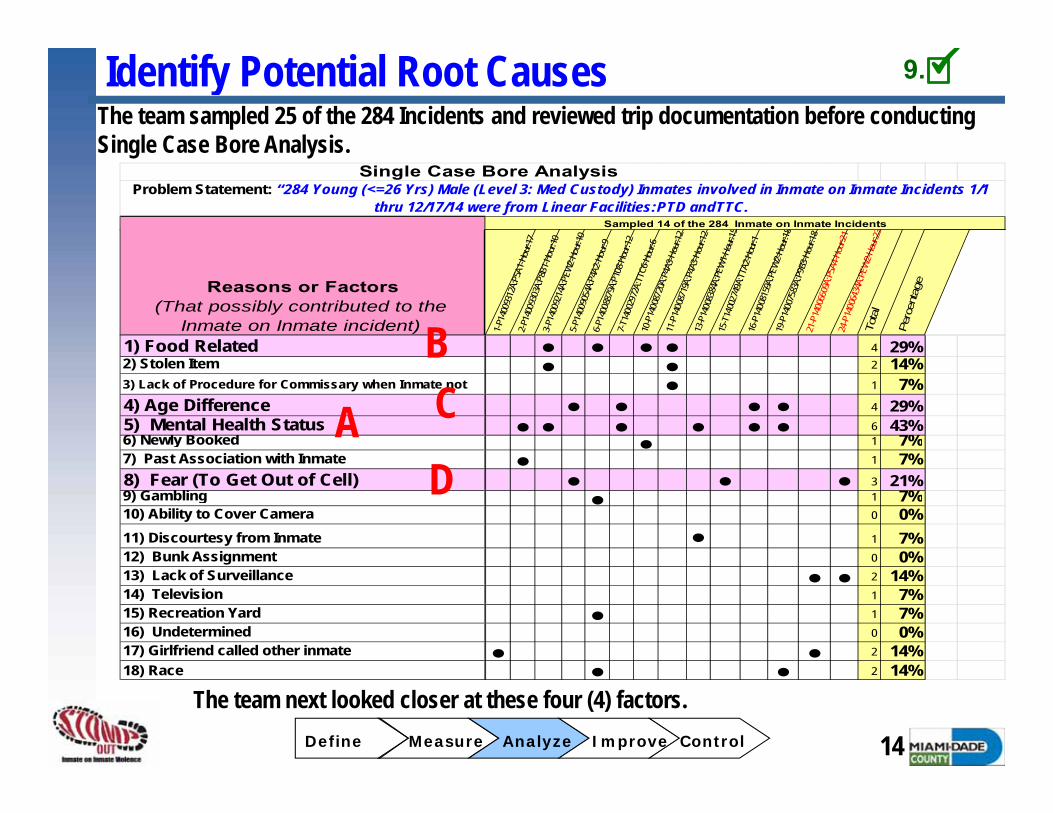
Sampled 14 of the 284 Inmate on Inmate Incidents
Problem Statement: “284 Young (<=26 Yrs) Male (Level 3: Med Custody) Inmates involved in Inmate on Inmate Incidents 1/1 thru 12/17/14 were from Linear Facilities:PTD andTTC.
1-P1
4009
312A
:P5A
1-Ho
ur:17
2-P1
4009
303A
:P8B
1-Ho
ur:10
3-P1
4009
214A
:PEW
2-Ho
ur:10
5-P1
4009
054A
:P4A
2-Ho
ur:9
6-P1
4008
879A
:P10
8-Hou
r:12
7-T1
4002
972A
:TTC
6-Ho
ur:6
10-P
1400
8720
A:P4
A3-H
our:1
211
-P14
0087
19A:
P4A3
-Hou
r:12
13-P
1400
8384
A:PE
W1-H
our:1
515
-T14
0027
49A:
TTA2
-Hou
r:116
-P14
0081
59A:
PEW
2-Hou
r:18
19-P
1400
7583
A:P9
B3-H
our:1
821
-P14
0066
09A:
P5A4
-Hou
r:21
24-P
1400
6434
A:PE
W2-H
our:2
3To
tal
Perc
enta
geReasons or Factors (That possibly contributed to the
Inmate on Inmate incident)1) Food Related ● ● ● ● 4 29%2) Stolen Item ● ● 2 14%3) Lack of Procedure for Commissary when Inmate not ● 1 7%4) Age Difference ● ● ● ● 4 29%5) Mental Health Status ● ● ● ● ● ● 6 43%6) Newly Booked ● 1 7%7) Past Association with Inmate ● 1 7%8) Fear (To Get Out of Cell) ● ● ● 3 21%9) Gambling ● 1 7%10) Ability to Cover Camera 0 0%11) Discourtesy from Inmate ● 1 7%12) Bunk Assignment 0 0%13) Lack of Surveillance ● ● 2 14%14) Television 1 7%15) Recreation Yard ● 1 7%16) Undetermined 0 0%17) Girlfriend called other inmate ● ● 2 14%18) Race ● ● 2 14%
Identify Potential Root CausesThe team sampled 25 of the 284 Incidents and reviewed trip documentation before conducting Single Case Bore Analysis.
14
The team next looked closer at these four (4) factors.Define Measure Analyze Improve Control
9.
A
BC
D
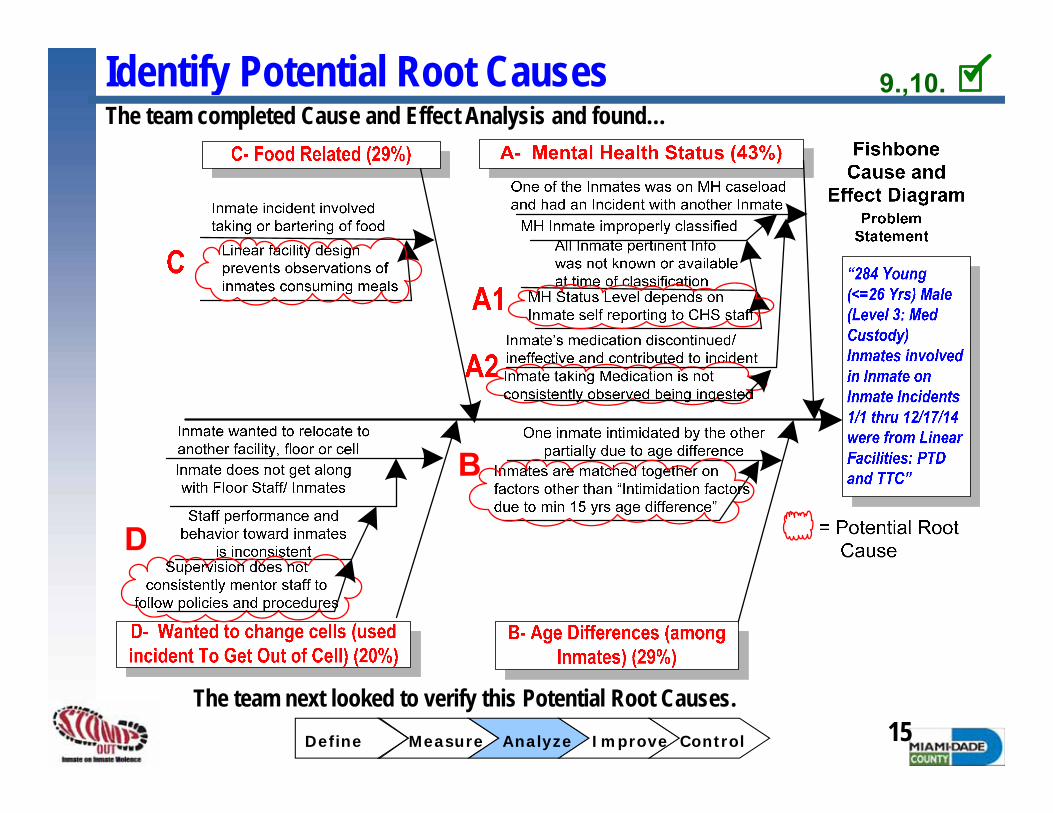
Identify Potential Root CausesThe team completed Cause and Effect Analysis and found…
The team next looked to verify this Potential Root Causes.15Define Measure Analyze Improve Control
9.,10.

A1 MH Status Level depends on Inmate self reporting to CHS staff
Root Cause
A2 Inmate taking Medication is not consistently observed being ingested
Root Cause
B Inmates are matched together on factors other than “Intimidation factors due to min 15 yrs age difference”
Root Cause
C Linear facility design prevents observations of inmates consuming meals
Root Cause
D Supervision does not consistently mentor staff to follow policies and procedures
Root Cause
Root Cause or Symptom
Team reviewed written procedures and policies and training materials around collecting information for MH Status inmates and discussed with CHS and found.
Root Cause Verification Matrix
Potential Root Cause How Verified?
Reviewed procedures and discuss with staff and found.
Reviewed procedures and discuss with staff and found.
Reviewed procedures and discuss with staff and found we do not consistently consider age differences.
Reviewed procedures and discuss with staff and found.
Verify Root CausesThe team collected data to verify the root causes and found….
16…all four (4) were validated as root causes.
Define Measure Analyze Improve Control
11.,12.
Effe
ctiv
enes
sFe
asib
ility O
vera
ll
Take
A
ctio
n?
Yes/
No
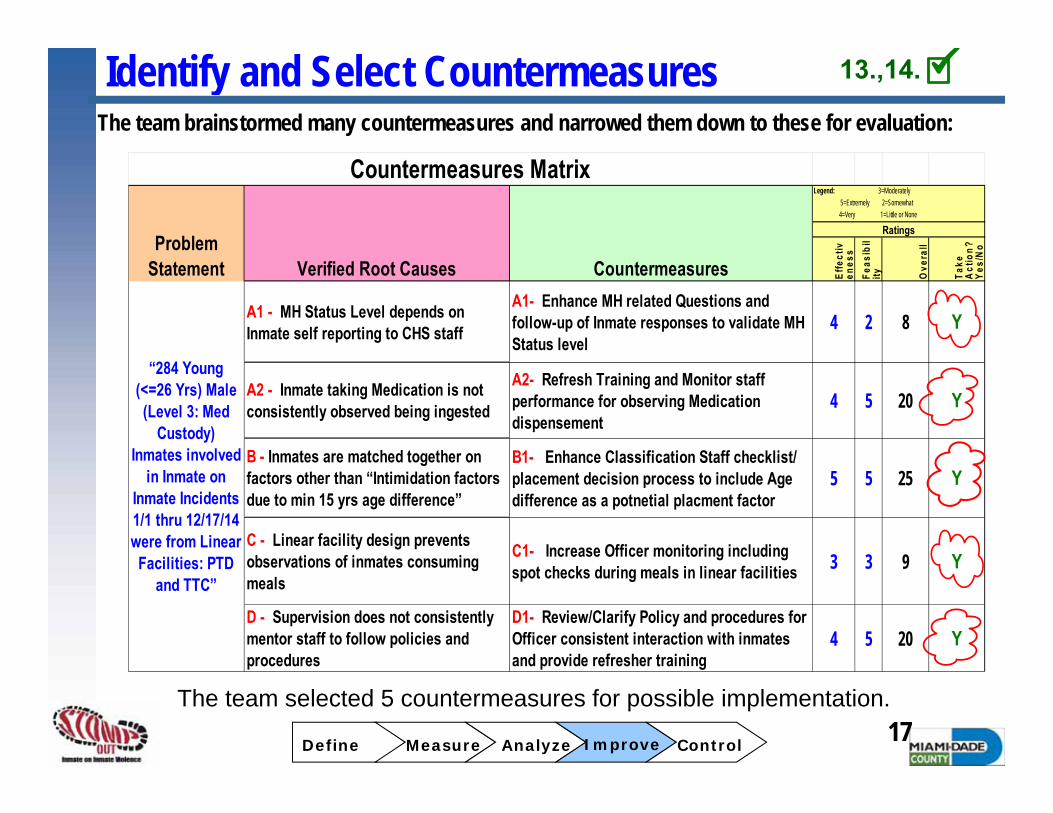
A1 - MH Status Level depends on Inmate self reporting to CHS staff
A1- Enhance MH related Questions and follow-up of Inmate responses to validate MH Status level
4 2 8 Y
A2- Refresh Training and Monitor staff performance for observing Medication dispensement
4 5 20 Y
B1- Enhance Classification Staff checklist/ placement decision process to include Age difference as a potnetial placment factor
5 5 25 Y
C - Linear facility design prevents observations of inmates consuming meals
C1- Increase Officer monitoring including spot checks during meals in linear facilities 3 3 9 Y
D - Supervision does not consistently mentor staff to follow policies and procedures
D1- Review/Clarify Policy and procedures for Officer consistent interaction with inmates and provide refresher training
4 5 20 Y
Legend: 3=Moderately 5=Extremely 2=Somewhat 4=Very 1=Little or None
Ratings
“284 Young (<=26 Yrs) Male (Level 3: Med
Custody) Inmates involved
in Inmate on Inmate Incidents 1/1 thru 12/17/14 were from Linear
Facilities: PTD and TTC”
Countermeasures Matrix
Problem Statement Verified Root Causes Countermeasures
A2 - Inmate taking Medication is not consistently observed being ingested
B - Inmates are matched together on factors other than “Intimidation factors due to min 15 yrs age difference”
Identify and Select Countermeasures
The team selected 5 countermeasures for possible implementation.
The team brainstormed many countermeasures and narrowed them down to these for evaluation:
17Define Measure Analyze Improve Control
13.,14.
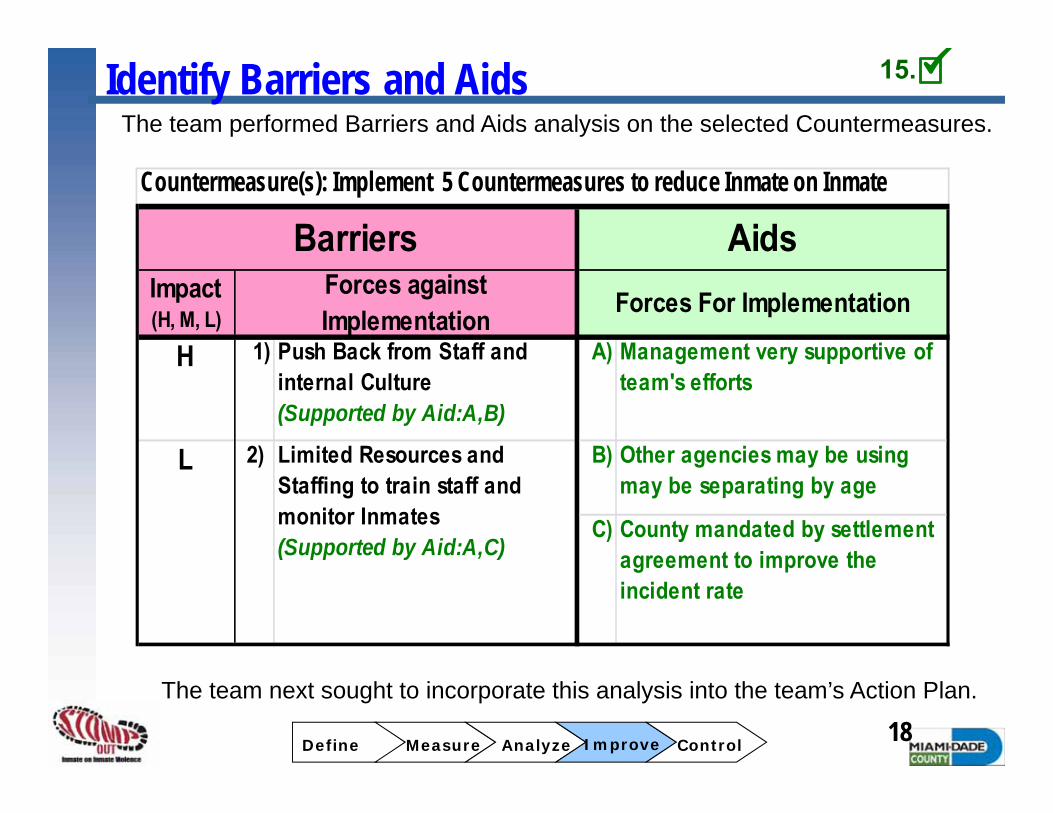
Identify Barriers and Aids
The team next sought to incorporate this analysis into the team’s Action Plan.
The team performed Barriers and Aids analysis on the selected Countermeasures.
18Define Measure Analyze Improve Control
15.
Impact (H, M, L)
H 1) Push Back from Staff and internal Culture (Supported by Aid:A,B)
A) Management very supportive of team's efforts
B) Other agencies may be using may be separating by age
C) County mandated by settlement agreement to improve the incident rate
Limited Resources and Staffing to train staff and monitor Inmates(Supported by Aid:A,C)
2)L
Countermeasure(s): Implement 5 Countermeasures to reduce Inmate on Inmate
BarriersForces against Implementation
AidsForces For Implementation
Develop and Implement Action PlanLegend:
= Actual= Proposed
The team implemented an Action Plan for the team’s Countermeasures.
19Define Measure Analyze Improve Control
16.
Dec Jan Feb Mar April May Jun Jul Aug
1. Develop Countermeasures:
A1- Enhance MH related Questions and follow-up of Inmate responses to validate MH Status level
A2- Refresh Training and Monitor staff performance for observing Medication dispensement
Melissa
B1- Enhance Classification Staff checklist/ placement decision process to include Age difference as a potnetial placment factor
Tamara/Classification Staff
C1- Increase Officer monitoring including spot checks during meals in linear facilities
Melissa
D1- Review/Clarify Policy and procedures for Officer consistent interaction with inmates and provide refresher training
Wendy
2. Secure Management Approval of Countermeasures (share benefits and cost savings)
Team
3. Communicate/Train Staff in Countermeasures and related policies/procedures (share Benefits & cost savings and mandate)
Team
4. Implement Countermeasures and Pilot Team
5. Review Pilot and determine Benefits and adjust as necessary and present results to management
Team
6. Establish On-going responsibilities and standardize countermeasures into operations
Team
Veronica/CHS staff
WHAT: Implement 5 Countermeasures to reduce Inmate on InmaIncidents
HOWWHO
WHEN2015
2/28/15
08/30/2015
On-going
2/28/15
2/28/15
5/28/15
9/30/
2/28/15
2/28/15
08/30/2015
0
20
40
60
80
100
120
140
Jan
Feb
Mar
Apr
May
Jun
Jul
Aug
Sep
Oct
Nov
Dec
Jan
Feb
Mar
Apr
May
Jun
Jul
Month
Perc
enta
ge
TargetAverageActual
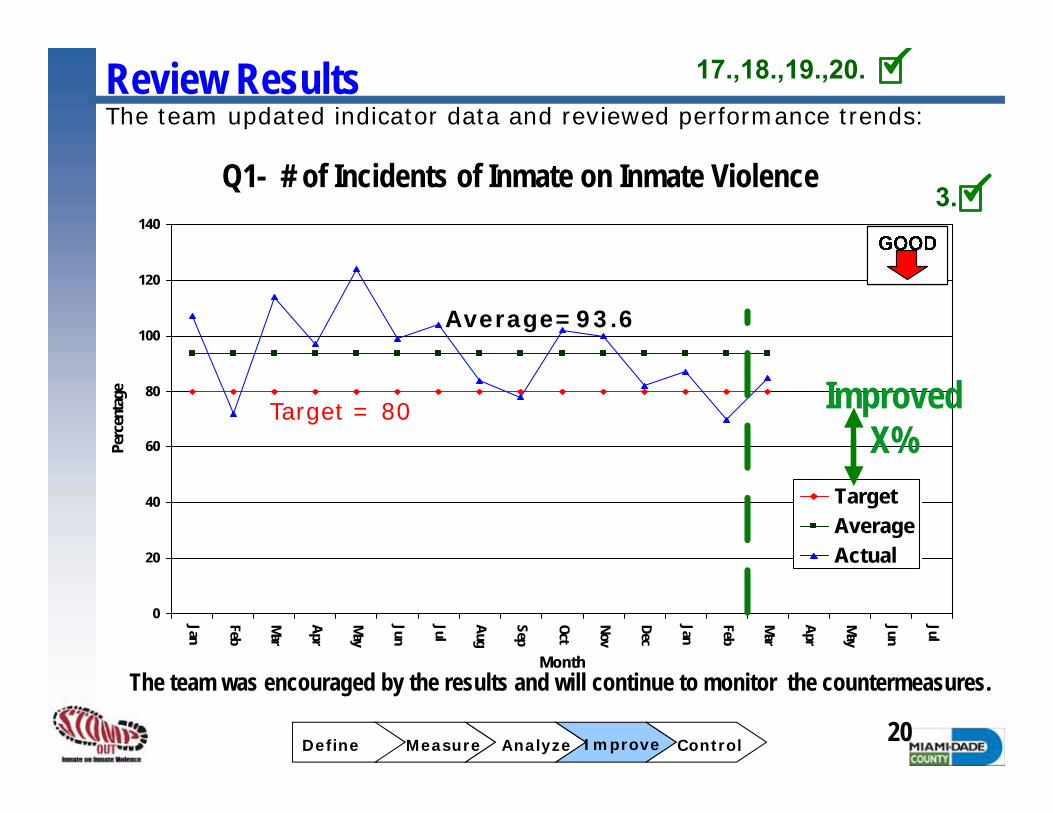
Q1- # of Incidents of Inmate on Inmate Violence
Target = 80
3.
Average=93.6
Review Results
The team was encouraged by the results and will continue to monitor the countermeasures.
The team updated indicator data and reviewed performance trends:
20
Improved X%
Define Measure Analyze Improve Control
17.,18.,19.,20.
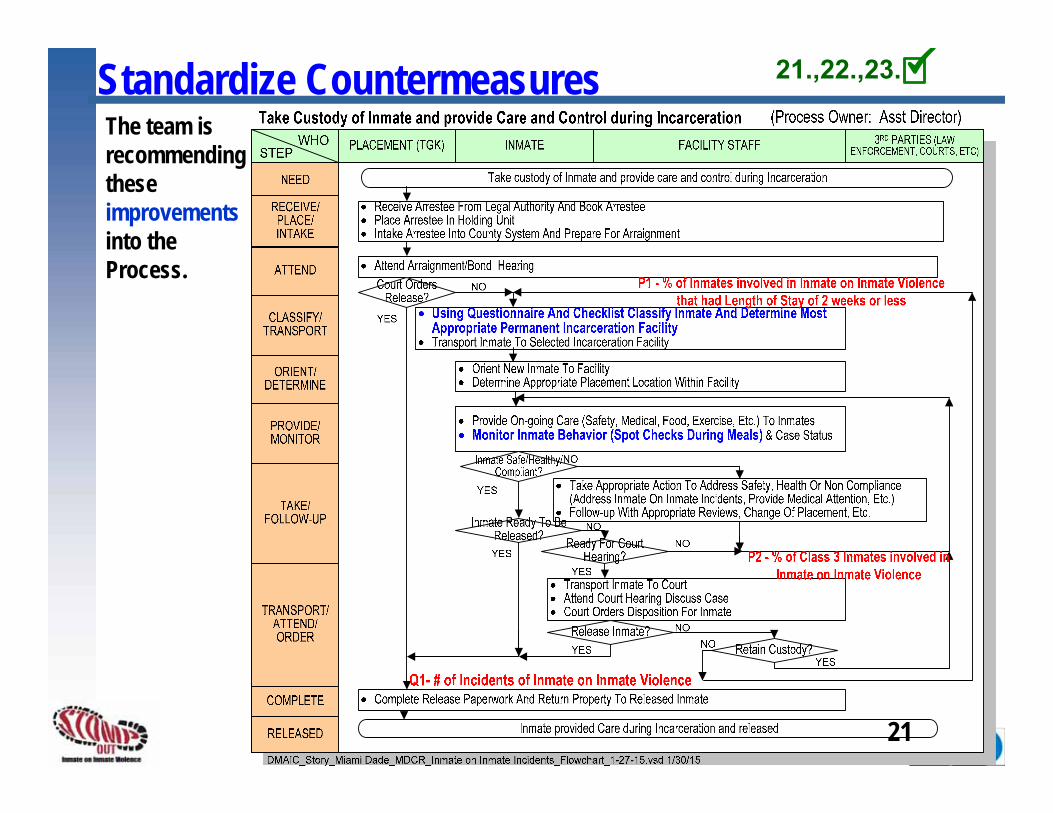
Standardize CountermeasuresThe team is recommending these improvements into the Process.
21
21.,22.,23.

Implement Process Control SystemThe team developed a Process Control System to better monitor the ongoing process.
The team looked ahead to the future.22Define Measure Analyze Improve Control
21.,22.,23.
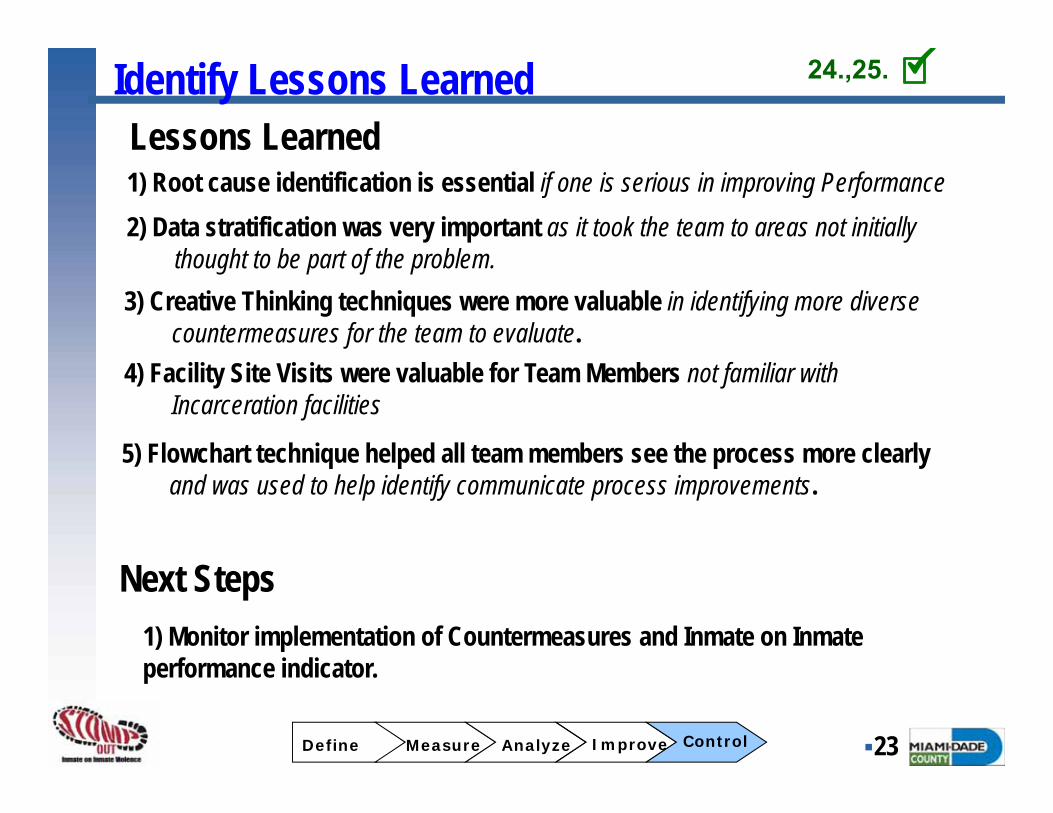
Identify Lessons LearnedLessons Learned
2) Data stratification was very important as it took the team to areas not initially thought to be part of the problem.
23
Next Steps1) Monitor implementation of Countermeasures and Inmate on Inmate performance indicator.
1) Root cause identification is essential if one is serious in improving Performance
Define Measure Analyze Improve Control
24.,25.
3) Creative Thinking techniques were more valuable in identifying more diverse countermeasures for the team to evaluate.
4) Facility Site Visits were valuable for Team Members not familiar with Incarceration facilities
5) Flowchart technique helped all team members see the process more clearly and was used to help identify communicate process improvements.
RECOMMENDED
COUNTERMEASURES
A1 – Enhance Mental Health (MH) related Questions and follow-up on inmate responses to validate MH Status LevelMeasures had already been incorporated to capture MH status via numerous venuesDuring intake screening, inmates who are identified by CHS staff with MH issues are fast tracked for immediate full assessmentInmates may self report MH issues for appropriate treatmentRedistribute policy for MDCR and CHS staff as a reminder of need to observe medication ingestionMDCR system now reflects MH status from CHS databaseRecords from outside medical providers are requested when MH status is disclosedAncillary reports (Relocation Form and Health Care Incident Addendum) include MH status

A1 – Enhance MH related Questions and follow-up on inmate responses to validate MH Status Level
A1 – Enhance MH related Questions and follow-up on inmate responses to validate MH Status Level
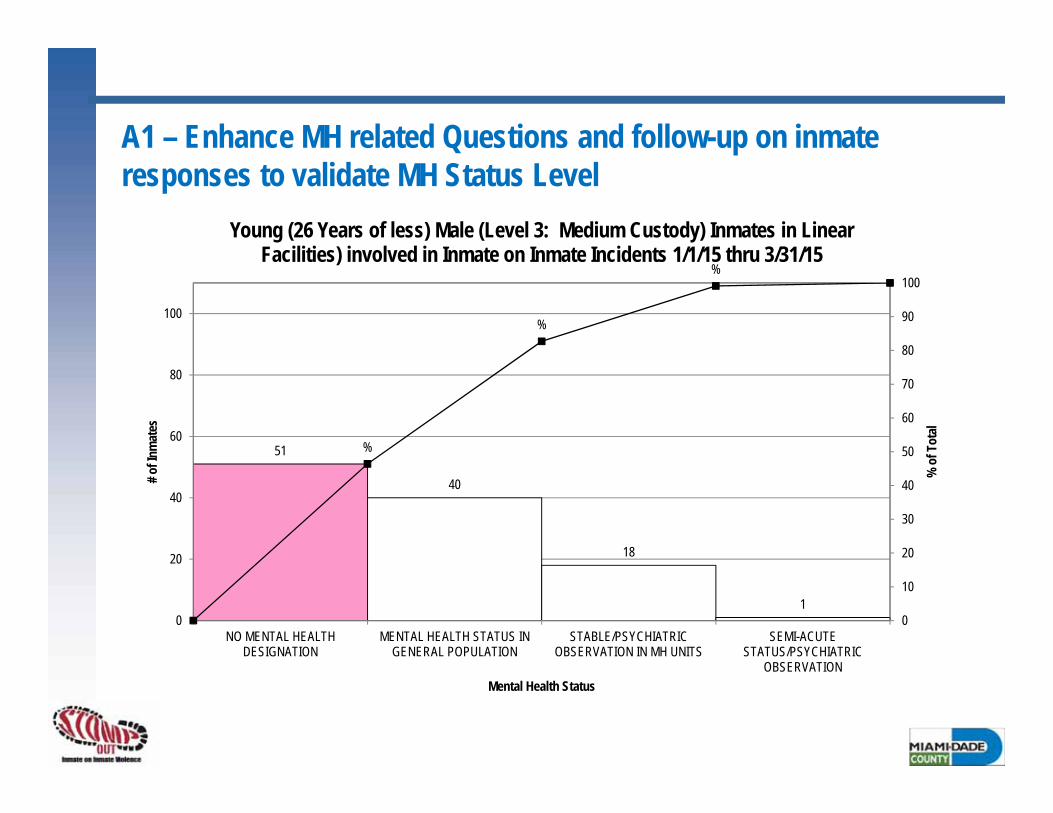
51
40
18
1
%
%
%
0
10
20
30
40
50
60
70
80
90
100
0
20
40
60
80
100
NO MENTAL HEALTHDESIGNATION
MENTAL HEALTH STATUS INGENERAL POPULATION
STABLE/PSYCHIATRICOBSERVATION IN MH UNITS
SEMI-ACUTESTATUS/PSYCHIATRIC
OBSERVATION
% o
f Tot
al
# of I
nmat
es
Mental Health Status
Young (26 Years of less) Male (Level 3: Medium Custody) Inmates in Linear Facilities) involved in Inmate on Inmate Incidents 1/1/15 thru 3/31/15
A2 – Refresh training and monitor staff performance for observing medication dispensement
Redistribute policy for MDCR and CHS staff as a reminder of need to observe medication ingestionConduct CHS and MDCR staff in-service training regarding medication dispensingEnhance supervisory spot checks to ensure compliance with medication Monitor outcome of facility shakedowns and inspections to determine if medication is being properly dispensed

B1 – Enhance classification staff screening tool regarding housing to include age difference as a potential placement factor
Request that the new offender management system capture inmate age by housing unitUtilize findings to ensure a balanced age group within housing unitsTrain staff to identify potential issues related to age differences of inmates housed togetherTrain inmates to understand differences regarding generational gaps
C1 – Increase officer monitoring including spot checks during meals in linear facilities
Develop a policy regarding the feeding of inmates specific to linear facilitiesConduct a staggered feeding pilot project to better monitor the feeding processDirect staff to conduct heightened surveillance during feeding processEvaluate alternative feed practices (i.e., direct observation during feeding, centralized feeding location in future facilities)Limit inmate workers handling of meal assembly and distribution
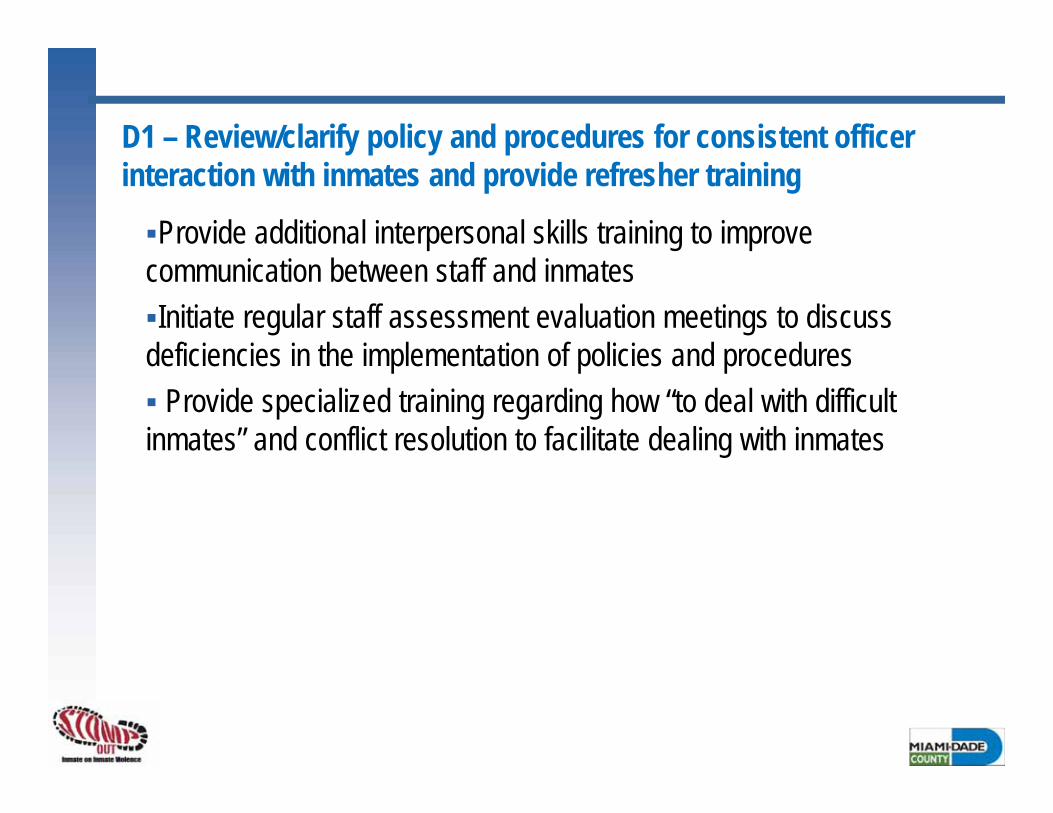
D1 – Review/clarify policy and procedures for consistent officer interaction with inmates and provide refresher training
Provide additional interpersonal skills training to improve communication between staff and inmatesInitiate regular staff assessment evaluation meetings to discuss deficiencies in the implementation of policies and procedures Provide specialized training regarding how “to deal with difficult inmates” and conflict resolution to facilitate dealing with inmates